Embed Size (px)
Citation preview
1
IDENTIFYING OPTIMAL CONCRETE STRENGTH FOR
VARYING LEVELS OF BLAST LOADING
Tarek H. Kewaisy
Principal Associate | Louis Berger
1250 23rd St., NW, Washington, DC, 20037, USA
ABSTRACT
This paper reports on the findings of a comprehensive study that involved various numerical
simulations of blast-loaded Reinforced Concrete (RC) slabs of different strength classes. The study
investigated response characteristics associated with the application of bilinear shock loading of
varying intensity and energy levels to one-way RC slabs of various material strengths and
boundary conditions. Three strength classes of RC concrete were investigated; Normal Strength
(5,000 psi concrete and 60,000 psi rebar), Medium Strength (10,000 psi concrete and 75,000 psi
rebar), and High Strength (15,000 psi concrete and 100,000 psi rebar). Nine shock loading profiles
were considered by pairing various levels of peak pressure (30 psi for Low, 45 psi for Medium, 60
psi for High) and duration (10 ms for Short, 20 ms for Medium, 40 ms for Long). Two numerical
techniques were implemented to simulate strain-rate effects, materials nonlinearities, and damage
patterns and extents typically encountered in blast applications: Single Degree Of Freedom- SDOF
using RCBlast program and Finite Element Analysis- FEA using LS-DYNA Software. Primary
simulation parameters for various RC slab configurations were calibrated using response
measurements obtained from testing. The blast testing program was funded by the National
Science Foundation (NSF), administered by the University of Missouri – Kansas City (UMKC)
and completed at the Blast Loading Simulator (BLS) of the Engineering Research and
Development Center (ERDC) at Vicksburg, MS. The effects of considering different strength
classes of concrete and reinforcement on the blast response of RC slabs were evaluated. Valuable
insights were obtained, and useful conclusions were drawn regarding the appropriateness of use of
various material strengths to achieve optimized and enhanced performance of RC slabs subjected
to varying levels of blast loading.
INTRODUCTION
In recent years, the design of blast-resistant structures has expanded beyond the boundaries of
military and industrial applications into civilian realms including infrastructure, government,
public and private buildings. This was primarily driven by the need to protect these assets against
the ever growing threat of terrorist attacks using high explosives as the weapon of choice to impart
the maximum damage to these prominent targets. The economic impacts of considering such a
severe threat combined with the technical engineering challenges to prevent civilian facilities from
becoming fortification-like structures have generated strong incentives and considerable
motivation among business owners and construction professionals to minimize the impact of blast-
resistant design requirements through optimization. Reinforced Concrete (RC) has been the
primary construction material for blast hardening for decades, therefore understanding its blast
behavior and performance through testing and simulation techniques has been identified as the
most important aspect of an optimum blast-resistant design. The accelerated advancements in
computing have made numerical simulation techniques (both simplified and advanced) the
preferred approaches of: modeling explosives detonation phenomena, identifying blast effects, and

2
predicting structural behavior to highly-impulsive loads. Due to its economy and time-saving
merits, adopting numerical simulation can efficiently provide reliable information about structural
responses to various blast loading conditions and hence can be relied upon to guide the
optimization process of blast-resistant design of RC structures.
This paper is intended to provide guidance about the optimum selection of RC strength for a
specific blast load conditions. The primary structural elements for the study are One-way RC slabs
with both simple and fixed support end conditions. Three strength classes of RC concrete
incorporating available construction materials were investigated; Normal Strength, Medium
Strength and High Strength. Nine bilinear shock loading profiles were considered by pairing
various levels of peak pressures (Low, Medium and High) and durations (Short, Medium and
Long). These blast profiles were selected to expose the investigated RC slabs to damage levels
varying from superficial to severe damage. This was achieved by covering a blast duration to
fundamental period ratio (T/TN) range between 0.50 and 3.50 and a blast intensity to resistance
ratio (P/ru) range between 0.50 and 2.50.
Two numerical techniques were implemented to simulate strain-rate effects, materials
nonlinearities, and damage patterns and extents typically encountered in blast applications. 1-
Finite Element Analysis- FEA using LS-DYNA Software was primarily utilized to validate the
reliability and accuracy of blast predictions produced by various SDOF tools (i.e. RCBlast, UFC
3-340-02 charts and RCProp/ SBEDS) during a previous research work. Primary simulation
parameters for various RC slab configurations were calibrated using response measurements
obtained from a blast testing program that was funded by the National Science Foundation (NSF)
and administered by the University of Missouri – Kansas City (UMKC). 2- Single Degree Of
Freedom- SDOF using RCBlast program was adopted as the primary simulation tool for the current
study while other SDOF tools were considered for comparison purposes only.
PREVIOUS BLAST SIMULATION WORK USING FEA & SDOF TECHNIQUES
Background Information
Recently, the author participated in a Blast Blind Prediction Contest [7] sponsored by the NSF in
collaboration with ACI-447 and ACI-370 committees, Structure-Point and UMKC/ SCE. The
contest was successful in drawing the interest of many university academics and practicing
engineers who are involved in numerical simulations of RC structural response to blast effects.
The main objectives of the contest were to promote technical efforts to improve the accuracy of
both analytical SDOF modeling and advanced FEA modeling, to compare the performance of
various available simulation tools, and to measure the efficiency of available concrete models
implemented in FEA software.
The idea of the contest was initiated by a testing program that was completed at the Blast Loading
Simulator (BLS) at the ERDC/ USACE, Vicksburg, MS. The objective of the test program was to
investigate the potential advantages of using High Strength Concrete (HSC) with Vanadium Rebar
(VR) over Normal Strength Concrete (NSC) with Normal Rebar (NR) for blast-resistant
construction. This allowed the collection of a wealth of information about the response of
reinforced concrete slabs of various strengths when subjected to various levels of blast loading
which was used later in verifying contestants’ predictions for different testing configurations.

3
Test Program Setup
All testing activities took place at the US Army ERDC Center at Vicksburg, MS. RC test
specimens were constructed using special wooden forms where concrete was placed over laid
rebar. After curing, pressure and strain gauges were attached at designated locations on the face of
each specimen. Testing crew used a removable test frame to align each specimen to a test frame
fixed into the end wall of the BLS chamber. Once the test specimen was securely attached to the
BLS, a shock-like loading was generated inside the BLS tube using either air or helium to achieve
the defined blast loading level. Test specimen responses were recorded using high speed video
cameras and photography in addition to real-time measurements received from attached gauges.
Figure 1 shows relevant slab geometries and rebar arrangement for tested specimens and their fit
within the removable test frame. Figure 2 shows photos of the different stages of a typical test
setup.
(a) RC Slab Geometry & Rebar Arrangement
(b) Removable Test Frame
Figure 1- Relevant Test Specimen Information

4
(a) Preparation (b) Instrumentation
(c) Attachment (d) Response Recording
Figure 2- Stages of a Typical Test Setup
5
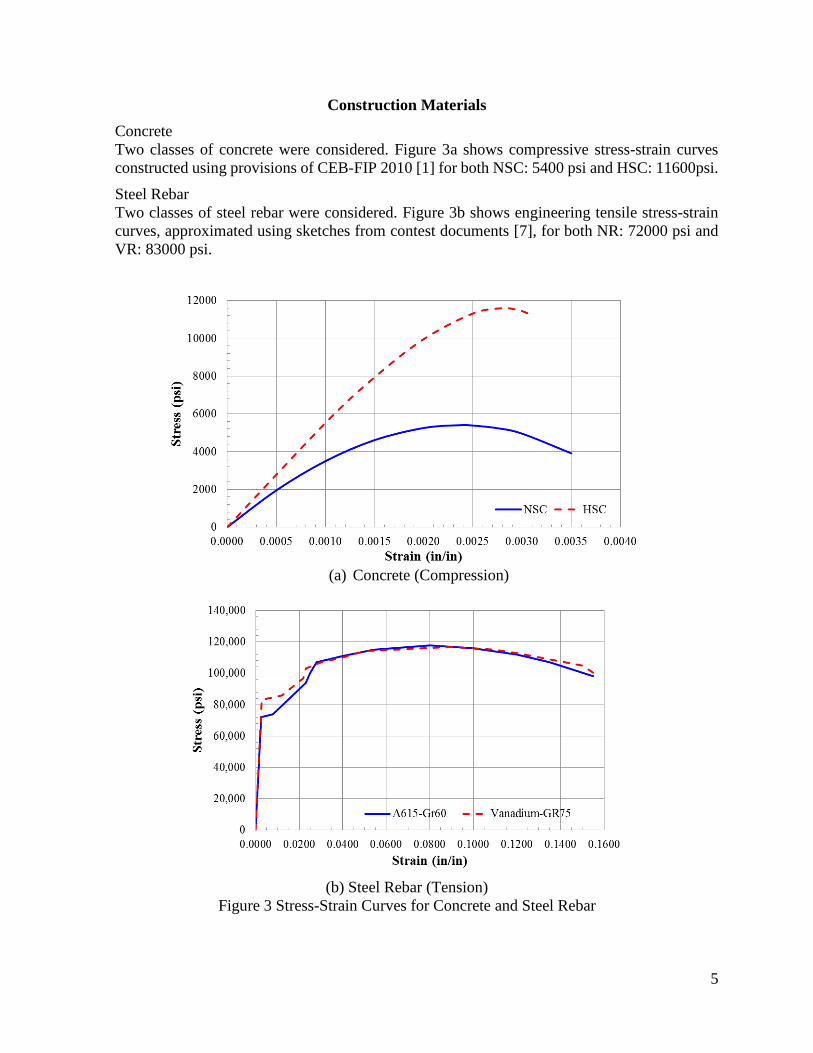
Construction Materials
Concrete
Two classes of concrete were considered. Figure 3a shows compressive stress-strain curves
constructed using provisions of CEB-FIP 2010 [1] for both NSC: 5400 psi and HSC: 11600psi.
Steel Rebar
Two classes of steel rebar were considered. Figure 3b shows engineering tensile stress-strain
curves, approximated using sketches from contest documents [7], for both NR: 72000 psi and
VR: 83000 psi.
(a) Concrete (Compression)
(b) Steel Rebar (Tension)
Figure 3 Stress-Strain Curves for Concrete and Steel Rebar

6
Blast Loading
A distinct shock load was generated within the BLS for each RC slab configuration and all of
which were recorded using direct measurements during testing. Two shock pressure histories were
considered for NSCNR slabs namely Set-1a [Pmax = 50 psi, Itot = 1020 psi.msec], and Set-1b [P
max
= 40 psi, I
tot
= 780 psi.msec].
Two shock pressure histories were considered for HSCVR slabs namely Set-2a [P
max
= 49 psi, I
tot
= 985 psi.msec], and Set-2b [P
max
= 41 psi, I
tot
= 785 psi.msec]. Figure 4 shows shock pressure
histories applied to NSCNR and HSCVR slabs.
(a) NSCNR Slabs
(b) HSCVR Slabs
Figure 4 Shock Pressure Histories

7
SDOF Simulation
A SDOF model is a simplified mathematical model that represents a dynamic structural/
mechanical system that has an infinite number of Degrees Of Freedom (DOF) using only a single
DOF (See Figure 5 below). The determination of the dynamic properties of the equivalent SDOF
system is based on the application of principle of conservation of energy. The objective of the
SDOF simulation is to compute maximum system responses over time by solving the nonlinear
dynamic equilibrium equation representing the system.
Figure 5- Idealization of A SDOF Model
SDOF Tools
RCBlast [3]
Developed by Eric Jacques, RCBlast is a software for the inelastic dynamic analysis of
reinforced concrete structures subject to blast and impact. It allows the user to provide problem-
specific information (i.e. geometry, material, boundary conditions, and loading) and it can be
used to obtain SDOF displacement history due to a specific dynamic loading or to generate
load-independent P-I curves. RCBlast accounts for plastic hinge length and computes moment-
curvature profile for the whole response range. RCBlast was selected as the primary SDOF tool
for this study due to its unique capabilities of modeling the plastic behavior of concrete elements
and its relatively accurate predictions of blast responses.
RCProp/ SBEDS [9]
RCProp is a spreadsheet tool that computes structural properties of RC components using basic
principles of force equilibrium and strain compatibility. RCProp utilizes component’s
geometric parameters, material properties, and boundary conditions to compute equivalent
dynamic system parameters required to perform SDOF analyses. SBEDS is an Excel-based tool
based on UFC 3-340-02 and can be used for the design and analysis of structural components
subjected to dynamic loads using SDOF methodology. For our current application, RCProp is

8
being used to compute SDOF properties which in turn are used as an input to SBEDS/ General
SDOF module to compute SDOF responses to applied blast loading.
UFC-3-340-02 Charts [8]
This Unified Facility Criteria (UFC), is considered to be the primary reference for blast-resistant
design by protective design practitioners. Chapter 3 of this resource provides graphical
solutions of SDOF elasto-plastic systems subjected to bilinear triangular pulse. For our current
investigation, UFC’s Figure 3.66 was utilized to estimate primary response parameters; time of
maximum response, maximum deflection, and time of initial yield. Only two non-dimensional
SDOF ratios are needed to obtain these response estimates namely, load duration to
fundamental period ratio and load peak pressure to resistance ratio.
FEA Simulation
Software
LS-DYNA [5], developed by Livermore Software Technology Corporation (LSTC), is a
general purpose Hydrocode capable of simulating complex problems especially those involving
large deformations, complex boundary conditions, and nonlinear dynamics. This code's is well
suited for applications such as automotive crash, explosions and shock wave propagation. It
allows the user to select from numerous models representing various material classes including
elasticity, plasticity, viscoelasticity, viscoplasticity, composites, thermal effects, and rate
dependence. It also provides a large library of elements used to create 3D models including
solid, shell, beam, discrete, lumped elements with more than one formulation for each type to
suit different applications. To represent various contact conditions, the code supports various
algorithms including rigid, flexible, and eroding, linear, surface, edge, and tied contact
interfaces.
Geometric Discretization
In (Kewaisy 2016) [4], a partial slab model was considered to reduce the computation time and
to allow for finer discretization mesh. The uniform construction of the tested slabs, the use of
similar end supports details, and the investigated response type allowed the consideration of
symmetry about mid-height and the use of a partial width of the tested slab. Steel rebar was
modeled with full integration into the concrete through common nodes with a mesh that has
one-element through the rebar section and a one-to-one node along the rebar-concrete interface.
Supporting steel tubes were also modeled with a coarse mesh that has one-element through the
thickness. A total of 11376 nodes, and 9372 Constant-Strain Solid Elements were used to model
the partial concrete slab, interior and exterior supporting steel tubes. Figure 6 below shows an
isometric view of the discretized FE model.
Material Models
Three LS-DYNA constitutive models for Concrete and one model for Steel rebar were deemed
appropriate for simulating shock response of RC slabs:
MAT-072-R3 (*MAT_CONCRETE_DAMAGE_REL3) model, developed by Karagozian
& Case, is a concrete model based on a three surface plasticity formulation that employs a
material damage parameter at each time step to identify a new yield surface for the material.
This surface is computed using the three fixed surfaces predefined by the user, and the
damage parameter computed at this point. The model requires the use of an Equation Of
State (EOS) to describe the pressure-volumetric strain response of concrete.

9
(a) Full Model (b) Concrete (c) Steel Rebar (d) Supporting Tubes
Figure 6 Discretized FE Model for Partial RC Slab and Supports
MAT-072-R3 (*MAT_CONCRETE_DAMAGE_REL3) model, developed by Karagozian
& Case, is a concrete model based on a three surface plasticity formulation that employs a
material damage parameter at each time step to identify a new yield surface for the material.
This surface is computed using the three fixed surfaces predefined by the user, and the
damage parameter computed at this point. The model requires the use of an Equation Of
State (EOS) to describe the pressure-volumetric strain response of concrete.
MAT-084-085 (*MAT_WINFRITH_CONCRETE) model, developed by Broadhouse B.J.
and Nielson, is a smeared crack, smeared rebar model. This model is based upon the four-
parameter model in which parameters are functions of the tensile strength to compressive
strength ratio and can be determined from uniaxial, biaxail and triaxail compression and
tension tests. The model uses radial return which omits material dilation, and includes
strain softening in tension expressed in terms of crack opening width or fracture energy.
MAT-159 (*MAT_CSCM_CONCRETE) concrete model, developed by Murray, Y.D., is
a cap model with a smooth or continuous intersection between the failure surface and
hardening cap. This surface uses a multiplicative formulation to combine the shear (failure)
surface with the hardening compaction surface (cap) smoothly and continuously. This type
of model is often referred to as a continuous surface cap model (CSCM).
MAT-024 (*MAT_PIECEWISE_LINEAR_PLASTICITY) was selected to represent the
nonlinear behavior of both NR and VR steels in addition to the supporting steel tubes. For
each steel type, two LOAD CURVES were prepared to capture the material behavior. The
first represents the material true- effective stress- effective plastic strain function as
computed from original engineering stress-strain curves. The second provides strain-rate
vs Dynamic Increase Factor (DIF) as obtained from Malvar and Crawford.

10
Sample Simulation Results (Kewaisy 2016) [4]
SDOF Predictions
Figure 7 Maximum Displacement Response of NSCNR Slab (SDOF)
Table 1 Summary of SDOF Response Predictions for Normal-Strength Concrete Slab
Figure 8 Maximum Displacement Response of HSCVR Slab (SDOF)
SDOF TOOL Max Displ Error Time Error Resid Displ Error
Ymax Err Tmax Err Yres Err
in (mm) % msec % in (mm) %
TEST 4.287 (108.9) N/A 29.95 N/A 3.532 (89.7) N/A
UFC-3-340-02 5.003 (127.1) 16.7% 30.32 1.2% N/A N/A
RCBLAST 4.553 (115.7) 6.2% 30.50 1.8% 4.125 (104.8) 16.8%
RCProp/SBEDS 5.140 (130.6) 19.9% 30.67 2.4% 4.585 (116.5) 29.8%
NSCNR (Set- 1a Blast)

11
Table 2 Summary of SDOF Response Predictions for High-Strength Concrete Slab
FEA Predictions
Figure 9 Maximum Displacement Response of NSCNR Slab (FEA)
Table 3 Summary of FEA Response Predictions for Normal-Strength Concrete Slab
SDOF TOOL Max Displ Error Time Error Resid Displ Error
Ymax Err Tmax Err Yres Err
in (mm) % msec % in (mm) %
TEST 3.890 (98.8) N/A 28.16 N/A 2.825 (71.8) N/A
UFC-3-340-02 4.128 (104.9) 6.1% 26.90 -4.5% N/A N/A
RCBLAST 3.827 (97.2) -1.6% 24.20 -14.1% 3.278 (83.3) 16.0%
RCProp/SBEDS 4.382 (111.3) 12.6% 27.80 -1.3% 3.709 (94.2) 31.3%
HSCVR (Set-2a Blast)
LS-DYNA Max Displ Error Time Error Resid Displ Error
Constitutive Model Ymax Err Tmax Err Yres Err
in (mm) % msec % in (mm) %
TEST 4.287 (108.9) N/A 29.95 N/A 3.532 (89.7) N/A
LS-DYNA MAT-159 4.523 (114.9) 5.5% 27.40 -8.5% 2.450 (62.2) -30.6%
LS-DYNA MAT-085 4.444 (112.9) 3.7% 26.50 -11.5% 3.076 (78.1) -12.9%
LS-DYNA MAT-072R3 4.437 (112.7) 3.5% 25.70 -14.2% 2.763 (70.2) -21.8%
NSCNR (Set- 1a Blast)

12
(a) MAT-159 Plastic Strain (b) MAT-084-085 Crack Pattern (c) Mat 072R3 Plastic Strain
Figure 10 NSCNR Slab Cracking Patterns Due to Blast Damage
Figure 11 Maximum Displacement Response of HSCVR Slab (FEA)
Table 4 Summary of FEA Response Predictions for High-Strength Concrete Slab
LS-DYNA Max Displ Error Time Error Resid Displ Error
Constitutive Model Ymax Err Tmax Err Yres Err
in (mm) % msec % in (mm) %
TEST 3.890 (98.8) N/A 28.16 N/A 2.825 (71.8) N/A
LS-DYNA MAT-159 3.689 (93.7) -5.2% 24.10 -14.4% 2.059 (52.3) -27.1%
LS-DYNA MAT-085 3.716 (94.4) -4.5% 24.20 -14.1% 2.352 (59.8) -16.7%
LS-DYNA MAT-072R3 3.888 (98.8) -0.1% 30.10 6.9% 2.987 (75.9) 5.7%
HSCVR (Set-2a Blast)

13
(a) MAT-159 Plastic Strain (b) MAT-084-085 Crack Pattern (c) Mat 072R3 Plastic Strain
Figure 12 HSCVR Slab Cracking Patterns Due to Blast Damage
Conclusions about the Accuracy of Various Simulation Techniques (Kewaisy 2016) [4]
1. Despite their modeling limitations, primary SDOF tools (i.e. RCBlast and
RCProp/SBEDS) have exhibited excellent capability of predicting the structural behavior
of both NSCNR and HSCVR slabs up to the instant of peak response.
2. As shown in Figures 7, 8 and by inspection of Tables 1, 2, it can be concluded that RCBlast
provided better accuracy in its response estimates. With few exceptions, its estimates were
within ±10.0% (on average) for maximum displacement and within ±15.0 % (on average)
for time of maximum response compared to test measurements. Predictions for residual
displacements showed higher levels of deviation and variability with estimates within
±20% (on average) of test measurements.
3. In general, FEA simulations are known to yield accurate predictions compared to those
produced by SDOF due to their ability to: accommodate large number of DOF, model
realistic non-standard boundary conditions, utilize rigorous material models with
nonlinearities, account for varying strain-rate effects, allow for spatially varying shock
loading and predict residual damage patterns and extents. Nevertheless, FEA modeling
power and precision come at a price as it requires extensive knowledge, expertise,
computing power, and modeling time.
4. As shown in Figures 9, 10, 11, 12 and by inspection of Tables 3, 4, it can be concluded that
LS-DYNA simulations using various constitutive models, with few exceptions, have
provided predictions within ±5.0% (on average) for maximum displacement and within
±10.0 % (on average) for time of maximum response compared to test measurements.
Estimates for residual displacements showed higher levels of variability with estimates
within ±15% (on average) of test measurements. Deviations from test observations were

14
primarily attributed to inaccuracies of analytical parameters implemented for various
concrete constitutive models.
5. For a certain blast loading, and as observed through test measurements and simulation
results, the utilization of a higher strength concrete did not provide a considerable
advantage over lower strength concrete in terms of reduced blast response and damage
extents.
Based on the findings of the blast prediction study and as per its conclusions, the author
identified the need for a comprehensive investigation of the influence of RC materials’
strengths on the blast performance of RC concrete slabs. The author made the decision to adopt
SDOF techniques for the current investigation acknowledging their acceptable accuracy, ease
of use, and manageable computational effort,

15
INVESTIGATION OF MATERIAL STRENGTH EFFECTS ON BLAST RESPONSE
The current study investigates the factors influencing the appropriate selection of RC strength class
for a specific structural configuration and blast loading conditions. The primary structural elements
for this study are Doubly reinforced, One-way RC slabs with both simple and fixed support end
conditions. Three strength classes of RC concrete incorporating available construction materials
were investigated; Normal strength (NSC/NSR), Medium strength (MSC/MSR), and High strength
(HSC/HSR). Nine bilinear shock loading profiles were considered by pairing various levels of
peak pressures and durations to expose the investigated RC slabs to damage levels varying from
superficial to severe damage. RCBlast program, a SDOF tool, was utilized to predict blast
responses of the investigated RC slabs by modelling their geometries, boundary conditions, rebar
arrangements, materials properties, strain-rate effects, damage extents and blast loading profiles.
The following provides description of the various aspects of the current investigation.
Investigated RC Slab
A slab configuration was considered that has similar geometry (i.e. span, width, thickness) to those
previously tested RC specimens but has both top and bottom flexural reinforcements. Figure 13
shows typical geometric and rebar arrangements for the investigated RC slabs.
Figure 13 Investigated One-Way RC Slab

16
Study Cases
To account for most of the practical design cases that involve various material strengths (Normal,
Medium, High), boundary conditions (Simple and Fixed End Supports), and blast loading
intensities (Low, Medium, High), a total of 54 analysis cases were considered. Table 5 provides a
list of the analysis cases with corresponding parameters.
Table 5: Summary of Study Cases
Analysis
Case
Conc.
Type
Rebar
Type
BCs Blast
Load
Analysis
Case
Conc.
Type
Rebar
Type
BCs Blast
Load
Case-1 NSC NSR S-S BL1 Case-28 NSC NSR F-F BL1
Case-2 MSC MSR S-S BL1 Case-29 MSC MSR F-F BL1
Case-3 HSC HSR S-S BL1 Case-30 HSC HSR F-F BL1
Case-4 NSC NSR S-S BL2 Case-31 NSC NSR F-F BL2
Case-5 MSC MSR S-S BL2 Case-32 MSC MSR F-F BL2
Case-6 HSC HSR S-S BL2 Case-33 HSC HSR F-F BL2
Case-7 NSC NSR S-S BL3 Case-34 NSC NSR F-F BL3
Case-8 MSC MSR S-S BL3 Case-35 MSC MSR F-F BL3
Case-9 HSC HSR S-S BL3 Case-36 HSC HSR F-F BL3
Case-10 NSC NSR S-S BL4 Case-37 NSC NSR F-F BL4
Case-11 MSC MSR S-S BL4 Case-38 MSC MSR F-F BL4
Case-12 HSC HSR S-S BL4 Case-39 HSC HSR F-F BL4
Case-13 NSC NSR S-S BL5 Case-40 NSC NSR F-F BL5
Case-14 MSC MSR S-S BL5 Case-41 MSC MSR F-F BL5
Case-15 HSC HSR S-S BL5 Case-42 HSC HSR F-F BL5
Case-16 NSC NSR S-S BL6 Case-43 NSC NSR F-F BL6
Case-17 MSC MSR S-S BL6 Case-44 MSC MSR F-F BL6
Case-18 HSC HSR S-S BL6 Case-45 HSC HSR F-F BL6
Case-19 NSC NSR S-S BL7 Case-46 NSC NSR F-F BL7
Case-20 MSC MSR S-S BL7 Case-47 MSC MSR F-F BL7
Case-21 HSC HSR S-S BL7 Case-48 HSC HSR F-F BL7
Case-22 NSC NSR S-S BL8 Case-49 NSC NSR F-F BL8
Case-23 MSC MSR S-S BL8 Case-50 MSC MSR F-F BL8
Case-24 HSC HSR S-S BL8 Case-51 HSC HSR F-F BL8
Case-25 NSC NSR S-S BL9 Case-52 NSC NSR F-F BL9
Case-26 MSC MSR S-S BL9 Case-53 MSC MSR F-F BL9
Case-27 HSC HSR S-S BL9 Case-54 HSC HSR F-F BL9
Concrete Properties
To investigate the influence that concrete strength may have on the blast response of RC slabs,
three classes of concrete were considered: Normal Strength Concrete (NSC) with fc' = 5,000 psi,
Medium Strength Concrete (MSC) with fc' = 10,000 psi and High Strength Concrete (HSC) with
fc' = 15,000 psi.
Table 6 provides concrete physical and mechanical properties as assumed or obtained from CEB-
FIP 2010 [1] and fib Bulletin 42 [2]. Figure 14 shows compressive stress-strain curves constructed
using provisions of CEB-FIP 2010 for all concrete classes.

17
Table 6: Physical and Mechanical Properties of Concrete of Various Strengths
Property Symbol Unit NSC
5,000 psi
MSC
10,000 psi
HSC
15,000 psi
Specific Weight c pcf 145 145 145
Cyl. Compressive Strength c'f psi 5,000 10,000 15,000
Cyl. Tensile Strength tf psi 440 635 750
Elastic Modulus (Mean) cE psi 3,825,000 4,819,000 5,516,500
Poisson’s Ratio c 0.197 0.214 0.232
Limit Compressive Strain max-c 0.0035 0.0032 0.0030
Maximum Aggregate Size aggd in 3/8 3/8 3/8
Strength Increase Factor cSIF 1.00 1.00 1.00
Dynamic Increase Factor cDIF 1.344 1.170 1.113
Figure 14- Static Engineering Stress Strain Curves of Concrete of Various Strengths
Steel Rebar Properties
To evaluate the influence of steel rebar strength on blast response of RC slabs, three classes of
steel rebar were considered. ASTM A615-GR-60 ksi steel typically used for reinforcing bars of
concrete was selected to represent Normal Strength Rebar (NSR). ASTM A615-GR-75 ksi steel,
a mid-range reinforcing steel was selected to represent Medium Strength Rebar (MSR). A1035-
Gr-100 ksi, a newly developed specialty reinforcing steel was selected to represent High Strength
Rebar (HSR).
Table 7 shows physical and mechanical properties for various steel strengths including DIFs as
recommended by Malvar [6]. Figures 15, 16 show static engineering and dynamic true stress-
strain curves respectively for rebar steels as implemented in the current study.

18
Table 7: Physical and Mechanical Properties of Steel Rebar of Various Strengths
Property Symbol Unit NSR
A615 Gr-60
MSR
A615 Gr-75
HSR
A1035 Gr-
100
Specific Weight s pcf 490 490 490
Initial Yield Strength yF psi 60,000 75,000 100,000
Strain Hardening Strength shF psi 63,000 79,000 105,000
Ultimate (Tensile) Strength uF psi 92,000 105,000 165,000
Elastic Modulus (Initial) sE psi 29,000,000 29,000,000 29,000,000
Poisson’s Ratio s 0.300 0.300 0.300
Limit Tensile Strain max-t 0.145 0.135 0.110
Strength Increase Factor sSIF 1.20 1.100 1.00
Dynamic Increase Factor sDIF 1.260 1.185 1.068
Figure 15- Static Engineering Stress Strain Curves of Steel Rebar of Various Strengths
Figure 16- Dynamic True Stress Strain Curves of Steel Rebar of Various Strengths

19
Blast Loading
To encompass the practical range of blast loading that the investigated RC slabs could be designed
for, the study considered nine bilinear shock loading profiles varying in load intensity and duration.
The bilinear pulse shape was selected as a good approximation to either the exponential decay
shock pressure signature corresponding to unconfined high explosive detonation or to the
combined shock and gas pressure phases of partially confined detonations. Three pressure
intensities were selected based on the blast resistances of considered RC slabs to cover load
intensity to resistance (P/ru) ratio that varies approximately from 0.50 to 2.50.
Considered pressure intensities were relatively classified as: Low Pressure (LP) of 30 psi, Medium
Pressure (MP) of 45 psi, and High Pressure (HP) of 60 psi. Three total durations were selected
based on the fundamental periods of considered RC slabs to cover load duration to fundamental
period (T/TN) ratio that varies approximately from 0.50 to 3.50. Considered durations include:
Short Duration (SD) of 10 msec, Medium Duration (MD) of 20 msec, and Long Duration (LD) of
40 msec. Blast Loads BL1 through BL9 were compiled by pairing various pressure intensities with
various durations. Figure 17 shows the bilinear profile of a typical blast load curve. Table 8
provides relevant blast load information including curve points (ti, Pi) identifying bilinear profile
of each load curve, total blast impulse (Itot), as a measure of blast energy, and equivalent triangular
pulse duration (T).
Figure 17- Typical Bilinear Blast Load Time History
Table 8: Bilinear Blast Load Curves Parameters
Blast Load
ID Class
t1
(ms)
P1
(psi)
t2
(ms)
P2
(psi)
t3
(ms)
P3
(psi)
Itot
(psi-ms)
T
(ms)
BL1 LP/SD 0.00 30.0 6.72 8.72 18.00 0.0 179.0 9.48
BL2 LP/MD 0.00 30.0 14.64 8.63 38.50 0.0 386.0 20.55
BL3 LP/LD 0.00 30.0 28.08 8.71 75.00 0.0 748.0 39.56
BL4 MP/SD 0.00 45.0 6.72 13.08 18.00 0.0 269.0 9.48
BL5 MP/MD 0.00 45.0 14.64 12.99 38.67 0.0 580.0 20.55
BL6 MP/LD 0.00 45.0 28.08 13.06 75.00 0.0 1122.0 39.56
BL7 HP/SD 0.00 60.0 6.72 17.44 18.00 0.0 359.0 9.48
BL8 HP/MD 0.00 60.0 14.64 17.25 38.50 0.0 771.0 20.55
BL9 HP/LD 0.00 60.0 28.08 17.42 75.00 0.0 1496.0 39.56

20
Component Response Limits and Damage Levels
The primary objective of blast-resistant design of a facility is to provide adequate safety to its
occupants and sensitive contents. This is typically communicated to the design professional though
an identified Level Of Protection (LOP). To achieve the protection objectives, the blast-resistant
design needs to secure adequate strength and ductile detailing to control the blast-induced damage
that may be experienced by a component when exposed to the design-level blast event. Figure 18
shows typical damage levels as represented by a component Pressure-Impulse (P-I) capacity as
depicted in (PDC 2006) [10]. Acceptable structural damage corresponding to various LOP are
typically correlated with maximum structural response limits. Table 9 shows an example of such
correlation for RC slabs as obtained from PDC 2006.
Figure 18- Pressure Impulse Diagram Showing Component Damage Levels (PDC 2006) [10]
Table 9: Response Limits for Various Damage Levels of RC Slabs* (PDC 2006) [10]
Damage Level
B1
Damage Level
B2
Damage Level
B3
Damage Level
B4
Damage Level
B5
Superficial
Damage
Moderate
Damage
Heavy Damage Hazardous Failure Blowout
1.0 - - 2 ◦ - 5 ◦ - 10 ◦ - > 10 ◦ * Flexural Response with No Shear Reinforcement and without Tension Membrane

21
DISCUSSION OF RESULTS
This section of the paper provides comprehensive tabulated and graphical representations of the
study results combined with brief discussion of how the computed structural responses correlate
to the properties of the blast-loaded RC slabs with emphasis on material strength.
Computed SDOF Properties
Tables 10, 11 show the primary SDOF parameters and Figures 19, 20 show the resistance-
displacement curves all computed by RCBlast for reinforced concrete slabs of various strengths
(NS, MS, HS) with Simple and Fixed supports respectively. The primary observation is that despite
the considerable variation in both concrete and rebar strengths (i.e. 300% for f’c and 67% for fy),
the variations in the computed primary dynamic properties (KE, ru, TN) of the investigated slabs
were one order of magnitude lower than the strength ratio level and they were in the order of 13%,
25%, and 7% respectively.
That can be attributed to the fact that both the Strength Increase Factors (SIF) and the Dynamic
Increase Factors (DIF) for concrete and rebar steel decrease as the material strength gets higher.
In addition, flexural strength of a RC slab and hence its blast resistance is predominantly controlled
by its rebar properties. In addition the initial stiffness of a RC slab is primarily influenced by its
concrete modulus which is a function of the square root of its compressive strength (√f’c) and tend
to have a lower proportionality to (√f’c) as the concrete strength increases. Having the same mass
and slightly varying stiffness resulted in having RC slabs with close fundamental periods of
vibration.
It is worth noting the close similarities between Normal strength (NSC/NSR) and the Medium
strength (MSC/MSR) concrete properties and their resistance-displacement profiles (See Figure
19) which indicate the limited blast-resistance benefits of specifying Medium strength class over
the Normal strength class especially when construction costs are taken into consideration.
Table 10: SDOF Properties of Simple Supports RC Slabs of Various Strengths (RCBlast)
Property Symbol Unit NSC/NSR
Slab
MSC/MSR
Slab
HSC/HSR
Slab
Mass M psi.ms2/in 869 869 869
Load-Mass Factors LMK 0.78,0.78, 0.66 0.78,0.78, 0.66 0.78,0.78, 0.66
Stiffness (Initial) EK psi/in 49.58 45.83 43.12
Plastic Hinge Length pL in 7.48 8.46 9.84
Flex. Resistance
(Ultimate) ur psi 29.05 30.64 44.68
Yield Displacement
(Equiv.) EX in 0.305 0.366 0.438
Fundamental Period NT msec 18.66 19.41 20.02

22
Figure 19- Resistance-Displacement Curves of (S-S) RC Slabs of Various Strengths
Table 11: SDOF Properties of Fixed Supports RC Slabs of Various Strengths (RCBlast)
Property Symbol Unit NSC/NSR
Slab
MSC/MSR
Slab
HSC/HSR
Slab
Mass M psi.ms2/in 869 869 869
Load-Mass Factors LMK 0.77,0.78, 0.66 0.77,0.78, 0.66 0.77,0.78, 0.66
Stiffness (Initial) EK psi/in 112.53 116.08 129.2
Plastic Hinge Length pL in 7.48 8.46 9.84
Flex. Resistance
(Ultimate) ur psi 58.04 61.24 89.24
Yield Displacement
(Equiv.) EX in 0.230 0.260 0.283
Fundamental Period NT msec 12.31 12.12 11.49
Figure 20- Resistance-Displacement Curves of (F-F) RC Slabs of Various Strengths

23
Computed Maximum Structural Responses to Blast Loading
Table 12 provides a summary of blast response results for all 54 cases as computed by RCBlast
program. The primary RC response results include: T/TN (Load Duration-to-Fundamental Period
Ratio), P/ru (Load Intensity-to-Resistance Ratio), Ty (Time for 1st yield), Tmax (Time for Maximum
mid-displacement), Xmax (Maximum mid-displacement), max (Maximum slab-end rotation), Xres
(Residual mid-displacement), and Damage Index (as per PDC 2006).
Table 12: Blast Response Results for Investigated Cases (RCBlast)
Analysis
Case
RC
Class
T/TN P/ru Ty
(msec)
Tmax
(msec)
Xmax
(in) max
(deg)
Xres
(in)
PDC
Damage
Index
Case-1 NS 0.508 1.033 4.20 8.80 0.516 1.14 0.102 B2
Case-2 MS 0.488 0.979 5.20 8.60 0.516 1.14 0.063 B2
Case-3 HS 0.474 0.671 6.00 8.30 0.520 1.15 0.024 B2
Case-4 NS 1.101 1.033 3.90 13.00 0.941 2.07 0.382 B3
Case-5 MS 1.059 0.979 4.80 12.00 0.866 1.91 0.260 B2
Case-6 HS 1.026 0.671 5.30 10.50 0.772 1.70 0.118 B2
Case-7 NS 2.120 1.033 3.90 18.40 1.472 3.24 1.031 B3
Case-8 MS 2.038 0.979 4.60 15.80 1.224 2.70 0.701 B3
Case-9 HS 1.976 0.671 5.20 12.00 0.937 2.06 0.272 B3
Case-10 NS 0.508 1.549 3.20 11.40 1.031 2.27 0.362 B3
Case-11 MS 0.488 1.469 3.90 10.60 0.965 2.12 0.268 B3
Case-12 HS 0.474 1.007 4.40 9.30 0.866 1.91 0.134 B2
Case-13 NS 1.101 1.549 3.10 19.00 2.512 5.52 1.878 B4
Case-14 MS 1.059 1.469 3.70 16.60 2.091 4.60 1.315 B3
Case-15 HS 1.026 1.007 4.10 12.50 1.453 3.20 0.421 B3
Case-16 NS 2.120 1.549 3.10 29.20 5.043 10.98 4.488 B5
Case-17 MS 2.038 1.469 3.70 26.90 4.059 8.87 3.465 B4
Case-18 HS 1.976 1.007 4.00 15.80 1.929 4.24 1.130 B3
Case-19 NS 0.508 2.065 2.70 14.00 1.807 3.98 0.902 B3
Case-20 MS 0.488 1.958 3.30 12.80 1.614 3.55 0.650 B3
Case-21 HS 0.474 1.343 3.60 10.30 1.283 2.83 0.276 B3
Case-22 NS 1.101 2.065 2.70 23.90 4.724 10.30 4.071 B5
Case-23 MS 1.059 1.958 3.10 22.10 4.059 8.87 3.402 B4
Case-24 HS 1.026 1.343 3.50 14.70 2.362 5.19 1.209 B4
Case-25 NS 2.120 2.065 2.70 32.30 7.760 16.62 7.217 B5
Case-26 MS 2.038 1.958 3.10 31.00 6.898 14.86 6.303 B5
Case-27 HS 1.976 1.343 3.50 20.30 3.346 7.33 2.583 B4
Case-28 NS 0.770 0.517 N/A 4.50 0.142 0.31 0.000 B0
Case-29 MS 0.782 0.490 N/A 4.20 0.138 0.30 0.000 B0
Case-30 HS 0.825 0.336 N/A 4.10 0.142 0.31 0.000 B0
Case-31 NS 1.669 0.517 N/A 5.40 0.181 0.40 0.000 B0
Case-32 MS 1.696 0.490 N/A 4.80 0.165 0.36 0.000 B0
Case-33 HS 1.789 0.336 N/A 4.50 0.165 0.36 0.000 B0
Case-34 NS 3.214 0.517 N/A 6.00 0.209 0.46 0.000 B0

24
Case-35 MS 3.264 0.490 N/A 5.10 0.181 0.40 0.000 B0
Case-36 HS 3.443 0.336 N/A 4.70 0.177 0.39 0.000 B0
Case-37 NS 0.770 0.775 3.80 5.70 0.295 0.65 0.020 B1
Case-38 MS 0.782 0.735 4.90 5.20 0.260 0.57 0.000 B0
Case-39 HS 0.825 0.504 N/A 4.80 0.240 0.53 0.000 B0
Case-40 NS 1.669 0.775 3.40 7.40 0.437 0.96 0.087 B1
Case-41 MS 1.696 0.735 3.90 6.60 0.366 0.81 0.039 B1
Case-42 HS 1.789 0.504 4.40 5.60 0.307 0.68 0.008 B1
Case-43 NS 3.214 0.775 3.30 8.90 0.539 1.19 0.209 B2
Case-44 MS 3.264 0.735 3.70 7.40 0.429 0.95 0.094 B1
Case-45 HS 3.443 0.504 4.20 6.00 0.339 0.75 0.024 B1
Case-46 NS 0.770 1.034 2.80 6.80 0.520 1.15 0.114 B2
Case-47 MS 0.782 0.980 3.10 6.20 0.449 0.99 0.067 B1
Case-48 HS 0.825 0.672 3.40 5.40 0.378 0.83 0.024 B1
Case-49 NS 1.669 1.034 2.70 10.30 0.945 2.08 0.500 B3
Case-50 MS 1.696 0.980 3.00 8.80 0.728 1.60 0.291 B2
Case-51 HS 1.789 0.672 3.20 6.50 0.504 1.11 0.087 B2
Case-52 NS 3.214 1.034 2.27 14.30 1.382 3.04 1.028 B3
Case-53 MS 3.264 0.980 2.90 11.20 0.949 2.09 0.587 B3
Case-54 HS 3.443 0.672 3.10 7.20 0.563 1.24 0.177 B2
Figures 21 through 29 depict maximum mid-span displacement histories of simply-supported RC
slabs (Cases 1 through 27) of various strength classes (NSC/NSR, MSC/MSR, HSC/HSR) when
subjected to various blast loading (Bl through BL9) as computed by RCBlast program.
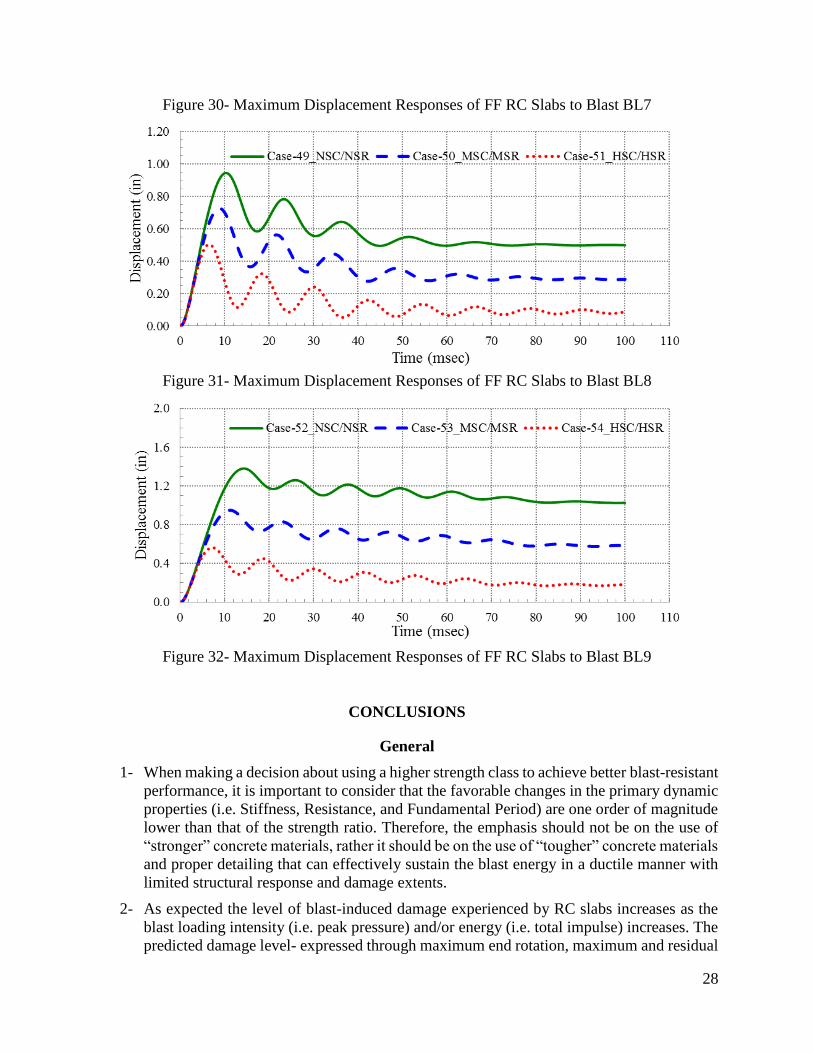
For illustration purposes, Figures 30 through 32 depict maximum mid-span displacement histories
of Fixed-supports RC slabs (Cases 52 through 54) of various strength classes (NSC/NSR,
MSC/MSR, HSC/HSR) when subjected to High-Pressure blast loading (i.e. BL7, BL8, BL9).
Figure 21- Maximum Displacement Responses of SS RC Slabs to Blast BL1

25
Figure 22- Maximum Displacement Responses of SS RC Slabs to Blast BL2
Figure 23- Maximum Displacement Responses of SS RC Slabs to Blast BL3
Figure 24- Maximum Displacement Responses of SS RC Slabs to Blast BL4

26
Figure 25- Maximum Displacement Responses of SS RC Slabs to Blast BL5
Figure 26- Maximum Displacement Responses of SS RC Slabs to Blast BL6
Figure 27- Maximum Displacement Responses of SS RC Slabs to Blast BL7

27
Figure 28- Maximum Displacement Responses of SS RC Slabs to Blast BL8
Figure 29- Maximum Displacement Responses of SS RC Slabs to Blast BL9
0.0
1.0
2.0
3.0
4.0
5.0
6.0
0 10 20 30 40 50 60 70 80 90 100 110
Dis
pla
cem
ent
(in
)
Time (msec)
Case-22_NSC/NSR Case-23_MSC/MSR Case-24_HSC/HSR
28
Figure 30- Maximum Displacement Responses of FF RC Slabs to Blast BL7
Figure 31- Maximum Displacement Responses of FF RC Slabs to Blast BL8
Figure 32- Maximum Displacement Responses of FF RC Slabs to Blast BL9
CONCLUSIONS
General
1- When making a decision about using a higher strength class to achieve better blast-resistant
performance, it is important to consider that the favorable changes in the primary dynamic
properties (i.e. Stiffness, Resistance, and Fundamental Period) are one order of magnitude
lower than that of the strength ratio. Therefore, the emphasis should not be on the use of
“stronger” concrete materials, rather it should be on the use of “tougher” concrete materials
and proper detailing that can effectively sustain the blast energy in a ductile manner with
limited structural response and damage extents.
2- As expected the level of blast-induced damage experienced by RC slabs increases as the
blast loading intensity (i.e. peak pressure) and/or energy (i.e. total impulse) increases. The
predicted damage level- expressed through maximum end rotation, maximum and residual

29
displacements- showed dependence on the RC strength class that varied according to the
blast loading characteristics.
3- The most influential parameters affecting the response of structures to impulsive-like
loading are: the Load Duration-to-Fund. Period Ratio (T/TN) and the Load Intensity-to-
Resistance Ratio (P/ru). Understanding the response dependence on these non-dimensional
ratios allows the analyst/ designer to successfully predict the response to blast loads using
simplified SDOF approaches. Graphical solution charts of UFC 3-340-02 are considered
valuable tools for element sizing at planning level and for verification of final designs with
acceptable practical accuracy.
4- The use of higher strength class produces a RC slab with higher flexural resistance, higher
equivalent yield displacement, lower initial stiffness, longer plastic hinge length, and lower
fundamental period. Typically, the blast response of such a slab will exhibit reduced
maximum response (Xmax), support rotation (max) and residual damage (Xres) than those
for lower strength class. It will also indicate a delayed time for initial yield (Ty) and an
earlier time for maximum response (Tmax).
5- When evaluating construction material alternatives for blast-resistance, it is not sufficient
to consider the absolute reduction in structural response and damage resulting from the use
of stronger materials as the only selection criterion. It is essential to conduct a cost-benefit
analysis to compare the added value (i.e. protection) obtained using a higher strength class
to the design/ construction costs incurred. It is also essential to understand the range of
cost-effectiveness of various material strengths for different levels of blast load severity
(i.e. intensity and energy content).
For Simply Supported RC Slabs
6- Acknowledging the acceptance of heavy
damage for most blast-resistant designs (i.e.
PDC damage index B3), the use of NSC/NSR
proved to be adequate for Low Pressure; LP
blast loading within the Load Intensity-to-
Resistance Ratio range of (P/ru < 2.25) for any
blast duration. As the blast intensity increases
(i.e. MP, HP), the feasibility of using normal
strength concrete becomes limited to low
energy blast loading, with Short Duration; SD
within the Load Duration-to-Fundamental
Period Ratio range of (1.0 > T/TN ≥ 0.5).
7- The use of MSC/MSR proved to be practical
within the narrow range of blast loading that
involved Medium Pressure; MP with (1.5 > P/ru ≥ 1.0) and Medium Duration; MD with
(1.0 > T/TN ≥ 0.5). For all other cases, the use of MSC/MSR did not seem to provide
noticeable structural performance improvement over the cases using NSC/NSR and despite
the relative reduction in blast response, the damage classifications for both RC classes were
similar.

30
8- The use of HSC/HSR proved to be most effective for high energy blast loading with High
Pressure; HP with (1.5 > P/ru ≥ 1.0) for both Medium Duration; MD with (1.0 > T/TN ≥
0.50) and Long Duration; LD with (2.0 > T/TN ≥ 1.0). The use of HSC/HSR for these
severe loading conditions reduced the extents of damage and prevented the unacceptable
blow out failure of the RC slab.
For Fixed Support RC Slabs
Since a Fixed-Support slab has much higher flexural resistance (ru), stiffness (KE), and hence
much lower fundamental period (TN), its structural response and damage due to blast loading
is expected to be much less compared to those of a Simple-Support slab. Therefore, the need
to use higher strength class of RC diminishes and NSC/NSR would be adequate for most if
not for all practical blast-resistant design cases.
9- The use of MSC/MSR or HSC/HSR may be advantageous for design conditions where
elastic response is required to accommodate repeated blast load application (e.g. blast
containment). This application is more suited for LP blast loading with (0.5 > P/ru ≥ 0.25)
for any blast duration and for MP blast loading with (0.75 > P/ru ≥ 0.5) for SD blast duration
with (1.0 > T/TN ≥ 0.5).

31
REFERENCES
[1] International Federation for Structural Concrete (fib), 2010, “CEB-FIP Model Code 2010: First
Complete Draft”, Lausanne, Switzerland.
[2] International Federation for Structural Concrete (fib), 2008, “Constitutive Modeling of High
Strength/ High Performance Concrete: State of the Art Report”, Bulletin 42, Lausanne,
Switzerland.
[3] Jacques, E., 2014. RCBLAST (Version 0.5.1) Blast Analysis Software
[4] Kewaisy, T.H., 2016, “SDOF and HYDROCODE Simulation of Blast-Loaded Reinforced
Concrete Slabs”, Technical paper No 7, ACI SP-306, American Concrete Institute, Farmington
Hill, MI.
[5] LSDYNA (Version V971 R6.0.0) Software, Livermore Software Technology Corporation
(LSTC), Livermore, CA
[6] Malvar, L.J., Crawford, J.E., 1998, “Dynamic Increase Factors for Concrete”, Proceedings of
the 28th DDESB Seminar, Orlando Florida.
[7]. UMKC School of Computing and Engineering, 2013, “Blast Prediction Contest Website
http://sce.umkc.edu/blast-prediction-contest/”, UMKC.
[8] Unified Facilities Criteria (UFC 03-340-02), 2008, “Structures to resist the effects of accidental
explosions”, United States of America Department of Defense, Washington, D.C.
[9] U.S. Army Corps of Engineers (USACE)/ Protective Design Center (PDC), 2012. “User’s
Guide for the Single-Degree-of-Freedom Blast Effects Design Spreadsheets (SBEDS).” PDC-
TR 06-02, USACE, Washington, D.C.
[10] U.S. Army Corps of Engineers (USACE)/ Protective Design Center (PDC), 2006, Single-
Degree-of-Freedom Structural Response Limits for Antiterrorism Design, PDC-TR 06-08,
USACE, Washington, D.C.