Embed Size (px)
Citation preview
Identifying Mycobacterium tuberculosis Complex Strain Families using Spoligotypes
Inna Vitola, Jeffrey Driscollb, Barry Kreiswirthc, Natalia Kurepinac, Kristin P. Bennetta,d
aComputer Science Department, Rensselaer Polytechnic Institute, Troy, NY. E-mail: [email protected], MS bWadsworth Center, New York State Department of Health, Albany, NY. E-mail: [email protected], PhD cPublic Health Research Institute, Newark, NJ. E-mail: [email protected], PhD, [email protected], PhD dMathematical Sciences Department, Rensselaer Polytechnic Institute, Troy, NY. E-mail: [email protected], Telephone: (518) 276-6899, Fax: (518) 276-4824, PhD (Corresponding Author)

Key Words: Tuberculosis; Pattern Recognition, Automated; Automatic Data Processing;
Public Health Informatics
2
Abstract We present a novel approach for analysis of Mycobacterium tuberculosis complex
(MTC) strain genotyping data. Our work presents a first step in an ongoing project
dedicated to the development of decision support tools for tuberculosis (TB)
epidemiologists exploiting both genotyping and epidemiological data. We focus on
spacer oligonucleotide typing (spoligotyping), a genotyping method based on analysis of
a direct repeat (DR) locus. We use mixture models to identify strain families of MTC
based on their spoligotyping patterns. Our algorithm, SPOTCLUST, incorporates
biological information on spoligotype evolution, without attempting to derive the full
phylogeny of MTC. We applied our algorithm to 535 different spoligotype patterns
identified among 7166 MTC strains isolated between 1996 and 2004 from New York
State TB patients. Two models were employed and validated: a 36-component model
based on global spoligotype database SpolDB3, and a randomly initialized model (RIM)
containing 48 components. Our analysis both confirmed previously expert-defined
families of MTC strains and suggested certain new families. SPOTCLUST, which is
available online, can be further improved by incorporating data obtained using additional
strain genetic markers and epidemiological information. We demonstrate on New York
City (NYC) patient data how the resulting models can potentially form the basis of TB
control tools using genotyping.
3
1. Introduction
Tuberculosis (TB) is one of the most widespread infectious diseases in the world,
infecting more than 1 billion persons annually, and has recently been dramatically
expanding due to the HIV/AIDS epidemics and the emergence of multi-drug resistant
Mycobacterium tuberculosis complex (MTC) strains. More than two million people die
each year of TB, despite the fact that it is curable with early detection and prompt
treatment.
Differentiating among various patient isolates and using the data for contact
investigations and epidemiological cluster analysis are major applications for MTC
strains genotyping. Molecular methods may contribute significantly to classical
epidemiological studies, but as MTC genotype databases accumulate data, the tools for
analyzing this information do not keep pace. Rapidly expanding national and
international databases necessitate development of computational methods to analyze and
exploit the large volumes of heterogeneous data. Despite some successful attempts, TB
epidemiologists are still in great need for automated analytical and decision-making tools
for exploiting genotype databases. Our work presents a first step in an ongoing project
dedicated to statistical modeling of MTC genotyping and epidemiological data.
In this work, we focus on the spacer oligonucleotide genotyping (spoligotyping)
method. The spoligotyping assay exploits polymorphisms in spacer sequences found in
the direct repeat (DR) locus in the chromosome of MTC strains (Kamerbeek et al., 1997).
The DR locus consists of well-conserved direct repeats interspersed with unique spacer
sequences. The region comprising the repeat plus the adjacent spacer has been termed the
direct variable repeat (DVR) (Groenen et al., 1993). The order of the spacers was found
4
to be well conserved (van Embden et al., 2000). Currently, 94 different spacer sequences
were identified of which 43 are used for MTC strain differentiation (van Embden et al.,
2000). Spoligotyping differentiates isolates of MTC strains by determining the absence or
presence of the 43 defined spacer sequences. Spoligotyping is a fast, highly reproducible
method, and the genotyping result has a simple binary format, which permits the
exchange of data and facilitates the construction of large collaborative databases (Filliol
et al., 2002; Filliol et al., 2003).
Our analysis builds upon previous research that classified MTC strain isolates into
nine major spoligotyping-based families: Mycobacterium africanum, M. bovis, East
African-Indian (EAI), Beijing, Haarlem, Latin American and Mediterranean (LAM),
Central and Middle Eastern Asian (CAS), a European family X, and a default family T
(Sebban et al., 2002). These nine families were further broken down into 36 subfamilies
in the global database SpolDB3, using visual rules (Filliol et al., 2002). SpolDB3 is a
prominent achievement in the molecular epidemiological studies of TB since the current
version of the database and its subsequent updates (SpolDB4 already exists) represent an
extensive compilation of worldwide diversity of spoligotypes. Groups of related
spoligotypes were interchangeably called (sub)families, (sub)clades, and classes (Filliol
et al., 2002; Filliol et al., 2003). Throughout this paper, we will use the term family for a
collection of strains with related spoligotypes.
Methods for automatically assigning spoligotypes to families are necessary to
fully exploit spoligotypes in TB control. Prior methods for automatic classification of
MTC strains into families based on spoligotyping used a form of supervised classifiers,
decision trees, induced from the DB1 database wherein spoligotypes were labeled by a
5
human expert (Sebban et al., 2002). We attempted to utilize generative mixture models
(Pearl, 1998), a robust form of unsupervised classification that does not require a priori
labeling of the data points. The models, which have not yet been applied for
spoligotyping data, assume that a mixture of some number of probability distributions
“produces” the spoligotyping data. Our unsupervised generative mixture models can both
identify potential MTC strain families and serve as good predictive models for
spoligotype classification. Moreover, this technique can be customized to exploit prior
information on TB causing bacteria.
In epidemiological language, a cluster is defined as two or more isolates obtained
from different patients having identical or nearly identical genotypes. Clustered isolates
have a high probability to be involved in the same chain of recent TB transmission.
Epidemiological links between patients infected with strains of identical genotypes
confirm that these clustered cases are involved in the same recent transmission chain. The
isolates that do not belong to any cluster are often assumed to tentatively indicate the
reactivation of latent infection.
Our study allows global information about TB families to be exploited for local
analysis of patient data. We classify MTC isolates into families that embody different,
but presumably related clustered and unique isolates. While cluster identification, mostly
using IS6110-RFLP method (van Embden et al., 1993), still remains a primary goal of
MTC genotyping, delineating major families within spoligotyping data is developing into
an important part of TB control system. The research group that originated the MTC
strain division into main spoligotyping families, called this technique phylogeographic
classification (Sebban et al., 2002). This method, especially when performed
6
automatically, allows contemplating the global picture of TB dissemination and
suggesting the scenarios of its emergence. The models trained on New York State
database of shared types were applied to New York City (NYC) database containing both
shared and unique types. We evaluated demographic information on the NYC TB
patients infected with MTC strains that belonged to the identified families in the context
of the potential usefulness of distinguishing of these genotyping families for TB control
practices. The analysis showed that dividing TB isolates from large genotype databases
into strain families allows observing general tendencies and revealing some unusual
patterns in the distribution of the patient demographic data. These observations can lead
to suggesting possible scenarios of TB transmission caused by MTC strains from
different families, prompting further molecular epidemiological investigation and
recommending immediate targets for TB control practices.
2. Materials and Methods
We applied our algorithm to 535 spoligotype patterns identified among 7166
MTC strains isolated between 1996 and 2004 from New York State TB patients. Each of
the 535 patterns represented a shared type, i.e. a spoligotype observed in at least two
specimens isolated from different patients.
Our underlying multivariate mixture model assumes that within an MTC strain
family, the spoligotype spacers, or, to be exact, their presence or absence, can be treated
as independent Bernoulli variables, which is the assumption used in the Naïve Bayes
classifier. This classifier has been reported to perform surprisingly well, despite the
deliberately naïve independence assumption (Koller and Sahami, 1997; Baker and
7
McCallum, 1998; McCallum and Nigam, 1998). Two multivariate Bernoulli mixture
models were utilized – a 36-component SpolDB3-based model and a randomly initialized
model (RIM).
It has been hypothesized that the DR locus evolves by deletion of a single or
multiple contiguous DVRs, whereas insertion of DVRs is very unlikely (van Embden et
al., 2000; Aranaz et al., 2004). We have incorporated this knowledge into our algorithm
by introducing “Hidden Parents” into the model.
We used the expectation-maximization (EM) algorithm to find maximum
likelihood (ML) estimates of the mixture model's parameters. Thus, we combined a
Naïve Bayes assumption with the EM algorithm, employing a promising approach in
unsupervised classification (Tsuruoka and Tsujii, 2003).
The performance of the method is greatly dependent on the initialization of the
EM algorithm. The number of families present in the spoligotype data and the probability
distribution for each of them were estimated using the Monte Carlo cross-validation
(MCCV) technique, which was developed to extract as much information from the data
as possible, without any prior knowledge (Smyth, 1996). We used the stability, or
average best match (Hopcroft et al., 2004), and the log-likelihood to choose a final
mixture model. The results were compared to the families that have been identified using
the prototypes extracted from the SpolDB3 database (Filliol et al., 2002). A more detailed
description of the methods used can be found in the Appendix.
Our ultimate goal of designing a decision-making tool for TB control purposes
required fusing information from TB strain genotyping and demographic patient data.
We showed how analyzing patient data by the identified spoligotype families could yield
8
valuable insight into underlying disease trends. We analyzed the NYC spoligotyping
database that comprised isolates collected from January 1, 2001 to July 1, 2004. It
included 220 shared types for 2297 isolates and 389 unique spoligopatterns. Each of these
isolates was annotated with patient’s age, gender, country of birth, and the date of entry
to the United States (US) for foreign-born patients. The NYC database contained
information for patients from 112 countries; we grouped the countries other than the US
into seven geographic regions: Central America, South America, the Caribbean, Europe,
Africa, Central Asia and Middle East (including India), and Far East. Three persons were
born in Canada.
We applied both the SpolDB3-based and randomly initialized models trained on
New York State database to the smaller NYC database, which was, with the exception of
247 orphans and seven shared types, a subset of the former. Orphan spoligotypes were
excluded from the analysis when the models were trained on the New York State
database. However, to test the models, it was appropriate to include them, because one of
our goals was to be able to make inferences about orphan spoligopatterns given
knowledge acquired from studying shared types. Out of 389 orphans in the NYC
database, 126 were present at least twice in the New York State database, thus being
shared types in the latter. Each spoligopattern in the NYC database was assigned to its
most probable family according to the model. We analyzed patients’ age at TB
diagnosis, gender, geographic origin, and time foreign-born patients spent in the US by
the advent of the infection with respect to the identified families.
9

3. Results 3.1. Families identified using SpolDB3-based model
The SpolDB3-based model had 36 components: 32 corresponding to previously
empirically defined families (Filliol et al., 2002) and four added in this study. Figure 1
summarizes the sorted by stability results of our method obtained using this model. Each
among the 533 out of 535 shared types was assigned to one or another among the 36
possible families with probability greater than 0.5. Spoligotypes describing two
remaining shared types, with octal codes designations (Dale et al., 2001)
776377777720771 and 776377777420771, each belonged with approximately equal,
0.44, probability to families Haarlem3 and S, and with probability 0.12 to family T1. It is
worth noting that M. bovis-BCG family contained mostly isolates of M. bovis strains. We
kept the M. bovis-BCG name for the family to stay consistent with the SpolDB3-based
notation (Filliol et al., 2002).
10
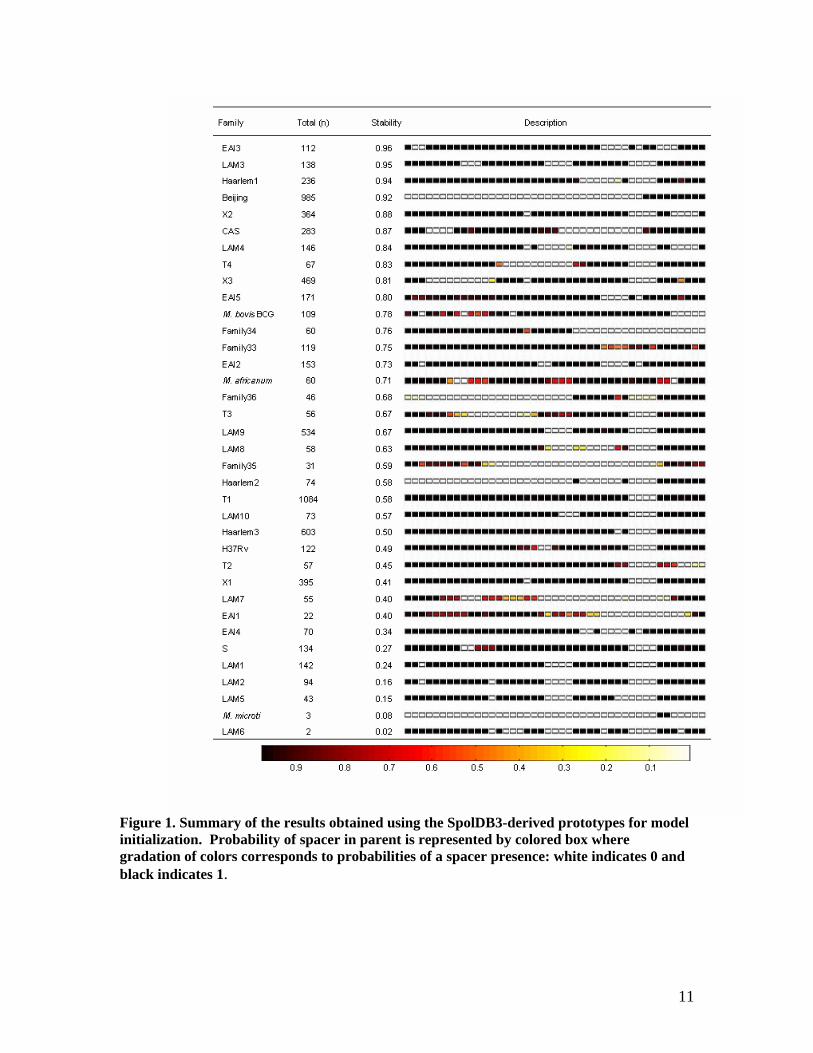
Figure 1. Summary of the results obtained using the SpolDB3-derived prototypes for model initialization. Probability of spacer in parent is represented by colored box where gradation of colors corresponds to probabilities of a spacer presence: white indicates 0 and black indicates 1.
11

We also report the stability values for each of the 36 families, relative to the
families identified by 100 RIMs each having 36 components. When compared to these
100 solutions, 23 families identified by the SpolDB3 model had stability values higher
than 0.5, five families, Haarlem3, H37Rv, T2, X1 and LAM7, had stabilities between 0.4
and 0.5, and the rest, EAI1, EAI4, S, LAM1, LAM2, LAM5, LAM6 and Mycobacterium
microti, were not stable, with stability values below 0.4. Interestingly, the stabilities of
defined in this work families 33 and 34, temporarily numbered so for convenience
purposes, were quite high. Family33 included a shared type of size 22 where only two
spacers, 33 and 34, were absent. This type was recently described as belonging to a clade
MANU (Singh et al., 2004). Family33 appeared to gather spoligotypes with most of the
spacers present and that could not “find” any parent other than the putative, given the
current hypothesis of the evolution of the DR locus by deletion of spacers, common
ancestor, which was a prototype for this family.
Results of recent work on identification of MTC isolates by chromosomal
deletion analysis confirmed the identity of 12 M. africanum strains each having distinct
spoligotype (Parson et al., 2002; Parsons, personal communication). Seven of these 12
spoligotypes were in our training database and six of the seven were correctly identified
using the SpolDB3-based model as being M. africanum. The seventh was placed in
Family35 because of its very unusual for the M. africanum family spoligotyping pattern,
with spacers 10-37 absent. Five strains were absent from our database and therefore were
not used to train the SpolDB3-based model. Of the five, when submitted to
SPOTCLUST, three were correctly identified as M. africanum, and two were assigned to
T2 and Family33, again because their spoligotypes were very different from the
12

SpolDB3-derived definition of family M. africanum. Under the assumption of the
SPOTCLUST and the SpolDB3 expert rules, M. africanum strains belong to more than
one spoligotyping family.
3.2. Families identified using randomly initialized model (RIM)
For the RIM, we needed to determine the number of mixture components. Figure
2 contains the results of the application of the MCCV to our spoligotyping data. The
average test log-likelihoods over 100 different cross-validation partitions are plotted
against the model orders. We have chosen 48 to be the optimal model order, since this
point corresponds to a peak in the average test log-likelihoods. Moreover, after this point
the curve levels off. This indicates that a further increase in the number of parameters
will not significantly improve the log-likelihood (Sugar and James, 2003). We observed
that, on average, the total log-likelihood of a model increases with the stability of the
model. Therefore, out of 100 randomly initialized 48-order mixture models, we chose as
a final solution the one that, when fitted to the data, converged within 300 iterations and
achieved simultaneously the highest total log-likelihood and the highest stability. The 48
families identified by this RIM are reported in Figure 3. Of these 48 families, 35 families
have the average stability values greater than 0.5. Another 13, while they are not stable
(stabilities between 0.1 and 0.5), nevertheless occur in the same content in several other
high-stability and high-log-likelihood models.
Most of the highly stable families identified by the RIM corresponded to the high-
stability families produced using the SpolDB3-derived seeds: EAI3, LAM3, Beijing
(included M. microti), Haarlem1, LAM4, X2, X3, EAI2 and LAM10. Some of the
families split into two. For example, M. africanum spoligotypes formed two distinct
13
families, corresponding to the SpolDB3 prototypes for Afri1 and Afri2-3, respectively.
CAS spoligotypes also split into two stable families, matching the SpolDB3 prototypes
for CAS1 and CAS2. Interestingly, the M. bovis-BCG family was split into two stable
families. Spoligotypes previously placed in Families 33 and 34 formed two stable
families with content almost identical to that of families resulting from the use of the
SpolDB3 seeds. Several SpolDB3-derived families merged. The largest of them was the
0.71-stability value family comprising spoligotypes labeled as belonging to T1,
Haarlem3, X1 and H37Rv. Similarly, members of several LAM families aggregated into
one family with stability value 0.77. Spoligotypes labeled as coming from the EAI4
family and some EAI5 spoligotypes also formed one stable family. Family S was
reproduced nicely by the RIM, but with a low stability. Haarlem3-labeled spoligotypes
formed a separate family only if spacers 29-31 and 33-36 were absent simultaneously.
Several medium- and low-stability sets, which we could only tentatively call families,
contained a few shared types or only a single one.
14
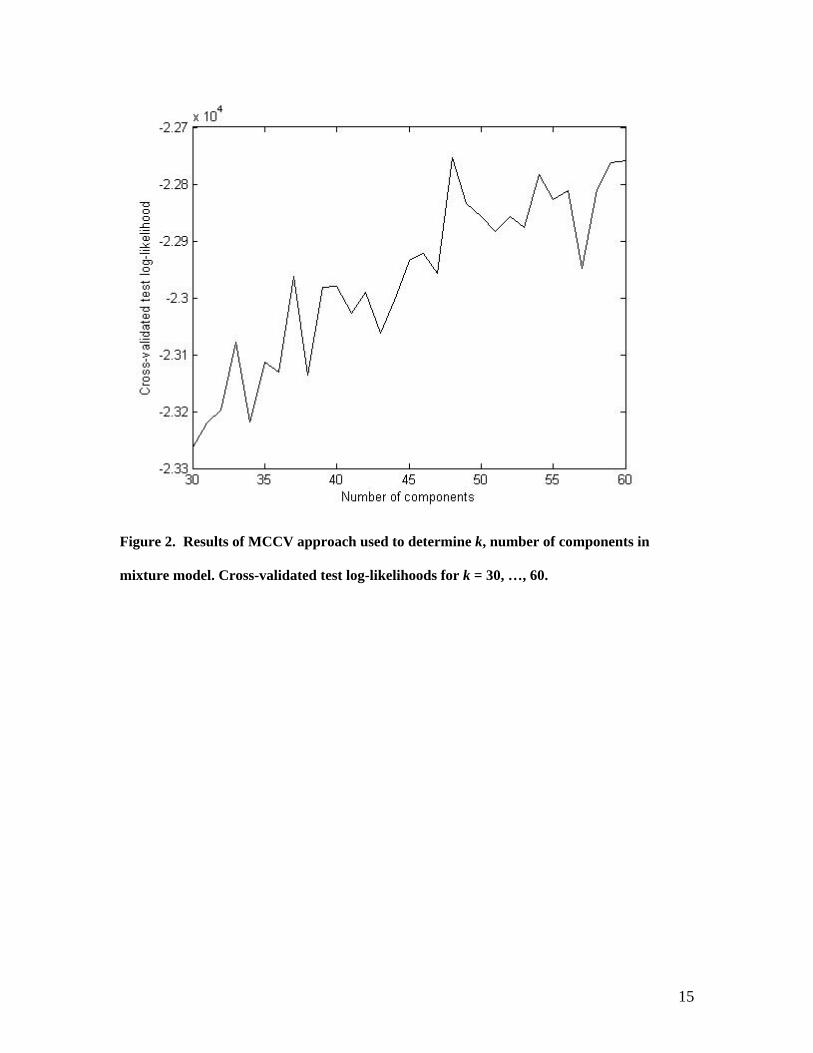
Figure 2. Results of MCCV approach used to determine k, number of components in
mixture model. Cross-validated test log-likelihoods for k = 30, …, 60.
15
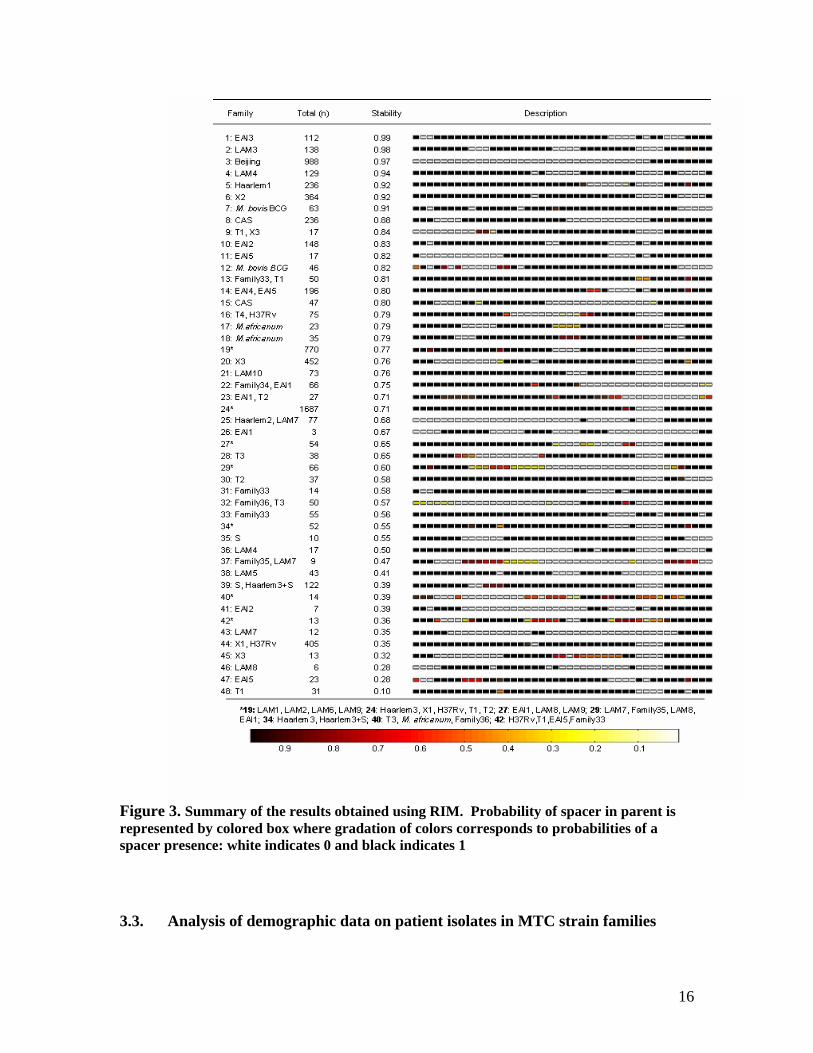
Figure 3. Summary of the results obtained using RIM. Probability of spacer in parent is represented by colored box where gradation of colors corresponds to probabilities of a spacer presence: white indicates 0 and black indicates 1
3.3. Analysis of demographic data on patient isolates in MTC strain families
16
We present results of the data analysis for the NYC patients whose MTC isolates
constitute the 15 most stable strain families identified by the SpolDB3-based model:
EAI3, LAM3, Haarlem1, Beijing, X2, CAS, LAM4, T4, X3, EAI5, M. bovis-BCG,
Family34, Family33, EAI2, and M. africanum. Since the prototypes for the SpolDB3-
based families were previously defined (Filliol et al., 2002) and most of these major
spoligotyping families have been previously characterized by several research groups
(Sebban et al., 2002), we limited our discussion to families identified using the SpolDB3-
based model. Besides, the high stabilities of these families signify that the RIM identified
them in the same content as the SpolDB3-based model.
Analysis of data on US-born and foreign-born individuals showed that the
dynamics of transmission of MTC isolates within these two groups of patients varied by
the identified families. In the NYC database, TB cases among foreign-born persons
prevailed over US-born infected persons (72% versus 28%, respectively). If we compare
the number of patients belonging to these groups by distribution of their MTC isolates in
different strain families, it becomes evident that the spoligotyping families are valuable in
apprehending distinctive trends in TB dissemination. Figure 4 shows the variation in the
number of US- and foreign-born patients in different MTC strain families. In the majority
of families (11/15), isolates from foreign-born patients clearly prevailed. The histograms
for three families, X2, X3 and LAM4, demonstrate the predominance of US-born
patients; in LAM4, this prevalence is particularly strong. The small family T4 comprises
roughly equal number of strains isolated from patients born inside and outside the US.
The groups comprising US- and foreign-born patients can be divided into
subgroups of clustered and unique cases. A cluster was defined as a set of two or more
17
isolates from different patients possessing identical genotypes in the NYC database. In
other words, each cluster is a shared type observed in the NYC database of MTC strains
isolated from 2001 to 2004. Spoligotypes that have no match in the NYC database are
defined as non-clustered, or unique. However, they are unique given the NYC database
only; other databases may have more than one occurrence of these spoligotypes.
Distinguishing clustered and unique cases was of our interest for two reasons. First, it is
widely assumed that clustered cases are more likely to be directly or indirectly involved
in the same chain of TB transmission, while unique cases are more likely to be
reactivation of latent infection (Braden et al., 1997). The second reason was that when a
unique genotype is detected, it is difficult to make a plausible suggestion on its origin.
When the unique isolate belongs to a particular family, we can draw inferences about this
case based on the information about other strains in the family.
18
0102030405060
EAI3
Num
ber o
f iso
late
s
0102030405060
LAM3
01020304050607080
Haarlem1
050
100150200250300350
Beijing
0102030405060
X2
Num
ber o
f iso
late
s
0
20
40
60
80
100CAS
0102030405060
LAM4
0102030405060
T4
01020304050607080
X3
Num
ber o
f iso
late
s
0102030405060
EAI5
0102030405060
M. bovis-BCG
0102030405060
Family34
0102030405060
Family33
Num
ber o
f iso
late
s
0102030405060
EAI2
0102030405060
M. africanum
US-born clustered
US-born unique
non-US-born clustered
non-US-born unique
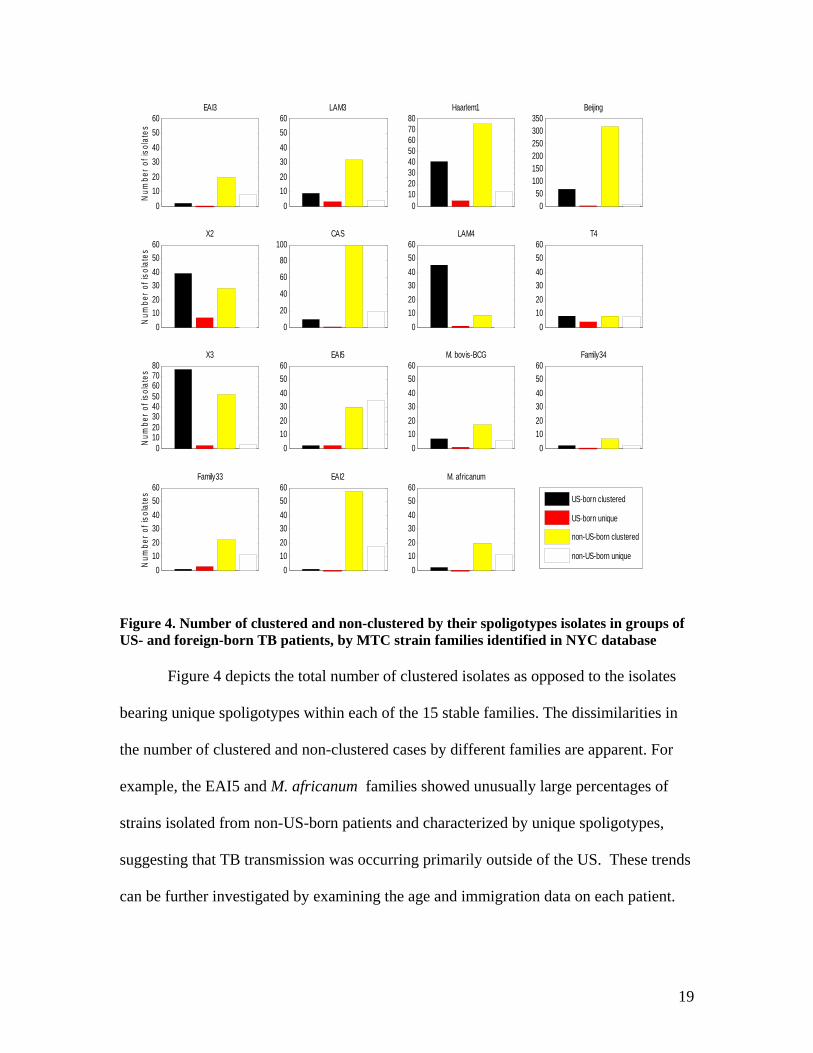
Figure 4. Number of clustered and non-clustered by their spoligotypes isolates in groups of US- and foreign-born TB patients, by MTC strain families identified in NYC database
Figure 4 depicts the total number of clustered isolates as opposed to the isolates
bearing unique spoligotypes within each of the 15 stable families. The dissimilarities in
the number of clustered and non-clustered cases by different families are apparent. For
example, the EAI5 and M. africanum families showed unusually large percentages of
strains isolated from non-US-born patients and characterized by unique spoligotypes,
suggesting that TB transmission was occurring primarily outside of the US. These trends
can be further investigated by examining the age and immigration data on each patient.
19
0
20
40
60EAI3
Num
ber o
f iso
late
s0
20
40
60LAM3
0
20
40
60Haarlem1
0
50
100
150
200
250Beijing
0
20
40
60X2
Num
ber o
f iso
late
s
0
20
40
60
80
100CAS
0
20
40
60LAM4
0
20
40
60T4
0
20
40
60
80X3
Num
ber o
f iso
late
s
0
20
40
60EAI5
0
20
40
60M. bovis-BCG
0
20
40
60Family34
0
20
40
60Family33
Num
ber o
f iso
late
s
0
20
40
60
80EAI2
0
20
40
60
80M. africanum
US Canada Central America South America Caribbean Europe Africa Central Asia/Middle East Far East
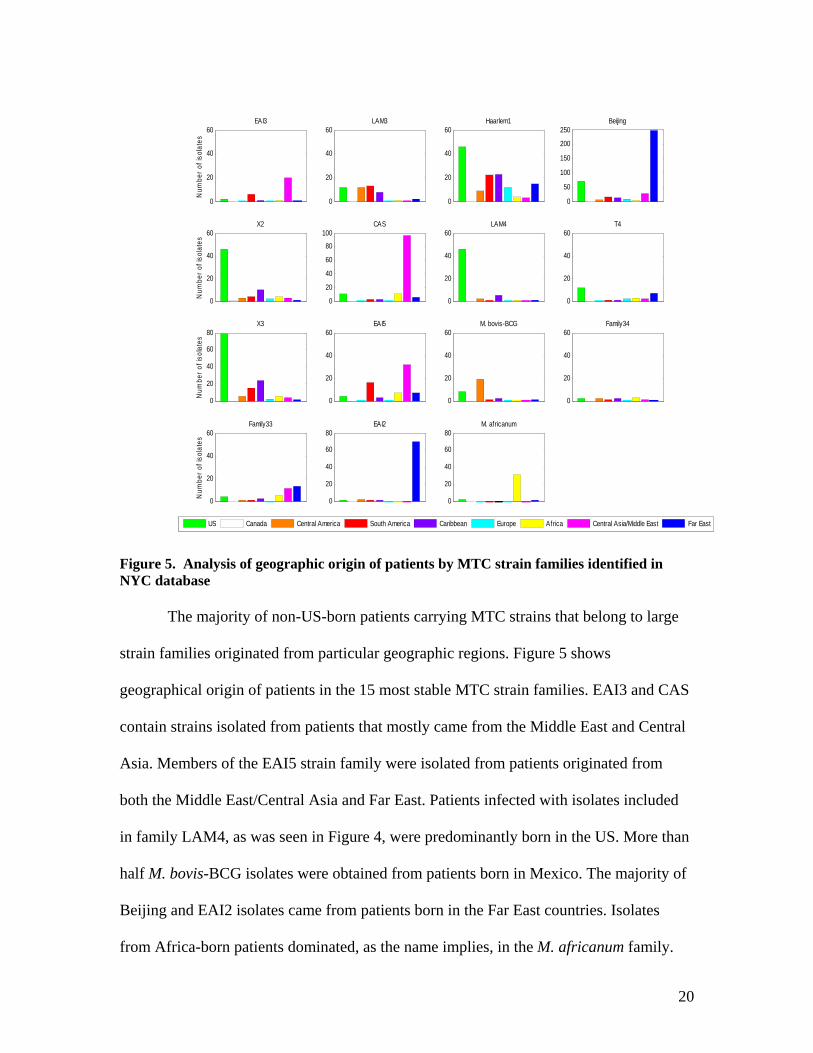
Figure 5. Analysis of geographic origin of patients by MTC strain families identified in NYC database
The majority of non-US-born patients carrying MTC strains that belong to large
strain families originated from particular geographic regions. Figure 5 shows
geographical origin of patients in the 15 most stable MTC strain families. EAI3 and CAS
contain strains isolated from patients that mostly came from the Middle East and Central
Asia. Members of the EAI5 strain family were isolated from patients originated from
both the Middle East/Central Asia and Far East. Patients infected with isolates included
in family LAM4, as was seen in Figure 4, were predominantly born in the US. More than
half M. bovis-BCG isolates were obtained from patients born in Mexico. The majority of
Beijing and EAI2 isolates came from patients born in the Far East countries. Isolates
from Africa-born patients dominated, as the name implies, in the M. africanum family.
20
0 20 40 60 80 1000
20
40
60
80
100EAI3
Tim
e
0 20 40 60 80 1000
20
40
60
80
100LAM3
0 20 40 60 80 1000
20
40
60
80
100Haarlem1
0 20 40 60 80 1000
20
40
60
80
100Beijing
0 20 40 60 80 1000
20
40
60
80
100X2
Tim
e
0 20 40 60 80 1000
20
40
60
80100
CAS
0 20 40 60 80 1000
20
40
60
80100
LAM4
0 20 40 60 80 1000
20
40
60
80100
T4
0 20 40 60 80 1000
20
40
60
80
100X3
Tim
e
0 20 40 60 80 1000
20
40
60
80
100EAI5
0 20 40 60 80 1000
20
40
60
80
100M. bovis-BCG
0 20 40 60 80 1000
2040
6080
100Family34
Age
0 20 40 60 80 1000
20
40
60
80100
Family33
Age
Tim
e
0 20 40 60 80 1000
20
40
60
80100
EAI2
Age0 20 40 60 80 100
0
20
40
60
80100
M. africanum
Age
US Canada Central America South America Caribbean Europe Africa Central Asia/Middle East Far East
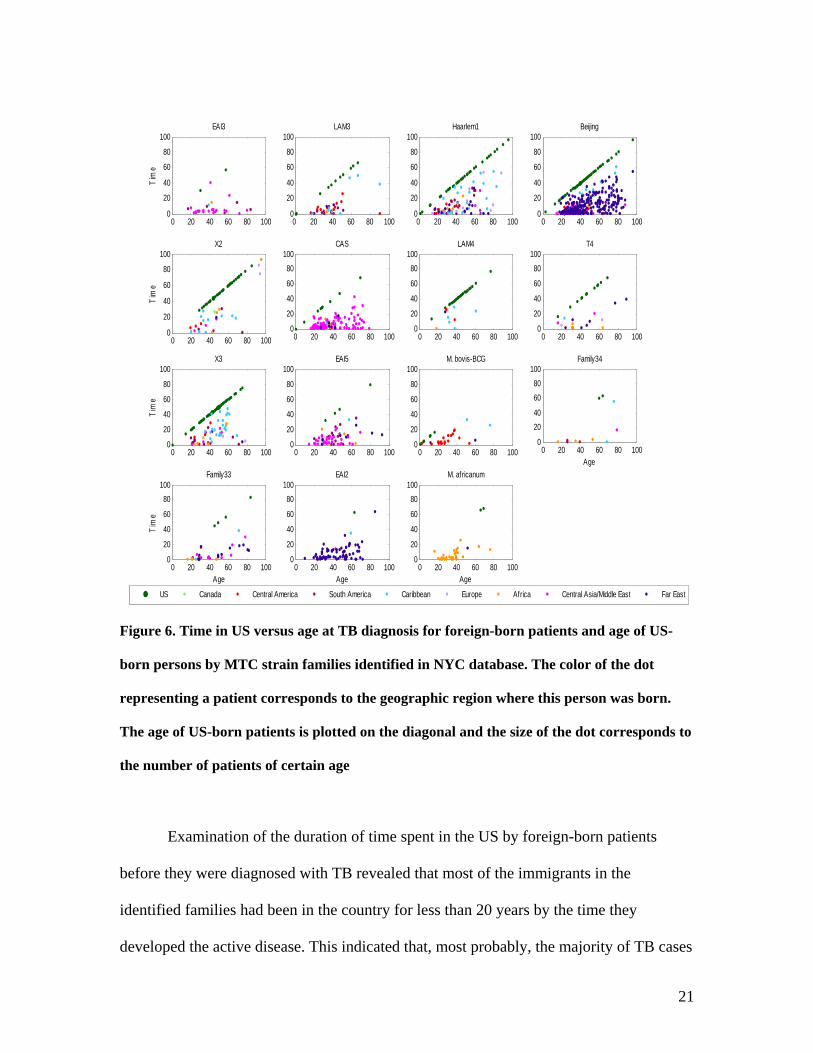
Figure 6. Time in US versus age at TB diagnosis for foreign-born patients and age of US-
born persons by MTC strain families identified in NYC database. The color of the dot
representing a patient corresponds to the geographic region where this person was born.
The age of US-born patients is plotted on the diagonal and the size of the dot corresponds to
the number of patients of certain age
Examination of the duration of time spent in the US by foreign-born patients
before they were diagnosed with TB revealed that most of the immigrants in the
identified families had been in the country for less than 20 years by the time they
developed the active disease. This indicated that, most probably, the majority of TB cases
21
among the foreign-born persons happened due to reactivation of the latent infection,
which was previously shown for NYC (Geng et al., 2002) and Massachusetts
(Sharnprapai et al., 2002). Figure 6 shows the age and the time spent in the US by the
advent of TB by the immigrants from different geographic regions. The age and number
of US-born persons carrying MTC strains that belongs to the families are also shown.
This figure allows examining the overall distribution of MTC strain families by
geographic regions. Analysis of such families as M. africanum, CAS and EAI showed
that most non-US-born patients have been in the country for less than 20 years and each
came from a particular geographic region. This suggested that the patients acquired their
infections before they came to the US (Geng et al., 2002). In contrast, analysis of the
Beijing and Haarlem1 families showed that many of the foreign born patients, but not the
majority of them, of various ages have been in the country for more than 20 years. These
infections may have been acquired in the US or, alternatively, strains from these families
possess higher ability to host adaptation (Hirsh et al., 2004). The LAM4 family,
comprising largely the isolates from US-born patients, obviously manifested the spread of
TB in NYC. The X3 family included a group of the isolates mainly from Caribbean
immigrants aged over 40 years, which have been in the US for at least 20 years. In this
set, 12 persons were infected with the strain of the same spoligotyping pattern, which
may be indicative of a recent outbreak among these long-time US residents.
Alternatively, they all could have acquired the infection abroad and carried it for a long
time before developing active TB. We can observe from Figure 6 that in NYC, on
average, foreign-born TB patients are younger than US-born. Note that patients infected
22
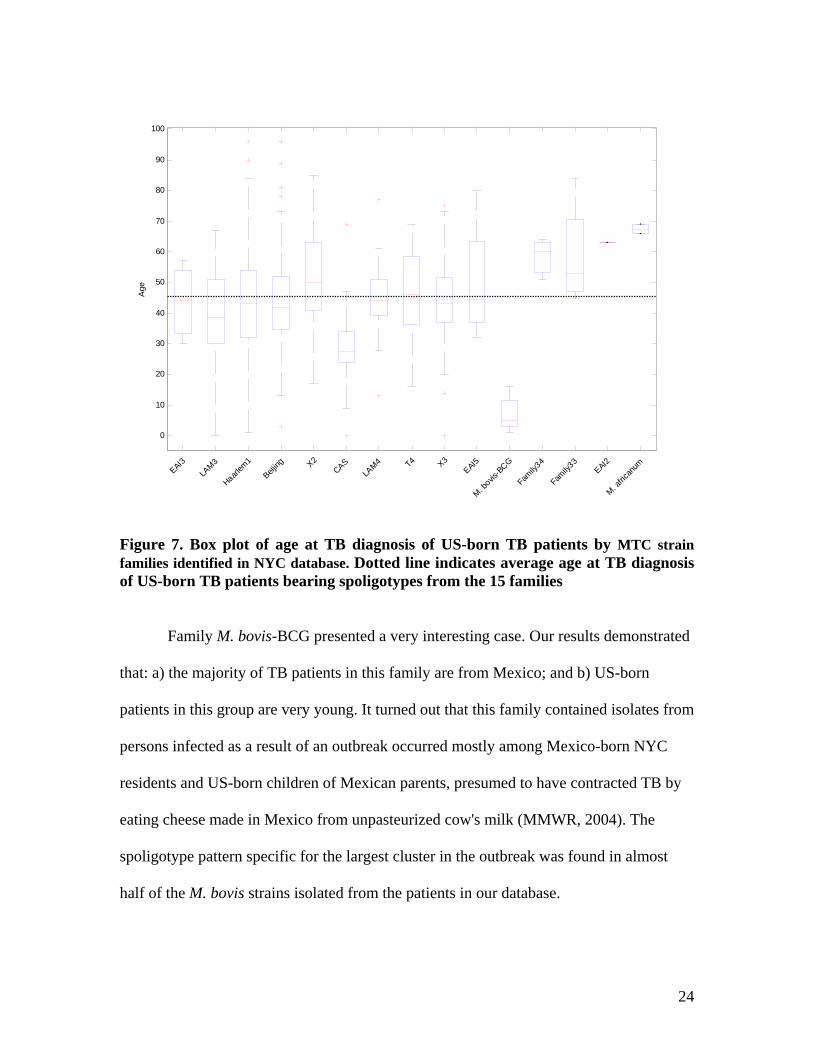
with M. bovis-BCG strains are unusually young, which is demonstrated in more details in
Figure 7.
Ordinarily, it is easier to elucidate the dynamics of TB transmission among US-
born patients than among foreign-born (Geng et al., 2002); therefore, it is more
informative to assess the age distribution among US-born than foreign-born patients. The
age of non-US-born patients, especially born in countries with high incidence rate of TB,
was skewed by the age of which the patients immigrate to the US and might not reflect a
real trend in the dissemination of TB. Figure 7 allows us to examine the age of US-born
persons infected by the MTC strains that belong to the 15 stable families. Some families,
such as CAS and M. bovis-BCG, contained isolates from unusually young US-born
individuals, which suggested further investigating of these groups.
23
0
10
20
30
40
50
60
70
80
90
100A
ge
EAI3LA
M3
Haarlem
1
Beijing X2
CASLA
M4 T4 X3EAI5
M. bovis
-BCG
Family3
4
Family3
3EAI2
M. afric
anum
Figure 7. Box plot of age at TB diagnosis of US-born TB patients by MTC strain families identified in NYC database. Dotted line indicates average age at TB diagnosis of US-born TB patients bearing spoligotypes from the 15 families
Family M. bovis-BCG presented a very interesting case. Our results demonstrated
that: a) the majority of TB patients in this family are from Mexico; and b) US-born
patients in this group are very young. It turned out that this family contained isolates from
persons infected as a result of an outbreak occurred mostly among Mexico-born NYC
residents and US-born children of Mexican parents, presumed to have contracted TB by
eating cheese made in Mexico from unpasteurized cow's milk (MMWR, 2004). The
spoligotype pattern specific for the largest cluster in the outbreak was found in almost
half of the M. bovis strains isolated from the patients in our database.
24
Different research groups consistently observed that among TB patients, males
significantly prevailed over females (Liu et al., 1998; Salihu et al., 2001; Talbot et al.,
2000). Salihu et al. (2001) showed that males were approximately twice at the risk for the
disease than females. Overall, the NYC TB patient demographic data were in accordance
with this finding. Among the identified strain families, only M. bovis-BCG is of interest
in the context of patient gender distribution, since it contained approximately equal
number of persons of both genders. This reflected the fact that the majority of persons
infected by strains from this family were young, which was in accordance with an
ascertainment that from the birth and up to the age of 24, there is no difference in TB risk
by gender (Salihu et al., 2001).
4. Discussion
4.1. SpolDB3-based model
The initial mixture components, derived from the international spoligotyping database
SpolDB3, were based on visual inspection of the spoligotype profiles by a human expert
(Sebban et al., 2002); therefore, they fitted the structure of the data well. The algorithm
was forced to identify the manually defined MTC strain families. To evaluate the bias in
the identification of these families, we randomly initialized 100 36-component models
and compared the resulting families with each of the SpolDB3-based families. Out of the
36 SpolDB3-based families, 15 had stability greater than 0.7. A SpolDB3-defined family
was reported as stable if it was reproduced in the identical content by the majority of 100
36-component RIMs. In other words, the stability value for a family represents the
frequency with which our algorithm finds this family, given that it has initially no
25

knowledge about the existent families, except their total number, 36. The stability is of
our importance because we try to minimize the human input into the spoligotyping data
analysis, and this value helps us to assess our efforts. High stability value of a SpolDB3-
based family means that the family is well reproducible by our algorithm; low manifests
that the algorithm is unable to consistently identify the family. Low stability indicates
that either the family is not well defined or the algorithm needs to be improved. Both of
these factors may influence the results as well. We observed that SPOTCLUST does
quite a good job of finding the expert-defined families, not without some exceptions,
however, which we will discuss shortly.
Use of the Bernoulli mixture model with Hidden Parent, as opposed to the model
without the Hidden Parent, resulted in biologically more correct families, because the
child spoligotype was allowed to have some spacers lost but not gained, reflecting
currently widely accepted hypothesis on evolution of the DR locus. In fact, with the
exception of a few shared types, the spoligotypes in the 36 families were legitimate
children of their expert-defined prototypes. In general, SPOTCLUST includes each
spoligotype in the closest family, complying with the hypothesis of losing spacers by the
DR locus as it evolves. Upon including new spoligotypes in a family, SPOTCLUST
changes the parameters of the family’s Hidden Parent to accommodate for the existence
of the new members, thus predicting a new, legitimate to all of the family members,
Hidden Parent. The Hidden Parent is not a spoligotype, but a probabilistic entity. A real
spoligotype can, of course, represent the Hidden Parent. Most of the SpolDB3-based
families contain a spoligotype that could be considered ancestral to the rest of the
members. For example, in the family LAM10, the pattern with octal code
26

777777743760771 is parental to other spoligotypes that only miss spacers compared to
this parent. Some families only have a hypothetical parent.
SPOTCLUST, with random initialization, did not identify several of the
SpolDB3-based families as distinct ones. Some SpolDB3-based families had low
stabilities. Since some of the SpolDB3-derived prototypes were children or parents of
other prototypes, the randomly initialized EM did not always distinguish these families.
Families such as X1, H37Rv, S, EAI2, T2 and Haarlem3, had low, less than 0.5, stability
values, relative to the randomly initialized 36-order models. Even when the EM
algorithm was randomly initialized with a 100-component model, these families merged
into a single family whose Hidden Parent would be a spoligotype exactly matching the
prototype for family T1 (data not shown). In general, the higher the number of the
components in the model, the harder EM tries to divide large families into smaller ones;
therefore, the fact that the families are not separated in a 100-component model serves as
an indication that, according to our method, these families comprise one big family.
Most of the spoligotypes in the T families had many spacers missing relative to
their respective initial SpolDB3-derived prototypes, which were further modified by EM
to become the corresponding Hidden Parents. Some of the spoligotypes included in
family T1 matched the prototype for family T2, a not surprising result since the prototype
for T2 is the child of T1. The T family is currently considered "ill-defined" (Duchêne et
al., 2004); therefore, we were unable to create models that discriminated well among its
members.
Our results suggested that some of the SpolDB3-based prototypes were redundant
and should be restated for use in the context of our approach, perhaps in a hierarchical
27
fashion. When 36-order models were randomly initialized to identify strain families,
spoligotypes from all of the LAM families, except LAM3 and LAM4, merged into one
family composed of children of LAM9. The LAM3 family was very stable, probably
because there were enough almost identical shared types to form this distinct set. The M.
microti family contained only one shared type wherein all spacers, except 37 and 38,
were present. This family had a very low stability, since in the randomly initialized 36-
order model the M. microti shared type was always included in the Beijing family. This
happened because the prototype for Beijing family was a parent for the M. microti’s
prototype. Spoligotypes that had been placed in families EAI1 and EAI2 by the
SpolDB3-based model were mixed with spoligotypes from other families when the model
was initialized randomly; therefore, the stabilities of EAI1 and EAI2 were low. A further
analysis to determine what exactly constitutes a family is needed.
4.2. Randomly initialized model (RIM)
Finding the optimal number of different groups in data, without any prior
information, presents a rather challenging problem with no single answer. The solution
depends highly on the algorithm used, the model initialization, the data characteristics,
and the definition of the "optimality" itself (Smyth, 1996). Using the MCCV approach to
determine the number of distinct families in our spoligotyping data, we have concluded
that 48 represented a reasonably good number of components in the model. The highest
total log-likelihood and the total stability were criteria for validation of our algorithm. We
considered the final model to be the one with parameters best fitting our data. It should be
noted, however, that because our method employs probabilistic models, the correct
28
number of families, corresponding to the number of components in the mixture model,
and the parameters of the mixture components do not exist as single numbers, but instead
each vary within a certain range. We do not claim that there are exactly 48 spoligotyping
families; we show only that in the context of our model definition this number reflects
well the structure of the data. The solution that we report here should be considered as
probabilistically good, given our choice of method.
The majority of the stable families identified by the SpolDB3-based model were
also identified by the RIM (Figure 3). Some of the SpolDB3-defined families merged into
one family and thus could be considered to have potentially independently evolved from
the same ancestral strain. This is the same conclusion that we had made upon the analysis
of the SpolDB3-based families and their stability. Our conclusions again concurred with
the previous reporting of the T families as poorly defined (Duchêne et al., 2004). Taken
together, this indicates that, if we are to preserve the SpolDB3 recognition rules, the
Hidden Parent model may need to be refined, possibly by introduction of a hierarchy
concept into the model or by separately identifying subfamilies within certain big
families. Some novel families, such as N9, N13, N14, N16, N19, N22, N23 and N24,
revealed by newly defined Hidden Parents, were stable. Appearance of small families
may be due to the current lack of genotyped MTC strains, even though most of the
samples in our collection were from NYC, whose TB patient population is one of the
most diverse in the US.
We can conclude that RIM distinguishes the major spoligotyping families well,
while suggesting some new families whose validity needs to be further examined.
29
The fact that some of the families identified by SPOTCLUST are not stable
suggests room for further refinement of the model. One possible improvement of our
algorithm is the incorporation of interdependencies of spacers. Results of previous work
suggested that the deletion of contiguous DVR sequences does not occur sequentially, but
rather by a single loss of several adjacent DVRs, which severely complicates the use of
spoligotypes for deriving of MTC phylogeny (Warren et al., 2002). There is evidence that
Beijing spoligotype appeared as a result of a single event, which was a simultaneous
deletion of 34 contiguous DVRs from the DR locus initially having all spacers present.
Also, some spacers, for example, 33-36, are simultaneously absent in most patterns, a
characteristic which may indicate interaction of these spacers. Another complication
arises if some spacers have been lost independently in distinct families, which resulted in
convergent spoligotypes. Moreover, certain spacers may be present but undetected by
spoligotyping due to particular IS6110 insertions (Morkousov et al., 2002). We should,
therefore, consider these factors when inferring the parent-child relationships of
spoligotypes.
4.3. NYC patient data analysis
To show how the MTC strain families, identified by SPOTCLUST within New
York State database, could be potentially used for TB control practices, we identified
these families within the NYC spoligotype database and analyzed demographic data on
NYC TB patients infected with these strains, which were isolated from January 1, 2001
to July 1, 2004.
30
The spoligotype families have been successfully used for analysis of global TB
epidemiology and molecular evolution of MTC strains (Filliol et al., 2002; Sola et al.,
2005). Assessment of the biogeographic specificity associated with the strain families has
shown that some major spoligotyping families prevailed throughout the world and others
were specific to particular regions (Sola et al., 2001). Similarly, we observed that isolates
from spoligotyping families such as CAS, Beijing, EAI3, EAI2, X3, M. bovis-BCG and
M. africanum, predominated for patients from particular geographical locations, while
other families contained isolates from patients originated in different regions.
Our results demonstrated that the majority of TB cases reported between 2001 and
2004 in NYC occurred predominantly among foreign-born persons. This correlated with
a prior ascertainment that in NYC TB affected mostly foreign-born population (Talbot et
al., 2000). Our study corroborates previous observation that US-born patients are more
likely to belong to a cluster than foreign-born persons infected with TB (Sharnprapai et
al., 2002; Seidler et al., 2004). On average, isolates from non-US-born patients contained
more shared spoligotypes than those from US-born patients within the same strain family.
In addition, families CAS, EAI2, EAI5 and M. africanum, where isolates from foreign-
born persons absolutely predominated, contained significant number of non-clustered
isolates. Clustering is often assumed to indicate recent transmission of TB, while
appearance of unique genotyping patterns suggests reactivation of latent infection
(Braden et al., 1997). Many different and often hard to track factors contribute to TB
occurrences (Jasmer et al., 1999); therefore, it is crucial to be very careful about making
these assumptions based solely on genotyping (spoligotyping) data. For example, recent
transmission may be underestimated when isolates from young patients are studied, and
31
overestimated in the case of older individuals (Vynnycky et al., 2001). Several studies
have shown that clustering of spoligopatterns alone does not provide sufficient evidence
of recent TB transmission (see, for example, Ellis et al., 2002), particularly due to the fact
that structure of the M. tuberculosis chromosomal DR region can undergo convergence,
demonstrating identical patterns of deleted spacers in strains originated from different
parents.
We can definitely recognize some interesting patterns in the analyzed families and
make suggestions on the associated TB dynamics. Thus, while the majority of the
families contained isolates from mostly foreign-born patients, in several identified
families US-born persons largely predominated. Clustered isolates within these families,
LAM4, X2 and X3, are probably indicative of recent transmission. Unusually high
number of unique isolates in family EAI5, taking together with the observation that these
isolates were obtained from patients aged mostly from 20 to 50, with median age 39, and
originated from different geographic regions, strongly suggests multiple cases of
reactivation of latent TB infection. Family M. bovis-BCG comprised isolates from
anomalously young persons and was strongly suggested to result from a recent outbreak
confirmed by genotyping data and identified epidemiologic links (MMWR, 2004).
Average age of foreign-born patients, lower than that of US-born persons, higher
variations in number of shared types (data not shown), and larger number of unique
isolates among foreign-born persons suggested that most of these TB cases were due to
imported TB infection. This is consistent with the previous finding that imported
infection, either active or latent, is the cause of majority of TB cases among foreign-born
persons in the US (Zuber et al., 1997). It has been shown previously that a possibility of
32
acquiring TB in the US is much higher for non-US-born persons who have been in the
country for over 20 years (Sharnprapai et al., 2002). However, immigrants from countries
with high TB incidence rates can develop active disease even after having lived in the US
for over 20 years (Zuber et al., 1997).
The models developed in present study assign strains with unique spoligotypes to
the identified families, allowing the associated patient data to be assessed with respect to
the known demographic characteristics of patients on the basis of the strain family. The
patient demographic data on the NYC isolates in the spoligotype families identified by
SPOTCLUST give an indispensable perspective on these families, offering insights that
could not be observed if we were to take a traditional approach of cluster detection. Our
results allowed revealing unsuspected trends in the TB infection spread, suggesting
possible scenarios of dissemination of the disease, which could be potentially used to
direct efforts in TB control.
5. Conclusions
This work presents a new probabilistic modeling approach to the identification of
the MTC strain families based on spoligotyping data and gives example of how such
models can be used to examine trends in patient demographic data. While the expert-
based rule approach can be accurate, as the amount and diversity of data become
overwhelmingly large and the human capacity of data processing is exceeded, efficient
computational methods are required to facilitate TB control. Our results, based on the
spoligotype analysis using mixture models, confirmed the reliability of the MTC families
previously defined empirically and identified new MTC strain families of potential
33

epidemiological value. These first results are promising, although they indicate the
limitations of the proposed approach, which call for further elaboration of SPOTCLUST,
along with the more profound definition of families of MTC bacteria inferred from data
generated using multiple genotyping techniques. We believe that general approach
described here has a potential to develop into a more robust and biologically sound
method. Results of initial analysis performed on the patient demographic information
according to the MTC strain families illustrated the potential for combining strain
genotyping and demographic data. Future work will concentrate on developing methods
for merging probabilistic models for spoligotyping and other MTC genotyping methods,
such as mycobacterial interspersed repetitive units (Mazars et al., 2001; Supply et al.,
1997; Supply et al., 2001) and IS6110-based restriction fragment length polymorphism
(van Embden et al., 1993) analyses, with traditional epidemiological data.
Ultimately, our goal is to promote active and mutually beneficial collaboration
aimed towards control of infectious diseases, using molecular methods of analysis,
among TB controllers and biological and computational scientists. To this end, we have
made it possible for users to submit their data to SPOTCLUST
(http://www.rpi.edu/~bennek/EpiResearch). We hope that this will generate comments
and suggestions from scientists with spoligotyping data of their own.
34
Acknowledgements
The authors thank Linda Parsons, PhD for providing information on M. africanum strains. This research study was funded by Rensselaer Polytechnic Institute.
Appendix Probabilistic framework
The adopted probabilistic framework assumes that a multivariate Bernoulli
mixture model generates the data, and that there is a one-to-one correspondence between
mixture model components and spoligotype families (Everitt and Hand, 1981). Bernoulli
distribution is simple, with two possible outcomes – “success” and “failure”, which
happen with probabilities and p p−1 , respectively. Therefore, each of the 43
spoligotype’s positions is a Bernoulli distribution described by the parameter . The
whole spoligotyping pattern is modeled as a multivariate Bernoulli distribution with 43
parameters , which are independent, given the family. The multivariate Bernoulli
models for different spoligotyping families are “mixed” in some proportions into one
mixture model.
p
p
Let X be a set of spoligotypes that we want to divide into families. Each
spoligotype is a binary 43-dimensional vector: },,{ 431 xxx = . Let C be a mixture
model, which consists of components: k },,{ 1 kccC = . Each mixture component
is described by parameters Cc j ∈ jθ , which are the mixing weight of the component,
, and a 43-variable Bernoulli distribution. The mixing weights, or proportions,
satisfy the following constrains:
)( jcP
35
∑=
=k
jjcP
1
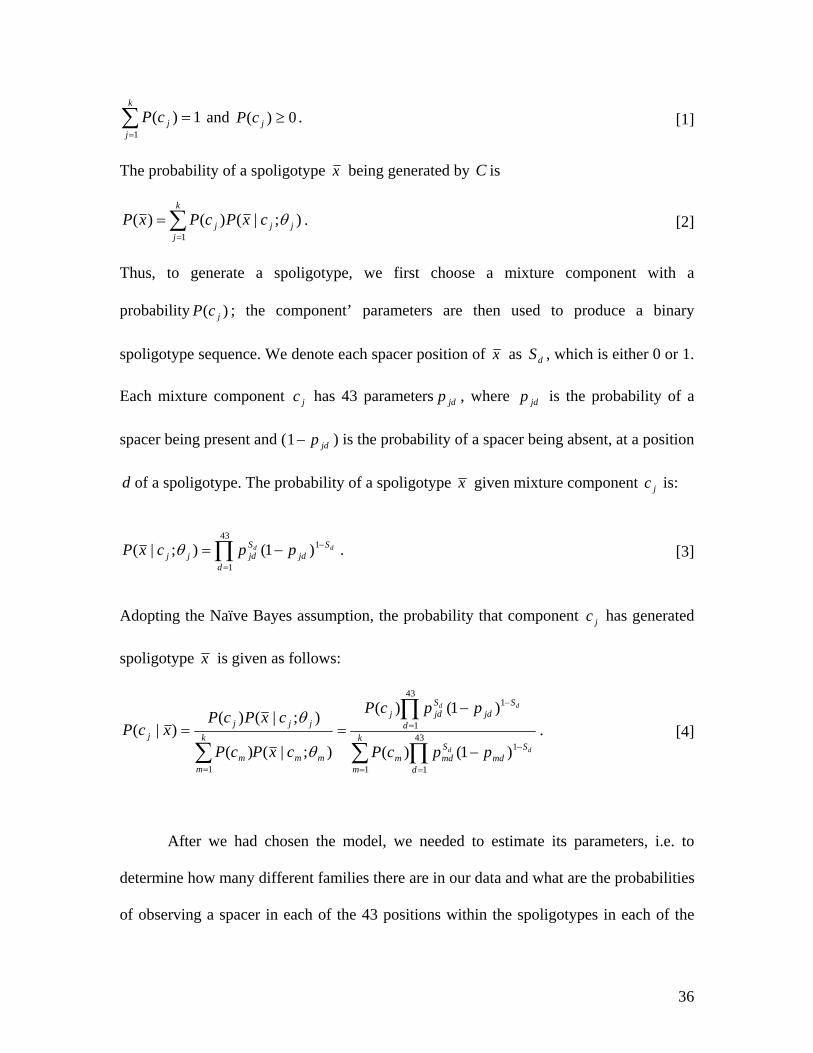
1)( and . 0)( ≥jcP [1]
The probability of a spoligotype x being generated by C is
∑=
=k
jjjj cxPcPxP
1
);|()()( θ . [2]
Thus, to generate a spoligotype, we first choose a mixture component with a
probability ; the component’ parameters are then used to produce a binary
spoligotype sequence. We denote each spacer position of
)( jcP
x as , which is either 0 or 1.
Each mixture component has 43 parameters , where is the probability of a
spacer being present and ( ) is the probability of a spacer being absent, at a position
of a spoligotype. The probability of a spoligotype
dS
jc jdp jdp
jdp−1
d x given mixture component is: jc
∏=
−−=43
1
1)1();|(d
Sjd
Sjdjj
dd ppcxP θ . [3]
Adopting the Naïve Bayes assumption, the probability that component has generated
spoligotype
jc
x is given as follows:
∑ ∏
∏
∑= =
−
=
−
=
−
−== k
m d
Smd
Smdm
d
Sjd
Sjdj
mm
k
mm
jjjj
dd
dd
ppcP
ppcP
cxPcP
cxPcPxcP
1
43
1
1
43
1
1
1)1()(
)1()(
);|()(
);|()()|(
θ
θ. [4]
After we had chosen the model, we needed to estimate its parameters, i.e. to
determine how many different families there are in our data and what are the probabilities
of observing a spacer in each of the 43 positions within the spoligotypes in each of the
36

families. The parameters for finite mixture models are often estimated by the ML
approach. EM is the most commonly used algorithm for finding ML estimates of the
parameters of the underlying distributions.
The EM algorithm
EM is a class of iterative algorithms for ML estimation useful for a variety of
problems with incomplete data (Dempster et al., 1977). In our case, the data are
considered incomplete because the family for each spoligotype is unknown. Each
iteration of the algorithm involves two steps, the expectation (E-) step and the
maximization (M-) step. In the E-step, the expected values of the missing data, given the
observed data and the current parameter estimates, are computed so as to maximize the
total log-likelihood. In the M-step, the expected values of the missing data computed in
the E-step are used to re-estimate the parameters and to update the total log-likelihood.
The steps are iterated until the difference between current and subsequent estimates is
small.
Let },,{ 1 nxxX = be a collection of spoligotypes. The number of
components in a mixture model with parameters
n
C Θ is . The total log-likelihood
function of the parameters Θ is
k
);|()(log)|(1 1∑ ∑= =
=Θn
i
k
jjjij cxPcPXL θ . [5]
Iterating between the E- and M-steps results in non-decreasing sequence of values
for the total log-likelihood. If EM is initialized from a "non-pathological" starting point,
the algorithm will always achieve a proper stationary point of the log-likelihood
(Carreira-Perpinan and Renals, 1999).
37
Multivariate Bernoulli model with Hidden Parent
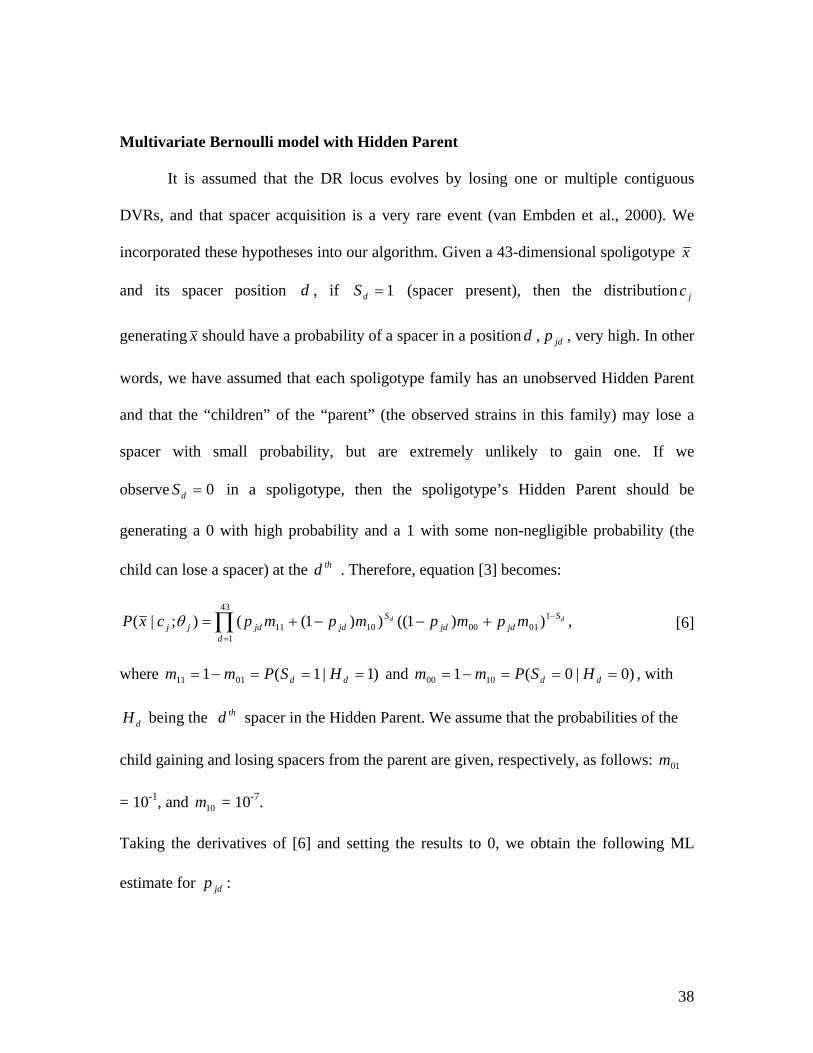
It is assumed that the DR locus evolves by losing one or multiple contiguous
DVRs, and that spacer acquisition is a very rare event (van Embden et al., 2000). We
incorporated these hypotheses into our algorithm. Given a 43-dimensional spoligotype x
and its spacer position , if d 1=dS (spacer present), then the distribution
generating
jc
x should have a probability of a spacer in a position , , very high. In other
words, we have assumed that each spoligotype family has an unobserved Hidden Parent
and that the “children” of the “parent” (the observed strains in this family) may lose a
spacer with small probability, but are extremely unlikely to gain one. If we
observe in a spoligotype, then the spoligotype’s Hidden Parent should be
generating a 0 with high probability and a 1 with some non-negligible probability (the
child can lose a spacer) at the . Therefore, equation [3] becomes:
d jdp
0=dS
thd
,))1(())1(();|( 10100
43
11011
dd Sjdjd
d
Sjdjdjj mpmpmpmpcxP −
=
+−−+=∏θ [6]
where )1|1(1 0111 ===−= dd HSPmm and )0|0(1 1000 ===−= dd HSPmm , with
being the spacer in the Hidden Parent. We assume that the probabilities of the
child gaining and losing spacers from the parent are given, respectively, as follows:
= 10
dH thd
01m
-1, and = 1010m -7.
Taking the derivatives of [6] and setting the results to 0, we obtain the following ML
estimate for : jdp
38
))(()(
101011
01101
nnmmnnmn
p jd +−+−
= , [7]
where )|(1
1 ij
n
iid xcPSn ∑
=
= and )|()1(1
0 ij
n
iid xcPSn ∑
=
−= .
Model initialization and validation
The performance of the method is highly dependent on the seeding of EM, which
includes the initial choice of the number of components in a mixture model and the
parameters of these components. To incorporate expert knowledge, we used the
prototypes derived from SpolDB3 (Filliol et al., 2002). We extracted seeds for 32 mixture
components. Because spoligotypes exist that do not match any of the SpolDB3-based
prototypes, we added four additional component seeds, based on visual inspection. The
details on the seeds’ extraction can be found in
http://www.rpi.edu/~bennek/EpiResearch.
In another model, EM was initialized randomly. We employed the MCCV
approach (Smyth, 1996) to find , the number of components in the mixture. MCCV
includes dividing the data
k
M times randomly into disjoint test and train partitions. The
test subset is a fraction β of the whole data set. For each of the M partitions, we vary k
from to . EM is initialized using the k -means algorithm, which is itself
initialized randomly. EM is randomly restarted 10 times, and the highest log-likelihood
solution is then used as a trained model. EM iterates either until the change in the total
log-likelihood is less then or the change of the component weights sum is less than
. Alternatively, EM stops after 30 iterations, as suggested (Smyth, 1996). For the
mink maxk
710 −
85−
39

highest total log-likelihood model, EM iterates 300 times or until convergence.
Furthermore, each prototype is modified through addition of randomness component
to it (Juan et al., 2004).
jdp
Each trained k -order model is applied to the test set, and the test data log-
likelihood is calculated. The procedure is repeated M times and the average test data log-
likelihood, , is calculated for each . The plot of as a function of shows which
is the most probable for the given data. Our algorithm was run with ,
cvkL k cv
kL k
k 100=M
3.0=β , and k was varied from 30 to 60.
After we had decided on a particular value, we generated, as described above,
100 randomly initialized mixture models, and calculated the total stabilities over the
resulting families for each of them, relative to the other 99 models. We chose a final
mixture model based on the total stability (Hopcroft et al., 2004) and the total log-
likelihood. We call the stability of a set, or putative family, of spoligotypes the average
best match between this set and the sets identified using other models. For any two sets
and , the match (between 0 and 1) is defined as follows (Hopcroft et al., 2004):
k
C 'C
).|'|
|'|,||
|'|min()',(C
CCC
CCCCmatch ∩∩= [8]
High match values denote that the sets have many spoligotypes in common and are of
roughly the same size.
The Hidden Parent Bernoulli mixture model produced results that were more
consistent with known spoligotyping families than the families identified by a regular
Bernoulli mixture model.
40
References Aranaz, A., Romero, B., Montero, N., Alvarez, J., Bezos, J., de Juan, L., Mateos, A., Dominguez, L., 2004. Spoligotyping profile change caused by deletion of a direct variable repeat in a Mycobacterium tuberculosis isogenic laboratory strain. J. Clin. Microbiol. 42, pp. 5388-5391. Baker, L.D., McCallum, A.K., 1998. Distributional clustering of words for text classification. In: Proceedings of the 21st ACM International Conference on Research and Development in Information Retrieval; Melbourne, Australia; 1998 Aug 24-28; ACM Press, pp. 96-103. Braden, C.R., Templeton, G.L., Cave, M.D., Valway, S., Onorato, I.M., Castro, K.G., Moers, D., Yang, Z., Stead, W.W., Bates, J.H., 1997. Interpretation of restriction fragment length polymorphism analysis of Mycobacterium tuberculosis isolates from a state with a large rural population. J. Infect. Dis. 175, pp. 1446-1452. Carreira-Perpinan, M.A., Renals, S., 1999. Practical identifiability of finite mixtures of multivariate Bernoulli distributions. Neural Comput. 12, pp. 141-152. Dale, J.W., Brittain, D., Cataldi, A.A., Cousins, D., Crawford, J.T., Driscoll, J., Heersma, H., Lillebaek, T., Quitugua, T., Rastogi, N., Skuce, R.A., Sola, C., van Soolingen, D., Vincent, V., 2001. Spacer oligonucleotide typing of bacteria of the Mycobacterium tuberculosis complex: recommendations for standardized nomenclature. Int. J. Tuberc. Lung Dis. 5, pp. 216-219. Dempster, A.P., Laird, N.M., Rubin, D.B., 1997. Maximum likelihood from incomplete data via the EM algorithm. Journal of the Royal Statistical Society B(39), pp. 1-38. Duchêne, V., Ferdinand, S., Filliol, I., Guegan , J.F., Rastogi, N., Sola, C., 2004. Phylogenetic reconstruction of Mycobacterium tuberculosis within four settings of the Caribbean region: tree comparative analyse and first appraisal on their phylogeography. Infect. Genet. Evol. 4, pp. 5-14. Ellis, B.A., Crawford, J.T., Braden, C.R., McNabb, S.J., Moore, M., Kammerer, S., 2002. Molecular epidemiology of tuberculosis in a sentinel surveillance population. Emerg. Infect. Dis. 8, pp. 1197-1209. Everitt, B.S., Hand, D.J., 1981. Finite mixture distributions. (Monographs on Applied Probability and Statistics). Chapman and Hall, London. Filliol, I., Driscoll, J.R., Van Soolingen, D., Kreiswirth, B.N., Kremer, K., Valetudie, G., Anh, D.D., Barlow, R., Banerjee, D., Bifani, P.J., Brudey, K., Cataldi, A., Cooksey, R.C., Cousins, D.V., Dale, J.W., Dellagostin, O.A., Drobniewski, F., Engelmann, G.,
41
Ferdinand, S., Gascoyne-Binzi, D., Gordon, M., Gutierrez, M.C., Haas, W.H., Kassa-Kelembho, E., Ly, H.M., Makristathis, A., Mammina, C., Martin, G., Mostrom, P., Mokrousov, I., Narbonne, V., Narvskaya, O., Nastasi, A., Niobe-Eyangoh, S.N., Pape, J.W., Rasolofo-Razanamparany, V., Ridell, M., Rossetti, M.L., Stauffer, F., Suffys, P.N., Takiff, H., Texier-Maugein, J., Vincent, V., De Waard, J.H., Sola, C., Rastogi, N., 2003. Snapshot of moving and expanding clones of Mycobacterium tuberculosis and their global distribution assessed by spoligotyping in an international study. J. Clin. Microbiol. 41, pp. 1963–1970. Filliol, I., Driscoll, J.R., van Soolingen, D., Kreiswirth, B.N., Kremer, K., Valétudie, G., Anh, D.D., Barlow, R., Banerjee, D., Bifani, P.J., Brudey, K., Cataldi, A., Cooksey, R.C., Cousins, D.V., Dale, J.W., Dellagostin, O.A., Drobniewski, F., Engelmann, G., Ferdinand, S., Gascoyne-Binzi, D., Gordon, M., Gutierrez, M.C., Haas, W.H., Heersma, H., Källenius, G., Kassa-Kelembho, E., Koivula, T., Ly, H.M., Makristathis, A., Mammina, C., Martin, G., Moström, P., Mokrousov, I., Narbonne, V., Narvskaya, O., Nastasi, A., Eyangoh, S.N.N., Pape, J.W., Rasolofo-Razanamparany, V., Ridell, M., Rossetti, M.L., Stauffer, F., Suffys, P.N., Takiff, H., Texier-Maugein, J., Vincent, V., de Waard, J., Sola, C., Rastogi, N., 2002. Global distribution of Mycobacterium tuberculosis spoligotypes. Emerg. Inf. Dis. 8, pp. 1341–1343. Geng, E., Kreiswirth, B., Driver, C., Li, J., Burzynski, J., DellaLatta, P., LaPaz, A., Schluger, N.W., 2002. Changes in the transmission of tuberculosis in New York City from 1990 to 1999. N. Engl. J. Med. 346, pp. 1453-1458. Groenen, P.M., Bunschoten, A.E., van Soolingen, D., van Embden , J.D.A., 1993. Nature of DNA polymorphism in the direct repeat cluster of Mycobacterium tuberculosis; application for strain differentiation by a novel typing method. Mol. Microbiol. 10, pp. 1057-1065. Hirsh, A.E., Tsolaki, A.G., DeRiemer, K., Feldman, M.W., Small, P.M., 2004. Stable association between strains of Mycobacterium tuberculosis and their human host populations. PNAS, 101, pp. 4871-4876. Jasmer, R.M., Hahn, J.A., Small, P.M., Daley, C.L., Behr, M.A., Moss, A.R., Creasman, J.M., Schecter, G.F., Paz, E.A., Hopewell, P.C., 1999. A molecular epidemiologic analysis of tuberculosis trends in San Francisco, 1991-1997. Ann. Intern. Med. 130, pp. 971-978. Juan, A., García-Hernández, J., Vidal, E., 2004. EM initialization for Bernoulli mixture learning. In: Proceedings of Structural, Syntactic, and Statistical Pattern Recognition, Joint IAPR International Workshops; Lisbon, Portugal; 2004 Aug 18-20; Springer, pp. 635-643. Hopcroft, J., Khan, O., Kulis, B., Selman, B., 2004. Tracking evolving communities in large linked networks. Proc. Natl. Acad. Sci. USA 101, pp. 5249–5253.
42
Kamerbeek, J., Schouls, L., Kolk, A., van Agterveld, M., van Soolingen, D., Kuijper, S., Bunschoten, A., Molhuizen, H., Shaw, R., Goyal, M., van Embden, J.D.A., 1997. Simultaneous detection and strain differentiation of Mycobacterium tuberculosis for diagnosis and epidemiology. J. Clin. Microbiol. 35, pp. 907–914. Koller, D., Sahami, M., 1997. Hierarchically classifying documents using very few words. In: Proceedings of the 14th International Conference on Machine Learning; Nashville, Tennessee; 1997 July 8-12; Morgan Kaufmann, pp. 170-178. Liu, Z., Shilkret, K.L., Tranotti, J., Freund, C.G., Finelli, L. 1998. Distinct trends in tuberculosis morbidity among foreign-born and US-born persons in New Jersey, 1986 through 1995. Am. J. Public Health. 88, pp. 1064-1067. Mazars, E., Lesjean, S., Banuls, A.L., Gilbert, M., Vincent, V., Gicquel, B., Tibayrenc, M., Locht, C., Supply, P., 2001. High-resolution minisatellite-based typing as a portable approach to global analysis of Mycobacterium tuberculosis molecular epidemiology. Proc. Natl. Acad. Sci. USA. 98, pp. 1901-1906. McCallum, A., Nigam, K., 1998. Employing EM in pool-based active learning for text classification. In: Proceedings of the 15th International Conference on Machine Learning; Madison, Wisconsin; 1998 July 24-27; Morgan Kaufmann, pp. 359-367. MMWR. Human Tuberculosis Caused by Mycobacterium bovis - New York City, 2001- 2004. June 24, 2005 / 54(24), 605-608. (http://www.cdc.gov/mmwr/preview/mmwrhtml/mm5424a4.htm). Mokrousov, I., Narvskaya, O., Limeschenko, E., Otten, T., Vyshnevskiy, B., 2002. Novel IS6110 insertion sites in the direct repeat locus of Mycobacterium tuberculosis clinical strains from the St. Petersburg area of Russia and evolutionary and epidemiological considerations. J. Clin. Microbiol. 40, pp.1504-1507. Parsons, L.M., Brosch, R., Cole, S.T., Somoskovi, A., Loder, A., Bretzel, G., Van Soolingen, D., Hale, Y.M., Salfinger, M., 2002. Rapid and simple approach for identification of Mycobacterium tuberculosis complex isolates by PCR-based genomic deletion analysis. J. Clin. Microbiol. 40, pp. 2339-2345. Pearl J., 1988. Probabilistic Reasoning in Intelligent Systems. Morgan Kaufmann, Santa Mateo. Salihu, H.M., Naik, E., O'Brien, W.F., Dagne, G., Ratard, R., Mason, T., 2001. Tuberculosis in North Carolina: trends across two decades, 1980-1999. Emerg. Infect. Dis. 7, pp. 570-574. Sebban, M., Mokrousov, I., Rastogi, N., Sola, C., 2002. A Data-mining approach to spacer oligonucleotide typing of Mycobacterium tuberculosis. Bioinformatics 18, pp. 235–243.
43
Seidler, A., Nienhaus, A., Diel, R., 2004. The transmission of tuberculosis in the light of new molecular biological approaches. Occup. Environ. Med. 61, pp.96-102. Singh, U.B., Suresh, N., Bhanu, N.V., Arora, J., Pant, H., Sinha, S., Aggarwal, R.C., Singh, S., Pande, J.N., Sola, C., Rastogi, N., Seth, P., 2004. Predominant tuberculosis spoligotypes, Delhi, India. Emerg. Infect. Dis. 10, pp. 1138-1142. Sharnprapai, S., Miller, A.C., Suruki, R., Corkren, E., Etkind, S., Driscoll, J., McGarry, M., Nardell, E., 2002. Genotyping analyses of tuberculosis cases in U.S.- and foreign-born Massachusetts residents. Emerg. Infect. Dis. 8, pp. 1239-1245. Small, P.M., Hopewell, P.C., Singh, S.P., Paz, A., Parsonnet, J., Ruston, D.C., Schecter, G.F., Daley, C.L., Schoolnik, G.K., 1994. The epidemiology of tuberculosis in San Francisco. A population-based study using conventional and molecular methods. N. Engl. J. Med. 330, pp. 1703-1709. Smyth, P., 1996. Clustering using Monte Carlo cross-validation. In: Proceedings of the 2nd International Conference on Knowledge Discovery and Data Mining; Portland, Oregon; 1996 Aug 2-6; AAAI Press, pp. 126-133. Sola , C., Ferdinand , S., Sechi, L.A., Zanetti, S., Martial, D., Mammina, C., Nastasi, A., Fadda, G., Rastogi, N., 2005. Mycobacterium tuberculosis molecular evolution in western Mediterranean Islands of Sicily and Sardinia. Infect. Genet. Evol. 5, pp. 145-156. Sugar, C.A., James, G.M., 2003. Finding the number of clusters in a dataset: An information-theoretic approach. J. Am. Stat. Assoc. 98, pp. 750-763. Supply, P., Magdalena, J., Himpens, S., Locht ,C., 1997. Identification of novel intergenic repetitive units in a mycobacterial two-component system operon. Mol. Microbiol. 26, pp. 991–1003.
Supply, P., Lesjean, S., Savine, E., Kremer, K., van Soolingen, D., Locht, C., 2001. Automated high-throughput genotyping for study of global epidemiology of Mycobacterium tuberculosis based on mycobacterial interspersed repetitive units. J. Clin. Microbiol. 39, pp. 3563–3571. Talbot, E.A., Moore, M., McCray, E., Binkin, N.J., 2000. Tuberculosis among foreign-born persons in the US, 1993-1998. JAMA, 284, pp. 2894-2900. Tsuruoka, Y., Tsujii, J., 2003. Training a Naive Bayes classifier via the EM algorithm with a class distribution constraint. In: Proceedings of the 7th Conference on Natural Language Learning; Edmonton, Canada; 2003 May 31-June 1; Morgan Kaufmann, pp. 127-134.
44
van Embden, J.D.A., Cave, M.D., Crawford, J.T., Dale, J., Eisenach, K.D., Gicquel, B., Hermans, P., Martin, C., McAdam, R., Shinnick, T.M., 1993. Strain identification of Mycobacterium tuberculosis by DNA fingerprinting: recommendations for a standardized methodology. J. Clin. Microbiol. 31, pp. 406-409. van Embden, J.D.A., van Gorkom, T., Kremer, K., Jansen, R., van der Zeijst, B.A.M., Schouls, L.M., 2000. Genetic variation and evolutionary origin of the Direct repeat locus of Mycobacterium tuberculosis complex bacteria. J. Bacteriol. 182, pp. 2393–2401. Vynnycky, E., Nagelkerke, N., Borgdorff, M.W., van Soolingen, D., van Embden, J.D.A., Fine, P.E., 2001. The effect of age and study duration on the relationship between “clustering” of DNA fingerprint patterns and the proportion of tuberculosis disease attributable to recent transmission. Epidemiol. Infect. 126, pp. 43-62. Warren, R.M., Streicher, E.M., Sampson, S.L., Van Der Spuy, G.D., Richardson, M., Nguyen, D., Behr, M.A., Victor, T.C., Van Helden, P.D., 2002. Microevolution of the direct repeat region of Mycobacterium tuberculosis: implications for interpretation of spoligotyping data. J. Clin. Microbiol. 40, pp. 4457–4465. Zuber, P.L., McKenna, M.T., Binkin, N.J., Onorato, I.M., Castro, K.G., 1997. Long-term risk of tuberculosis among foreign-born persons in the US. JAMA 278, pp. 304-307.
45


![[Micro] mycobacterium tuberculosis](https://img.pdfslide.us/doc/110x75/55d6fc67bb61ebfa2a8b47ea/micro-mycobacterium-tuberculosis.jpg)