Embed Size (px)
Citation preview

IDENTIFYING MARKET PREFERENCES
FOR HIGH SELENIUM BEEF
A Thesis Submitted to the Graduate Faculty
of the North Dakota State University
of Agriculture and Applied Science
By
Scott Curtiss Hovde
In Partial Fulfillment of the Requirements for the Degree of
MASTER OF SCIENCE
Major Department: Agribusiness and Applied Economics
December 2006
Fargo, North Dakota

ABSTRACT
Hovde, Scott Curtiss; M.S.; Department of Agribusiness and Applied Economics; College of Agriculture, Food Systems, and Natural Resources; North Dakota State University; December 2006. Identifying Market Preferences for High Selenium Beef. Major Professor: Dr. Cheryl Wachenheim. Cancer is an enormous health concern in the United States and the rest of the world.
Selenium is an element that has been scientifically proven to have some cancer-
preventative characteristics. Thus, livestock and grain producers are exploring potential
high-selenium food marketing opportunities. A choice experiment was conducted to
identify characteristics of market segments that show interest in a high-selenium beef
product. In a national survey, participants chose between different levels of health claim
approval and research, prices, and selenium origin. A multinomial logit regression model
was estimated.
Results indicate that typical marketing opportunities may be within the boundaries
of functional food market segments. The fear of cancer and a general lack of knowledge
regarding selenium appear to affect the purchase intentions of consumers regarding this
product. Promotional marketing tactics may be effective when information is presented in a
manner that is easily accepted and understood by consumers.

iii
ACKNOWLEDGEMENTS
I thank my committee members: Dr. William Nganje, Dr. Robert Hearne, Dr.
Christopher Schauer, and Dr. Tim Petry. The insight and constructive criticism was greatly
appreciated to help my education as well as this thesis. I am very grateful for the extra
assistance from Dr. Nganje and Dr. Hearne for the experiment.
A special thanks to Dr. Cheryl Wachenheim, my major adviser. Her continuous
praise and encouragement were always appreciated and helped to keep my drive going
throughout this project. I thank her for the willingness to help at any lengths and whenever
I needed it. In addition to the patience, time, and advice, I thank Cheryl for her friendship
as it made obtaining a master’s degree much more fun. Working with Cheryl was a great
experience.
Thank you to the graduate faculty and staff for their help, education, and
willingness to be of assistance to me as well as the other students. You were great to be
around, work with, and learn from.
A special thanks to all of my friends and roommates during my time at NDSU.
Without them, college would not have been near the great experience that it was. To my
friends in the master’s program, it would not have been possible without you.
Finally, a very special thanks to my family members. Their support, interest, and
encouragement were never ending and always appreciated. Thanks to you all.

iv
TABLE OF CONTENTS
ABSTRACT....................................................................................................................... iii
ACKNOWLEDGEMENTS ................................................................................................iv
LIST OF TABLES ............................................................................................................ vii
LIST OF FIGURES ......................................................................................................... viii
CHAPTER I. INTRODUCTION ......................................................................................... 1
Selenium .................................................................................................................. 2
Objectives ................................................................................................................ 4
CHAPTER II. LITERATURE REVIEW ........................................................................... 6
Functional Foods and Functional Food Consumers ................................................ 6
Selenium ................................................................................................................ 11
Health Claim Labeling ........................................................................................... 15
Methods of Willingness-to-Pay Valuation ............................................................ 19
CHAPTER III. METHODS .............................................................................................. 27
Introduction ............................................................................................................ 27
Initial Survey Design ............................................................................................. 28
Experimental Design and Data .............................................................................. 33
D-Optimality .......................................................................................................... 34
Survey Population .................................................................................................. 37
CHAPTER IV. RESULTS ................................................................................................ 39
Multinomial Model ................................................................................................ 39
CHAPTER V. CONCLUSIONS ...................................................................................... 44
Introduction ............................................................................................................ 44

v
Summary of Thesis ................................................................................................ 44
Conclusions and Explanations ............................................................................... 45
Limitations and Further Work ............................................................................... 46
REFERENCES .................................................................................................................. 48
APPENDIX A. SURVEYS ............................................................................................... 52
Survey 1 ................................................................................................................. 53
Survey 2 ................................................................................................................. 66
Survey 3 ................................................................................................................. 72

vi
LIST OF TABLES
Table Page
3.1 Demographic information from focus group ......................................................... 31
3.2 Income levels of survey participants ..................................................................... 38
3.3 Survey-specific socio-demographic responses ...................................................... 38
4.1 Health claim preferences ....................................................................................... 40
4.2 Health claim preferences: Inconclusive effect on health claim ............................. 42

vii
LIST OF FIGURES
Figure Page
2.1. Hintze et al. (2002) study’s steer groupings ......................................................... 14
3.1. Medium label example.......................................................................................... 32

1
CHAPTER I. INTRODUCTION
Cancer, the second leading cause of death in the United States, is a major public
health concern. The American Cancer Society (2006) states that one of every four deaths
in the United States is caused by some form of cancer, and the organization estimates
1,399,790 new cancer cases and 564,830 expected deaths due to cancer for 2006. Cancer
can exist in many different forms and types, some of which are brought on by the
destructive choices people make while others are less predictable and are not the result of
destructive decisions. Consumers find themselves searching for inexpensive and easy
methods to diminish the risk of obtaining certain forms of cancer. Food selection is
becoming an increasingly common choice as a hopeful cancer prevention agent.
Many foods consumers choose in this scenario are referred to as “functional foods.”
“A food can be regarded as ‘functional’ if it is satisfactorily demonstrated to affect
beneficially one or more target functions in the body, beyond adequate nutrition, in a way
that improves the health and well-being or reduces the risk of disease” (Gibson and
Williams, p.1). However, to be considered a functional food, the food must remain a food,
thus supplements are not considered to belong in this category. The functional food may
be a completely natural food, a food to which a health-positive constituent has been added,
or a food in which a particular element has been modified. Functional food sales have
grown 10% annually since 1990, which represents the increased interest in and pursuit for
these products (Lesch, 2004).
The value of a functional food is dependent upon the extra “function”
characteristics it contains and how consumers value the health benefit associated with the
2
functional food. After an added health benefit is associated with a food or element of a
food, that product is labeled according to its benefit and is marketed as a functional food.
Many consumers have heard little about functional foods and the benefits
associated with them. Even if they have heard of them, many consumers still do not know
what individual functional foods are worth to their health beyond basic nutrition.
Consumers cannot choose functional foods that prevent cancer unless they are aware of
them. Functional foods with cancer protection qualities need to be promoted to consumers
once research has proven their functional creditability.
Selenium
Selenium is an essential trace mineral that is extremely important to basic human
health. It is a necessary component for appropriate function of the immune system, muscle
function, successful reproduction, and peak brain function. Also, selenium produces
valuable antioxidant enzymes. Deficiencies in selenium have been linked to decreased
thyroid function, cardiovascular disease, and cancers (Rayman, 2000).
Research has demonstrated that selenium is also linked to reduction in risk to some
carcinomas (Clark, et al., 1996, 1998.) Selenium was first recognized as having some
nutritional importance almost five decades ago (Schwartz and Foltz, 1957). Twelve years
after that initial proposal, an inverse relation of U.S. local cancer rates and geographical
distribution of selenium in American forage crops led to a suggested relation of selenium
and cancer risk (Combs, 2000).
Selenium has not been approved for an unqualified health claim by the Food and
Drug Administration (FDA) as a cancer protector or prevention aid due to the lack of
conclusive evidence to date. Selenium has been petitioned to the FDA for validation of its

3
role as an anti-carcinogenic. However, the FDA concluded in 2003 that there was not
“significant scientific agreement about the science underlying the statements that
‘Selenium may reduce the risk of certain cancers’ and that ‘Selenium may produce anti-
carcinogenic effects in the body’” (Taylor, p.8). At the conclusion of current human health
studies with regard to selenium intake and cancer protection, more conclusive and
significant evidence is expected to be submitted.
Selenium levels in foods are greatly dependent on soil selenium levels in the region
where the food is raised. Plants do not use the selenium for growth processes, so the
selenium level of the soil is maintained in the plant; therefore, plants grown on high-
selenium soils have higher selenium levels. Plants containing high selenium, wheat for
example, can be harvested and used to make food products such as bread. The bread will
contain a higher selenium level that is correlated with the selenium found in the soil in
which the wheat grew. Animals require selenium for bodily processes and functions, and
the excess amount consumed is then deposited into muscle tissue. Therefore, high
selenium feeds are a direct influence to the quantity of selenium deposited in the animal
muscle tissue.
Currently, there is no specific market value for selenium-enhanced beef. The
specific level of selenium in beef products marketed to consumers now is generally
unknown to the consumer or participants in the marketing channel. Estimating how much
consumers will value selenium levels in beef is essential to evaluating the potential of
marketing a high selenium product. If consumer value for selenium enhanced beef is
estimated, it can then be used to help establish an expected premium for this product,

4
which can help producers and processors decide on the economic viability of introducing a
high-selenium beef product.
The general population’s intentional use of functional foods, such as high-selenium
products, has only recently become possible. Public awareness of the added health benefits
of certain foods has increased as new developments and research discoveries are realized.
Research studies on the effects of selenium on the human body have been underway for
several years but some are not yet completed. Upon completion, it is hoped these studies
will provide some crucial results to support current selenium claims.
A current goal for those administrating studies and sponsoring selenium research is
to obtain FDA authorization of a health claim with no discretionary circumstances for the
claim. This would present the opportunity for the general public to value well-defined
FDA approval stickers on high selenium food packages. When favorable nutrition
information or health claims are presented, consumers have more favorable attitudes
toward the product, nutrition attitudes, and purchase intentions (Kozup, Creyer, and
Burton, 2003).
Objectives
The goal of this project is to investigate consumer demand for selenium enhanced
beef. Since regions of North Dakota and South Dakota soils have high levels of selenium,
beef producers, processors, and landowners in the Dakotas have a special interest in the
consumer value of this cancer defense mineral. If selenium were approved as a cancer
prevention mineral, and beef producers and processors chose to target selenium enhanced
beef markets, premiums received would have to exceed the costs of testing the meat and

5
soils for selenium, possible identity preservation, new feeds, and additional slaughtering
and marketing costs.
Specific objectives are as follows:
1. Identify preferred level of selenium beef attributes including price, origin of
selenium, and label-claim made regarding the value of selenium as a cancer
preventative.
2. Gauge level of knowledge concerning selenium health characteristics.
3. Identify market segments valuing a high-selenium beef product.
The conclusions will be useful for firm decision making in more than one way.
First, an estimated demand will give the producer an educated conclusion regarding
potential premiums from the product, which in turn will help guide decisions about whether
to implement high-selenium production. Second, the conclusion should be useful to show
how consumers respond to the information received about selenium. The response to
information will help determine what, if any, marketing campaign is necessary.
Chapter II reports relevant findings from the literature in the areas of Functional
Foods and Functional Food Consumers, Selenium, Health Claim Labeling, and methods of
experimental design for this investigation. Chapter III presents the Methods used for
survey design and deployment as well as a brief description of the survey population.
Results of the survey are discussed in Chapter IV, followed by the conclusions and
implications in Chapter V.

6
CHAPTER II. LITERATURE REVIEW
The literature review begins with definitions of functional foods and market
segments for such. Selenium and its potential as a functional food, health claims, and
labeling concerns are then discussed. Methods to assess willingness-to-pay are then
considered.
Functional Foods and Functional Food Consumers
The term “functional food” originated in Japan in the late 1980s to describe foods
fortified with ingredients that potentially would benefit consumers’ health (Stanton et al.,
2001). Today, many current definitions vary as there is no legal definition, and growth has
been rapid in the marketing of food products as functional foods. Ingredients that may be
considered functional include probiotics, prebiotics, vitamins, and minerals found within
products.
European functional food markets typically are made up of probiotics and prebiotic
dairy foods. Probiotics are single or mixed cultures of live microorganisms that, when
applied to animals or humans, beneficially affect the host by improving the properties of
the indigenous micro-flora (Stanton et al., 2001). Prebiotics are indigestible food
ingredients that beneficially improve host health by selectively stimulating the growth,
activity, or both of one or a limited number of bacteria in the colon. Vitamin and mineral
fortified functional foods are more common in the United States. The American functional
food market is underdeveloped compared to markets in Europe and Japan (Stanton et al.,
2001). A major factor for the furthering of the American market will be the rules, testing,
and context of health claims associated with specific functional foods.

7
Strong health claims and changing consumer demands are critical to the success of
functional foods. Consumers are increasingly demanding convenient, yet health-oriented,
foods (Stanton et al., 2001). The typical functional food consumer is female, between 35
and 55 years of age, well educated, with a high income, and actively interested in health
(Stanton et al., 2001). Consumers as a whole are increasing their knowledge of health,
foods, and nutrition, which in turn should also increase the awareness of and demand for
functional foods.
Maynard and Franklin (2003) conducted a willingness-to-pay (WTP) study
regarding conjugated linoleic acid (CLA) dairy products. CLA has been shown in animal
studies to prevent cancers from developing or growing. Typical human diets do not
contain enough CLA to reach preventative levels. From the results of their contingent
valuation experiment, consumer segments most likely to value the CLA products highly
had children or health-conscious consumers in the household. Another notable result from
the study was that some respondents’ WTP was dependent on the medical community’s
support of the CLA cancer fighting evidence and research.
Burn and Kishore (2000) explained how biological advancements and changes play
a part in the role of foods. They stated that foods contain nutrients that can be effective
toward promoting specific metabolic or bodily functions, rather than just meeting caloric
and digestive needs. They noted that foods with molecules of these nutrients were often
referred to as “nutraceuticals,” or functional foods. In an effort to better describe these
molecules that positively affect the body’s functions and preservation, a new name,
“vitalins,” was proposed by the authors. Functional foods would be foods with one or
more of these vitalins or foods depleted in anti-vitalins. Burn and Kishore argued that this
8
would better educate consumers about nutrition at the molecular level. Due to the amount
of misleading and false stories regarding food roles, Burn and Kishore believed there was
an increasing need for science-based regulations that would help strengthen science-based
nutrition and disease prevention.
Food and medicine are beginning to merge, which creates the need for a system that
distributes the harvests of scientific research to consumers without creating confusion and
compromising on scientific principles.
Gilbert (2000) tackled important aspects of reaching a target functional foods
market based upon discoveries of the biennial HealthFocus® Trend Report. Most shoppers
(93%) in this national study still desired foods naturally nutritious in key vitamins and
minerals. This was much greater than those who agreed that supplements and fortified
foods were important (62% and 55%, respectively).
Just over half of shoppers, 54%, believed that foods could reduce medicine or drug
use. Those who strongly agreed with that, 11%, were labeled “food as medicine”
shoppers—and are often the target of many functional food products entered in the market.
Seventy-eight percent of “food as medicine shoppers” read labels, and they were more than
twice as likely as other consumers to believe labels are regulated (48% versus 22% of other
shoppers). However, they were also more likely to be skeptical of label claims.
In the study, label claims of “fresh” and “grown without pesticides” were most
important to all shoppers. Positive health claims had a slightly higher appeal to these
shoppers than a claim of fear. For example, “helps to maintain healthy cholesterol” was
slightly favored over “may reduce risk of heart disease.”

9
The skepticism toward functional foods and health claims will continue, but
educating the consumer is crucial to the successful marketing of functional food products.
Gilbert (2000) contended that, to better educate the consumer, information regarding health
claims must come in a variety of methods, such as product labels, media, and doctors’
offices.
Mark-Herbert (2003) explained a business strategy for marketing functional food
products. This research indicated that most new food product entries into the market were
discontinued within one year of that entry. Since functional food products have a different
shape and spectrum than more traditional products, different strategies may be necessary
for success. The first phase of marketing functional foods would be the clinical study
phase where reputable research tests evaluate the food product’s functional effect on
humans. Next would be public relations and advertisement phases, during which mediums
of communication inform consumers about a product and its functional benefit. Using
doctors or other professionals to vouch for a product’s benefit would help generate
consumer interest and add validity to the impression of the information. The segment
labeled “sufferers” would be the first and initial market to have an interest in the functional
food for its added benefit, as that segment would be suffering from whatever problem that
food would address. As awareness increased slightly, “at-risk” segments would start to
consider the product, and efforts would then be devoted to increase awareness until the
“prevention” segment became attracted and aware. Finally, if the functional food caught
on beyond prevention segments, it would be a mass-marketed product for which the
majority of an entire population would be aware and possibly consuming. Personal

10
experiences would greatly help to increase awareness of the product, primarily beginning
with the “sufferers” and growing to the other segments.
Wilson and Abbott (2005) wrote about the functional food consumer. Two popular
definitions were given for functional foods and are listed below (p. 58):
1. “Forms of food products that have been altered in order to serve a particular
nutritional need and which is used as the primary selling point.”
2. “Naturally occurring foods particularly endowed with one or more
beneficial nutritional properties that could reasonably be used as the primary
selling point against similar foods.”
A basic understanding of functional foods is the knowledge that they provide some
added benefit beyond the basic nutritional value of the food. Wilson and Abbott’s analysis
indicated that education and income levels were significant to a household’s functional
food purchases. Higher levels of either education or income resulted in more purchases of
healthier food products. Women demonstrated higher functional food purchase tendencies
than men.
Schmidt (2000) examined consumers’ evaluation of functional foods and
questioned whether interest in functional foods was a temporary market trend or a major
shift in consumers’ attitudes regarding foods. Ninety-five percent of consumers surveyed
believed foods could have health benefits beyond the basic nutritional value. There was
also a strong preference for foods occurring in their most “natural” states. From
information gathered through a telephone survey and focus groups, Schmidt concluded that
consumers were becoming increasingly aware of functional foods. He suggested that
communication to the consumer is key to disseminating accurate information.

11
Positive statements are received much better than negative statements, and
consumers do not want to be told what not to eat. Terminology is also important to the
interpretation and impression of consumers and the food product. For example, using
“may reduce risk of” rather than “will prevent” to explain attributes gives products a
“natural food” impression, rather than a “medicine fortified” impression.
Selenium
The 2003 FDA response to the 2002 Health Claim Petition from Wellness
Lifestyles, Inc. regarding selenium and reduced risk of certain cancers and selenium
anticarcinogenic effects concluded that not enough significant scientific evidence had been
shown to satisfy the petitioned claims (Taylor, 2003). The Institute of Medicine (IOM)
directed a risk assessment of dietary selenium and found that an upper level of 400
micrograms per day of selenium intake from food and supplements was likely to present no
adverse health risk to almost any person (Taylor, 2003). The FDA approves this level as
safe and lawful (Taylor, 2003). Approximately 100 micrograms per day is estimated by the
IOM to be the current average selenium intake from foods by one person. With the
petition, five intervention cancer trials were submitted as scientific evidence. These trials
were the Nutritional Prevention of Cancer Trial (Clark et al., 1996); the Linxian General
Population Trial (Blot, et al., 1993; Li et al., 1993); Qidong Primary Liver Cancer Trial (Yu
et al., 1991); Genova, Italy Colorectal Recurrent Adenoma Trial (Bonelli et al., 1998); and
Andhra Pradesh, India Precancerous Lesions of Oral Cavity Trial (Prasad et al., 1995). The
only trial pertinent to the conditions of the United States population, the Nutritional
Prevention of Cancer Trial, showed no effect of selenium supplementation on the non-
melanoma cancer that was primarily tested. Analyses following that study suggested

12
selenium supplementation led to potential reductions in certain and total cancers for which
the study was not designed. These other cancers’ relationships with selenium require
independent confirmation since that particular study was not researching for those effects.
Of 25 observational studies submitted and 11 additional observational studies recognized
by the FDA, none were able to show the effects of selenium separately from those of other
nutrients. However, four observational studies focusing on prostate cancer were
acknowledged to be consistent by showing a significant inverse relationship between
selenium intake and prostate cancer.
Although the FDA concluded there was insufficient evidence for the proposed
claims, it did state that existing evidence is strong enough to support qualified health
claims as long as they were appropriately worded and not misleading to consumers. Two
claims were proposed by the FDA (Taylor, 2003, p.8) as follows:
1. “Selenium may reduce the risk of certain cancers. Some scientific evidence
suggests that consumption of selenium may reduce the risk of certain forms
of cancer. However, the FDA has determined that this evidence is limited
and not conclusive.”
2. “Selenium may produce anticarcinogenic effects in the body. Some
scientific evidence suggests that consumption of selenium may produce
anticarcinogenic effects in the body. However, the FDA has determined that
this evidence is limited and not conclusive.”
Combs (2001) discussed the Nutritional Prevention of Cancer (NPC) trials that were
performed by Clark et al. (1996, 1998) and the development of results from that study. The
study found risk to cancer mortality, total cancer cases, and lung, colorectal, and prostate
13
incidences to be reduced as a result of selenium supplementation of 200 micrograms/day,
an increase of 85 micrograms/day from what this study considered average diets. Plasma
samples were obtained from the patients in the study to determine information regarding
selenium concentration in plasma.
Combs suggested that a plasma selenium (Se) level of about 120 micrograms
(ng)/ml might be an optimal cancer protection target, and that a previous equation
prediction of an intake of 91 ng/day to reach a plasma Se level of 120 ng/ml, as predicted
by Yang et al. (1989), may be under-estimated by as much as one-third. This under-
estimation can be accounted for by average participant weights between the Yang et al.
study and the NPC trial. Adjusted for this difference, selenium intakes of 96 ng/day (for
women) and 120 ng/day (for men) would be sufficient to sustain plasma Se levels of 120
ng/ml (Combs, 2001)—175% and 218% of the revised recommended dietary allowance
(RDA) levels, respectively. Another selenium supplement study evaluated 400
micrograms/day and showed results consistent with that of the NPC study. Neither study
had a subject with plasma Se levels near the upper safe limit, which suggests that the levels
recommended by Combs were safe. Because of functional health benefits of nutrients such
as selenium, Combs concluded that RDAs might need to include consideration for chronic
disease prevention to best serve the public.
Since beef is one of the highest selenium-containing foods in North American diets
(Shi and Spallholz, 1994), management practices may be important for making beef a
permanent and reliable source for high selenium dietary intake. Beef in seleniferous areas
(areas with high soil Se) has potential to be that supply source. From a moderately
seleniferous area, beef samples average 0.7 micrograms Se/g or 70 micrograms Se for a

14
100g beef serving (Hintze et al., 2001). This is a greater amount of selenium than dietary
reference intake numbers, at 55 micrograms daily. It is possible that animals from highly
seleniferous areas might reach 200 micrograms Se/100g serving, which would be
approximately the level for cancer fighting, according to recent research.
Hintze et al. (2002) examined how selenium levels in feed rations and environment
affected Se accumulation in beef muscle tissue. Steers were taken from seleniferous areas
and nonseleniferous areas, half from each, for the experiment. Half the steers from each
geographical region were fed a high selenium supplemented diet, while the other half of
each region was fed a moderate Se diet, as shown in Figure 2.1. Nonseleniferous steers fed
the high Se diet reached Se plasma levels similar to those animals fed high Se diets from
seleniferous regions within two months (Hintze et al., 2002). In the same time period,
animals fed moderate Se rations from seleniferous regions had plasma levels equivalent to
that of moderate Se nonseleniferous steers. Therefore, high selenium diets fed to livestock
in nonseleniferous regions were equally as effective as diets in seleniferous regions.
Importantly, selenium concentrations were found to be similar across all cuts of the
individual steers.
Figure 2.1. Hinzte et al. (2002) study’s steer groupings.
High Selenium Supplemented Diet (25%)
Seleniferous Region (50%)
Moderate Selenium Diet (25%)
Nonseleniferous Region (50%)
High Selenium Supplemented Diet (25%)
Moderate Selenium Diet (25%)

15
Lawler et al. (2004) demonstrated the effects of high selenium diets on
performance, carcass characteristics, and selenium distribution in finishing beef steers.
Forty-three beef steers were arranged by birth weight and placed into one of four
experimental diet groups: control, high selenium wheat, high selenium hay, or sodium
selenate supplement. Animals were fed and monitored for 126 days, then slaughtered and
assessed for selenium results. Selenium did not affect performance, carcass characteristics,
or quality regardless of source or concentration. In semitendinosus muscle, Se
concentrations were lowest for the control and sodium selenate groups, thus indicating
more absorption of organic occurring selenium. Se concentrations ranked highest in
kidney, intermediate in liver, and least in skeletal muscle.
Health Claim Labeling Garretson and Burton (2000) addressed some of the issues regarding consumers’
perceptions and evaluations of differences in nutrition facts information and health claims
associated with food products. Specifically, they used fat and fiber as the nutrients tested
in their experiment. The evaluation of nutrition facts panels, which have been included on
food products since 1994, oftentimes can be affected by a health claim. The Nutrition
Labeling and Education Act (NLEA) was designed to provide an opportunity for
consumers to evaluate the foods they consume with accurate and understandable
information. Although the intent of the NLEA’s related claim and nutrition information
changes was to simplify labels and reduce confusion, many concerns surfaced of its actual
ability to do so.
NLEA legislation developed two primary goals to help alleviate these concerns.
The first was to reduce consumer confusion with nutrition and health claims, and the

16
second to produce useful nutrition information capable of helping the consumer make more
healthful decisions. Garretson and Burton center around these two NLEA objectives in
their paper by first investigating nutrition facts and health claim effects on consumers’
attitudes and purchase intentions. Second, they compared changes in consumers’
perceptions of disease risk and diet-disease knowledge with differing nutrition information
and health claims. Lastly, they observed how misleading information affect consumers’
trust and manufacturers’ credibility.
Five hypotheses were tested with a sample of 382 participants from an Arkansas
statewide mail survey. Results indicate that most consumers chose to rely upon nutrition
facts information rather than claims. When compared to conditions without health claims,
inclusion of a diet-disease health claim led to a marginal reduction in perceptions of risks
for cancer. Findings also suggested that misleading information had a negative effect on
consumers’ trust regarding nutrients with higher perceived disease relation.
Teratanavat and Hooker (2004) studied the ability of consumers to differentiate
between the scientific research supporting multiple levels of qualified health claims. The
FDA uses a four level system, levels A, B, C, and D, to clarify how strongly the claim is
backed with scientific evidence. Level A pertains to “unqualified health claims” where no
disclaimer is necessary since they meet the significant scientific agreement (SSA) standard
to support the health claim. Levels B, C, and D represent moderate, low, and extremely
low scientific evidence compared to the SSA standard, and thus need to be accompanied by
a disclaimer.
Two studies were designed with the first study focusing on consumers’ ability to
differentiate between the levels of health claims and their language. The second study

17
investigated the effect of including a claim level report card, which visually showed the
contrasts in claim levels. Results from the first study suggested that differing levels of
claim information did affect consumers’ attitudes and intentions to purchase. Participants
reacted more positively to products bearing claims A, B, or C than products with no claim
or level D. Level D can be differentiated from the other levels based upon the results, but
A, B, and C levels seemed to have no significant discrimination. Consumers did not
perceive a product to be healthy when little evidence supports the research (level D).
Roe, Levy, and Derby (1999) evaluated if consumers rely solely on health claims
when present and, if so, how nutritional choices were affected by the health claim. They
took three non-branded, different products and placed health claims and nutrition facts on
them. With the presence of a health claim, consumers were significantly more likely to
constrain their search for nutrition information to the front panel compared to looking at the
Nutrition Facts information panel. Lesser-educated consumers were also more likely to
limit nutrition searches to the front panel but were also more skeptical of health claims.
Regardless of nutrition search methods and strategies, consumers were more likely to
consider a product healthier and have higher purchase intentions when it featured a health
claim. A large portion of consumers was likely to view both health and nutrient content
claims as representing health information. Generally, both types of information had the
same impact on consumers’ opinions and choices.
Kozup, Creyer, and Burton (2003) addressed the effects of nutrition information
and health claims when placed on packaged foods as well as restaurant menus. Nutrition
Facts panels, mandated on packages since 1994, show information about the contents and
nutrients of the food product and are well recognized by consumers. Health claims were

18
also regulated during the same time period, but evidence about their effectiveness was less
conclusive. The authors considered how customers’ attitudes and purchase intentions were
affected by health claims and nutrition.
Measured were product evaluations, perceptions of source credibility, and
consumers’ thoughts about developing specific diseases if a certain food was a staple in
their diets. Participants were part of a consumer household research panel and screened to
only include primary household shoppers. To represent the health claim for their research,
a heart-healthy logo was placed on the food package or menu. When this logo was on the
package or food, consumers generally believed that food would reduce the likelihood of
heart disease or stroke. Positive nutrition information led to more positive attitudes
towards the food product, nutrition, and reduction of disease risk, and increased purchase
intentions. Nutrition information and health claims were not interactive in consumers’
decisions and intentions on packaged food, but the interaction was significant on the
restaurant menu food items. The healthy-heart claim had no significant influence on
evaluations or disease risk perceptions when nutrition information, favorable or
unfavorable, was present. In situations where no nutrition information was available, the
health claim was the only indicator to the consumer about the health quality of the product.
From the study, the authors concluded that consumers really do not know the health
level of foods when they are dining out at restaurants. Consumers preferred to trust
nutrition facts when available and used the health claim as a second resource. The best
purpose for the healthy-heart claim was to influence consumers’ disease risk perceptions.
Wansink’s (2003) research on influences of front and back labeling worked to
identify the most effective label—that which communicated the most relevant information

19
efficiently. Three front claims, long, short, and no label, were randomly displayed with a
more informative back label. Participants recorded their thoughts when they read the labels
on the product shown to them. These thoughts were evaluated as attribute-specific or
general evaluations. Attribute thoughts are generally accepted to indicate the consumer has
interpreted the label and its specific information better than a general evaluative thought.
When attribute-specific thoughts are supportive of the claim or label, higher levels of
persuasion can be achieved.
In Wansink’s research, all three front labels generated relatively the same number
of thoughts, but it was the quality of thoughts that differed. Results showed that consumers
who saw short claims made more attribute-specific thoughts and less evaluative thoughts
than when seeing long claims or no claim on the front of the package. Higher numbers of
positive attribute-specific thoughts led to higher levels of believability and persuasiveness
of a health claim.
By including labels on two sides of the package, with a short claim on front and
long on back, believability of health claims increases. Most studies use a label on only one
side of the package, but this seems to inhibit the education of claim information. Detailed
claim descriptions on the back of packages can inform consumers who want to know more
without taking up too much space or having too many words on the front.
Methods of Willingness-to-Pay Valuation
Because selenium rich beef products considered in the current study are not
commercially available, consumer’s preferences must be stated versus revealed. Therefore,
stated preference methods of non-market valuation must be used. The challenge is to select
a stated-preference method that will accurately and efficiently elicit preference for high-

20
selenium beef products. Different methods discussed in this evaluation are contingent
valuation (CV), dichotomous choice (DC), choice-based conjoint analysis (CBC), and
experimental auction.
Lusk and Hudson (2004) discussed the use of methods to elicit willingness-to-pay
(WTP) methods and their agribusiness applications. These methods have received a great
deal of attention within the environmental literature but have been used less often in
agribusiness. Several studies have been conducted to estimate consumer WTP for quality
enhanced foods and products, but these were concerned with policy issues or methodology
and theoretical issues, rather than focused on product adoption or pricing choices. Lusk
and Hudson specifically discussed the effectiveness of dichotomous choice, choice based
conjoint analysis, and experimental auctions valuation methods for WTP discovery.
Dichotomous choice (DC) can be single bounded or double bounded, the difference
being that a single bounded question has one “yes” or “no” question and double bounded
starts with one “yes” or “no” question, then a second “yes” or “no” that is a higher or lower
price offered depending on the response to the first question. Single bounded are most
often used for environmental surveys and are estimated with a simple logit model. Higher
statistical efficiency is achieved with the double bounded questioning as a more efficient
mean WTP is calculated. However, double-bonded may not be incentive-compatible in a
hypothetical context. Also, first and second responses may not be perfectly correlated, so
the question of which answer to use arises. Finally, several authors have indicated a
concern that the second responses depend upon the prices offered in the first. Both single
and double bounded dichotomous choice experiments only elicit discrete choices.

21
Choice-base conjoint (CBC) analysis uses a product that is varied by the attributes
it possesses, and consumers are faced with choosing which product they would purchase,
given the attribute differences. This method has several advantages. First, it follows
Lancaster’s theory of utility maximization, where consumers demand the attributes
belonging to a good. Second, it closely mimics a consumers’ typical shopping experience,
and that allows for analyzing consumers’ trade-offs within a product that they would
normally see. Next, cross-price elasticities can be easily determined between novel and
existing products, which is harder to do with other methods. Finally, the results from CBC
have been shown to be similar to consumers’ revealed preferences.
Disadvantages are also associated with the use of CBC. Again, only discrete
choices are observed, which complicates WTP identification and demand. It is also
difficult to include demographics within a CBC experiment. Several studies have shown
inconsistency among participants’ responses across choice questions, and responses may
even be influenced by the complexity of the decision.
The last method evaluated was experimental auctions, which are scenarios in which
customers bid on products. Individual bids are placed and exchange of money and goods
takes place. Products for these auctions must exist, but do not necessarily have to be “on-
the-market.” For example, Lusk, Pruitt, and Norwood (2006) evaluated WTP for an
antibiotic-free pork chop offered to European consumers. This product is not commonly in
the market, but was produced for the study and used. Alternatively, an experimental
auction was rejected for the current study because of the bid complexity resulting from the
variety of attributes considered, and because an FDA-label supporting the health benefit of
selenium is not (yet) approved.
22
Lusk and Hudson drew the following conclusions: WTP of double bounded DC
typically exceeded WTP of single bounded DC questions; WTP from open ended questions
and experimental auctions were less than WTP of single bounded DC questions; WTP
(single bound DC) was equivalent to WTP of CBC; and auctioning methods have lower
WTP than CBC. The authors suggested that future studies try incorporating cross-price
elasticity.
Lusk et al. (2005) conducted a meta-analysis of 25 studies reporting consumer
willingness-to-pay (WTP) for or willingness-to-accept (WTA) genetically modified (GM)
food products. The paper aimed to draw conclusions from 25 independent studies, each
specific in product considered, population, study environment, and gift offered to
participants. They also showed the effect of method of valuation estimates and reviewed
the specific advantages and disadvantages of each method employed. There have been
many studies designed and employed to estimate demand for GM foods, but the range of
products, procedures, and subject pools make it difficult to effectively summarize
consumer demand for the GM attribute. Variables specified by Lusk, et al. included
sample description, elicitation format, valuation method, whether products were
hypothetical or real, and whether researchers were eliciting WTP, WTA, or both.
They found that hypothetical WTP exceeded non-hypothetical WTP; WTA was
greater than WTP, which is consistent with previous thoughts; and that conducting the
valuation task in person for the non-GM foods resulted in lower premiums than not in
person, such as through phone or mail surveys. The authors did not distinguish differences
between valuation methods in accuracy or effectiveness.

23
Alpizar, Carlsson, and Martinsson (2003) explained the method of using choice
experiments for valuating non-market goods. They provided a guide for constructing a
choice experiment and discussed the steps to be taken to implement it correctly, thus
eliminating some potential sources of error and question. The purpose of a choice
experiment (CE) is to estimate the welfare effects of changes in an attribute. Choice
experiments are similar to CBC methods to which other authors refer in that they both
require a choice to be made among different alternatives. Since many of these attributes
and products associated with choice experiments may be unknown, these authors claimed
that it was harder for participants to respond strategically to the CE method when compared
to the CV. Advantages for CE are that values for each attribute as well as marginal rate of
substitution between non-monetary attributes can be determined. The success of a CE is
dependent upon its construction including definitions, design, context, and evaluation.
Nalley et al. (2004) used a CBC experiment in a supermarket to evaluate WTP for
“farm-raised” beef. Shopper intercepts took place at a counter adjacent to the meat
department. Shoppers were informed about the product and the specifics regarding their
participation. The product was given to them and they were to go home, prepare and eat
the product, and complete the mail-in survey.
The two test products had three price variations each, with an option of “none” also
included in each scenario. Participants were presented with seven of these scenarios and
were asked to choose one of the choices in each scenario that they would purchase, if any.
From the responses, the probability of choice at the different price levels was determined,
which in turn was used to determine a mean WTP for each product.

24
This research was unique in that it specified a target audience by intercepting
shoppers in an actual grocery store setting, and then giving them a mail-in survey. It also
used a real product the customers took with them. Demographics could be captured on the
survey, the assumed shopping decision-makers were participants at the store, and an actual
stated preference was elicited for a non-hypothetical product.
Adamowicz, et al. (1998) explained how to use CV and CE to measure consumers’
stated preferences. They described CE as an extension of the CV method but with more
than two alternative bundles with different attributes so that estimation of preferences of
those attributes could be determined. The study in this paper pertained to consumers’
values of a woodland caribou habitat enhancement program using both CVM and CE
methods of evaluation to test for differences between the preferences and error variances
arising between the two methods.
The CE method appears to have many advantages versus the CVM approach, the
first being that it allows the researcher to value the attributes as well as situational changes.
Also, in the case of damage to a particular attribute, compensating amounts of other goods
can be calculated, rather than compensating variation based on money. Attribute-based
approaches are essential to measure the amount of other “goods” required for
compensation. Finally, CVM pertains to a precise scenario, and respondents’ choices are
based solely upon that scenario, while CE methods attempt to realize respondents’
preferences regarding the attributes of the scenario rather than the specific scenario itself.
Goldberg and Roosen (2005) composed the same experiment that used two
different methods, CE and CV, to assess health risk and food safety perceptions of chicken
breasts. Each survey was half CE and half CV, so they could capture and compare data

25
from both methods. They noted that revealed preferences were usually favored compared
to stated preferences, but stated allowed for a few advantages. The most obvious was that
preferences for non-existing products and attributes could be elicited. Also, an attribute’s
range could be extended. However, on the other hand, respondents could misinterpret or
ignore an attribute in question if it was hypothetical.
Choice experiments allow for the determination and valuation of individual
attributes and characteristics of a product. However, this method is sensitive to
misspecifications, such as the possibility of presenting the same scenario in both the CVM
and CE portions of a respondent’s survey as well as ignoring interactions between
attributes or excluding attributes that would be important to the participant. CVM methods
provide valuation functions estimated from respondents’ preferences and attitudes. CV is
often criticized for only providing hypothetical answers to hypothetical questions, which
may be true in a poorly designed survey. Four qualifications of a poorly designed CV
scenario listed by Goldberg and Roosen (2005) are as follows: strong incentives to
misrepresent true WTP; strong incentives for respondents to rely improperly on elements of
the scenario to determine their WTP; an incorrect description from the standpoint of
economic theory of the good (theoretical misspecification) or a correct description in a way
that respondents misunderstand (methodological misspecification); or inadequate sampling
design, execution, or benefit aggregation.
To examine embedding was the third objective of Goldberg and Roosen’s (2005)
experiment. Embedding implies that a respondent would not behave similarly in a real
market setting at the level at which they had stated they would be WTP. For example, in
experimental results from their study regarding health concerns in chicken breasts,

26
respondents may have indicated they would pay more for the decreased health risks as a
means of “voting” for health risk reduction, but actually would not want to pay a premium
for the reduction. Embedding could be an area of concern for many hypothetical attributes;
this is an important concept to keep in mind.
This dual method survey allows for unique results. CE shows a higher maximum
WTP and also has a wider range of WTP. Embedding effect is present in CE but not in the
CVM format. The study cannot determine which values are closer to reality, but can
identify that embedding in the CE suggests that results are biased. Goldberg and Roosen
called for more research resulting in comparable WTP measures from CVM and CE
methods.
A choice-based experiment will work best for the high-selenium beef project. It
will provide an opportunity for multiple attributes to be evaluated with a product while
forcing the participant to focus on the tradeoffs of the attributes for each individual choice
in the set.

27
CHAPTER III. METHODS
Introduction
Consumers’ willingness-to-pay for a high level of selenium in beef products has not
yet been estimated. Willingness-to-pay is defined as the amount an individual is willing to
pay to acquire some good or service, elicited from stated or revealed preferences.
Willingness-to-pay for particular product attributes depends upon how those respective
attributes affect the individual’s utility for the product. Consumer i’s utility for a beef
product, j, is represented by the equation Uij = Vij + εij, where Vij represents the meat
chosen for this particular utility function, which is characterized by its own individual
variables different from other meat products in the experiment.
That is, WTP for ground or a cut of beef is a function of the attributes of the
product. These could include, for example, selenium content, fat percentage, marbling, cut
type, and animal background. Individuals are assumed to select among products to
maximize utility. Because high-selenium products are not yet available to the marketplace,
utility must be inferred from stated-preferences or revealed through individual choices in
an experimental or hypothetical scenario.
Willingness-to-pay estimates will possibly vary among people. For example,
middle-aged men might be willing to pay more than college-aged men for prostate cancer
prevention because they might be considered more susceptible to having that form of
cancer in the near future. Consumers with a family member with cancer or a personal
association to a cancer victim or survivor might also be willing to pay more since they have
a direct emotional link with cancer and its health risks. Identifying these types of market

28
segments is essential in launching new products. If certain target consumers exist for this
product, demographics should help reveal them.
Many consumers have revealed they are willing to pay premiums for food products
that can eliminate or reduce the probability of various health ailments, including cancer
(Goldberg and Roosen, 2005). With recent research regarding selenium and its connection
with certain cancers, interest has increased in the potential marketability of selenium-
enriched products.
Since selenium naturally occurs in the earth’s soil, its availability and deficiency
levels are correlated with geographic location. Because of this, regions with high levels of
selenium foresee a potential economic opportunity to market this trace mineral in their food
products. However, additional expenses, including testing, identity-preservation, and
marketing, would result in premium costs for those products for them to be economically
viable—and these costs would be passed along to consumers. The premium that
consumers are willing to pay will be derived from their demand for naturally-occurring
selenium and their desire for potential cancer prevention. This demand cannot be estimated
using existing market data because this product and its selenium attribute are not
specifically traded in the real market, thus a choice-experiment for non-market valuation
will be used to accumulate consumers stated preferences. Limdep® will be used to analyze
the data.
Initial Survey Design
A focus group was conducted on May 10, 2006. Specific objectives were as
follows: gain information about consumers’ labeling preferences; evaluate consumers’
knowledge of functional foods and selenium; and determine product attributes with

29
potential to be co-integrated with selenium level in impact on willingness-to-pay and
attribute ranges to be represented in the main survey instrument. The focus group was
conducted according to recommendations specified in Krueger (1988). He specifies that
focus groups should consist of seven to ten unfamiliar people in a non-threatening
environment guided by a mediator or facilitator. A carefully planned outline should guide
the facilitator’s discussion.
A few weeks prior to conducting the primary focus group, seven staff members in
the Department of Agribusiness and Applied Economics at NDSU participated in an
informal focus group. Participants included three administrative assistants and four
research assistants, of which three were male and four were female, with ages ranging from
23 to 56. The objective was to refine the objectives and agenda for the primary focus
group. Also, these participants helped to narrow the choice of photos and the context and
style of questions to be posed in the focus group. The following outline is a result of the
pre-focus group meeting, and was used to guide the focus group.
I. Welcome
II. Functional Foods
a. Are you familiar with functional foods? (Moderator provides definition).
b. Do you knowingly consume or purchase these products?
III. Selenium
a. Have you heard of selenium? What have you heard of selenium? (Moderator
provides definition).
b. What are your perceptions of selenium?
c. Moderator reviews recent selenium research suggestions.

30
IV. Product Labels (sing visual aids of label pictures)
a. Where do you prefer labels on packages?
b. What type of label is the most appealing and informative?
i. Context
1. Informational (e.g., Contains selenium, which has been
known to reduce cancer.)
2. Simple (e.g., High selenium)
3. Combination
4. FDA approval/research suggests—value of either label?
ii. Location preference/effect of label on package (e.g., front/back/both)
V. Beef Product Type
a. Purchase frequency of different types (e.g., hamburger versus cuts).
b. Attributes of each of importance in purchase decision (e.g., What attributes
are most important in considering a beef cut or hamburger?)
VI. How much information would it take for you to be comfortable buying this
product or to believe you have enough knowledge about selenium/functional
foods/high selenium beef product to make an educated decision?
VII. Potential Premiums
a. What premium level range would you be willing to pay for a high-selenium
beef product?
b. Would it influence your willingness-to-pay if it was a product that would
benefit the local economy, such as being raised in-state, for example?

31
Faculty and staff members of North Dakota State University, ages 25-55, were
invited to participate. Other screening criteria included primary household shopper status,
healthy food purchaser, and beef consumer. Nine participants, all women, registered with
eight actually participating in the focus group. Demographic information obtained is as
follows in Table 3.1.
Table 3.1. Demographic information from focus group. Range Mean Std. DeviationAge 30 - 49 41 6.3 Number of children 0-3 1.8 1.3 Youngest child age 1 – 14 9.2 4.6 # of household members 2-5 3.5 1.0 Years in profession 2-25 15.5 8.3 # grocery shopping occurrences/month
3-20 7.5 5.6
Beef consumption (lb) /week 1-9 5.1 3
Yes No Use dietary supplements 4 4 Overweight 5 3 Immediate family member with cancer experience
4 4
The majority of consumers seem to be vaguely aware of selenium and have very
little knowledge of its relation to cancer or the research that supports its role in cancer-
prevention and potential as part of a functional food. Some commented that the word
selenium itself “sounds bad.” Most consumers were aware of the availability of functional
foods in the marketplace and in fact purchase them (e.g., calcium enriched orange juice),
but few were familiar with the actual term “functional food.”
The product labeling section of the discussion provided very useful information.
Three different styles of labels were pictured on cuts of beef and displayed for participants
32
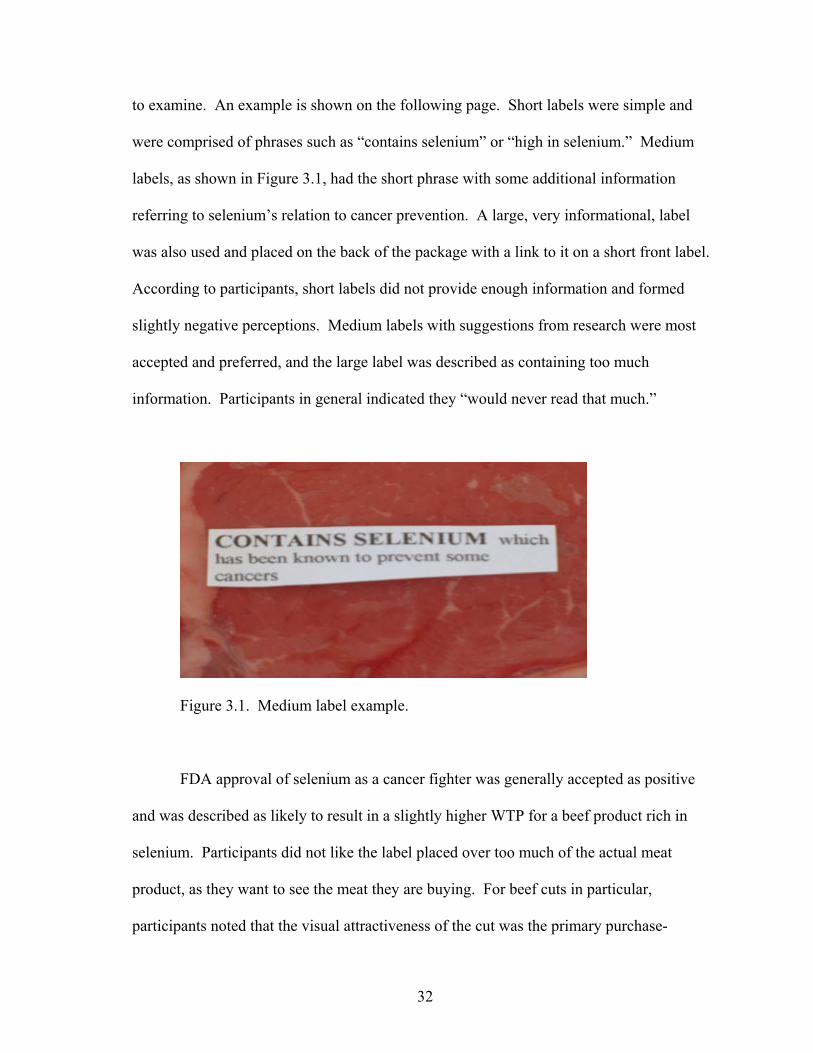
to examine. An example is shown on the following page. Short labels were simple and
were comprised of phrases such as “contains selenium” or “high in selenium.” Medium
labels, as shown in Figure 3.1, had the short phrase with some additional information
referring to selenium’s relation to cancer prevention. A large, very informational, label
was also used and placed on the back of the package with a link to it on a short front label.
According to participants, short labels did not provide enough information and formed
slightly negative perceptions. Medium labels with suggestions from research were most
accepted and preferred, and the large label was described as containing too much
information. Participants in general indicated they “would never read that much.”
Figure 3.1. Medium label example.
FDA approval of selenium as a cancer fighter was generally accepted as positive
and was described as likely to result in a slightly higher WTP for a beef product rich in
selenium. Participants did not like the label placed over too much of the actual meat
product, as they want to see the meat they are buying. For beef cuts in particular,
participants noted that the visual attractiveness of the cut was the primary purchase-

33
motivating attribute (e.g., marbling and color). A final point from the discussion suggested
a “catchy” label be used. All participants agreed that an aesthetically appealing label has
more positive effects.
The stated willingness-to-pay premium for a product high in selenium initially
ranged from 0.0% to 10%. Follow up discussions with the four participants with cancer
incidences in their immediate family extended the maximum premium to 15%.
Participants also indicated that a premium might be paid in order to support a locally based
product and economy given the natural soil placement of selenium in the Dakotas (e.g.,
Dakota-raised beef).
Experimental Design and Data
The experimental design for this scenario is to create choice sets. Discrete choice
methods were used to keep the choices presented to the participant reasonable and
consistent. More common procedures, such as ranking, were also used to elicit consumers’
preferences, but ranking was not reliable for economic analysis (Champ, Boyle, and
Brown, 2003) and, therefore, was not used.
This experiment was designed; approved by the NDSU Institutional Review Board;
and then provided to Zoomerang Market Tools, an online survey company that manages
survey panelists, to administer (www.zoomerang.com or www.zoompanel.com). Specific
explanation of the design is provided below.
Appropriate experimental design is crucial to the analysis and must be created
correctly. One must, first, identify and include all optimal attributes and levels of each
attribute and, second, group these into choice sets. A common starting block is a full
factorial design, which includes all possible combinations of attributes and attribute levels.

34
However, these are often too large and awkward for meaningful evaluation for choice
experiments. This was the case in this experiment.
By developing a subset from the full factorial design within optimality guidelines, a
more efficient choice set size is possible. For a choice design to be characterized as
efficient, four properties must be considered, as indicated by Huber and Zwerina (1996).
Based on a non-linear model, these properties are level balance, orthogonality, minimal
overlap, and utility balance. Orthogonal design techniques have been the standard mode
for creating choice sets in marketing, and orthogonality is often considered the principle
requirement of efficient designs. Level balance requires attribute levels to occur with equal
frequency within the design. For example, an attribute with two levels should be
represented with each attribute appearing in half the cases. Orthogonality is satisfied when
any levels of different attributes do not jointly occur in any choice sets, or the levels of the
attributes are uncorrelated in all choice sets. Minimal overlap is important because it
requires that occurrences of an attribute level repeating itself in a choice set be minimized.
Utility balance is satisfied by simply keeping the participants’ utility of each choice within
a choice set equal, thus no redundant or obvious choices in the set exist. Marketing
researchers have created efficient and optimal design reduction techniques for this choice
experiment based upon D-optimality.
D-Optimality
D-optimality minimizes the value of D, which is defined as the inverse of the kth
root of the determinant of the information matrix (Ω) and is represented by the equation
[ ] 1/1 −Ω=− KefficiencyD .

35
D-optimality measures the combined uncertainty of a model’s parameters and should be
used when parameter accuracy is more important than the accuracy of the fit (Crary Group,
2001-2004).
The experimental design of the survey consisted of three attributes: premium, health
claim, and origin, each having three levels. For the premium attribute, levels were
established at 5%, 10%, and 15% of the market price, based on the feedback from the focus
group. Health claim levels were that of FDA level A, FDA level C, and a suggestion based
on recent research. As mentioned in the literature review, other studies have shown little
difference between consumers’ purchase intentions when comparing level A and level C
FDA health claims. However, since consumers’ awareness and knowledge of selenium is
seemingly limited, an FDA level A claim would be considered a feasible contrast to a level
C claim. The origin attribute referred to the label design, as well as the wording, and used
“naturally rich in selenium” and “selenium fortified” phrases on the labels. The “naturally
rich in selenium” phrase was used within a plain rectangular border as well as a North
Dakota border, thus creating the third level within this attribute.
The full factorial design, offered with no reductions, presented a survey participant
with far too many alternatives from which to make one selection. Therefore, reductions
had to be made for respondents’ choices to be valuable. SAS macros made this possible.
First, desired attributes and levels are entered. The SAS macros are then able to perform
orthogonal reductions to the full factorial design and creating a possible experimental
design for use. Since this design had three attributes with three levels each, the number of
choice sets for an orthogonal and balanced experimental design needed to be a number
divisible by nine (3 x 3 = 9). The saturated design had 13 choice set runs, but because nine

36
is not a factor of 13, the optimal design was 18 choice sets—since it was the lowest
multiple of nine, greater than 13.
Eighteen choice sets may be too many for a respondent—given time requirements
and the need to keep responses meaningful for analysis. Three surveys of six questions
each is a logical strategy to determine the appropriate number of responses. This was
arranged within the programming of the same code that used the macros to create the
design and survey questions. Six of the 18 questions were taken on the first set of surveys,
the next six on the second set, and the last six for the final set of surveys. This provided an
opportunity to capture all 18 choice sets and still have an attractive survey for participation.
Each of the surveys began with a series of five beef consumption questions. They
were included because of their potential to help identify market segments for high selenium
beef. After the six choice experiment questions, each survey concluded with 15 general
demographic questions (Appendix A).
Zoomerang MarketTools, an Internet market research company, was hired to
administer and deploy the survey to a specific group of panelists. Quarterly, Zoomerang
sends a profile update to each panelist which they must update demographic,
technographic, and behavioral data in order to remain a survey panelist. Zoomerang
MarketTools delivered the survey via email message to their own registered panelists,
monitored completed survey numbers, and collected data. When the amount of surveys
needed was completed, the responses were downloaded in a Microsoft Excel format for
analysis. The population of the survey was limited to consumers registered with
Zoomerang MarketTools of the following characteristics: primary household grocery
shoppers, ages 25 and older, and regularly purchased beef and meals that included beef.

37
Individual completes for surveys one, two, and three were 485, 484, and 507, respectively,
for a total of 1476 responses.
Data were cleaned to omit incomplete entries, entries by those who were not the
primary shopper of the household, those who did not consume beef, and those entries with
extreme outliers or extreme choices that differed greatly—such as shopping for groceries
100 times per month. A total of 172 responses were omitted resulting in 1,304 responses
used for analysis.
Respondents of the survey were presented with an incentive of 50 Zoompoints.
This is part of Zoomerang’s reward system for volunteering as a survey panelist. As they
complete surveys, panelists were awarded points, which could be exchanged for physical
goods.
Survey Population
The gender of the survey population was predominately female (77%). Most (89%)
of the participants were white. Age is identified in five categories: 25-34 (16%), 35-44
(28%), 45-54 (32%), 55-64 (18%), and 65 and older (6%). Sixty-one percent of the
respondents were married.
Participants were asked to identify the highest level of education they had
completed according to the following categories: high school diploma or equivalent (25%),
some college (33%), associate’s degree (12%), bachelor’s degree (18%), and graduate
studies or more (11%). The largest group (53%) of the respondents had full-time
employment status followed by homemaker (21%), retired (16%), part-time (8%), and
student (2%). Levels like these were also used for annual household income and are shown
in Table 3.2.

38
Table 3.2. Income levels of survey participants. Income Level Number of Responses Percentage Less than $15,000 81 6% $15,000 - $24,999 144 11% $25,000 - $34,999 161 12% $35,000 - $49,999 226 17% $50,000 - $74,999 359 28% $75,000 - $99,999 190 15% $100,000 – $150,000 107 8% $150,000 and above 35 3%
In addition to these more common demographic questions, participants were also
asked to respond to some survey specific behavioral questions. Results are shown in Table
3.3. These questions are included to help identify market segments to which a high-
selenium beef product would appeal. Those reported here but not included in the model do
not exhibit a statistically significant effect on respondent preferences.
Table 3.3. Survey-specific socio-demographic responses. Question No Yes number % number % Do you intentionally purchase functional foods? 425 33% 878 67% Do you use tobacco products? 878 67% 425 33% Do you take dietary supplements? 666 51% 637 49% Are any of these following health conditions in your immediate family? Cancer 973 75% 330 25% Heart Disease 1002 77% 301 23% Diabetes 870 67% 433 33% High Blood Pressure 644 49% 659 51% Osteoporosis 1158 89% 145 11% Arthritis 793 61% 510 39% None of these conditions 939 72% 364 28% Do you have children in your household? 679 52% 624 48%
0 1 – 3 4 – 6 7 – 10 11 + Indicate the number of alcoholic drinks you consume in an average week 56% 24% 10% 4% 6%

39
CHAPTER IV. RESULTS
Multinomial Model
Results of the multinomial model indicate a good fit with a log-likelihood value of
-9986.827 and significant chi-squared values of 0.0000. Standard errors on all estimated
coefficients are low. Except for the survey specific attributes, only statistically significant
variables are discussed. Results are also shown in Table 4.1. The base case for this model
is the “none” alternative—the standard steak with no labeling or premiums.
As for the survey specific attributes and their levels, respondents do not prefer the
FDA level A, FDA level C, or recent research health claims at very significant levels,
0.0000, 0.0050, and 0.0000, respectively. These claims include the words “cancer” and
“selenium”; both may be perceived negatively as cancer is associated with a life
threatening sickness and selenium is relatively unknown to consumers. As expected, price
increases are not preferred with a Cp = 0.1265. The coefficient on “North Dakota
Naturally Rich in Selenium” and “Selenium Fortified” labels is as expected (positive), but
the variables are not significant.
The “Naturally Rich in Selenium” label was not included. The model would not
run if both “Naturally Rich in Selenium” labels were included, presumably because they
are not differentiated by respondents. Only the label border differed, and this only slightly
(i.e., the North Dakota label border was in the shape of North Dakota).
Many socio-demographic and consumer behavior variables are included in the
model to allow for investigation of them on consumers’ preferences toward individual
health claims. Some of these variables are significant to only one of the purposed health
claims and, therefore, are not discussed here (refer to Table 4.2 discussed later).

40
Table 4.1. Health claim preferences Variable (Health Claim Interaction)
Coefficientand Sign
Standard Error
Level of Significance
Marginal Effect
FDA Level A Health Claim -1.837 0.398 0.0000 FDA Level C Health Claim -1.576 0.455 0.0050 Recent Research Health Claim -2.190 0.437 0.0000 Price -0.679 0.444 0.1265 North Dakota Label 0.269 0.040 0.4978 Fortified Label 0.499 0.040 0.2126 Functional Food Purchaser (A) 0.613 0.067 0.0000 13.926 Functional Food Purchaser (C) 0.567 0.077 0.0000 2.029 Functional Food Purchaser (R) 0.833 0.076 0.0000 -0.890 ≥ $50,000 household income (A) 0.171 0.065 0.0083 10.916 ≥ $50,000 household income (C) 0.412 0.076 0.0000 9.992 ≥ $50,000 household income (R) 0.249 0.071 0.0005 0.451 Age 35 – 45 (A) 0.302 0.154 0.0489 -0.337 Age 35 – 45 (C) 0.210 0.179 0.2409 3.814 Age 35 – 45 (R) 0.329 0.168 0.0506 -1.267 Age 45 – 55 (A) 0.171 0.064 0.0083 10.916 Age 45 – 55 (C) 0.412 0.076 0.0000 9.992 Age 45 – 55 (R) 0.249 0.071 0.0005 0.451 Age 55 – 65 (A) 0.566 0.103 0.0000 -0.562 Age 55 – 65 (C) 0.624 0.125 0.0000 -0.492 Age 55 – 65 (R) 0.697 0.111 0.0000 -1.073 Exercise 0 days / week (A) -0.276 0.100 0.0059 10.916 Exercise 0 days / week (C) -0.212 0.117 0.0709 -0.416 Exercise 0 days / week (R) -0.561 0.110 0.0000 1.734 Exercise 1-2 days / week (A) 0.232 0.086 0.0071 3.887 Exercise 1-2 days / week (C) -0.651 0.101 0.5186 -0.855 Exercise 1-2 days / week (R) -0.170 0.923 0.0652 3.411 Exercise 3-4 days / week (A) 0.263 0.083 0.0015 -6.257 Exercise 3-4 days / week (C) 0.145 0.095 0.1271 -0.855 Exercise 3-4 days / week (R) 0.649 0.088 0.4610 4.926 Exercise 5-7 days / week (A) 0.167 0.105 0.1117 -5.272 Exercise 5-7 days / week (C) 0.300 0.121 0.0709 -0.855 Exercise 5-7 days / week (R) 0.113 0.111 0.3085 -0.850 High blood pressure (A) 0.162 0.066 0.0142 2.048 High blood pressure (C) 0.216 0.076 0.0045 -2.295 High blood pressure (R) 0.123 0.072 0.0879 -1.006 Hispanic / Latino / Spanish (A) 0.586 0.261 0.0247 -0.350

41
Table 4.1. (continued) Variable (Health Claim Interaction)
Coefficientand Sign
Standard Error
Level of Significance
Marginal Effect
Hispanic / Latino / Spanish (C) 0.577 0.291 0.0472 0.384 Hispanic / Latino / Spanish (R) 0.582 0.305 0.0568 1.945 Tobacco User (A) 0.108 0.064 0.0915 5.978 Tobacco User (C) -0.130 0.076 0.0879 7.255 Tobacco User (R) 0.822 0.071 0.2443 0.297
Marginal effects of socio-demographic variables are also included. Marginal effects are
explained as the effect of a change in attribute ‘m’ of alternative ‘j’ on the probability that
the individual would choose alternative ‘k’ (where k may or may not equal j) (Greene,
1998), mathematically written as
mkjijijk PPkjmxkyobm βδ ])(1[)(/][Pr)( −=−=∂=∂= .
As expected, the most influential variables towards preference of health claims are
consistent with that of aforementioned qualities of functional food shoppers. Those who
intentionally purchase functional foods prefer FDA health claims A and C, especially the
level A, which is logical in that they are the segment who would have a greater probability
of understanding the significance and implications of FDA health claims and their
respective levels. Individuals with household income of $50,000 or greater prefer all three
of the health claims at highly significant levels and the marginal effect is important for
level A and C claims. Age affects health claim preferences. Marginal effects indicate that
the most influential results are age’s 45-54’s preference for FDA level A and C health
claims. All other categories are relatively unimportant. Those 55-65 years of age do not
prefer the health claims.

42
Another attribute of functional food purchasers is exercising, which also is
significant. Results of the study show those who exercise not at all or 1-2 times per week
prefer FDA level A health claims. Exercising more than twice a week has a negative
marginal effect on respondents’ preference for the FDA level A health claim. The last
significant quality of this model that is related to functional food market segments is higher
education. Having at least a bachelor’s of science degree is significant to FDA level A and
C health claims, and has a positive marginal effect (Table 4.2).
Table 4.2. Health claim preferences: Inconclusive effect on health claim.1 Variable (Health Claim Interaction)
Coefficientand Sign
Standard Error
Level of Significance
Marginal Effect
Has at least B.S. Degree (A) -0.154 0.071 0.0317 3.124 Has at least B.S. Degree (C) 0.160 0.078 0.0403 3.703 Age (C) -0.150 0.095 0.1143 -0.332 Arthritis in immediate family (R) 0.339 0.073 0.0000 0.670 Black / African American (R) 0.670 0.264 0.0112 0.153 Cancer in immediate family (R) -0.214 0.082 0.0088 0.297 Diabetes (C) -0.154 0.081 0.0572 5.295 Four Steaks / Month (A) -0.208 0.064 0.0012 -4.733 Four Steaks / Month (R) -0.144 0.070 0.0406 -0.834 Gender (R) -0.227 0.083 0.0061 0.487 Has children (A) 0.138 0.067 0.0450 6.687 Heart Disease (R) -0.181 0.087 0.0366 1.472 Married (C) -0.141 0.073 0.0538 -2.486 Osteoporosis (A) 0.224 0.099 0.0231 -0.169 Osteoporosis (R) 0.167 0.107 0.1175 0.384
1 Variables included in the table are those where impact on preference for health claim was inconclusive (i.e., significant for one or two health claims).
Health issues within the immediate family are potentially indicative of purchase
behavior according to our focus group information. Although five health issues within
individuals’ immediate families were asked within the survey, the only significant result

43
consistent with more than one health claim is having high blood pressure in the immediate
family. These individuals prefer Level A health claims, but do not prefer the Level C or
recent research health claims.
Hispanic respondents’ preference for all three health claims is significant, but
marginal effects are small and conflicting. Lastly, tobacco users prefer Level A and C
health claims.
Table 4.2 shows results of variables significant to only one or two health claims in
the model. Of these, respondents with diabetes in their immediate family have a preference
for the FDA level C health claim. Those respondents having children also exhibit a
valuable positive preference for FDA level A health claims. The other significant
demographic/health claim variables have small marginal effects.

44
CHAPTER V. CONCLUSIONS
Introduction
Chapter V presents a short summary of this thesis. A short discussion explains the
methods used and the logit results obtained from the procedure. Key conclusions and
results are described, followed by limitations and suggestions for further studies in this
subject matter.
Summary of Thesis
Cancer is an enormous health concern in the United States and the rest of the world.
Selenium is an element that has been scientifically proven to show some cancer
preventative characteristics, thus livestock and grain producers are exploring potential
high-selenium food marketing opportunities. A choice experiment was conducted to
identify characteristics of market segments that show interest in a high-selenium beef
product. Participants were able to choose between different levels of health claim approval
and research, prices, and selenium origin.
Data were obtained from a nationwide Internet survey that was limited to primary
grocery shoppers of a household who were older than 25 years of age. Participants were
asked to choose among four beef products within each of six choice sets. They were
informed before choosing that all steaks were equal, with only differences being in labels
and prices as they appeared on the survey instrument. Socio-economic and behavioral data
were also collected.
Data were analyzed using Limdep®. The dependent variable was choice, which
was one of the four choices for each set from which each participant selected. Independent

45
variables included attribute levels of the choice product, price, and socio-demographic and
behavioral variables.
Conclusions and Explanations
The first objective of this study was to identify the preferred level of selenium beef
attributes, including price, origin of selenium, and label-claim made regarding the value of
selenium as a cancer preventative. As expected, consumers prefer a lower priced product,
which agrees with economic theory. Actual values for a high-selenium beef product were
not determined because if they are not willing to pay a premium for this product, there is no
reason to pursue a WTP level until further consumer education is accomplished. Health
claims have a negative effect on preference compared to the control steak. This may be
due to the fact that the word “cancer” is used in the labeling and has a negative effect on
preferences. This is consistent with Gilbert’s (2000) and Schmidt’s (2000) findings that a
positive claim has higher appeal than a claim of fear or negative claim, such as “can reduce
risk of cancer.”
Due to a general lack of knowledge pertaining to selenium, its higher level in beef
may have been interpreted negatively. Focus group participants revealed that selenium
does “sound bad.” This viewpoint may be widespread. The same type of perception (i.e.,
negative interpretation of a positive attribute) has been found for irradiated beef.
Labeling or proclaiming selenium origin based upon the “Naturally Rich in
Selenium,” “Naturally Rich in Selenium” with a North Dakota border, and “Selenium
Fortified” labeling is ineffective. These labels might need to be differentiated more to
make an impact on the results obtained from participants. Another possibility is that
consumers may not care how the product became high in selenium.

46
Gauging consumers’ level of knowledge concerning selenium health characteristics
is the second objective. The focus group shows that a lack of knowledge regarding
selenium and its role in health is dominant. It was therefore not considered necessary to
include this query in this experiment.
Lastly, this study aimed to find market segments that would potentially be valuable
to a high-selenium beef industry. From previous research mentioned in Chapter II,
functional foods are more frequently purchased by consumers with higher education and
income. This held true to this experiment as income levels greater than $50,000 and
having at least a bachelor’s degree both had positive preferences on the FDA health claims.
Higher education might be an indicator of the significance that an FDA approval or label
carries. These positive preferences for either FDA health claim also could be related to
previous research indicating consumers’ preference for a FDA level A, B, or C health claim
to a level D health claim or no FDA health claim.
Limitations and Further Work
Identifying a well-articulated health claim will be very important to future studies.
This will allow the consumer to make a decision on just selenium rather than trying to
define a level of health claim that would be acceptable for an element they know nothing
about. The labeling of selenium origin should be more differentiated. If the North Dakota
origin is important to include, it should be more than just a North Dakota border versus the
rectangular border of the regular “Naturally Rich in Selenium” label. For example, the
label might specify “North Dakota Grown Beef.”
Due to the widespread lack of knowledge, point of purchase information about
selenium would be beneficial to inform consumers about the benefits and hopefully remove

47
the consumers’ fear of including a previously foreign nutrient in their food. This may be
the most important limitation of this research, since promotion of an unknown substance
approaches a high level of difficulty. As Schmidt (2000) indicated, communication from
producer to consumer is key to obtaining accurate information. Without an understanding
of selenium, consumers will not be able to discern a value for a selenium rich product. For
example, fluoride was perceived negatively until consumers were educated and
comfortable enough with their level of understanding to make informed purchase decisions.

48
REFERENCES
Adamowicz, W., P. Boxall, M. Williams, and J. Louviere. 1998. “Stated Preference Approaches for Measuring Passive Use Values: Choice Experiments and Contingent Valuation.” American Journal of Agricultural Economics 80:64-75.
Alpizar, F., F. Carlsson, and P. Martinsson. 2003. “Using Choice Experiments for Non-
Market Valuation.” Economic Issues 8(1):83-110. American Cancer Society. 2006. Cancer Facts and Figures 2006. Atlanta GA: American
Cancer Society, Inc. Burn, P. and G.M. Kishore. 2000. “Food as a Source of Health Enhancing Compounds.”
AgBioForum 3(1):3-9. Blot, W.J., J.Y. Li, P.R. Taylor, W. Guo, S. Dawsey, G.Q. Wang, C.S. Yang, S.F. Zheng,
M. Gail, G.Y. Li, B.Q. Liu, J. Tangrea, Y.H. Sun, F. Liu, F. Fraumeni, Y.H. Zhang, and B. Li. 1993. “Nutrition Intervention Trials in Linxian, China: Supplementation with Specific Vitamin/Mineral Combinations, Cancer Incidence, and Disease-Specific Mortality in the General Population. Journal of National Cancer Institute 85:1483-1490.
Bonnelli, L., A. Camoriano, P. Ravelli, G. Massale, P. Bruzzi, and H. Aste. 1998.
“Reduction of the Incidence of Metachronous Adenomas of the Large Bowel by Means of Antioxidants.” Proceedings of the International Selenium Tellurium Development Association Meeting, Scottsdale, AZ, pp. 91-94.
Champ, P.A., K.J. Boyle, and T.C. Brown, ed. 2003. A Primer on Nonmarket Valuation.
Boston: Kluwer Academic Publishers. Clark, L.C., G.F. Combs, Jr., B.W. Turnbull, E.H. Slate, D. Alberts, et al. 1996. “The
Nutritional Prevention of Cancer with Selenium: A Randomized Clinical Trial.” Journal of the American Medical Association 276:1957-1963.
Clark, L.C., B. Dalkin, A. Krongrad, G.F. Combs, Jr., B.W. Turnbull, et al. 1998.
“Decreased Incidence of Prostate Cancer with Selenium Supplementation: Results of a Double-Blind Cancer Prevention Trial.” British Journal of Urology 81:730-734.
Combs, G.F., Jr. 2001. “Impact of Selenium and Cancer-Prevention Findings on the
Nutrition-Health Paradigm.” Nutrition and Cancer 40(1):6-11. Combs, G.F., Jr. 2000. “Considering the Mechanisms of Cancer Prevention by Selenium.”
In AICR, ed. Nutrition and Cancer Prevention New York: Kluwer Academic / Plenum Publishers, pp.107-117.

49
Crary Group. 2001-2004. WebDOE FAQ. Internet. http://www.webdoe.cc/help/ (Visited September 18, 2006).
Garretson, J.A. and S. Burton. 2000. “Effects of Nutrition Facts Panel Values, Nutrition
Claims, and Health Claims on Consumer Attitudes, Perceptions of Disease-Related Risks, and Trust. Journal of Public Policy & Marketing 19(2):213-227.
Gibson, G.R. and C.M. Williams, ed. 2000. Functional Foods: Concept to Product. Boca
Raton, FL: CRC Press. Gilbert, L. 2000. “Marketing Functional Foods: How to Reach Your Target Audience.”
AgBioForum 3(1):20-38. Goldberg, I. and J. Roosen. 2005. “Measuring Consumer Willingness to Pay for a Health
Risk Reduction of Salmonellosis and Campylobacteriosis.” Paper presented at 11th congress of the European Association of Agricultural Economists, Copenhagen Denmark, 24-27 August.
Greene, W.H. 1998. Limdep Version 7.0 User’s Manual, Revised Edition. Plainview, NY:
Econometric Software, Inc. Hintze, K.J., G.P. Lardy, M.J. Marchello, and J.W. Finley. 2001. “Areas with high
Concentrations of S4elenium in the Soil and Forage Produce Beef with Enhanced Concentrations of Selenium.” Journal of Agricultural and Food Chemistry 49:1062-1067.
Hintze, K. J., G.P. Lardy, M.J. Marchello, and J.W. Finley. 2002. “Selenium Accumulation
in Beef: Effect of Dietary Selenium and Geographical Area of Animal Origin.” Journal of Agricultural and Food Chemistry 50:3938-3942.
Huber, J. and K. Zwerina. 1996. “The Importance of Utility Balance in Efficient Choice
Designs.” Journal of Marketing Research 33:307-317. Kozup, J.C., E.H. Creyer, and S. Burton. 2003. “Making Healthful Food Choices: The
Influence of Health Claims and Nutrition Information on Consumers’ Evaluations of Packaged Food Products and Restaurant Menu Items.” Journal of Marketing 97(April):19-34.
Krueger, R.A. 1988. Focus Groups: A Practical Guide for Applied Research. Newbury
Park, CA: Sage Publications. Lawler, T.L., J.B. Taylor, J.W. Finley, and J.S. Caton. 2004. “Effect of Supratnutritional
and Organically Bound Selenium on performance, Carcass Characteristics, and Selenium Distribution in Finishing Beef Steers.” Journal of Animal Science 82:1488-1493.

50
Lesch, W.C. 2004. “Understanding the Market for Selenium-Attribute Foods.” PowerPoint presentation presented at USDA Human Nutrition Research Center, Grand Forks, ND, 3-4 November.
Li, J.Y., P.R. Taylor, B. Li, W.J. Blot, W. Guo, J., S. Dawsey, G.Q. Wang, C.S. Yang, S.F.
Zheng, M. Gail, G.Y. Li, B.Q. Liu, J. Tangrea, Y.H. Sun, F. Liu, F. Fraumeni, and Y.H. Zhang. 1993. “Nutrition Intervention Trials in Linxian, China.” Journal of National Cancer Institute 85:1492-1498.
Lusk, J.L., and D. Hudson. 2004. “Willingness-to-Pay Estimates and Their Relevance to
Agribusiness Decision Making.” Review of Agricultural Economics 22(2):152-169. Lusk, J.L., J.R. Pruitt, and B. Norwood. 2006. “Consumer Demand for a Ban on
Antibiotic Drug Use in Pork Production.” American Journal of Agricultural Economics 88(4):1015-1033.
Lusk, J.L., M. Jamal, L. Kurlander, M. Roucan, and L. Taulman. 2005. “A Meta-Analysis
of Genetically Modified Food Valuation Studies.” Journal of Agricultural and Resource Economics 30(1):28-44.
Mark-Herbert, C. 2003. “Development and Marketing Strategies for Functional Foods.”
AgBioForum 6(1&2):75-78. Maynard, L.J. and S.T. Franklin. 2003. “Functional Foods as a Value-Added Strategy: The
Commercial Potential of “Cancer-Fighting” Dairy Products. Review of Agricultural Economics 25(2):316-331.
Nalley, L.L., D. Hudson, R.W. Rogers, J.M. Martin, and J.L. Herring. 2004. “In-store
Evaluation of Consumer Willingness to Pay for “Farm-Raised” Pre-Cooked Roast Beef: A Case Study.” Journal of Agribusiness 22(2):163-173.
Prasad, M.R.P., M.A. Mukundan, K. Krishnaswamy. 1995. “Micronuclei and Carcinogen
DNA Adducts as Intermediate End Points in Nutrient Intervention Trial of Precancerous Lesions in the Oral Cavity. European Journal of Cancer, Part B: Oral Oncology 31B:155-159.
Rayman, M.P. 2000. “The Importance of Selenium to Human Health.” The Lancet
356:233-241. (Issue 9225) Roe, B., A.S. Levy, and B.M. Derby. 1999. “The Impact of Health Claims on Consumer
Search and Product Evaluation Outcomes: Results from FDA Experimental Data.” Journal of Public Policy & Marketing 18(1):89-105.
Schmidt, D.B. 2000. “Consumer Response to Functional Foods in the 21st Century.”
AgBioForum 3(1):14-19.
51
Schwarz, K. and C.M. Foltz. 1957. “Selenium as Integral Part of Factor 3 Against Dietary Necrotic Liver Degeneration.” Journal of the American Chemistry Society 79:3292-3293.
Shi, B., and J. Spallholz. 1994. “Selenium from Beef is Highly Bioavailable as assessed by
Liver Glutathione Peroxidase (EC 1.11.1.9) Activity and Tissue Selenium.” British Journal of Nutrition 72:873-881.
Stanton, C., G. Gardiner, H. Meehan, K. Collins, G. Fitzgerald, P.B. Lynch, and R.P. Ross.
2001. “Market Potential for Probiotics.” American Journal of Clinical Nutrition 73:476s–483s.
Taylor, C.L. 2003. “Selenium and Certain Cancers (Qualified Health Claim: Final
Decision Letter) (Docket No. 02P-0457).” Washington DC: U.S. Food and Drug Administration, Center for Food Safety and Applied Nutrition.
Teratanavat, R.P. and N.H. Hooker. 2004. “Do People Understand Qualified Health
Claims? Evidence from Experimental Studies.” Ph.D. dissertation, The Ohio State University.
Wansink, B. 2003. “How Do Front and Back Package Labels influence Beliefs about
Health Claims?” The Journal of Consumer Affairs 37(2):305-316. Wilson, C.A. and S.D. Abbott. 2005. “Who Buys Functional Foods?” Agri Marketing
October, pp. 58-59. Yang, G.Q., Yin S, Zhou R, Gu L, Yan B, et al., 1989. “Studies of Safe Maximal Daily
Dietary Se Intake in a Seleniferous Area in China. II. Relation Between Se Intake and the Manifestations of Clinical Signs and Certain Biochemical Alterations in Blood and Urine.” Journal of Trace Element Electrolytes Health Dis 3:123-130.
Yu, S.Y., J.J. Zhu, W.G. Li, Q.S. Huang, C. Zhi-Huang, Q. Nan-Zang, and C. Hou. “A
Preliminary Report on the Trials of Primary Liver Cancer in High-Risk Populations with Nutritional Supplementation of Selenium in China.” Biological Trace Element Research 29:289-294.

52
APPENDIX A. SURVEYS

53
Survey 1 This study is a graduate student research project in the Department of Agribusiness and Applied Economics at North Dakota State University. The research is to explore consumer food consumption and product preferences. Results of this study will help us learn more about potential market opportunities. You are invited to participate in this research study. Your participation is voluntary; however, your assistance would be greatly appreciated in making this a meaningful survey. It should take about 5-10 minutes to complete the survey. Your identity will not be revealed in the experiment results. Only group comparisons will be made and reported in summary form. If you have questions about the rights of human participants in research, or to report a problem, you should contact the NDSU IRB Office, (701) 231-8908. Any questions about the research project can be addressed by contacting Scott Hovde, graduate student at NDSU, at [email protected], or by calling Cheryl Wachenheim, Scott’s advisor and NDSU Agribusiness and Applied Economics faculty member, at (701) 231-7452. Thank you for your participation in this study.
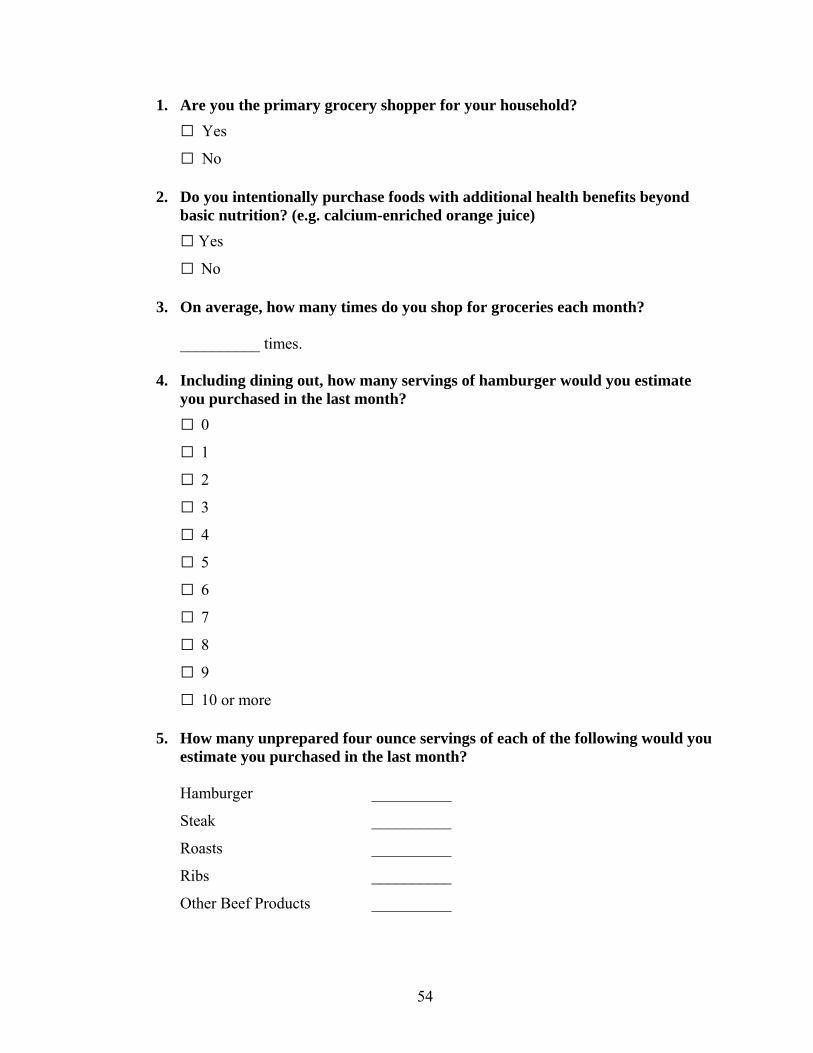
54
1. Are you the primary grocery shopper for your household? Yes
No 2. Do you intentionally purchase foods with additional health benefits beyond
basic nutrition? (e.g. calcium-enriched orange juice) Yes
No 3. On average, how many times do you shop for groceries each month? __________ times. 4. Including dining out, how many servings of hamburger would you estimate
you purchased in the last month? 0
1
2
3
4
5
6
7
8
9
10 or more
5. How many unprepared four ounce servings of each of the following would you estimate you purchased in the last month?
Hamburger __________
Steak __________
Roasts __________
Ribs __________
Other Beef Products __________

55
6. How many prepared four ounce servings of each of the following would you estimate you purchased in the last month?
Hamburger __________
Steak __________
Roasts __________
Ribs __________
Other Beef Products __________
Please read the following product description for a new product.
Selenium is an essential trace mineral to our health and has shown some recent evidence of having cancer prevention qualities. The beef product shown below is a top sirloin steak. The white-out area is just where the store’s label was. Please respond as though you are going to purchase this sirloin steak. All pictures following this steak are of steaks similar to the one in this picture. Choice “D” is the standard steak without any selenium labeling at the current market price.

56
Question 7a.
7. Which of the above four products would you prefer to purchase? A
B
C
D

57
Question 8a.
8. Which of the above four products would you prefer to purchase? A
B
C
D

58
Question 9a.
9. Which of the above four products would you prefer to purchase? A
B
C
D

59
Question 10a.
10. Which of the above four products would you prefer to purchase? A
B
C
D

60
Question 11a.
11. Which of the above four products would you prefer to purchase? A
B
C
D

61
Question 12a.
12. Which of the above four products would you prefer to purchase? A
B
C
D

62
13. Do you use tobacco products? Yes
No 14. How many alcoholic beverages do you consume in an average week? 0
1-3
4-6
7-10
11-15
15 or more 15. Do you take dietary supplements? Yes
No 16. How many days do you exercise in a typical week? 1
2
3
4
5
6
7
17. Have you or anyone in your family experienced any of the following health conditions? (check all that apply)
Cancer
Heart Disease
Diabetes
High Blood Pressure
Osteoporosis
Arthritis
None of the Above

63
18. Please indicate your gender. Male
Female 19. Please select the category that indicates your age.
25 – 34
35 – 44
45 – 54
55 – 64
65 – 74
75 and older
20. Do you have children under the age of 18 living in your household? Yes
No 21. If you have children in household, please indicate the number of children in
the appropriate age group. 0 – 4 __________
5 – 9 __________
10 – 14 __________
15 – 17 __________
22. Which of the following best describes your marital status? Single, never married
Married
Living with partner
Divorced
Separated
Widowed
Prefer not to answer

64
23. Which one of the following best describes your employment status? Employed full-time
Employed part-time
Self employed
Not employed, looking for work
Not employed, not looking for work
Retired
Student
Homemaker
Prefer not to answer 24. What best describes your level of education? Some high school or less
High School graduate or equivalent
Some college
Associate’s degree
Bachelor’s degree
Graduate or professional degree
Prefer not to answer 25. Which one of the following ranges includes your total yearly household income
before taxes? Less than $15,000
$15,000 - $24,999
$25,000 - $34,999
$35,000 - $49,999
$50,000 - $74,999
$75,000 - $99,999
$100,000 - $149,999
$150,000 or more

65
26. Which one of the following best describes you? White/Caucasian
Spanish/Latino/Hispanic
Black/African American
Asian
Pacific Islander
Native American
Other
Prefer not to answer 27. In which state do you live? _____________________
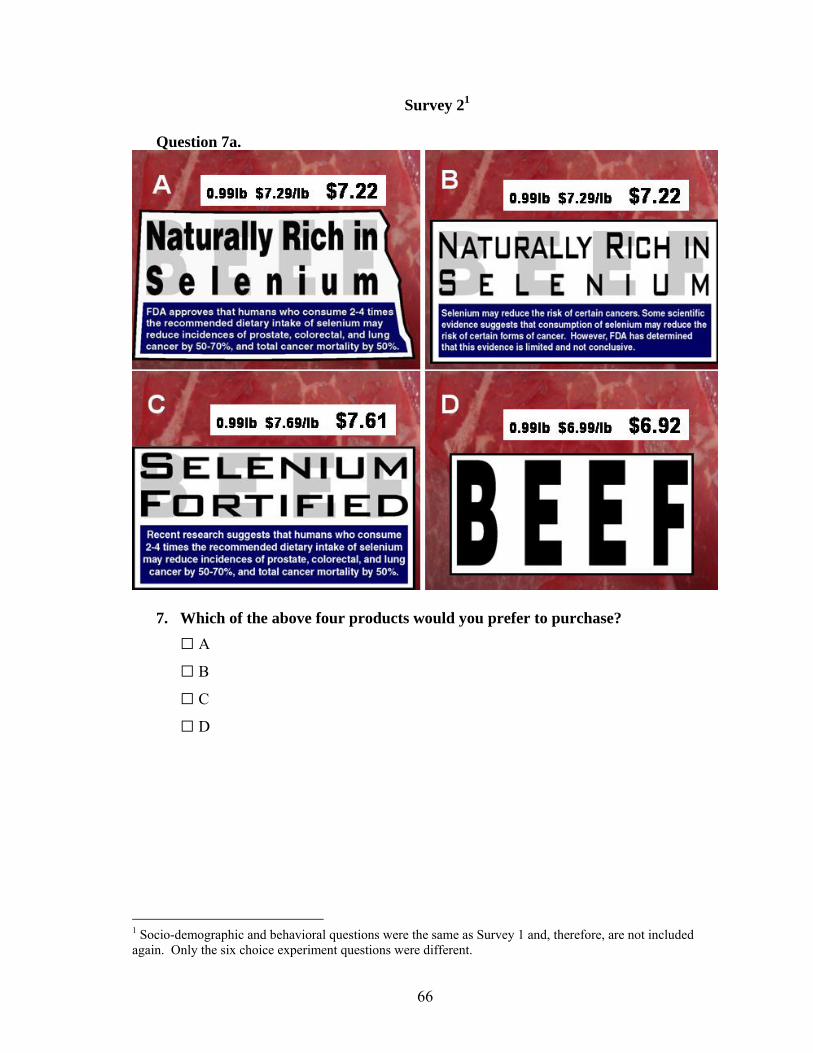
66
Survey 21 Question 7a.
7. Which of the above four products would you prefer to purchase? A
B
C
D
1 Socio-demographic and behavioral questions were the same as Survey 1 and, therefore, are not included again. Only the six choice experiment questions were different.

67
Question 8a.
8. Which of the above four products would you prefer to purchase? A
B
C
D

68
Question 9a.
9. Which of the above four products would you prefer to purchase? A
B
C
D

69
Question 10a.
10. Which of the above four products would you prefer to purchase? A
B
C
D

70
Question 11a.
11. Which of the above four products would you prefer to purchase? A
B
C
D
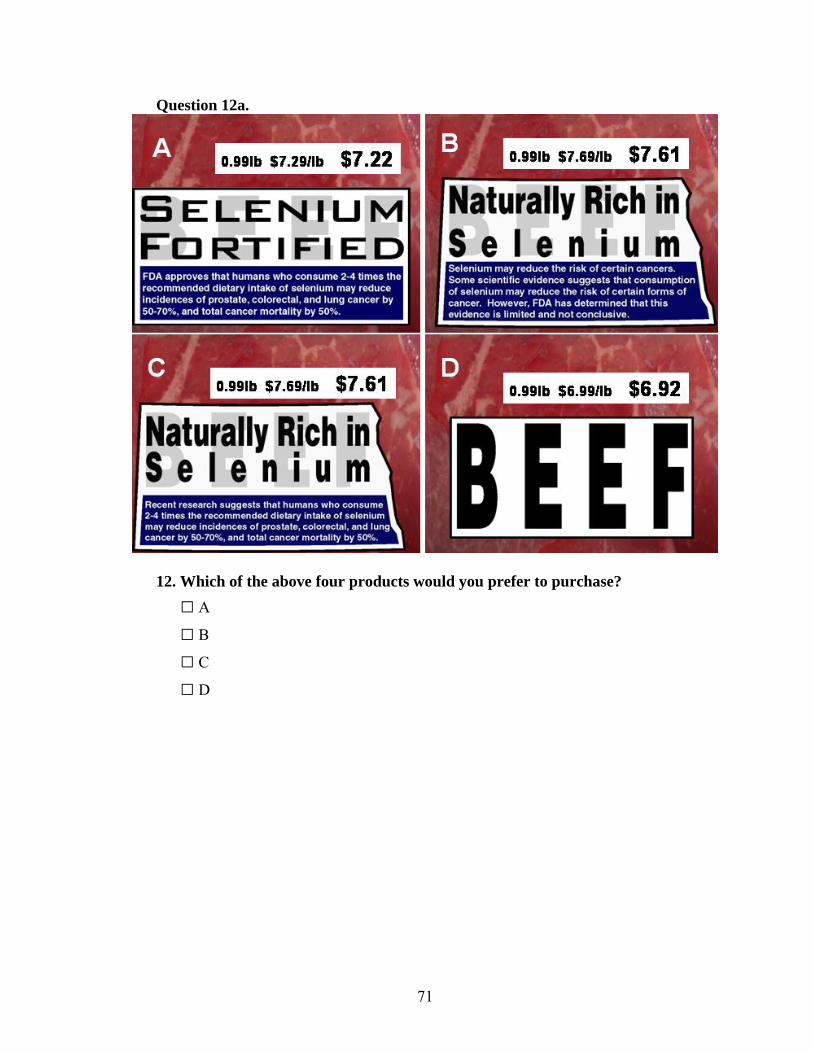
71
Question 12a.
12. Which of the above four products would you prefer to purchase? A
B
C
D

72
Survey 32
Question 7a.
7. Which of the above four products would you prefer to purchase? A
B
C
D
2 Socio-demographic and behavioral questions were the same as Survey 1 and, therefore, are not included again. Only the six choice experiment questions were different.

73
Question 8a.
8. Which of the above four products would you prefer to purchase? A
B
C
D

74
Question 9a.
9. Which of the above four products would you prefer to purchase? A
B
C
D

75
Question 10a.
10. Which of the above four products would you prefer to purchase? A
B
C
D

76
Question 11a.
11. Which of the above four products would you prefer to purchase? A
B
C
D

77
Question 12a.
12. Which of the above four products would you prefer to purchase? A
B
C
D