Embed Size (px)
Citation preview

Identifying malicious hosts involved in periodiccommunications
Giovanni Apruzzese, Mirco Marchetti, Michele Colajanni,Gabriele Gambigliani Zoccoli, Alessandro Guido
Department of Engineering “Enzo Ferrari”University of Modena and Reggio Emilia
Modena, Italy
{giovanni.apruzzese, mirco.marchetti, michele.colajanni, alessandro.guido}@unimore.it,[email protected]
Abstract—After many research efforts, Network Intru-sion Detection Systems still have much room for improve-ment. This paper proposes a novel method for automaticand timely analysis of traffic generated by large networks,which is able to identify malicious external hosts even iftheir activities do not raise any alert by existing defensivesystems. Our proposal focuses on periodic communications,since our experimental evaluation shows that they are morerelated to malicious activities, and it can be easily integratedwith other detection systems. We highlight that periodic net-work activities can occur at very different intervals rangingfrom seconds to hours, hence a timely analysis of long time-windows of the traffic generated by large organizations is achallenging task in itself. Existing work is primarily focusedon identifying botnets, whereas the method proposed in thispaper has a broader target and aims to detect externalhosts that are likely involved in any malicious operation.Since malware-related network activities can be consideredas rare events in the overall traffic, the output of theproposed method is a manageable graylist of external hoststhat are characterized by a considerably higher likelihoodof being malicious compared to the entire set of externalhosts contacted by the monitored large network. A thoroughevaluation on a real large network traffic demonstratesthe effectiveness of our proposal, which is capable ofautomatically selecting only dozens of suspicious hosts fromhundreds of thousands, thus allowing security operators tofocus their analyses on few likely malicious targets.
Index Terms—beaconing, periodicity, graylist, clustering
I. INTRODUCTION
The defense of large information systems is character-
ized by two major problems. On one hand, attackers are
capable of performing attacks spanning over long periods
of time and employing advanced techniques, allowing
them to avoid detection [1]; on the other hand, security
analysts are overwhelmed by the huge volume of logs
generated daily by network traffic [2]. Furthermore, the
majority of Network Intrusion Detection Systems (NIDS)
are unable to detect novel forms of attacks [1] or tend to
raise several false alarms [3]. Proposals to increase the
efficacy of NIDSs are oriented to improve their ability
to detect attacks [4], or to provide security analysts
with concise information about ongoing attacks [5]–[8].
Other solutions rely on prioritization techniques of likely
infected internal hosts [9].
This paper is focused to support automatic security
analyses by identifying external hosts that are performingattacks against the monitored network, even if their activ-
ities do not raise any NIDS alert. The proposed method
analyzes network flows and is able to automatically
generate a graylist of few external hosts characterized
by a likelihood of being malicious that is several orders
of magnitude greater with respect to all the external
hosts contacted by the monitored network. The goal is to
identify hosts involved in periodic communications (also
referred to as beaconing) at different time intervals. Thedetection of malicious beaconing activities is still an open
research problem [10]–[12], which is further complicated
in large networks due to the difficulty of performing
accurate and timely analyses of huge volumes of network
traffic. Moreover, we have experimentally verified that
external hosts exhibiting periodic connections present
a higher rate of malicious behaviors when compared
to hosts with irregular communication patterns. Our
novel algorithm detects periodic behaviors by analyzing
network flows. It is capable of labeling as periodic even
communications that do not display a strict periodic
pattern, thus allowing the detection of possible evasion
attempts.
Our proposal is evaluated with a thorough set of
experiments performed on a large, real network without
the creation of any synthetic traffic.
This paper is structured as follows. Section II discusses
related literature. Section III describes the proposed
method. Section IV presents an extensive evaluation of978-1-5386-1465-5/17/$31.00 ©2017 European Union

the performance and efficacy of our proposal. Section V
reports conclusions and future work.
II. RELATED WORK
We present a novel method for automatically generat-
ing a graylist of external hosts with a higher probability
of being involved in malicious beaconing activities with
respect to the entire set of external hosts contacted
by the monitored organization. Our proposal leverages
clustering techniques applied to network flows. There are
two main areas of related work: NIDS alarm optimization
and detection of malicious beaconing activities.
Each NIDS generates huge amounts of alerts whose
manual inspection is often unfeasible for human opera-
tors, hence several solutions aim to improve the informa-
tion presented to security analysts by presenting shorter,
comprehensive records. The authors in [6] discuss an
algorithm to reduce the volume of alarms produced by
multiple NIDSs through clustering alerts raised by simi-
lar malicious actions. Other papers, such as [5], propose
to cluster alarms to detect their root-causes. Valeur et
al. [7] transform groups of correlated alarms into intru-
sion reports. More recent works propose prioritization
techniques for internal hosts. Authors of [13] and [8]focus on multistep attacks. The proposal in [14] leverages
the alarms raised by the most critical assets. In [9]
an architecture that prioritizes internal hosts upon their
likelihood of being involved in several kinds of malicious
cyber-attacks is proposed. All these papers share the
broad goal of supporting security analysts by allowing
them to focus on the most relevant alarms detected by
a NIDS. In contrast, our proposal combines intrusion
alerts together with network flow analyses and clustering
algorithms to identify the most suspicious external hostseven if their actions do not raise any NIDS alert.
The detection of malicious beaconing activities is a
well known problem in the field of botnet detection.
Gu et al. [15] devise a framework for detecting internal
hosts belonging to botnets through clustering of network
traffic, based on the assumption that bots belonging to
the same botnet have similar network behaviors. Authors
of [16] plan to discover botnet infected hosts through su-
pervised machine learning algorithms applied to network
flows by identifying the key features of Command and
Control communications. A similar solution is proposed
in [12], although its main focus is on detecting Command
and Control servers instead of bots.
Our method is not limited to detecting botnet-related
malware, but extends to any possible external threat that
is performing beaconing activities. Unlike botnet-related
proposals, we do not make any assumption about the
characteristics displayed by the analyzed traffic. Related
work, such as [10], inspects DNS logs to discover ma-
licious beaconing activities performed by internal hosts,
whereas the proposal in [11] relies on the analysis of
both DNS and web-proxy logs. On the other hand,
we aim to detect malicious external hosts, which is
a tougher problem because a large organization may
contact hundreds of thousands of external hosts daily.
Moreover, our proposal is based on the analysys of net-
work flows, which can be easily gathered and stored [17],
leverages an unsupervised machine learning algorithm
(unlike [12], [16]), and its execution time on a large
network is compatible to online traffic analyses.
III. IDENTIFICATION OF MALICIOUS EXTERNAL
HOSTS
This section begins with a high level description of the
proposed approach, and offers details of each processing
module in the other subsections.
A. Overview
The main objective is to provide a graylist of external
hosts involved in periodic communications with a high
likelihood of being malicious. The basic assumption is
that although novel variants of attacks are likely to
evade NIDS detection [18], some features of malware
network behavior persist and can be used to identify
likely malicious activities.
The proposed method works on two inputs that can be
easily obtained in modern infrastructures: network flows
related to communications between internal and external
hosts, and security alerts generated by a signature-based
NIDS. These inputs are processed by the three modules
shown in Figure 1. The Periodicity Detector is respon-sible for identifying network communications between
internal and external hosts occurring at regular intervals.
The Behavioral Aggregator clusters periodic connectionsaccording to their network behavior. The Graylist Buildercreates the final graylist of suspicious external hosts.
As the number of connected devices in enterprise
networks continues to increase, the detection of periodic
activities is becoming a challenging task, since they can
occur at different degrees of granularity spanning from
few seconds to hours. Instead of looking for periodicities
in raw traffic, we consider network flows which offer ag-
gregated metadata summarizing relevant network traffic
features. Each flow record is defined as an unidirectional
sequence of packets that share specific network prop-
erties, such as source/destination IP address, transport
layer protocol type, and source/destination port. Using
network flows as input source is a popular choice in the
cybersecurity domain [17], as they lower the amount of
storage space required, make analyses faster, and reduce

Fig. 1. Workflow of the proposed method.
privacy concerns due to the absence of packet-specific
payloads.
NIDSs are a valuable asset for detecting malicious
activities, but they are unable to detect novel malware
variants that do not contain any known signature. How-
ever, some characteristics of malware behavior, such
as beaconing, are stable across a wide array of au-
tomatically generated malware variants, thus resulting
in similar communication patterns. Since our approach
clusters network communications that share similar pe-
riodic behaviors, different variants of the same piece of
malware are likely to be clustered together. Our approach
only requires that a single malware variant generates a
NIDS alert to pinpoint as suspicious the entire cluster of
periodic communications containing that variant.
B. Periodicity Detector
The Periodicity Detector module detects periodic com-
munications from network flows in two phases: first,
it generates time series from the network flows; then,
it analyzes these time series through an autocorrelation
algorithm to determine whether they are periodic or not.
The adopted techniques are robust and tolerate possible
pertubations caused by noise or introduced by an attacker
to escape detection.
The sequence of network flows among two hosts
represents an unevenly spaced time series, which cannot
be immediately used to detect periodic communications.
Hence, we initially compute one evenly spaced time
series for each pair of internal and external hosts ex-
changing packets within a time window W . Given a
sampling period P , this time series contains a total ofW/P elements. Each element is built by aggregating all
the network flows between the involved hosts occurring
within the same sampling period. As beaconing activities
require repeated exchanges of some data, to capture
these data transfers we compute each element of the
time series by adding together the amount of bytes
exchanged between the involved hosts within the related
sampling period. This design choice allows us to better
differentiate beaconing activities that exchange different
volumes of data. After this phase, each pair of internal
and external hosts is associated to one time series.
Then, we adopt autocorrelation to detect periodicities
in each time series because this technique can signal
time series exhibiting more than one period [19]. By
computing the autocorrelation on a time series we ob-
tain an autocorrelation function (ACF) containing W/Pelements, each one representing the similarity of the time
series with a delayed copy of itself. The analysis of the
local maxima of the ACF determines whether a time
series exhibits or not periodicities. In particular, looking
for periodicities in the ACF involves determining the
coordinates of local maxima, since strictly periodic time
series tend to have local maxima with high amplitude
at the beginning of the related ACF. Existing works
relying on this technique for detecting periodicities in
time series (e.g., [20]) are only able to identify strictly
periodic time series. The problem is that skilled attackers
may insert some perturbations to avoid detection, either
by delaying or anticipating the communications, or by
changing the volume of data exchanged during each in-
teraction by random amounts. Moreover, network traffic
may be subject to noise induced by inactivity periods,
temporal disconnections, or by the presence of packets
retransmissions and other network-related artifacts. To
address these issues, we propose an innovative algorithm
that is capable of labeling as periodic even time series
that do not display a strictly periodic pattern. The main
intuition is that restricting the analysis of the ACF only
on the first very high local maxima does not allow to
identify noisy periodic time series: time series with noisy
periodicities are characterized by a limited amplitude of
local maxima, hence they cannot be detected by con-
ventional approaches. However, with respect to aperiodic
time series, they present several local maxima with a
similar amplitude, as well as high amplitudes between a
local maximum and its next local minimum. To achieve
a more flexible algorithm to detect noisy periodicities,
we introduce two thresholds in the ACF:
• the local maximum-location threshold τ identifiesthe initial set of local maxima, splitting the ACF into

Fig. 2. Example of time series and related ACF generated by two host with a noisy periodic behavior.
two subseries: Y1, containing all the first τ elementsof the ACF and determining the initial set of local
maxima; and Y2, containing all the other elements,
determining the remaining set of local maxima;
• the local maximum-amplitude threshold ρ is usedto determine the amplitude required for an ACF
element to be considered a local maximum: we
consider those elements whose value is greater than
ρ as local maxima, and those elements whose valueis lower than ρ
2 as local minima.
To illustrate the idea, we report in Figure 2 the time series
and its related ACF obtained from the communications
between two hosts. We observe the existence of two
noisy periodic behaviors in the time series, evidenced by
the exchange of about 1.1KB and 180B of data every 30minutes. For the ACF plot, we represent τ and ρ witha vertical and horizontal dashed line, respectively. We
note that the amplitude of the local maxima in the ACF
decreases irregularly, caused by the presence of noise
in the original time series; furthermore, the initial local
maxima set has a similar amplitude as the remaining set.Our algorithm labels as periodic those time series
whose ACF satisify at least one of the following criteria:
• Y2 has at least d elements ≥ ρ and Y1 has at least
2d elements ≤ ρ2 ;
• Y1 has at least r elements ≥ ρ and Y1 has at least
r elements ≤ ρ2 .
Where d is the period duration sensitivity and r is theperiodic rate sensitivity that must be chosen manually.Higher values of d imply that those time series thatare labeled as periodic are characterized by periods of
shorter length; higher values of r result in periodic timeseries whose periodicities occur for longer time-frames.
We remark that the first and second criteria are designed
to detect time series with periods of greater and shorter
length, respectively. Upon the completion of this phase,
all those time series that have been labeled as periodic
are forwarded to the Behavioral Aggregator module.
C. Behavioral Aggregator
The Behavioral Aggregator clusters periodic commu-
nications exhibiting similar patterns. Although clustering
techniques have already been employed in the informa-
tion security field, to the best of our knowledge this is
the first paper that proposes the leveraging of clustering
algorithms to detect communications with a similar pe-
riodic behavior. This task is performed in two phases:
we compute the Discrete Fourier Transform (DFT) for
each periodic time series to obtain its spectrogram; then,
these spectrograms are used as input for a hierarchical
clustering algorithm.
By applying the DFT to a periodic time series it is
possible to generate a spectrogram. This representation
is useful to describe the behavior of network communi-
cations, since periodic time series that are out of phase
may look very different, while their spectrograms exhibit
the same profile. The problem is that the shape of
each spectrogram also depends on the amounts of bytes
exchanged between the involved hosts. For example, two
hosts that regularly exchange 1MB of data will have a
spectrogram with a smaller amplitude than a different
pair of hosts that regularly exchange 10MB, although
their frequency components are the same. To address this
issue we normalize the amplitudes of each spectrogram
between 0 and 1.Then, each spectrogram is used as input for a hier-
archical clustering algorithm, an unsupervised machine
learning algorithm that takes as its input a matrix of
distances. We create this distance matrix by means of the
Pearson correlation coefficient [21], which is computed

among all the normalized spectrograms. The output of
the hierarchical clustering algorithm is a dendrogram. By
cutting the dendrogram at a given height h, it is possibleto create clusters of objects that are similar to each other.
We tune the parameter h as to minimize intra-cluster vari-ance and maximize the inter-cluster variance. At the end
of this phase we obtain a variable number of clusters of
periodic communications with similar behaviors, which
are used as input for the Graylist Builder module.
D. Graylist Builder
The final graylist of malicious external hosts is pro-
duced by the Graylist Builder module. It initially identi-
fies malicious clusters of periodic communications by
mapping NIDS alerts into clusters of similar periodic
communications. More specifically, those clusters con-
taining at least one communication that has raised a
NIDS alert are labeled as malicious; this process allows
us to detect malicious hosts that are not signaled by the
NIDS. Then, this module extracts all the external hosts
belonging to malicious clusters and uses them to populate
the final graylist.
IV. EXPERIMENTAL EVALUATION
A. Experimental testbed
The proposed method is validated on real traffic
generated by a large network of nearly ten thousand
hosts during an entire week, consisting of about half a
billion of network flows. The outgoing traffic has been
monitored by a NIDS equipped with Suricata [22], used
and configured by security operators with the most recent
rulesets [23]. Table I reports the most meaningful metrics
of the testbed for the different days of the considered
week. The second and third days, marked with an aster-
isk, represent weekend days and are characterized by a
lower activity.
Table ITRAFFIC INFORMATION OF EACH DAY OF THE DATASET.
Day Distinct external hosts Distinct time series Network flows
1 296 945 1 915 186 109 302 2242* 105 884 541 844 53 500 3893* 89 283 393 077 47 789 9774 298 241 1 835 351 101 314 2875 314 313 1 935 982 110 875 5036 249 768 1 667 168 99 359 7167 258 439 1 789 238 106 304 916
All the experiments discussed in this section refer to
a time window set to one day (W = 1d), while networkflows are sampled every five minutes (P = 300s).The parameters of the autocorrelation algorithm are
determined through a comprehensive sensitivity analysis
performed through multiple executions of the algorithm,
and the resulting values are summarized in Table II. The
values of the parameters ρ and τ are chosen equal tothose suggested by the literature on periodicity evaluation
in time series [19]. The height at which the dendrogram
is cut to generate the clusters is set to h = 0.95, becausesensitivity analyses show that this value minimizes intra-
cluster variance and maximizes inter-cluster variance for
the monitored environment.
Table IIPARAMETER VALUES USED AS INPUT.
Symbol Description Valueρ Local maximum-height threshold 0.30
τ Local maximum-location threshold W5P
d Period duration sensitivity 6
r Periodic rate sensitivity 2
B. Experimental Results
The detection framework is executed every day. The
goal is to demonstrate its capability of producing a
manageable graylist of external hosts with a considerably
higher likelihood of being malicious when compared to
the original set of contacted external hosts. In addition we
show that the rate of malicious external hosts performing
periodic communications is considerably higher with
respect to those involved in aperiodic communications.
Finally, we demonstrate that the graylist includes even
external hosts that did not raise a NIDS alert, and that the
execution time of our method is compatible with online
traffic analyses.
We initially assess the amount of malicious external
hosts in the entire set of external hosts that have been
contacted by the monitored network. Then, we let the
Periodicity Detector module generate time series and
determine which of them are periodic. We remark that
our analyses are executed on the unmodified network
traffic produced by a large organization: we did not inject
synthetic attacks or malicious traffic, but we leverage the
APIs provided by VirusTotal [24] to validate malicious
external hosts. More specifically, we consider an external
host to be malicious if it has been signaled by more than
half of the sources queried by VirusTotal.
To demonstrate that the rate of malicious external
hosts involved in periodic communications is consider-
ably higher than the rate of malicious hosts involved
in aperiodic communications, we present the results of
the validation process performed on these two sets of
hosts in Table III. For each column, the rows with gray
and white background report the number of external
hosts involved in periodic and aperiodic communica-
tions, respectively. We observe that the average ratio of

(a) Communications involving a malicious external host with one periodic behavior.
(b) Communications involving a malicious external host with three periodic behaviors.
Fig. 3. Time series, ACF and normalized spectrogram of two communications involving distinct malicious external hosts.
malicious external hosts exhibiting periodic communi-
cations is 2.7%, whereas the one of hosts involved inirregular communications is 0.51%. These results showthat periodic communications display a greater rate of
maliciousness with respect to aperiodic communications,
thus supporting our decision to focus on this set of
hosts. Furthermore, these results indicate that malicious
external communications can be considered as rare events
in the overall traffic, and motivates our effort of building
a manageable graylist in which the likelihood of finding
a malicious host is higher.
To illustrate that our method is capable of detect-

Table IIIVALIDATION OF EXTERNAL HOSTS INVOLVED IN PERIODIC (GRAY)
AND APERIODIC (WHITE) COMMUNICATIONS.
Day External hosts Malicious external hosts
13139 97 (3.09%)
293 806 1224 (0.42%)
2*2284 59 (2.58%)
103 600 785 (0.76%)
3*2123 53 (2.49%)87 160 603 (0.69%)
43194 74 (2.31%)
295 047 1198 (0.41%)
53288 91 (2.77%)
311 025 1153 (0.37%)
63044 80 (2.63%)
246 724 1202 (0.48%)
73034 90 (2.97%)
255 405 1283 (0.50%)
ing periodicities, we execute the Behavioral Aggregator
module and we report in Figures 3 the time series,
ACF and normalized DFT pertaining to communications
belonging to the same cluster and involving two distinct
malicious external hosts. The first and second plots in
each figure display the time series and related ACF,
while the third plot displays the normalized spectrogram
of the DFT. We observe that both time series exhibit a
periodic behavior, although some noise is present. More
specifically, the hosts associated to the first time series
exchange about 1KB of data every 30 minutes; whereasthose associated to the second time series present three
periodical behaviors, evidenced by the exchange of about
3KB and 4KB of data every 30 minutes, and of about5.5KB of data every 4 hours. These results demonstratethat our algorithm is able to identify even periodic
communications affected by some perturbations. More-
over, we observe that the spectrograms of Figures 3 are
very similar despite featuring different data exchanges,
leading to their inclusion in the same cluster. This result
indicates that our approach based on normalized DFT
provides a good representation of the periodic behavior
of a time series and is robust against alterations in
exchanged data volume.
Table IVCOMPARISON OF THE AMOUNT OF EXTERNAL HOSTS.
Day All external hosts External hosts with External hostsperiodic behavior in graylist
1 296 943 3139 1272* 105 884 2284 903* 89 283 2123 704 298 241 3194 315 314 313 3288 1206 249 768 3044 1197 258 439 3034 115
Finally, we generate the graylists by executing the
Graylist Builder module for each day of the dataset. We
present in Table IV the amount of hosts included in our
graylists alongsisde both the entire set of hosts that have
been contacted and the number of hosts displaying a
periodic behavior. We appreciate that our graylists com-
prise about one hundred of entries down from the initial
set of hundreds of thousands hosts, thus allowing further
security inspections to focus on a restricted amount of
external threats.
Table VVALIDATION OF THE GRAYLIST AND COMPARISON WITH NIDS.
Day Malicious hosts Malicious hostsin graylist detected by NIDS
1 19 (14.96%) 3 (2.36%)2* 17 (18.89%) 3 (3.33%)3* 6 (8.57%) 3 (4.29%)4 3 (9.68%) 3 (9.68%)5 17 (14.17%) 4 (3.33%)6 7 (5.58%) 3 (2.52%)7 15 (13.04%) 4 (3.48%)
The evaluation of the graylist produced by our method
is performed by determining the rate of malicious
graylisted hosts, and by showing that the graylist contains
even malicious hosts that do not raise NIDS alarms.
The results are reported in Table V, where the first col-
umn indicates different days while the second and third
columns show the number of malicious hosts included
in the graylist and the number of malicious hosts that
raised a NIDS alarm, respectively.
By correlating the values of Table V with those
presented in Table III, we understand that the ratio of
malicious hosts in our graylist is an order of magnitude
greater than the ratio of malicious host in the entire set of
contacted hosts. Moreover, by comparing the values of
the second and third column of Table V we understand
that our method is capable of graylisting up to six times
as many malicious hosts with respect to those detected
by the NIDS.
These results indicate that our method is able to pro-
duce a manageable graylist consisting of about one hun-
dred of entries, down from the original set of hundreds
of thousands entries, which is characterized by a ratio of
malicious hosts that is an order of magnitude greater and
containing malicious hosts that do not raise any NIDS
alarm. Validating several dozens of IP addresses through
external public APIs only requires few minutes, whereas
the validation of hundreds of thousands of addresses
requires almost one week. Finally, we remark that all
these analyses are performed on real network traffic, as
we did not inject any artificial attack.
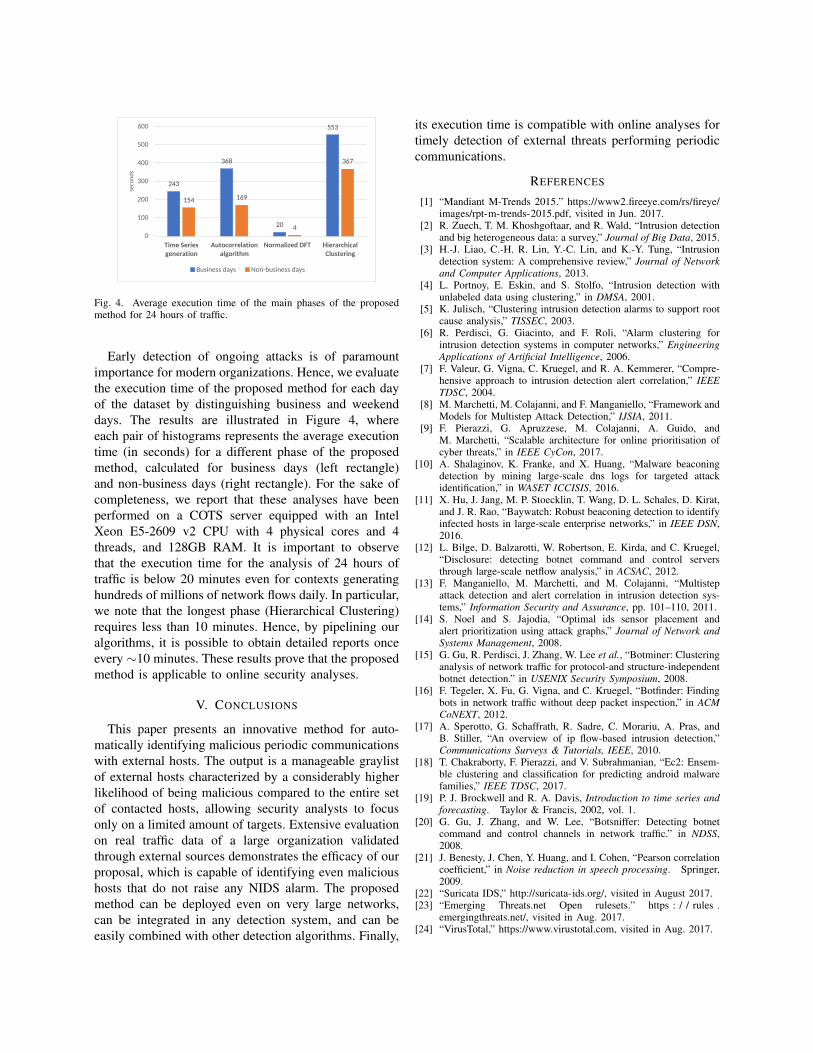
Fig. 4. Average execution time of the main phases of the proposedmethod for 24 hours of traffic.
Early detection of ongoing attacks is of paramount
importance for modern organizations. Hence, we evaluate
the execution time of the proposed method for each day
of the dataset by distinguishing business and weekend
days. The results are illustrated in Figure 4, where
each pair of histograms represents the average execution
time (in seconds) for a different phase of the proposed
method, calculated for business days (left rectangle)
and non-business days (right rectangle). For the sake of
completeness, we report that these analyses have been
performed on a COTS server equipped with an Intel
Xeon E5-2609 v2 CPU with 4 physical cores and 4
threads, and 128GB RAM. It is important to observe
that the execution time for the analysis of 24 hours of
traffic is below 20 minutes even for contexts generating
hundreds of millions of network flows daily. In particular,
we note that the longest phase (Hierarchical Clustering)
requires less than 10 minutes. Hence, by pipelining our
algorithms, it is possible to obtain detailed reports once
every ∼10 minutes. These results prove that the proposedmethod is applicable to online security analyses.
V. CONCLUSIONS
This paper presents an innovative method for auto-
matically identifying malicious periodic communications
with external hosts. The output is a manageable graylist
of external hosts characterized by a considerably higher
likelihood of being malicious compared to the entire set
of contacted hosts, allowing security analysts to focus
only on a limited amount of targets. Extensive evaluation
on real traffic data of a large organization validated
through external sources demonstrates the efficacy of our
proposal, which is capable of identifying even malicious
hosts that do not raise any NIDS alarm. The proposed
method can be deployed even on very large networks,
can be integrated in any detection system, and can be
easily combined with other detection algorithms. Finally,
its execution time is compatible with online analyses for
timely detection of external threats performing periodic
communications.
REFERENCES
[1] “Mandiant M-Trends 2015.” https://www2.fireeye.com/rs/fireye/images/rpt-m-trends-2015.pdf, visited in Jun. 2017.
[2] R. Zuech, T. M. Khoshgoftaar, and R. Wald, “Intrusion detectionand big heterogeneous data: a survey,” Journal of Big Data, 2015.
[3] H.-J. Liao, C.-H. R. Lin, Y.-C. Lin, and K.-Y. Tung, “Intrusiondetection system: A comprehensive review,” Journal of Networkand Computer Applications, 2013.
[4] L. Portnoy, E. Eskin, and S. Stolfo, “Intrusion detection withunlabeled data using clustering,” in DMSA, 2001.
[5] K. Julisch, “Clustering intrusion detection alarms to support rootcause analysis,” TISSEC, 2003.
[6] R. Perdisci, G. Giacinto, and F. Roli, “Alarm clustering forintrusion detection systems in computer networks,” EngineeringApplications of Artificial Intelligence, 2006.
[7] F. Valeur, G. Vigna, C. Kruegel, and R. A. Kemmerer, “Compre-hensive approach to intrusion detection alert correlation,” IEEETDSC, 2004.
[8] M. Marchetti, M. Colajanni, and F. Manganiello, “Framework andModels for Multistep Attack Detection,” IJSIA, 2011.
[9] F. Pierazzi, G. Apruzzese, M. Colajanni, A. Guido, andM. Marchetti, “Scalable architecture for online prioritisation ofcyber threats,” in IEEE CyCon, 2017.
[10] A. Shalaginov, K. Franke, and X. Huang, “Malware beaconingdetection by mining large-scale dns logs for targeted attackidentification,” in WASET ICCISIS, 2016.
[11] X. Hu, J. Jang, M. P. Stoecklin, T. Wang, D. L. Schales, D. Kirat,and J. R. Rao, “Baywatch: Robust beaconing detection to identifyinfected hosts in large-scale enterprise networks,” in IEEE DSN,2016.
[12] L. Bilge, D. Balzarotti, W. Robertson, E. Kirda, and C. Kruegel,“Disclosure: detecting botnet command and control serversthrough large-scale netflow analysis,” in ACSAC, 2012.
[13] F. Manganiello, M. Marchetti, and M. Colajanni, “Multistepattack detection and alert correlation in intrusion detection sys-tems,” Information Security and Assurance, pp. 101–110, 2011.
[14] S. Noel and S. Jajodia, “Optimal ids sensor placement andalert prioritization using attack graphs,” Journal of Network andSystems Management, 2008.
[15] G. Gu, R. Perdisci, J. Zhang, W. Lee et al., “Botminer: Clusteringanalysis of network traffic for protocol-and structure-independentbotnet detection.” in USENIX Security Symposium, 2008.
[16] F. Tegeler, X. Fu, G. Vigna, and C. Kruegel, “Botfinder: Findingbots in network traffic without deep packet inspection,” in ACMCoNEXT, 2012.
[17] A. Sperotto, G. Schaffrath, R. Sadre, C. Morariu, A. Pras, andB. Stiller, “An overview of ip flow-based intrusion detection,”Communications Surveys & Tutorials, IEEE, 2010.
[18] T. Chakraborty, F. Pierazzi, and V. Subrahmanian, “Ec2: Ensem-ble clustering and classification for predicting android malwarefamilies,” IEEE TDSC, 2017.
[19] P. J. Brockwell and R. A. Davis, Introduction to time series andforecasting. Taylor & Francis, 2002, vol. 1.
[20] G. Gu, J. Zhang, and W. Lee, “Botsniffer: Detecting botnetcommand and control channels in network traffic.” in NDSS,2008.
[21] J. Benesty, J. Chen, Y. Huang, and I. Cohen, “Pearson correlationcoefficient,” in Noise reduction in speech processing. Springer,2009.
[22] “Suricata IDS,” http://suricata-ids.org/, visited in August 2017.[23] “Emerging Threats.net Open rulesets.” https : / / rules .
emergingthreats.net/, visited in Aug. 2017.[24] “VirusTotal,” https://www.virustotal.com, visited in Aug. 2017.