Embed Size (px)
Citation preview

Research, Development, and TechnologyTurner-Fairbank Highway Research Center6300 Georgetown PikeMcLean, VA 22101-2296
Identifying Incompatible Combinations of Concrete Materials: Volume II—Test Protocol
PUBLICATION NO. FHWA-HRT-06-080 AUGUST 2006
FOREWORD
Unexpected interactions between otherwise acceptable ingredients in portland cement concrete are becoming increasingly common as cementitious systems become more complex and demands on the systems are more rigorous. Such incompatibilities are exhibited as early stiffening or excessive retardation, potential for uncontrolled early-age cracking, and unstable or unacceptable air void systems.
The protocol in this volume was developed to allow product manufacturers, concrete producers, contractors, and owners to monitor their materials and concrete systems. The protocol has two phases: relatively simple field tests to provide early warnings of potential problems, and central laboratory tests to support and confirm the field work. Tests conducted before construction begins help users to plan for materials and environment changes. By monitoring materials with relatively simple field tests during construction, the users can detect when significant changes have occurred, indicating potential construction problems.
Gary Henderson Director, Office of Infrastructure Research and Development
Notice
This document is disseminated under the sponsorship of the U.S. Department of Transportation in the interest of information exchange. The U.S. Government assumes no liability for the use of the information contained in this document. This report does not constitute a standard, specification, or regulation.
The U.S. Government does not endorse products or manufacturers. Trademarks or manufacturers' names appear in this report only because they are considered essential to the objective of the document.
Quality Assurance Statement
The Federal Highway Administration (FHWA) provides high-quality information to serve Government, industry, and the public in a manner that promotes public understanding. Standards and policies are used to ensure and maximize the quality, objectivity, utility, and integrity of its information. FHWA periodically reviews quality issues and adjusts its programs and processes to ensure continuous quality improvement.
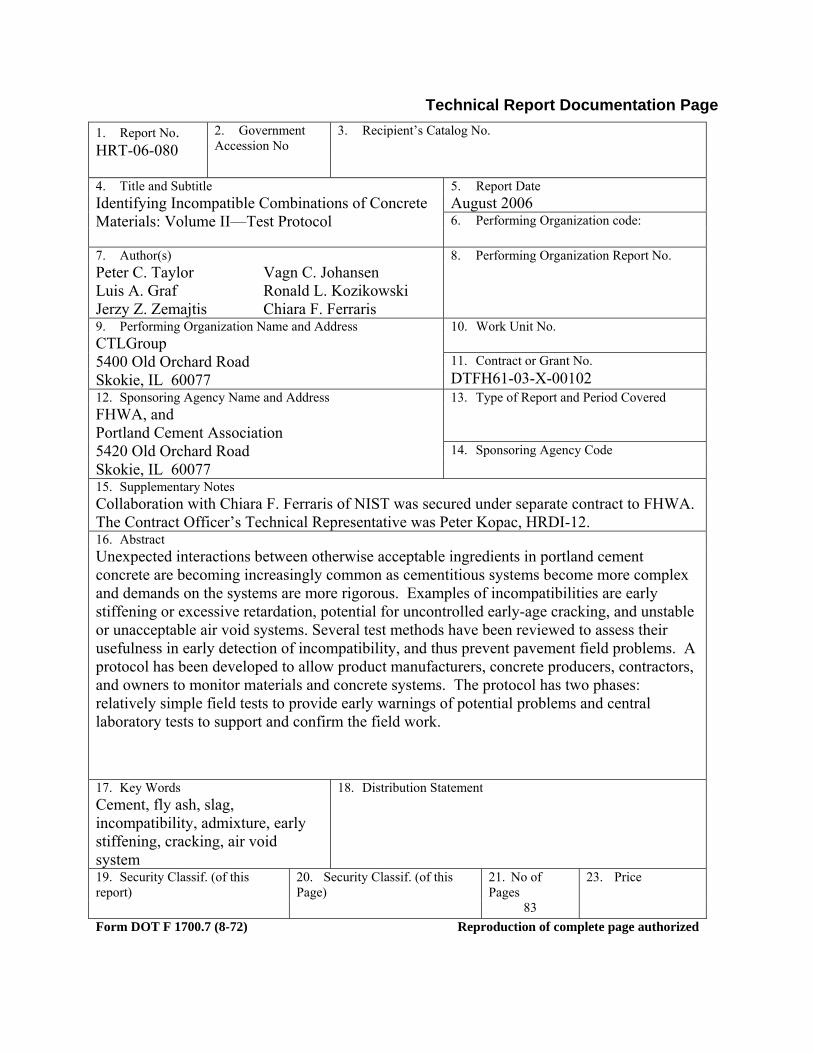
Technical Report Documentation Page
1. Report No. HRT-06-080
2. Government Accession No
3. Recipient’s Catalog No.
4. Title and Subtitle 5. Report Date
August 2006 6. Performing Organization code:
Identifying Incompatible Combinations of Concrete Materials: Volume II—Test Protocol
7. Author(s) 8. Performing Organization Report No. Peter C. Taylor Vagn C. Johansen Luis A. Graf Ronald L. Kozikowski Jerzy Z. Zemajtis Chiara F. Ferraris 9. Performing Organization Name and Address 10. Work Unit No.
11. Contract or Grant No.
CTLGroup 5400 Old Orchard Road Skokie, IL 60077 DTFH61-03-X-00102 12. Sponsoring Agency Name and Address 13. Type of Report and Period Covered
14. Sponsoring Agency Code
FHWA, and Portland Cement Association 5420 Old Orchard Road Skokie, IL 60077 15. Supplementary Notes Collaboration with Chiara F. Ferraris of NIST was secured under separate contract to FHWA. The Contract Officer’s Technical Representative was Peter Kopac, HRDI-12. 16. Abstract Unexpected interactions between otherwise acceptable ingredients in portland cement concrete are becoming increasingly common as cementitious systems become more complex and demands on the systems are more rigorous. Examples of incompatibilities are early stiffening or excessive retardation, potential for uncontrolled early-age cracking, and unstable or unacceptable air void systems. Several test methods have been reviewed to assess their usefulness in early detection of incompatibility, and thus prevent pavement field problems. A protocol has been developed to allow product manufacturers, concrete producers, contractors, and owners to monitor materials and concrete systems. The protocol has two phases: relatively simple field tests to provide early warnings of potential problems and central laboratory tests to support and confirm the field work.
17. Key Words 18. Distribution Statement Cement, fly ash, slag, incompatibility, admixture, early stiffening, cracking, air void system
19. Security Classif. (of this report)
20. Security Classif. (of this Page)
21. No of Pages
23. Price
83 Form DOT F 1700.7 (8-72) Reproduction of complete page authorized
ii
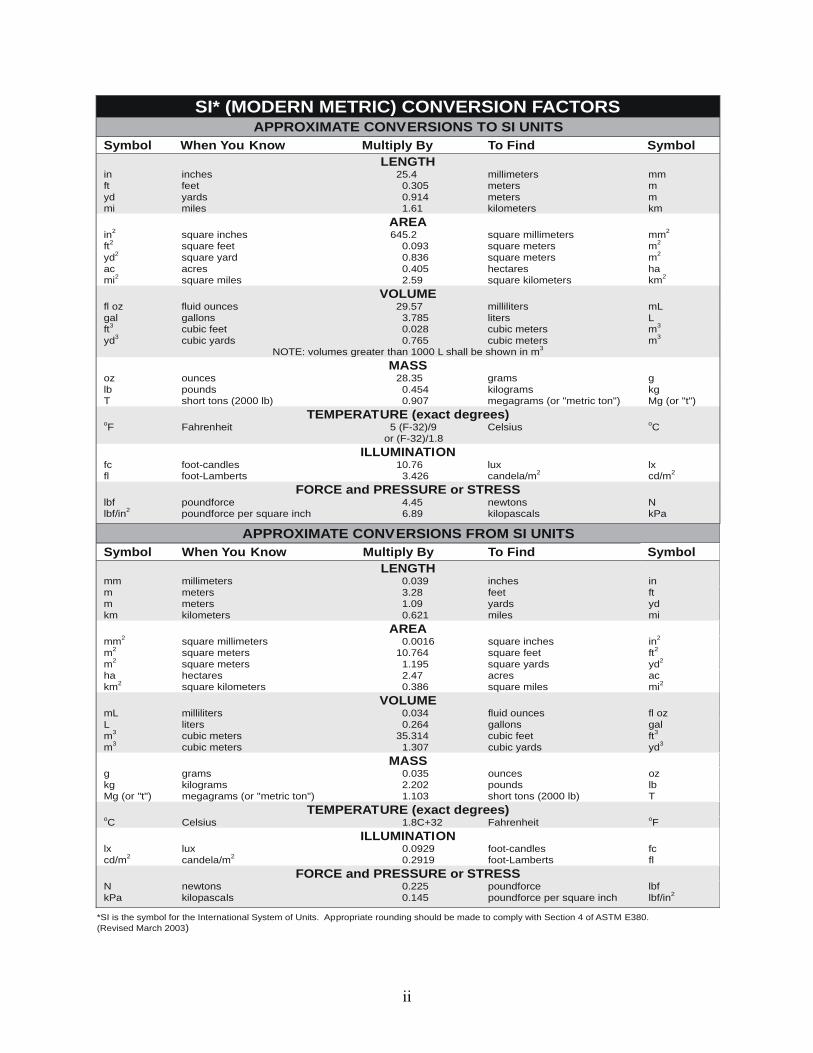
SI* (MODERN METRIC) CONVERSION FACTORS APPROXIMATE CONVERSIONS TO SI UNITS
Symbol When You Know Multiply By To Find Symbol LENGTH
in inches 25.4 millimeters mm ft feet 0.305 meters m yd yards 0.914 meters m mi miles 1.61 kilometers km
AREA in2 square inches 645.2 square millimeters mm2
ft2 square feet 0.093 square meters m2
yd2 square yard 0.836 square meters m2
ac acres 0.405 hectares hami2 square miles 2.59 square kilometers km2
VOLUME fl oz fluid ounces 29.57 milliliters mL gal gallons 3.785 liters L ft3 cubic feet 0.028 cubic meters m3
yd3 cubic yards 0.765 cubic meters m3
NOTE: volumes greater than 1000 L shall be shown in m3
MASS oz ounces 28.35 grams glb pounds 0.454 kilograms kgT short tons (2000 lb) 0.907 megagrams (or "metric ton") Mg (or "t")
TEMPERATURE (exact degrees) oF Fahrenheit 5 (F-32)/9 Celsius oC
or (F-32)/1.8 ILLUMINATION
fc foot-candles 10.76 lux lxfl foot-Lamberts 3.426 candela/m2 cd/m2
FORCE and PRESSURE or STRESS lbf poundforce 4.45 newtons N lbf/in2 poundforce per square inch 6.89 kilopascals kPa
APPROXIMATE CONVERSIONS FROM SI UNITS Symbol When You Know Multiply By To Find Symbol
LENGTHmm millimeters 0.039 inches in m meters 3.28 feet ft m meters 1.09 yards yd km kilometers 0.621 miles mi
AREA mm2 square millimeters 0.0016 square inches in2
m2 square meters 10.764 square feet ft2
m2 square meters 1.195 square yards yd2
ha hectares 2.47 acres ackm2 square kilometers 0.386 square miles mi2
VOLUME mL milliliters 0.034 fluid ounces fl oz L liters 0.264 gallons gal m3 cubic meters 35.314 cubic feet ft3
m3 cubic meters 1.307 cubic yards yd3
MASS g grams 0.035 ounces ozkg kilograms 2.202 pounds lbMg (or "t") megagrams (or "metric ton") 1.103 short tons (2000 lb) T
TEMPERATURE (exact degrees) oC Celsius 1.8C+32 Fahrenheit oF
ILLUMINATION lx lux 0.0929 foot-candles fc cd/m2 candela/m2 0.2919 foot-Lamberts fl
FORCE and PRESSURE or STRESS N newtons 0.225 poundforce lbf kPa kilopascals 0.145 poundforce per square inch lbf/in2
*SI is the symbol for th International System of Units. Appropriate rounding should be made to comply with Section 4 of ASTM E380. e(Revised March 2003)
iii
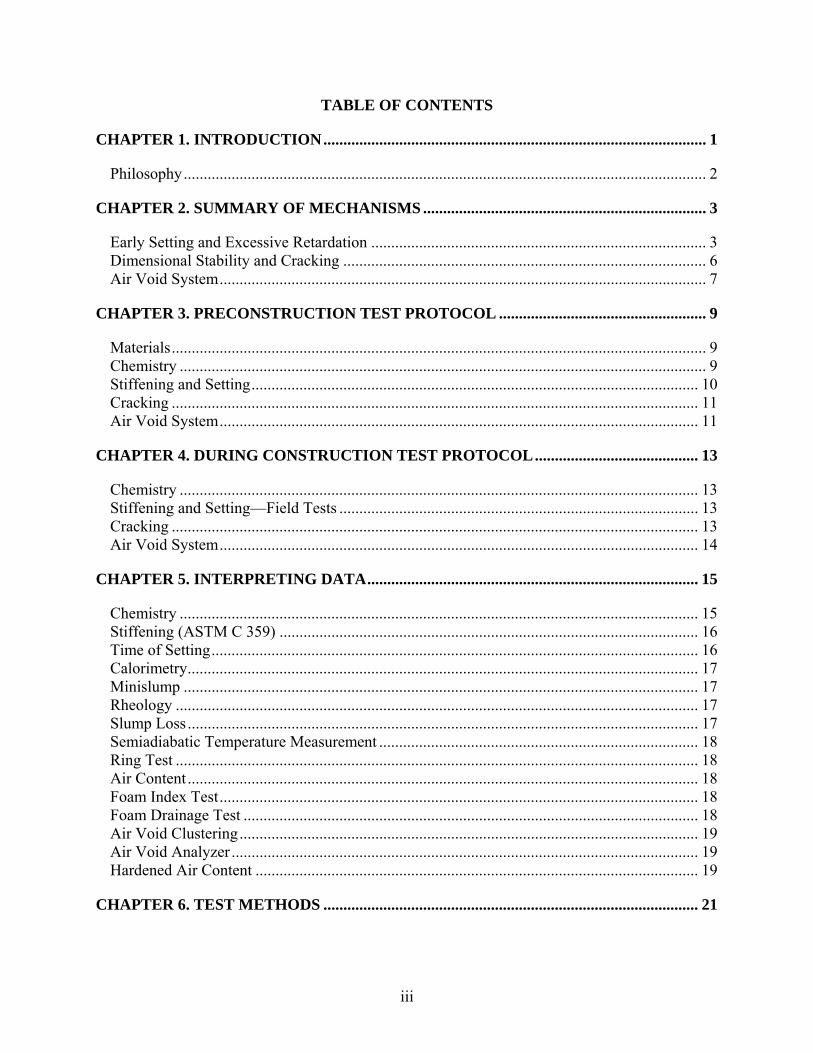
TABLE OF CONTENTS
CHAPTER 1. INTRODUCTION................................................................................................ 1
Philosophy................................................................................................................................... 2
CHAPTER 2. SUMMARY OF MECHANISMS ....................................................................... 3
Early Setting and Excessive Retardation .................................................................................... 3 Dimensional Stability and Cracking ........................................................................................... 6 Air Void System.......................................................................................................................... 7
CHAPTER 3. PRECONSTRUCTION TEST PROTOCOL .................................................... 9
Materials...................................................................................................................................... 9 Chemistry .................................................................................................................................... 9 Stiffening and Setting................................................................................................................ 10 Cracking .................................................................................................................................... 11 Air Void System........................................................................................................................ 11
CHAPTER 4. DURING CONSTRUCTION TEST PROTOCOL......................................... 13
Chemistry .................................................................................................................................. 13 Stiffening and Setting—Field Tests .......................................................................................... 13 Cracking .................................................................................................................................... 13 Air Void System........................................................................................................................ 14
CHAPTER 5. INTERPRETING DATA................................................................................... 15
Chemistry .................................................................................................................................. 15 Stiffening (ASTM C 359) ......................................................................................................... 16 Time of Setting.......................................................................................................................... 16 Calorimetry................................................................................................................................ 17 Minislump ................................................................................................................................. 17 Rheology ................................................................................................................................... 17 Slump Loss ................................................................................................................................ 17 Semiadiabatic Temperature Measurement ................................................................................ 18 Ring Test ................................................................................................................................... 18 Air Content ................................................................................................................................ 18 Foam Index Test........................................................................................................................ 18 Foam Drainage Test .................................................................................................................. 18 Air Void Clustering................................................................................................................... 19 Air Void Analyzer ..................................................................................................................... 19 Hardened Air Content ............................................................................................................... 19
CHAPTER 6. TEST METHODS .............................................................................................. 21
iv
CHAPTER 7. EXAMPLE: PRECONSTRUCTION MATERIALS ANALYSIS................. 25
Preconstruction.......................................................................................................................... 25 During Construction.................................................................................................................. 26
ACKNOWLEDGEMENTS ....................................................................................................... 29
Disclaimer ................................................................................................................................. 29 Matching Funds......................................................................................................................... 29
APPENDIX A: DRAFT STANDARD TEST METHOD FOR MEASUREMENT OF CEMENT PASTE SETTING TIME USING A PARALLEL PLATE RHEOMETER ...... 31
APPENDIX B: DRAFT STANDARD TEST METHOD FOR MEASUREMENT OF CEMENT PASTE INTERACTIONS USING A MINISLUMP CONE ................................ 39
APPENDIX C: DRAFT STANDARD TEST METHOD FOR MEASUREMENT OF TIME OF SET OF CONCRETE USING WAVE VELOCITY METHOD...................................... 47
APPENDIX D: DRAFT STANDARD TEST METHOD FOR SEMIABIDIATIC TEMPERATURE MEASUREMENT ...................................................................................... 55
APPENDIX E: DRAFT STANDARD TEST METHOD FOR DETERMINING FOAM INDEX OF CEMENTITIOUS PASTE MIXURES................................................................. 61
APPENDIX F: DRAFT STANDARD TEST METHOD FOR FOAM DRAINAGE ANALYSIS METHOD ............................................................................................................... 69
REPORT REFERENCE ............................................................................................................ 77
v
LIST OF TABLES
Table 1. Compounds of Calcium Sulfate in Cement ...................................................................... 4
Table 2. Protocol Test Methods .................................................................................................... 21
Table 3. Cementitious Materials Analysis .................................................................................... 25
LIST OF FIGURES
Figure 1. Reactions that occur in hydrating cement, the times they occur, the heat they generate, and the effects on stiffening and setting. ........................................................................................ 4
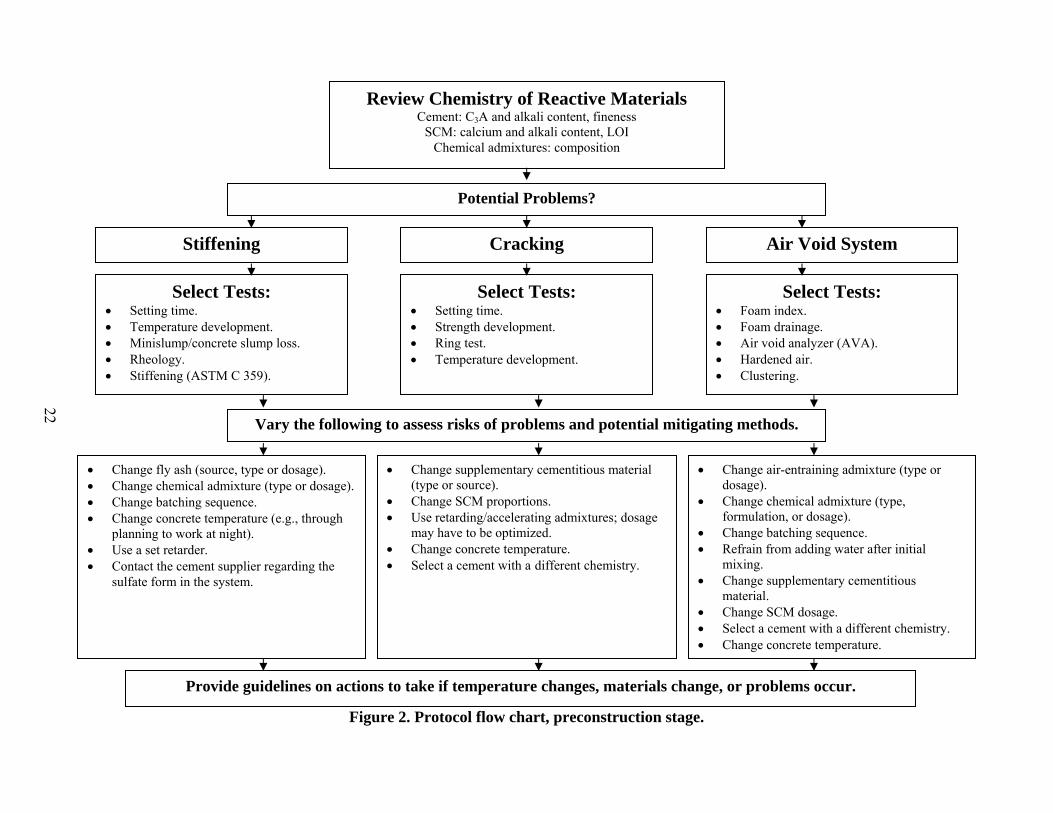
Figure 2. Protocol flow chart, preconstruction stage. ................................................................... 22
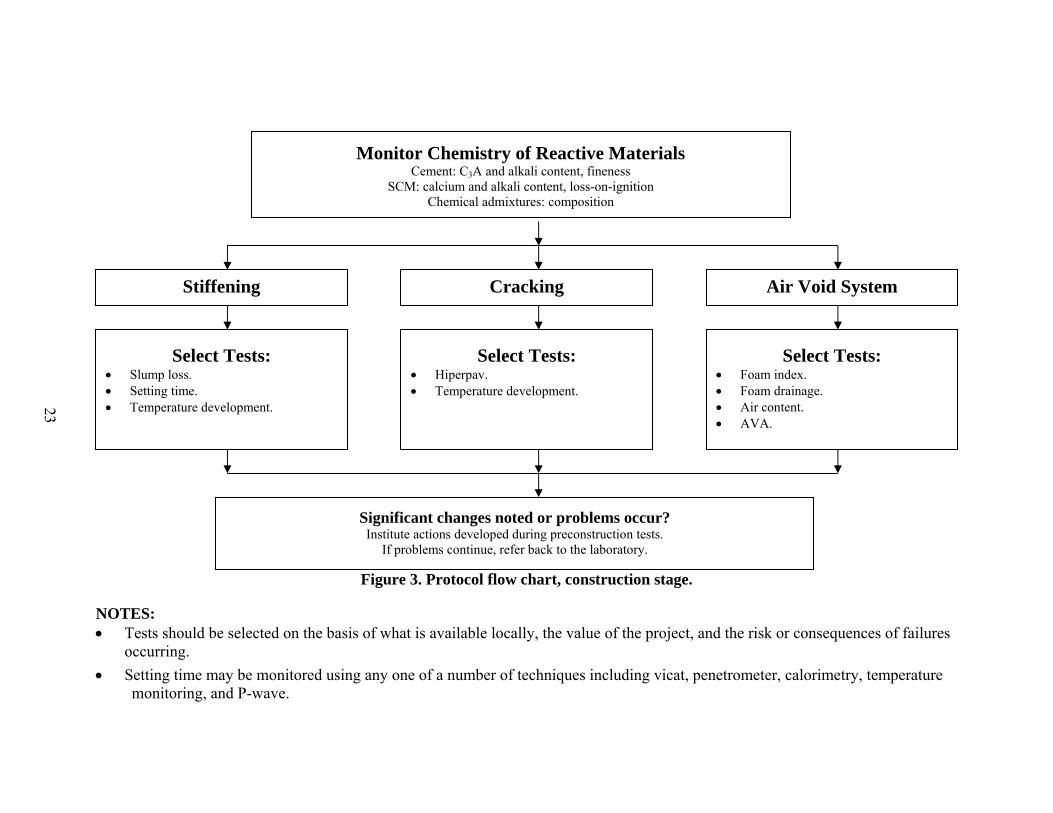
Figure 3. Protocol flow chart, construction stage. ........................................................................ 23

1
CHAPTER 1. INTRODUCTION
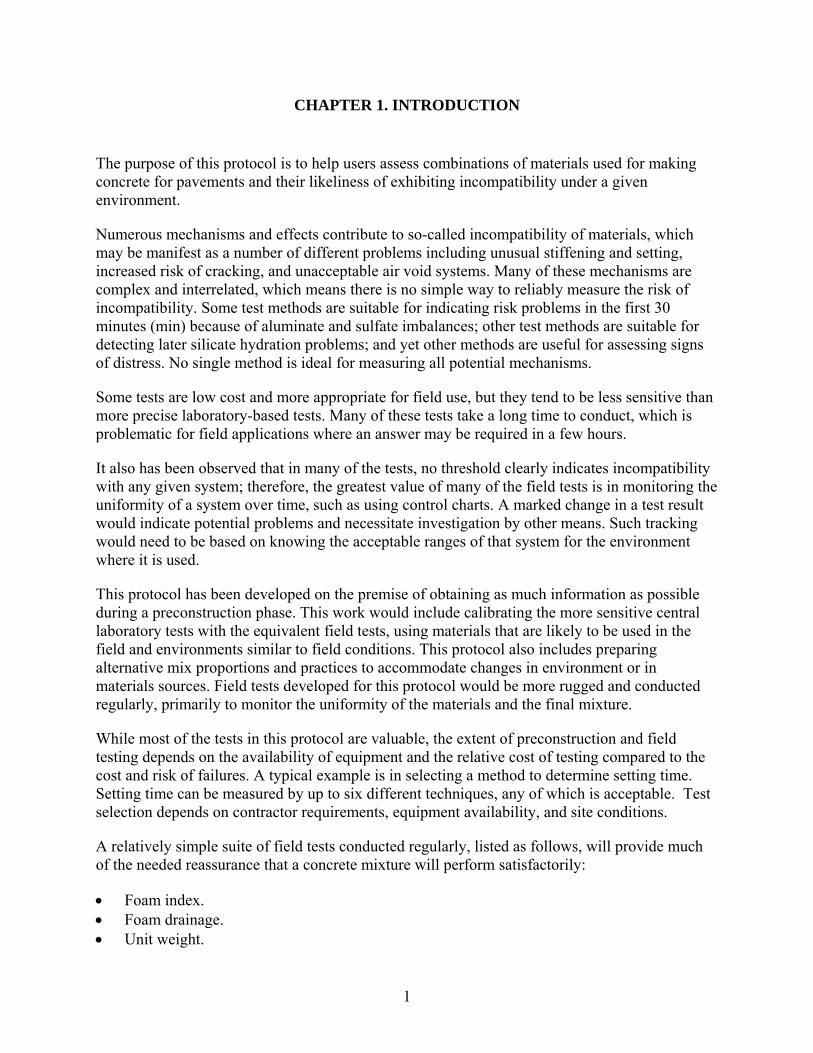
The purpose of this protocol is to help users assess combinations of materials used for making concrete for pavements and their likeliness of exhibiting incompatibility under a given environment.
Numerous mechanisms and effects contribute to so-called incompatibility of materials, which may be manifest as a number of different problems including unusual stiffening and setting, increased risk of cracking, and unacceptable air void systems. Many of these mechanisms are complex and interrelated, which means there is no simple way to reliably measure the risk of incompatibility. Some test methods are suitable for indicating risk problems in the first 30 minutes (min) because of aluminate and sulfate imbalances; other test methods are suitable for detecting later silicate hydration problems; and yet other methods are useful for assessing signs of distress. No single method is ideal for measuring all potential mechanisms.
Some tests are low cost and more appropriate for field use, but they tend to be less sensitive than more precise laboratory-based tests. Many of these tests take a long time to conduct, which is problematic for field applications where an answer may be required in a few hours.
It also has been observed that in many of the tests, no threshold clearly indicates incompatibility with any given system; therefore, the greatest value of many of the field tests is in monitoring the uniformity of a system over time, such as using control charts. A marked change in a test result would indicate potential problems and necessitate investigation by other means. Such tracking would need to be based on knowing the acceptable ranges of that system for the environment where it is used.
This protocol has been developed on the premise of obtaining as much information as possible during a preconstruction phase. This work would include calibrating the more sensitive central laboratory tests with the equivalent field tests, using materials that are likely to be used in the field and environments similar to field conditions. This protocol also includes preparing alternative mix proportions and practices to accommodate changes in environment or in materials sources. Field tests developed for this protocol would be more rugged and conducted regularly, primarily to monitor the uniformity of the materials and the final mixture.
While most of the tests in this protocol are valuable, the extent of preconstruction and field testing depends on the availability of equipment and the relative cost of testing compared to the cost and risk of failures. A typical example is in selecting a method to determine setting time. Setting time can be measured by up to six different techniques, any of which is acceptable. Test selection depends on contractor requirements, equipment availability, and site conditions.
A relatively simple suite of field tests conducted regularly, listed as follows, will provide much of the needed reassurance that a concrete mixture will perform satisfactorily:
• Foam index. • Foam drainage. • Unit weight.
2
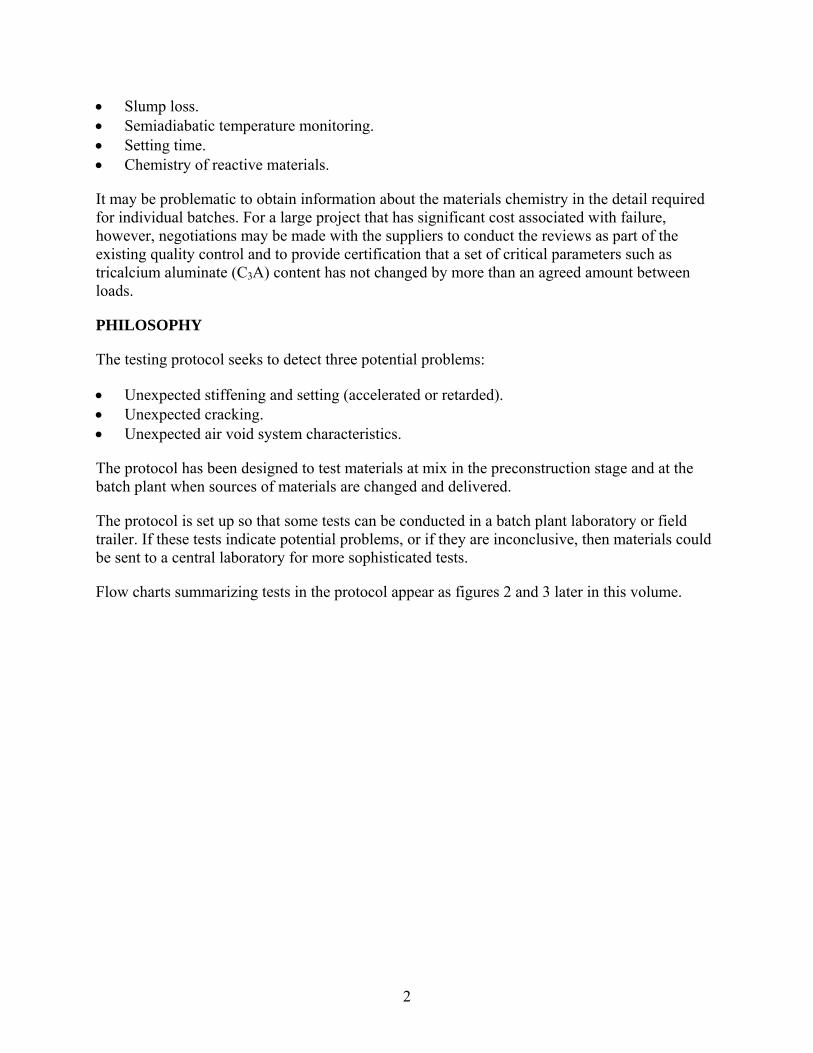
• Slump loss. • Semiadiabatic temperature monitoring. • Setting time. • Chemistry of reactive materials.
It may be problematic to obtain information about the materials chemistry in the detail required for individual batches. For a large project that has significant cost associated with failure, however, negotiations may be made with the suppliers to conduct the reviews as part of the existing quality control and to provide certification that a set of critical parameters such as tricalcium aluminate (C3A) content has not changed by more than an agreed amount between loads.
PHILOSOPHY
The testing protocol seeks to detect three potential problems:
• Unexpected stiffening and setting (accelerated or retarded). • Unexpected cracking. • Unexpected air void system characteristics.
The protocol has been designed to test materials at mix in the preconstruction stage and at the batch plant when sources of materials are changed and delivered.
The protocol is set up so that some tests can be conducted in a batch plant laboratory or field trailer. If these tests indicate potential problems, or if they are inconclusive, then materials could be sent to a central laboratory for more sophisticated tests.
Flow charts summarizing tests in the protocol appear as figures 2 and 3 later in this volume.
3
CHAPTER 2. SUMMARY OF MECHANISMS
As indicated in volume I, there are a large number of mechanisms and effects that contribute to incompatibility. Many of these are complex and interrelated, which means there is no simple way to reliably measure the risk of incompatibility. This section summarizes some of the mechanisms as background to the test protocol.
Many of the tests discussed in the protocol have no observable threshold that clearly indicates whether any given system was incompatible or not. A result that may be considered poor for one system may be considered acceptable for another; therefore, the greatest value of many of these tests is in monitoring the uniformity of a system over time. A marked change in a test result would indicate potential problems and a need for investigation by another means. Tracking test results would have to be based on knowing the acceptable ranges for that system and the environment in which it is used.
EARLY SETTING AND EXCESSIVE RETARDATION
Hydraulic cementitious systems stiffen, set, and harden by a process called hydration—a series of nonreversible chemical reactions with water. This process is complex and is still the subject of extensive research. The broad principles are discussed below.
Cement Chemistry—Portland cement and cementitious materials are in the same family of chemical elements known as oxides, which can be detected by chemical analyses with X-ray fluorescence. In the following paragraphs, for convenience of discussion only, these elements are referred to as “oxides”; however, it is not likely all chemical elements are pure oxides.
Calcium oxide normally comprises 60 to 65 percent of cement by mass, while silica normally contributes about 20 percent. These combine to form the so-called “silicates,” belite (C2S) and alite (C3S). The hydration products (the compounds formed when they react with water) of C2S and C3S are similar to each other, albeit in different proportions. Hydration of silicates also produces some heat (figure 1). Calcium silicate hydrate (CSH) is the primary compound that gives hydrated cement paste the strength and impermeability that makes concrete useful in construction. Calcium hydroxide (CH) forms hexagonal crystals that do not contribute significantly to strength, but which can be readily dissolved by acids and soft water.
C3S, also known as alite, is the compound that contributes to setting and early strength development of concrete. The contribution normally begins a few hours after mixing. C2S, also known as belite, is the primary compound that contributes to later strength development of concrete. The contribution is considered to begin about a week after mixing. Portland cements currently contain approximately 60 percent C3S and 20 percent C2S.
4
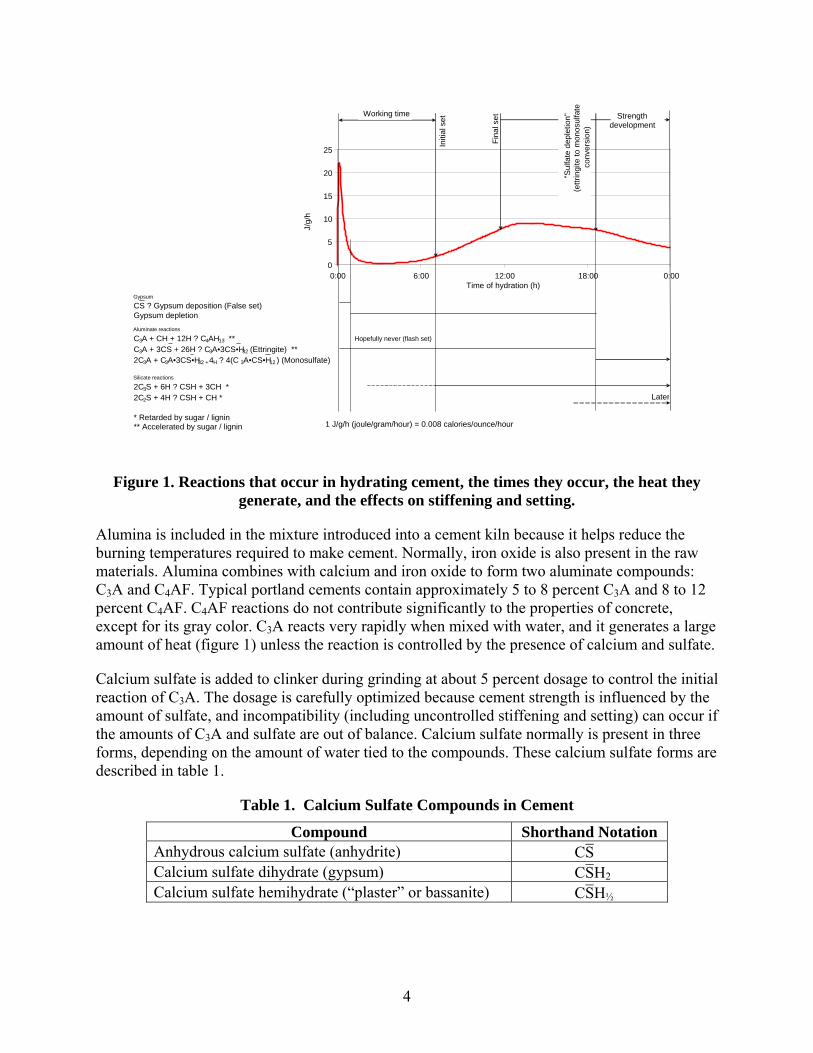
Figure 1. Reactions that occur in hydrating cement, the times they occur, the heat they generate, and the effects on stiffening and setting.
Alumina is included in the mixture introduced into a cement kiln because it helps reduce the burning temperatures required to make cement. Normally, iron oxide is also present in the raw materials. Alumina combines with calcium and iron oxide to form two aluminate compounds: C3A and C4AF. Typical portland cements contain approximately 5 to 8 percent C3A and 8 to 12 percent C4AF. C4AF reactions do not contribute significantly to the properties of concrete, except for its gray color. C3A reacts very rapidly when mixed with water, and it generates a large amount of heat (figure 1) unless the reaction is controlled by the presence of calcium and sulfate.
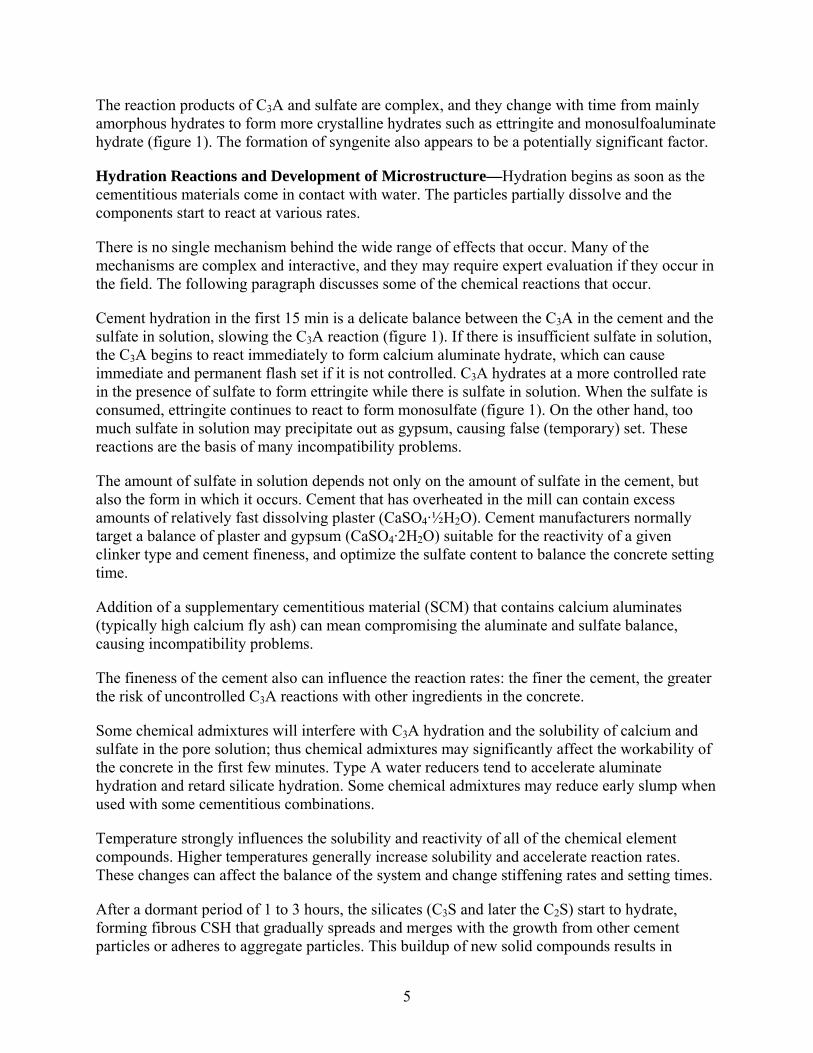
Calcium sulfate is added to clinker during grinding at about 5 percent dosage to control the initial reaction of C3A. The dosage is carefully optimized because cement strength is influenced by the amount of sulfate, and incompatibility (including uncontrolled stiffening and setting) can occur if the amounts of C3A and sulfate are out of balance. Calcium sulfate normally is present in three forms, depending on the amount of water tied to the compounds. These calcium sulfate forms are described in table 1.
Table 1. Calcium Sulfate Compounds in Cement
Compound Shorthand Notation Anhydrous calcium sulfate (anhydrite) CS̄ Calcium sulfate dihydrate (gypsum) CS̄H2 Calcium sulfate hemihydrate (“plaster” or bassanite) CS̄H½
Troubleshooting presentations
Gypsum
CS ? Gypsum deposition (False set)Gypsum depletionAluminate reactions
C 3A + CH + 12H ? C4 AH13 ** Hopefully never (flash set)
C 3A + 3CS + 26H ? C3 A•3CS•H32 (Ettringite) **2C 3 A + C 3A•3CS•H32 + 4H ? 4(C 3A•CS•H 12 ) (Monosulfate)
Silicate reactions
2C 3 S + 6H ? CSH + 3CH * 2C 2 S + 4H ? CSH + CH * Later
* Retarded by sugar / lignin ** Accelerated by sugar / lignin
0
5
10
15
20
25
0:00 6:00 12:00 18:00 0:00Time of hydration (h)
J/g/
h
Working time
Initi
al s
et
Fina
l set
"Sul
fate
dep
letio
n"(e
ttrin
gite
to m
onos
ulfa
teco
nver
sion
)
Strength development
1 J/g/h (joule/gram/hour) = 0.008 calories/ounce/hour
5
The reaction products of C3A and sulfate are complex, and they change with time from mainly amorphous hydrates to form more crystalline hydrates such as ettringite and monosulfoaluminate hydrate (figure 1). The formation of syngenite also appears to be a potentially significant factor.
Hydration Reactions and Development of Microstructure—Hydration begins as soon as the cementitious materials come in contact with water. The particles partially dissolve and the components start to react at various rates.
There is no single mechanism behind the wide range of effects that occur. Many of the mechanisms are complex and interactive, and they may require expert evaluation if they occur in the field. The following paragraph discusses some of the chemical reactions that occur.
Cement hydration in the first 15 min is a delicate balance between the C3A in the cement and the sulfate in solution, slowing the C3A reaction (figure 1). If there is insufficient sulfate in solution, the C3A begins to react immediately to form calcium aluminate hydrate, which can cause immediate and permanent flash set if it is not controlled. C3A hydrates at a more controlled rate in the presence of sulfate to form ettringite while there is sulfate in solution. When the sulfate is consumed, ettringite continues to react to form monosulfate (figure 1). On the other hand, too much sulfate in solution may precipitate out as gypsum, causing false (temporary) set. These reactions are the basis of many incompatibility problems.
The amount of sulfate in solution depends not only on the amount of sulfate in the cement, but also the form in which it occurs. Cement that has overheated in the mill can contain excess amounts of relatively fast dissolving plaster (CaSO4·½H2O). Cement manufacturers normally target a balance of plaster and gypsum (CaSO4·2H2O) suitable for the reactivity of a given clinker type and cement fineness, and optimize the sulfate content to balance the concrete setting time.
Addition of a supplementary cementitious material (SCM) that contains calcium aluminates (typically high calcium fly ash) can mean compromising the aluminate and sulfate balance, causing incompatibility problems.
The fineness of the cement also can influence the reaction rates: the finer the cement, the greater the risk of uncontrolled C3A reactions with other ingredients in the concrete.
Some chemical admixtures will interfere with C3A hydration and the solubility of calcium and sulfate in the pore solution; thus chemical admixtures may significantly affect the workability of the concrete in the first few minutes. Type A water reducers tend to accelerate aluminate hydration and retard silicate hydration. Some chemical admixtures may reduce early slump when used with some cementitious combinations.
Temperature strongly influences the solubility and reactivity of all of the chemical element compounds. Higher temperatures generally increase solubility and accelerate reaction rates. These changes can affect the balance of the system and change stiffening rates and setting times.
After a dormant period of 1 to 3 hours, the silicates (C3S and later the C2S) start to hydrate, forming fibrous CSH that gradually spreads and merges with the growth from other cement particles or adheres to aggregate particles. This buildup of new solid compounds results in
6
progressive stiffening, hardening, and strength development. This reaction proceeds as long as the system contains water, which explains the need for curing.
Increasing alkali content and cement fineness, along with increasing temperature, will increase reactivity of the silicate components and decrease setting times. Increasing reactivity will also tend to increase the rate of gain of stiffness, which may in turn increase the risk of cracking.
The presence of some chemical admixtures affects reaction rates, often retarding setting. Type A water-reducing admixtures may retard silicate hydration.
The saturation of calcium can also affect the hydration of C3S, which in turn is influenced by the reactions in early stages of hydration discussed earlier. Insufficient calcium in solution (i.e., if it has been consumed in early C3A hydration) will slow or stop silicate hydration, leading to retardation of the concrete or its failure to set.
DIMENSIONAL STABILITY AND CRACKING
Concrete, and all of the components in it, tends to grow or shrink with changing temperatures, moisture conditions, and, in some cases, with chemical reactions. By nature of its composition, concrete is mixed with water, some of which is consumed in hydration, and some of which may leave the system by bleeding or evaporation as the concrete is allowed to dry. All of the materials in concrete expand and shrink with changing temperature and moisture content.
The space occupied by the reagents of cement hydration is less than that of the hydrated system. This results in chemical shrinkage and autogenous shrinkage (the amount of chemical shrinkage that can be measured). This phenomenon is greatest in systems with low water-to-cementitious-materials ratios. Other chemical reactions, including alkali aggregate reactions and sulfate attack, can cause changes in the physical dimensions of the concrete, which are outside the scope of this protocol.
The consequences of these dimensional changes are a function of other properties of the concrete including restraint, stiffness, strength, and creep. A freestanding object that is not restrained internally or externally will shrink without damage; however, external restraint is almost always applied to concrete elements through their support systems and connections to adjacent elements. Internal restraint is also imposed by different components such as aggregates and pastes that have different stiffness values, which likely results in different amounts of dimensional movement. Such restraint will result in cracking.
The amount of stress set up in a shrinking, restrained material is a direct function of its stiffness (modulus of elasticity); stiffer materials result in higher stresses. Creep helps to mitigate the amount of stress. The risk of cracking is governed by the balance of imposed stress and the material strength.
Adding to the complexity of dimensional change is that all of these properties (including strength and stiffness) change with time as the concrete hydrates. The changes occur rapidly at earlier ages and slow with time. Furthermore, the changes occur at different rates for different properties. The rate of hydration can be influenced by temperature and the chemistry of the reactive materials. The rate of drying (and associated shrinkage) also can be influenced by
7
temperature and the environment the concrete is exposed to. The rates and amounts of temperature change are governed by the dimensions of the element, the environment, and the chemistry and degree of hydration.
Computer models are available to assess the risk of cracking in concrete pavements. Part of the work conducted in this project has been to determine the relative rates of change of strength and stiffness of the concrete mixtures tested.
The current standard test for concrete shrinkage (American Society for Testing and Materials (ASTM) C 157) does not provide information about dimensional changes in the concrete for the first 24 hours after mixing. It provides limited information before drying can start. Such information is required if early-age cracking is to be better understood and prevented. The ring shrinkage test provides a controlled method of tracking shrinkage-related stresses in concrete under restraint from the time the concrete is placed in the mold.
AIR VOID SYSTEM
To protect concrete from frost damage, it is important that it has a proper air void system. Such a system may be considered as a uniform distribution of a large number of small air bubbles, The critical variable in air void systems is the maximum distance from any point in the paste to the nearest bubble.
The quality of an air void system is strongly influenced by the chemistry of the cementitious materials, particularly the carbon content of fly ash if present. Different air-entraining admixtures also can produce different air void systems; some materials are strongly influenced by the presence of other chemical admixtures SCMs. Other influences are the grading of fine aggregate and the amount of mixing energy provided. It is easier to entrain air in a mixture with a higher slump than in one with a lower slump. The air void system of concrete will also change with continued handling, placing, and compacting.
It is desirable that spacing be determined in concrete, particularly in the fresh state, to allow early decisions regarding the concrete’s acceptability. It may be beneficial to test the concrete in its final position to evaluate the effects of handling; however, at present no proven method is available to make this measurement, making it important to correlate the final spacing factor with other, more easily measured parameters such as total air content, which is measured using a pressure meter.

9
CHAPTER 3. PRECONSTRUCTION TEST PROTOCOL
The purpose of conducting preconstruction tests is to evaluate the sensitivity of proposed materials to variations in composition and environment. If problems are observed in the field, this preconstruction evaluation allows selection of alternative materials before action plans are implemented. The work also provides calibration between field-based tests and laboratory-based tests and will give guidance on the limits appropriate for the materials to be used and conditions likely to be encountered.
MATERIALS
Representative samples of all materials likely to be used in the planned project, including substitutes that may be required, should be acquired and tested for compliance with their respective specifications. Expertise and experience aid in interpreting test result data.
CHEMISTRY
Chemical analyses of the reactive materials such as cements, SCMs, and chemical admixtures should include the following materials and characteristics:
• C3A amount. • Alkali content. • Sulfate content. • C3A and sulfate contents balance. • Fineness. • Sulfate form (if available).
Fly ashes and slags should be examined for the following characteristics:
• Loss-on-ignition (LOI) • Calcium content. • Alkali content. • Sulfate content. • Glass content, (if available). • Fineness (ultrafines) (if available).
Water-reducing admixtures should be identified for the following contents:
• Lignosulfonate. • Triethanolamine (TEA). • Sugar. • Polycarboxylate.
The solids content of chemical admixtures also should be determined.
10
Air-entraining admixtures should be identified for the following contents:
• Vinsol resin. • Resin and rosin. • Alpha sulfonate. • Benzene sulfonate. • Tall oil. • Fatty acid.
Guidelines for interpreting the data are given at the end of the protocol. Any of the examined chemical balances that indicate potential problems should be followed up with appropriate tests. It may be advisable to conduct all of the tests below (under “Stiffening and Setting,” “Cracking,” and “Air Void System) to provide a baseline for comparison with tests that are conducted later during construction.
STIFFENING AND SETTING
Paste, mortar, and concrete tests should be conducted at 21 °C (70 °F) and at the maximum and minimum temperatures likely to be encountered during construction. Tests should be conducted at the extremes of likely SCM and chemical admixture dosages. If any of the tests indicate potential problems, adjustments should be made to the system, and then tests should be conducted again to see if the issue is resolved. Note that in general, paste and mortar tests are more sensitive than concrete tests, meaning that a system that is marginal in a paste or mortar test may still be satisfactory in a concrete test.
Conduct any or all of the following tests on paste and mortar:
• Time of setting (ASTM C 191, paste) and stiffening (ASTM C 359, mortar). • Conduction calorimetry (paste or mortar). • Minislump (paste or mortar). • Rheology (paste or mortar).
If potential problems are indicated, then conduct any or all of the following tests on concrete:
• Slump loss. • Time of setting. • Ultrasonic P-wave. • Semiadiabatic temperature measurement.
Any method of determining time of setting may be appropriate, as long as it is applied consistently. Different methods may yield slightly different results. The minislump test may not be necessary if a rheology test is conducted.
It is particularly helpful to repeat the testing after changing a single parameter (e.g., fly ash dosage or order of batching) to assess the sensitivity of the system to these changes. An example would be temperature change. Raising the temperature from 27 °C to 32 °C (80 °F to 90 °F) has been known to change the stiffening rate of concrete from satisfactory to unsatisfactory.
11
The cure to problem systems is often one or a combination of the following factors:
• Change in fly ash (source, type, or dosage). • Change in chemical admixture (type or dosage).
• Change in batching sequence.
• Change in concrete temperature (e.g., through planning to work at night).
• Addition of a set retarder (only recommended if system is in sulfate balance, which can be determined by calorimetry).
• Information from the cement supplier informing of a change in the sulfate form.
CRACKING
Tests should be conducted at 21 °C (70 °F) and at the maximum and minimum temperatures likely to be encountered during construction. Tests should be conducted at the extremes of likely SCM and chemical admixture dosages. If any of the tests indicate potential problems, adjustments should be made to the system and followup tests should then be conducted to see if the issue is resolved.
Conduct any or all of the following tests:
• Time of setting (ASTM C 403). • Strength and modulus development. • Ring test (ASTM C 1581). • Semiadiabatic temperature measurement or isothermal calorimetry. Use computer models such as HIPERPAV® to assess the risk of cracking for the system and environment expected.
The cure to problem systems is often one or a combination of the following changes:
• SCM (type or source). • SCM proportions. • Retarding or accelerating admixtures; dosage may need to be optimized. • Concrete temperature. • Cement with a different chemistry. AIR VOID SYSTEM
Tests should be conducted at 21 °C (70 °F) and at the maximum and minimum temperatures likely to be encountered during construction. Tests should be conducted at the extremes of likely SCM and chemical admixture dosages. If any of the tests indicate potential problems, adjustments should be made to the system and followup tests should be conducted to see if the issue is resolved.
12
Conduct any or all of the following tests:
• Foam index test (paste). • Foam drainage test (paste). • Air content (ASTM C 231) (concrete). • Air void analyzer (concrete). • Hardened air content (ASTM C 457). • Clustering rating of hardened concrete. The cure to problem systems is often one or a combination of the following changes:
• Air-entraining admixture (type or dosage). • Chemical admixture (type, formulation, or dosage). • Batching sequence. • Refrain from adding water after initial mixing. • SCM. • SCM dosage. • Cement with a different chemistry. • Concrete temperature.
13
CHAPTER 4. DURING CONSTRUCTION TEST PROTOCOL
This portion of the protocol describes testing for prequalified systems to evaluate the risk of problems occurring because of changes in materials from load to load or changes in source or environment. If changes are noted, then the previously developed plans can be implemented; if these actions do not address the problem, then samples can be sent back to the laboratory for more detailed evaluation. More detailed laboratory tests will be those described for the preconstruction stage above.
Ideally, field tests should provide results in a short time; however, but this may not always be practical. The results of rapid tests (less than 24 hours) may indicate potential problems, but firm decisions on the acceptability of a given material may need to be delayed until after further testing. If the information can be used to change mixture proportions or practices to sidestep problems, then the protocol may be considered successful.
CHEMISTRY
To detect significant changes in composition or proportions, it is a good idea to track mill certificates and supplier’s data sheets for changes in chemistry of all the reactive systems, which could indicate potential problems. Pay special attention to variations in reported sulfur trioxide (SO3), C3A, C3S, fineness, setting time, and equivalent alkali content (Na2Oeq).
STIFFENING AND SETTING—FIELD TESTS
Conduct any or all of the following concrete stiffening and setting field tests:
• Slump loss. • Time of setting (ASTM C 403). • Ultrasonic P-wave. • Semiadiabatic temperature measurement. Monitor the results of these tests from batch to batch because changes can indicate potential problems. Either further laboratory testing is indicated or a change in the cementitious system or procedures.
CRACKING
No field tests are completely accurate for detecting risk of cracking in a concrete system; however, the tests can monitor changes in system chemistry and proportions by using computer models such as HIPERPAV to assess the risk of cracking. Monitoring test results of the semiadiabatic temperature measurement may provide a signal that hydration rates of the cementitious system are changing, thus pointing to potential problems.

14
If unexpected cracking occurs, then work should stop until the causes are identified and rectified. Concrete microscopy often can reveal underlying mixing, mixture proportion, or curing problems that can contribute to cracking.
AIR VOID SYSTEM
Use any or all of the following field tests to assess air void systems:
• Foam index test (paste). • Foam drainage test (paste). • Air content (ASTM C 231) (concrete). • Air void analyzer (concrete). Monitor the results of these tests from batch to batch Changes in results as indicated below will indicate potential problems requiring more detailed laboratory tests, or change the cementitious system or procedures.
15
CHAPTER 5. INTERPRETING DATA
CHEMISTRY
The chemical reactions in cement hydration, and the interactions with other added materials, are extremely complex. The following recommendations are intended as guidelines on data that may indicate potential problems. Values outside these limits should act as early warnings that indicate the need for further assessment, and the results should not necessarily be taken as definitive.
Portland Cement— The C3A content of a cement is not of direct concern; however, high C3A cements (>8 percent) are more likely prone to aluminate/sulfate imbalances. Likewise, it is not the total sulfate content that is of concern, but materials with low sulfate content (<3 percent) are more likely to be problematic. The form of the sulfate is important if the data on that characteristic are available. Approximately half of the sulfate should be in the form of gypsum (CaSO4·2H2O) and the remainder as plaster (CaSO4·½H2O). Greater amounts of plaster are likely to be problematic. This balance should be monitored between batches, and changes should warn of likely variations in the performance of the material.
Cements with high alkali contents (>0.8 percent) are generally more reactive, and therefore, they may be more prone to unexpected or imbalanced reactions including greater risk of cracking and air void system problems.
The finer the cement, the greater the risk of uncontrolled C3A reactions with other ingredients in the concrete.
Supplementary Cementing Material—Increasing calcium contents will accelerate initial hydration but, if it is in the form of C3A (typically high-calcium fly ash), it can cause the system’s C3A /sulfate balance to be compromised, resulting in unexpected stiffening early in the hydration process. Materials containing more than 10 percent CaO should be reviewed. Any C3A detected indicates that the material should be evaluated with the intended cement.
Increasing alkali contents will increase the reactivity of all supplementary cementing materials.
Increasing LOI contents will increase the amount of air-entraining admixture required to achieve a given air content, and it also will increase the variability in this amount. LOI greater than 4 percent may indicate potential problems.
Supplementary cementing materials will change the propensity of a system to crack, sometimes for the better by reducing stiffness and heat generation at early ages, and sometimes for the worse by reducing strength at early ages. The overall effect of such materials is specific to the material, environment, and application.
Chemical Admixtures—Some chemical admixtures will interfere with C3A hydration and the solubility of calcium and sulfate in the pore solution, and thus, it may significantly affect the workability of the concrete in the first few minutes. Tests have shown that some chemical
16
admixtures (particularly those containing TEA, lignin, and sugar) actually reduce slump when used with some cementitious combinations.
As with supplementary cementing materials, chemical admixtures can modify the risk of cracking by modifying the setting time, shrinkage, strength development, and heat development of a mixture, sometimes beneficially and sometimes detrimentally.
Air-entraining admixtures based on materials other than Vinsol® may require additional evaluation.
STIFFENING (ASTM C 359)
This test for stiffening is used to indicate if a system stiffens quickly and whether workability is recovered after remixing some time later. Either of these findings can be significant. A marked increase in mortar temperature indicates that uncontrolled C3A hydration is occurring, which may lead to flash set or rapid stiffening.
TIME OF SETTING
Initial set and final set in paste and concrete are defined as the times when a given penetration resistance is achieved as the mixtures hydrate. Initial set is associated with the beginning of the silicate reactions that give cementitious systems their hardness and strength. Final set is slightly more arbitrary, as defined in ASTM C 403, but it can be correlated loosely with the time when initial silicate reactions start to slow.
Time of setting can be determined in several ways:
• In paste, by using a vicat needle (ASTM C 191).
• In concrete, by using a penetrometer (ASTM C 403). Initial set is when a pressure of 3.5 megapascals (MPa) (500 pounds per square inch (psi)) is required to penetrate a plunger 1 inch into mortar sieved from the concrete. Final set is when a pressure of 27.6 MPa (4,000 psi) is required to penetrate the mortar.
• In examining the output of calorimetry or semiadiabatic temperature measurement tests, initial set corresponds reasonably with the time when the heat plot starts to rise at the end of the dormant period. Present test methods cannot determine final set.
• Likewise, a plot of the output from an ultrasonic P-wave plot shows the initial set when the curve starts to rise and final set when the curve starts to flatten off.
• Initial set can be observed in the output from a parallel-plate rheology test as the time when the torque that is required to shear the sample starts to increase.
Changes between batches of materials of more than 60 min for initial set, determined using any of these test techniques, can indicate potential problems.
17
CALORIMETRY
Following is a list of possible observations from a plot of heat versus time:
• Time of setting when the heat starts to increase: changes of more than 60 min are significant.
• Time of maximum heat generation: changes of more than 60 min are significant.
• Maximum rate of heat generation (silicate peak): changes of more than 2.5 joules per gram per hour (J/g/h) (0.021 calories per ounce per hour) (cal/oz/h) are significant.
• Movement of the sulfate depletion peak without a change in the sulfate content of the system indicates a potential problem. The presence of chemical admixtures can change the timing of the sulfate depletion peak. This is usually not a problem as long as the sulfate depletion peak occurs after the main alite hydration peak.
MINISLUMP
Comparison of the relative areas of paste mixture pats formed over time can provide useful information regarding the potential problems from C3A hydration or gypsum deposition. Changes in the concrete can be predicted by marked differences in the area of the pat made at 5 min after mixing because of changing temperature, changes in material batches, types, sources, or changing proportions of materials. The smaller the pat, the greater the likelihood that the workability of the associated concrete will be reduced. A change of 20 percent in pat area between batches should be considered significant.
An increase in pat area with increasing time is an indication of undesirable reactions occurring, probably because of gypsum deposition that results in a false set. If the ratio of pat area at 5 min over the 2-min pat area is 1.3 or greater, the system may be problematic.
A marked reduction in pat area in the first 30 min may indicate excessive stiffening, probably because of insufficiently controlled C3A hydration. If the ratio of pat area at 5 min over the 30-min pat area is 0.8 or less, the system may be problematic.
RHEOLOGY
Changes in setting times as recorded in the rheology plots can be used to interpret the output. Changes of more than 60 min between comparable points are significant.
SLUMP LOSS
Monitoring the slump of concrete over a period of time will provide a clear indication of the potential performance of the concrete.
A slump loss of 50 millimeters (mm) (2 inches) or more during the first 60 min may be considered significant.
18
SEMIADIABATIC TEMPERATURE MEASUREMENT
The output from a semiadiabatic temperature measurement test can be interpreted in much the same way as data from calorimetry can be. Changes in the setting time, the time and magnitude of the temperature peak, and an observation of any secondary peak, all can help indicate problems.
Changes in timing from batch to batch of more than 30 min are significant, just as a change in peak temperature of more than 6 °C (10 °F) is significant, Development of a secondary peak often is associated with the presence of SCMs, and changes in the magnitude or position of such a peak should be considered an indication that something significant has changed in the concrete composition.
RING TEST
The ring test can be used to observe stress development in a system and indicate when cracking may occur. Guides for interpreting the results appear in ASTM C 1581.
AIR CONTENT
A change of 30 percent in the amount of air-entraining admixture required to achieve a given air content can indicate significant changes in the system.
FOAM INDEX TEST
A change in the amount of air-entraining admixture required to achieve a full coverage of foam of more than 30 percent from previous tests is considered significant and indicates a change in the properties of the materials in the system.
FOAM DRAINAGE TEST
The foam drainage test indicates the stability of a foam that has generated in a paste system. The test indicates clear differences between chemical admixtures and its effects in combination with supplementary cementing materials; however, the limited concrete test program did not exhibit the same sensitivity. A system that appears problematic in the laboratory test may still perform satisfactorily in the field; on the other hand, if the system performs well in the laboratory, problems in the field are unlikely. It should be noted that the foam drainage test may indicate a property—such as stability with continued handling—that was not investigated in the concrete tests.
A value of 100 or less for the parameter –1/k (the output from the test method) may indicate a potential problem. A change of 300 or more between samples for –1/k also could indicate significant changes in the system.
19
AIR VOID CLUSTERING
If a rating for observed clustering of 1 or greater is determined for a mixture, using the method described by Kozikowski, then a significant loss of compressive strength may be expected in the concrete.(1)
AIR VOID ANALYZER
The air void analyzer (AVA) is marketed as an instrument that provides data on the air void system in hardened concrete. Correlation with total air content is reportedly poor, but satisfactory correlation with spacing factor has been reported. The data collected in this project indicated poor correlation with either parameter.
Field reports indicate that the system is sensitive to mounting stability, and that vibration of the platform (e.g., a trailer) can interfere with the output. Temperature also has been described as a critical control parameter.
It is possible a system calibrated to a single mix can provide useful data on potential variability between batches. The intended application of this test is to determine the air void system in concrete that has been placed and compacted, without needing to wait for days for a hardened air-content analysis.
Pass/fail limits could be based on the same values used in the hardened air content test, discussed in the next paragraphs.
HARDENED AIR CONTENT
Most authorities consider the following air void characteristics as representative of a system with adequate freeze-thaw resistance:
• Calculated spacing factor (an index related to the distance between bubbles but not the actual average spacing in the system)—less than 0.2 mm (0.008 inch).
• Specific surface, α, (surface area of the air voids)—24 mm2/mm3 (600 in2/in3) of air void volume, or greater.

21
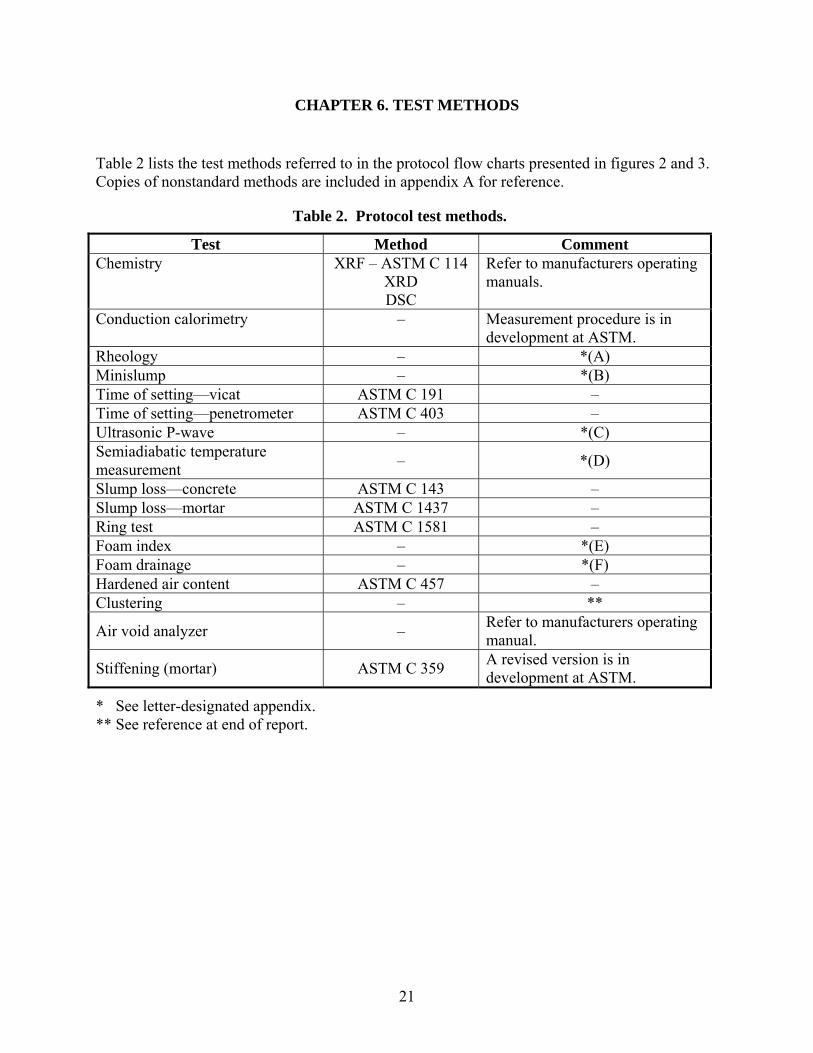
CHAPTER 6. TEST METHODS
Table 2 lists the test methods referred to in the protocol flow charts presented in figures 2 and 3. Copies of nonstandard methods are included in appendix A for reference.
Table 2. Protocol test methods.
Test Method Comment Chemistry XRF – ASTM C 114
XRD DSC
Refer to manufacturers operating manuals.
Conduction calorimetry – Measurement procedure is in development at ASTM.
Rheology – *(A) Minislump – *(B) Time of setting—vicat ASTM C 191 – Time of setting—penetrometer ASTM C 403 – Ultrasonic P-wave – *(C) Semiadiabatic temperature measurement – *(D)
Slump loss—concrete ASTM C 143 – Slump loss—mortar ASTM C 1437 – Ring test ASTM C 1581 – Foam index – *(E) Foam drainage – *(F) Hardened air content ASTM C 457 – Clustering – **
Air void analyzer – Refer to manufacturers operating manual.
Stiffening (mortar) ASTM C 359 A revised version is in development at ASTM.
* See letter-designated appendix. ** See reference at end of report.
22
Figure 2. Protocol flow chart, preconstruction stage.
Review Chemistry of Reactive Materials Cement: C3A and alkali content, fineness
SCM: calcium and alkali content, LOI Chemical admixtures: composition
Select Tests: • Setting time. • Temperature development. • Minislump/concrete slump loss. • Rheology. • Stiffening (ASTM C 359).
Select Tests: • Setting time. • Strength development. • Ring test. • Temperature development.
Select Tests: • Foam index. • Foam drainage. • Air void analyzer (AVA). • Hardened air. • Clustering.
• Change fly ash (source, type or dosage). • Change chemical admixture (type or dosage). • Change batching sequence. • Change concrete temperature (e.g., through
planning to work at night). • Use a set retarder. • Contact the cement supplier regarding the
sulfate form in the system.
Stiffening Cracking Air Void System
• Change supplementary cementitious material (type or source).
• Change SCM proportions. • Use retarding/accelerating admixtures; dosage
may have to be optimized. • Change concrete temperature. • Select a cement with a different chemistry.
• Change air-entraining admixture (type or dosage).
• Change chemical admixture (type, formulation, or dosage).
• Change batching sequence. • Refrain from adding water after initial
mixing. • Change supplementary cementitious
material. • Change SCM dosage. • Select a cement with a different chemistry. • Change concrete temperature.
Vary the following to assess risks of problems and potential mitigating methods.
Potential Problems?
Provide guidelines on actions to take if temperature changes, materials change, or problems occur.
23
Figure 3. Protocol flow chart, construction stage.
NOTES: • Tests should be selected on the basis of what is available locally, the value of the project, and the risk or consequences of failures
occurring. • Setting time may be monitored using any one of a number of techniques including vicat, penetrometer, calorimetry, temperature
monitoring, and P-wave.
Monitor Chemistry of Reactive Materials Cement: C3A and alkali content, fineness
SCM: calcium and alkali content, loss-on-ignition Chemical admixtures: composition
Select Tests: • Slump loss. • Setting time. • Temperature development.
Select Tests: • Hiperpav. • Temperature development.
Select Tests: • Foam index. • Foam drainage. • Air content. • AVA.
Stiffening Cracking Air Void System
Significant changes noted or problems occur? Institute actions developed during preconstruction tests.
If problems continue, refer back to the laboratory.

25
CHAPTER 7. EXAMPLE: PRECONSTRUCTION MATERIALS ANALYSIS
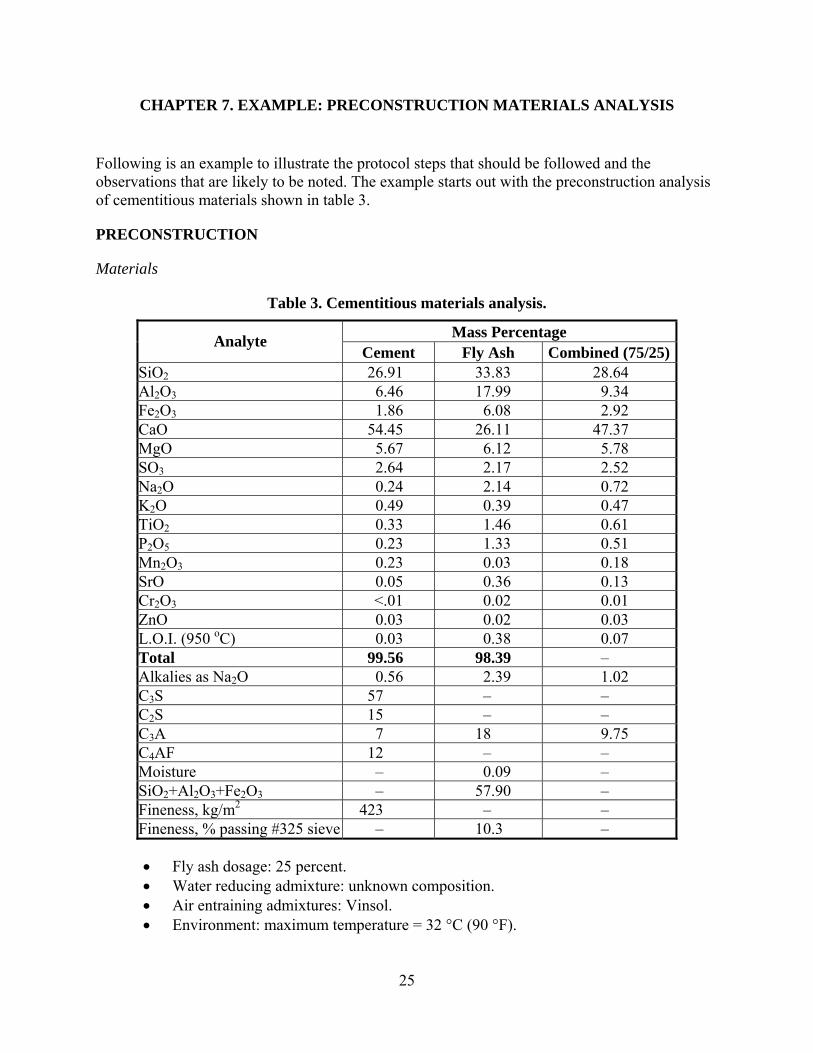
Following is an example to illustrate the protocol steps that should be followed and the observations that are likely to be noted. The example starts out with the preconstruction analysis of cementitious materials shown in table 3.
PRECONSTRUCTION
Materials
Table 3. Cementitious materials analysis.
Mass Percentage Analyte Cement Fly Ash Combined (75/25)
SiO2 26.91 33.83 28.64 Al2O3 6.46 17.99 9.34 Fe2O3 1.86 6.08 2.92 CaO 54.45 26.11 47.37 MgO 5.67 6.12 5.78 SO3 2.64 2.17 2.52 Na2O 0.24 2.14 0.72 K2O 0.49 0.39 0.47 TiO2 0.33 1.46 0.61 P2O5 0.23 1.33 0.51 Mn2O3 0.23 0.03 0.18 SrO 0.05 0.36 0.13 Cr2O3 <.01 0.02 0.01 ZnO 0.03 0.02 0.03 L.O.I. (950 oC) 0.03 0.38 0.07 Total 99.56 98.39 – Alkalies as Na2O 0.56 2.39 1.02 C3S 57 – – C2S 15 – – C3A 7 18 9.75 C4AF 12 – – Moisture – 0.09 – SiO2+Al2O3+Fe2O3 – 57.90 – Fineness, kg/m2 423 – – Fineness, % passing #325 sieve – 10.3 –
• Fly ash dosage: 25 percent. • Water reducing admixture: unknown composition. • Air entraining admixtures: Vinsol. • Environment: maximum temperature = 32 °C (90 °F).
26
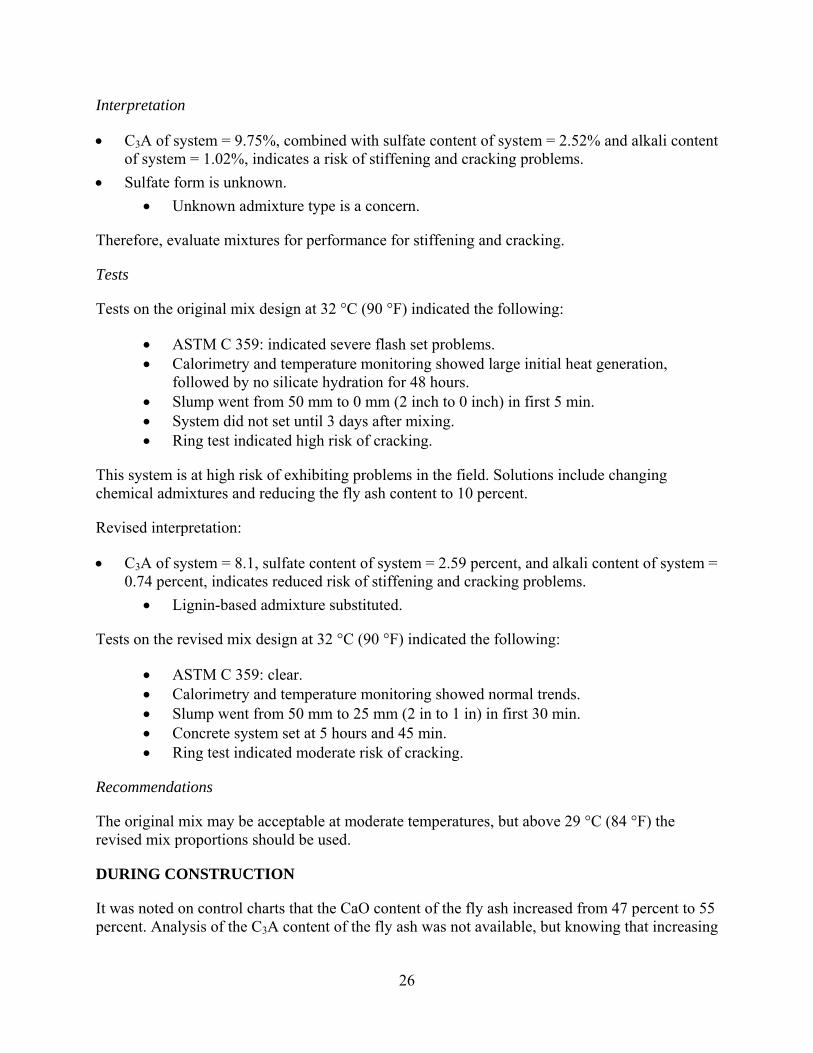
Interpretation
• C3A of system = 9.75%, combined with sulfate content of system = 2.52% and alkali content of system = 1.02%, indicates a risk of stiffening and cracking problems.
• Sulfate form is unknown. • Unknown admixture type is a concern.
Therefore, evaluate mixtures for performance for stiffening and cracking.
Tests
Tests on the original mix design at 32 °C (90 °F) indicated the following:
• ASTM C 359: indicated severe flash set problems. • Calorimetry and temperature monitoring showed large initial heat generation,
followed by no silicate hydration for 48 hours. • Slump went from 50 mm to 0 mm (2 inch to 0 inch) in first 5 min. • System did not set until 3 days after mixing. • Ring test indicated high risk of cracking.
This system is at high risk of exhibiting problems in the field. Solutions include changing chemical admixtures and reducing the fly ash content to 10 percent.
Revised interpretation:
• C3A of system = 8.1, sulfate content of system = 2.59 percent, and alkali content of system = 0.74 percent, indicates reduced risk of stiffening and cracking problems.
• Lignin-based admixture substituted.
Tests on the revised mix design at 32 °C (90 °F) indicated the following:
• ASTM C 359: clear. • Calorimetry and temperature monitoring showed normal trends. • Slump went from 50 mm to 25 mm (2 in to 1 in) in first 30 min. • Concrete system set at 5 hours and 45 min. • Ring test indicated moderate risk of cracking.
Recommendations
The original mix may be acceptable at moderate temperatures, but above 29 °C (84 °F) the revised mix proportions should be used.
DURING CONSTRUCTION
It was noted on control charts that the CaO content of the fly ash increased from 47 percent to 55 percent. Analysis of the C3A content of the fly ash was not available, but knowing that increasing

27
CaO is often associated with increasing C3A, it was decided to institute the modified asset of mix proportions immediately even though the temperature was at 27 °C (81 °F).
No stiffening issues were noted on site. The amount of cracking was observed to decrease with the modified mix.

29
ACKNOWLEDGEMENTS
The authors wish to acknowledge the work of the following people in completing the work described in this report:
From the CLT Group: Katie Amelio Pat Berry Barb Betke Javed Bhatty Fred Blaul Phil Brindisi Roberto Celestin Luis Duval Ken MacLeod Greg Miller Mohamad Nagi Agata Pyc Brian Szczerowski Shiraz Tayabji
From Braun Intertec:
Rachel Detwiler From NIST:
Max Peltz John Winpigler
DISCLAIMER
Commercial equipment, instruments, and materials mentioned in this paper are identified to foster understanding. Such identification does not imply recommendation or endorsement by the authors or NIST, nor does it imply that the materials or equipment identified are necessarily the best available for the purpose.
MATCHING FUNDS
CTLGroup was required to provide a minimum of a 20 percent match of the Federal funding toward the project. The matching funds were obtained by reaching agreement with the Portland Cement Association. No specific task was solely funded by PCA, but rather, a proportion of every payment due through the duration of the project was invoiced to PCA. PCA’s total contribution was $110,000 of the total estimated project cost of $451,245.


31
APPENDIX A: DRAFT STANDARD TEST METHOD FOR MEASUREMENT OF CEMENT PASTE SETTING TIME USING A PARALLEL PLATE RHEOMETER
32
Draft Standard Test Method for
Measurement of Cement Paste Setting Time Using a Parallel Plate Rheometer ______________________________________________________________________________
1. SCOPE
1.1 This test method covers the determination of cement paste yield stress using a parallel plate rheometer. It is intended for use in monitoring setting time of cement paste.
1.2 The values stated in SI units are to be regarded as the standard.
1.3 This standard does not purport to address all of the safety problems, if any, associated with its use. It is the responsibility of the user of this standard to establish appropriate safety and health practices and determine the applicability of regulatory limitations prior to use.
______________________________________________________________________________
2. REFERENCED DOCUMENTS
______________________________________________________________________________
3. SUMMARY OF TEST METHOD
3.1 This test method uses the stress growth procedure. The cement paste is sheared at a very low shear rate (the lowest possible with the rheometer used) and the shear stress is measured. The shear stress increases linearly with time until the yield stress is reached. At that point, the shear stress reaches a peak, and then it decreases. The linear portion is caused by the elastic response of the viscoelastic material. After the yield stress is reached, the material flows, and the reduction in shear stress is measured. The plot of the yield stress versus the time will gradually increase until initial setting is reached. After initial setting is reached, the shear stress will increase very fast until the rheometer can no longer measure flow because the shear stress is too high. .
33
______________________________________________________________________________
4. SIGNIFICANCE AND USE
4.1. To determine early stiffening of cement paste resulting from incompatibility between the various constituents such as supplementary cementitious materials, chemical admixtures, and the cement, it is important to monitor and track changes in the setting times of the cement paste.
4.2. The standard test to measure the evolution of setting time uses a vicat needle, but this method provides measurement of only initial set and final set. It does not monitor the evolution of setting before the initial set. This method based on the measurement of rheological properties allows the monitoring of the evolution before initial set. Two parameters can be measured before initial set: the initial yield stress and the slope of the yield stress versus time. It is possible that a higher initial yield stress and a higher slope could lead to a low workable mixture.
4.3. The vicat needle initial setting time corresponds to the point in the stress versus time curve where the cement paste yield stress starts to increase more rapidly until final set.
______________________________________________________________________________
5. INTERFERENCES
5.1 Slippage—If the water/cement ratio selected is too high, and sedimentation/bleeding occurs during the measurements, the shear stress measured would be artificially low, which can be detected by observing the cement paste left in the vacuum bottle for bleeding or performing a bleeding test using a small graduate cylinder filled with cement paste and covered with plastic.
______________________________________________________________________________
6. APPARATUS
6.1 Blender—A blade mixer with a 1 L (.3 gallon (gal)) capacity that is connected to a speed controller and a temperature controlled water bath.
34
6.2 Speed Controller—A device capable of maintaining blade speed at a preset rate.
6.3 Water bath—A controlled-temperature bath capable of maintaining a desired temperature.
6.4 Rheometer—A parallel-plate rheometer has a 35 mm diameter with two serrated test plates, which are separated by a gap of 1mm (0.04 inch).
6.5 Syringe—A disposable syringe without a needle used for measuring 2 mL (0.07 fluid ounce (fl oz)) of cement paste.
6.6 Vacuum Bottle—A hermetically sealed vacuum stainless steel bottle for storing cement paste between measurements.
6.7 Blender Vane—A system capable of mixing the cement paste directly into the vacuum bottle.
6.8 Balance—A device used to measure materials for the mixture.
______________________________________________________________________________
7. REAGENTS, MATERIALS
7.1 Cement—Tested cement.
7.2 Cementitious Materials—Tested materials in the cement paste.
7.3 Water—An ingredient required for making cement paste with specified water-to-cement ratios.
35
_____________________________________________________________________________
8. TEST SPECIMENS
8.1 Single test specimen for use in this test should consist of 2 mL (.07 fl oz) of fresh cement paste per rheometer measurement. To obtain a uniform cement paste mixture, about 300 grams (g) (10.6 ounces (oz)) of dry material (cement and supplementary cementitious materials) should be used in the blender. (Mixing procedure described in section 8.3).
8.2 Cement paste for this test should be prepared as cement (cementitious) and water mix with desired water-cement ratios.
8.3 Mixing procedure for cement paste should be the following: • Add water to mixer. • Set the blade speed at about 419 radians per second (rad/s) (4,000 revolutions per
minute (rpm)). • Introduce cement into the mixer in a 30 s period. • Increase the blade speed to 1,047 rad/s (10,000 rpm) and mix for 30 s. • Stop the mixer and scrape the walls. • After 2.5 min, turn the mixer on for 30 s at the speed of 1,047 rad/s (10,000 rpm). • Measure the temperature of cement paste.
8.4 Remove the cement paste and place it in the vacuum bottle.
______________________________________________________________________________
9. CONDITIONING
9.1 Between measurements, store tested cement paste in a hermetically sealed vacuum bottle.
9.2 Before testing the remaining cement paste in the storage jar, use the blender to remix the cement paste for 10 s.
36
_____________________________________________________________________________
10. PROCEDURE
10.1 Using a disposable syringe, transfer 2 mL (0.07 fl oz) of fresh cement paste to the lower plate of the rheometer.
10.2 Record the shear stress versus time for 5 min at constant shear rate.
Note 1—Select the minimum shear rate possible with the rheometer in use; shear rate ≤ 0.01 s-1 is recommended.
Note 2—Shorter measurement time is possible in most cases; usually 3 min are sufficient.
10.3 Clean the rheometer and prepare it for the next measurement. 10.4 Just before the next measurement, use the blender to remix the remaining cement paste in
the vacuum bottle and repeat from section 10.1.
______________________________________________________________________________
11. CALCULATION AND INTERPRETATION OF RESULTS
11.1 The shear stress increases linearly with time until the yield stress is reached (figure 1). At that point, the shear stress reaches a peak and then decreases. The shear stress at point B (figure 1) is taken as the yield stress at the time the measurement was made.
11.2 For each time measurement, record the yield stress and plot it versus time.
Note 3—It is recommended a measurement be taken every 15 to 20 min for at least the first 2 to 4 h.
11.3 Interpretation of the measurements: The plot of yield stress versus the time gradually increases until initial setting is reached. After initial setting is reached, the shear stress increases very fast, lasting until the rheometer can no longer measure flow because the shear stress is too high.
37
_____________________________________________________________________________
12. REPORT
12.1 Reporting includes (1) cement paste proportion and water-cement (cementitious) ratio as determined in section 8.2, and (2) initial setting times for tested cement mixes obtained from plots as described in section 11.3.
12.2 Optional information could also report the initial yield stress as determined in section 11.3 and the initial slope before setting time.
______________________________________________________________________________
13. PRECISION AND BIAS
13.1 The precision of initial setting time by this method depends on the number of data points that are available around the initial set data point.
13.2 Bias could be determined as comparison with the vicat needle measurements because it is
the only other test for determining setting time. The error is about 30 min between the two methods.
______________________________________________________________________________
14. KEYWORDS
Rheology, cement paste, initial setting
______________________________________________________________________________
15. REFERENCES
R.A. Helmuth, L.M. Hills, D.A. Whitting, S. Bhattacharja, “Abnormal Concrete Performance in Presence of Admixtures.” PCA serial number 2006. 1995.
C.F. Ferraris, “Measurements of the Rheological Properties of Cement Paste: A New Approach.” Conference on Role of Admixtures in High Performance Concrete sponsored by

38
Cementos Mexicanos, S.A. (CEMEX), March 21–26, 1999. Monterey, Mexico. Rilem Publications S.A.R.L.. Cabrera, J.G., Rivera-Villarreal, R.R., Editors, pp. 333–342, 1999.
C.F. Ferraris, J.M. Gaidis, “The Connection Between the Rheology of Concrete and the Rheology of Cement Paste.” ACI Materials Journal, 88(4). pp. 388–393. 1992.

39
APPENDIX B: DRAFT STANDARD TEST METHOD FOR MEASUREMENT OF CEMENT PASTE INTERACTIONS USING A MINISLUMP CONE
40
Draft Standard Test Method for
Measurement of Cement Paste Interactions Using a Minislump Cone ______________________________________________________________________________
1. SCOPE
1.1 This test method is used to assess the risk of flash or false set in a cementitious paste.
1.2 The values stated in SI units are to be regarded as the standard.
1.3 This standard does not purport to address all of the safety problems, if any, associated with its use. It is the responsibility of the user of this standard to establish appropriate safety and health practices and determine the applicability of regulatory limitations prior to use.
______________________________________________________________________________
2. REFERENCED DOCUMENTS
______________________________________________________________________________
3. SUMMARY OF TEST METHOD
3.1 This method consists of monitoring the change in workability of cement paste over time. Workability is assessed by observing the size of the pat formed when a slump test is conducted using a scaled-down cone-shaped mold. Samples are tested at intervals between 2 and 60 min after mixing.
41
______________________________________________________________________________
4. SIGNIFICANCE AND USE
4.1 The data are used to assess whether undesirable reactions are occurring in the system, which could indicate unexpected stiffening of concrete made with the same materials tested.
______________________________________________________________________________
5. INTERFERENCES
5.1 The size of slump-cone pats is influenced by the mixing effort applied to the system; therefore, data should be compared between laboratories only if both are using similar mixers.
5.2 Temperature of the mixture influences its workability and also the results of this test.
5.3 The speed at which the slump cone is lifted may influence the results.
______________________________________________________________________________
6. APPARATUS
6.1 A blade mixer with vibrating filler chute.
6.2 Water temperature controller.
6.3 Scale reporting to 0.1g with a minimum capacity of 500 g.
6.4 Dropper graduated to 0.01 mL.
42
6.5 Minislump cone, 60-mm high, 20-mm top diameter, 40-mm bottom diameter.
6.6 Scraper.
6.7 Tamper as specified in ASTM C 109.
6.8 Acrylic sheet at least 3 mm thick.
6.9 Vernier calipers.
______________________________________________________________________________
7. REAGENTS, MATERIALS
7.1 Potable water.
______________________________________________________________________________
8. TEST SPECIMENS
8.1 The matrix of materials and mix proportions depends on the purpose of the test program. To evaluate field mixtures, use materials and proportions based on the concrete mix design.
8.2 Vary the water to cementitious materials (w/cm) ratio, temperature, SCM, and chemical admixture selections and dosages and sequence of additions of admixtures. Varying these factors helps in the observation of the effects of these changes on the performance of the mixture.
43
______________________________________________________________________________
9. CONDITIONING
9.1 Allow materials to stabilize at the test temperature before testing.
______________________________________________________________________________
10. PROCEDURE
10.1 Attach mixing bowl to water conditioning unit for 30 min to reach equilibrium temperatures.
10.2 Weigh out cementitious materials (approximately 600 g is sufficient for a typical mix) and water to achieve the required w/cm.
10.3 Measure out appropriate amount of chemical admixtures. If dosages are very low, then dilute the admixtures and allow for the extra water in the total water measurement.
10.4 Pour dry materials into mixing bowl, and start mixer.
10.5 Add water and start timer.
10.6 Mix for 30 s and switch off mixer until 1 min 30 s on the timer.
10.7 Restart mixer and mix for 30 s.
10.8 Use spoon to place paste into mold on acrylic sheet in a single layer. Compact with tamper for 15 blows.
44
10.9 Lift mold quickly.
10.10 Measure and record diameter of pat in mm across two perpendicular axes.
10.11 Repeat steps 10.7 through 10.10 so that mold is lifted at 5, 10, and 30 mins, or at other intervals as necessary. Remixing may be omitted if the mixture for modeling will be transported in nonagitating equipment,.
______________________________________________________________________________
11. CALCULATION AND INTERPRETATION OF RESULTS
11.1 Calculate areas of pats at the measured time intervals using the following equation:
Area = (average diameter)2 * π/4
11.2 Calculate false set index, FSI, using the following equation:
FSI = Area at 5 min/Area at 2 min
11.3 Calculate stiffening index using the following equation:
Stiffening Index = Area at 30 min/Area at 5 min
11.4 If FSI is greater than 1.3, then the mix likely will exhibit false setting tendencies.
11.5 If SI is less than 0.85, the mix is likely to stiffen unacceptably quickly.
11.6 If average pat area is less than 15,000 mm2, the mix is likely to be stiff and unworkable.
45
______________________________________________________________________________
12. REPORT
Report the following factors:
12.1 Materials details and proportions.
12.2 Test temperature.
12.3 Pat areas at times tested.
12.4 False set index and stiffening index.
______________________________________________________________________________
13. PRECISION AND BIAS
13.1 Precision and bias have not been determined for this test.
______________________________________________________________________________
14. KEYWORDS
Paste, minislump, incompatibility, false set, flash set
46
______________________________________________________________________________
15. REFERENCE
S. Bhattacharja and F.J. Tang. “Rheology of Cement Paste in Concrete With Different Mix Designs and Interlaboratory Evaluation of the Mini-Slump Cone Test.” PCA R&D Serial No. 2412, Portland Cement Association, Skokie, Illinois, 2000.
47
APPENDIX C: DRAFT STANDARD TEST METHOD FOR MEASUREMENT OF TIME OF SET OF CONCRETE USING WAVE VELOCITY METHOD
48
Draft Standard Test Method for
Measurement of Time of Set of Concrete Using Ultrasonic Pulse-Wave Velocity Method ______________________________________________________________________________
1. SCOPE
1.1 This testing method covers the determination of initial and final setting times for fresh concrete by use of ultrasonic pulse-wave velocity. This nondestructive test is designed for use in either the field or laboratory.
1.2 The values stated in SI units are to be regarded as the standard.
1.3 This standard does not purport to address all of the safety problems, if any, associated with its use. It is the responsibility of the user of this standard to establish appropriate safety and health practices and determine the applicability of regulatory limitations prior to use.
2. REFERENCED DOCUMENTS
2.1 AASHTO Standards
T 119 Slump of Hydraulic Cement Concrete
T 141 Sampling Freshly Mixed Concrete
T 152 Air Content of Freshly Mixed Concrete by the Pressure Method
T 196 Air Content of Freshly Mixed Concrete by the Volumetric Method
T 197 Time of Setting of Concrete Mixtures by Penetration Resistance
2.2 ASTM Standards
C 670 Practice for Preparing Precision and Bias Statements for Test Methods of Construction Materials
49
E 1 Specification for ASTM Thermometers
C 403 Time of Setting of Concrete Mixtures by Penetration Resistance
C 597 Standard Test Method for Pulse Velocity Through Concrete
______________________________________________________________________________
3. SUMMARY OF TEST METHOD
3.1 This testing method uses ultrasonic pulse-wave velocity (UPV) transmitted through fresh concrete specimens to determine the initial time of set. Fresh concrete is consolidated in an acrylic mold and stored at a specified curing temperature. Ultrasonic transducers are bolted on each side of the mold, and then connected to a pulse velocity transit time recorder. At regular intervals, the time taken for a pulse to travel through the concrete specimen (ultrasonic pulse-wave velocity transit time) is recorded automatically. The recorded time is used to calculate the ultrasonic pulse velocity. Plot of change in pulse velocity as a function of the elapsed time is obtained. The data is used to determine the initial setting time of concrete.
______________________________________________________________________________
4. SIGNIFICANCE AND USE
4.1 The ultrasonic pulse-wave velocity method directly determines the initial setting time of fresh concrete. This nondestructive, simple, and reproducible testing method that can be used in both the field and laboratory.
4.2 The time of setting is evaluated by monitoring the change in the rate of pulse velocity of concrete from the time of placement up to the final setting stage.
______________________________________________________________________________
5. INTERFERENCES
_____________________________________________________________________________
50
6. APPARATUS
6.1 A rigid, securely tightened, leakproof acrylic mold that measures 150 mm by 150 mm by 300 mm.
6.2 Mold fastening system of 2 steel rods and 4 nuts used to clamp mold together.
6.3 Ultrasonic pulse velocity transit time recorder that is capable of automatic digital recording and storing in memory data on pulse velocity transit.
6.4 P-wave transmitter and receiver transducers.
6.5 Ultrasonic couplant.
6.6 Computer software to transfer data from pulse velocity transit time recorder to a computer central processing unit (CPU).
6.7 Round, straight, steel tamping rod with a rounded hemispherical tip.
6.8 Vibrating table for concrete consolidation.
6.9 Thermometer capable of measuring fresh concrete temperature to ± 0.5 ºC (±1 ºF).
______________________________________________________________________________
7. REAGENTS, MATERIALS
7.1 Cement, aggregates, admixtures, mineral admixtures, water.
51
_____________________________________________________________________________
8. TEST SPECIMENS
8.1 For field tests, make a minimum of two specimens from each concrete batch.
8.2 For laboratory tests, make two specimens from each concrete batch. More specimens may be needed, depending on the purpose of the test.
8.3 Obtain a representative sample of the fresh concrete in accordance with AASHTO T141. Determine and record the slump and air content of the fresh concrete.
______________________________________________________________________________
9. CONDITIONING
9.1 The entire testing set up is to be placed in the test environment 24 hours before the test.
9.2 Samples should be protected from drying by covering with suitable material such as a water impermeable sheet for the duration of the test.
______________________________________________________________________________
10. PROCEDURE
10.1 Prepare an acrylic 150 mm by 150 mm by 300 mm mold.
10.2 Set the pulse velocity transit time recorder at a specified recording time interval (5 min is adequate).
10.3 Record time when water is added to the mix.
10.4 Place fresh concrete in the prepared mold.
52
10.5 Consolidate concrete mix by using a vibration table or by tamping.
10.6 Place the test specimen in the desired curing environment within 30 min of initial mixing.
10.7 Bolt the ultrasonic transducers on each end of the mold. Apply ultrasonic couplant between the transducers and the plastic mold to assure good wave transmission.
10.8 Connect the ultrasonic transducers to the pulse velocity transit time recorder.
10.9 Fasten the ultrasonic transducers with two steel rods and four bolts to assure constant pressure between the ultrasonic transducers and the acrylic mold.
10.10 Start automatically recording the pulse velocity transit time. Continue monitoring as long as required.
______________________________________________________________________________
11. CALCULATION AND INTERPRETATION OF RESULTS
11.1 Transfer pulse velocity transit time data to CPU using appropriate software.
11.2 Enter the time difference between the test starting time and the time at which initial contact was made between cement and mixing water.
11.3 Calculate the ultrasonic pulse velocity by dividing the distance separating the transducer transmitter and receiver by the ultrasonic pulse velocity transit time, as shown in the following equation:
Ultrasonic pulse velocity = Distance between sensors/transit time
11.4 For the test sample, prepare ultrasonic pulse velocity versus time plots.
11.5 For each plot, determine the times of initial setting as the time corresponding to the first inflection in the plot.
11.6 Record the setting time in hours and minutes.
53
______________________________________________________________________________
12. REPORT
Report the following information:
12.1 Details of the materials used.
12.2 Mixture proportions.
12.3 Mixing and curing environments.
12.4 Plots of ultrasonic pulse velocity versus elapsed time for each time of setting test.
12.5 Time of initial setting for each test.
12.6 Average times of initial and final setting for each test condition.
______________________________________________________________________________
13. PRECISION AND BIAS
No precision or bias has been determined for this test.
______________________________________________________________________________
14. KEYWORDS
Setting times, ultrasonic pulse velocity (UPV) method, concrete, nondestructive testing, p-wave

54
______________________________________________________________________________
15. REFERENCES
55
APPENDIX D: DRAFT STANDARD TEST METHOD FOR SEMIABIDIATIC TEMPERATURE MEASUREMENT
56
Draft Standard Test Method for
Semiadiabatic Temperature Measurement ______________________________________________________________________________
1. SCOPE
1.1 This test method covers the monitoring of temperature changes of fresh concrete. It is intended for use in monitoring setting time and hydration characteristics of concrete mixtures.
1.2 The values stated in SI units are to be regarded as the standard.
1.3 This standard does not purport to address all of the safety problems, if any, associated with its use. It is the responsibility of the user of this standard to establish appropriate safety and health practices and determine the applicability of regulatory limitations prior to use.
______________________________________________________________________________
2. REFERENCED DOCUMENTS
______________________________________________________________________________
3. SUMMARY OF TEST METHOD
3.1 This test method monitors the change in temperature of the mortar or concrete over time.
57
______________________________________________________________________________
4. SIGNIFICANCE AND USE
4.1 The output from a semiadiabatic temperature measurement test can be used to determine setting time of a mixture, as well as to observe hydration characteristics of a given system.
4.2 Changes in the timing or magnitude of temperature increase indicate changes in the hydration of a cementitious system, possibly resulting from changes in the chemistry of the system or changes in the environment.
4.3 The test can be used to identify some potential incompatibilities that may occur in cementitious systems.
4.4 Samples tested may be purpose-made mortars prepared in the laboratory, or mortar field samples sieved from concrete at a construction site.
______________________________________________________________________________
5. INTERFERENCES
______________________________________________________________________________
6. APPARATUS
6.1 Type T thermocouples.
6.2 Data logger with multiple data channels.
6.3 Computer software to record temperature readings over time.
6.4 Cylinder molds or disposable foam cups.
58
6.5 Insulating container such as Dewar flasks or a special insulated container shaped to hold the cylinder molds.
6.6 Number 4 sieve.
______________________________________________________________________________
7. REAGENTS, MATERIALS
7.1 Dry sand for reference sample.
_____________________________________________________________________________
8. TEST SPECIMENS
8.1 The selection of materials and mix proportions depends on the purpose of the experiment. Normally, a suite of tests with various admixtures and SCM dosages are used to determine their effects in a given mixture. Tests also can be conducted over a range of ambient temperatures to assess the sensitivity of the system to temperature. Field tests use proportions based on the concrete design mix to determine if the materials vary significantly or if the mixture is at risk of unexpected stiffening and setting behavior.
8.2 Prepare a control specimen using sand in one of the test containers with the same volume as the mortar specimens to be tested.
8.3 Prepare a mortar sample, either by mixing in a laboratory, or by sieving from a concrete mixture using the number 4 sieve. (Note: concrete mixtures can be tested without sieving, but larger specimens are required, and the sensitivity of the method decreases).
59
______________________________________________________________________________
9. CONDITIONING
9.1 None.
___________________________________________________________________________
10. PROCEDURE
10.1 Place and compact mortar into the test containers.
10.2 Place containers into the insulating system within 30 min of mixing.
10.3 While the temperature of the samples is being recorded, thermocouples attached to containers or placed into the mortar should be used to minimize influence of the environment.
10.4 Attach thermocouples to data logger and start collecting temperature readings. Frequency and duration of readings depend on the mixture and the application; generally, one reading per min is adequate.
______________________________________________________________________________
11. CALCULATION AND INTERPRETATION OF RESULTS
11.1 Subtract temperature recorded for sand sample (reference) from temperatures recorded for cement paste or mortar samples (test).
11.2 Prepare temperature change versus time graphs for cement or mortar samples (test).
60
______________________________________________________________________________
12. REPORT
12.1 Items to include in the report are (1) cement paste proportion and water-to-cement (cementitious) ratio, (2) temperature versus time graphs for every tested cement paste or mortar sample obtained, (3) first and second temperature peaks.
______________________________________________________________________________
13. PRECISION AND BIAS
13.1 Precision and bias have not been determined for this test.
______________________________________________________________________________
14. KEYWORDS
Semiadiabatic temperature measurement, cement paste, mortar, set time, calorimetry
______________________________________________________________________________
15. REFERENCE
T. Cost and G. Knight, A Study of the Factors Influencing Incompatibility of Common Concrete Materials. [DRAFT.] 2005.
61
APPENDIX E: DRAFT STANDARD TEST METHOD FOR DETERMINING FOAM INDEX OF CEMENTITIOUS PASTE MIXURES
62
Drat Standard Test Method for
Determining Foam Index of Cementitious Paste Mixtures ______________________________________________________________________________
1. SCOPE
1.1 This test method evaluates the amount of air-entraining agent required by an SCM in concrete.
1.2 The values stated in SI units are to be regarded as the standard.
1.3 This standard does not purport to address all of the safety problems, if any, associated with its use. It is the responsibility of the user of this standard to establish appropriate safety and health practices and determine the applicability of regulatory limitations prior to use.
______________________________________________________________________________
2. REFERENCED DOCUMENTS
______________________________________________________________________________
3. SUMMARY OF TEST METHOD
3.1 This method consists of determining the amount of air-entraining admixture required to make stable foam for a given set of cementitious materials. A known amount of air entraining admixture is added to a cement, SCM, and water mixture and vigorously shaken. The foam produced by the system is evaluated for its stability over the next 45 s. The amount of air-entraining admixture is adjusted until the minimum amount required to make a stable foam is determined.
63
______________________________________________________________________________
4. SIGNIFICANCE AND USE
4.1 This testing method is used to estimate the effect of supplementary cementitious materials on the amount of air-entraining admixture required to entrain adequate air content in concrete.
4.2 This test can also be used to monitor variability of a supplementary cementitious material between batches or lots.
______________________________________________________________________________
5. INTERFERENCES
5.1 Changing test temperature may change the determined foam index.
______________________________________________________________________________
6. APPARATUS
6.1 Scale reading in 0.1 g increments with a minimum capacity of 50 g.
6.2 Dropper graduated in 0.01 mL increments.
6.3 Mixing bowl suitable for hand mixing 500 mL of powder.
6.4 Spatula or spoon for mixing powder.
64
6.5 500-mL widemouthed jar with lid.
6.6 Stop watch.
______________________________________________________________________________
7. REAGENTS, MATERIALS
7.1 Potable water.
_____________________________________________________________________________
8. TEST SPECIMENS
8.1 Cement.
8.2 Air entraining admixture.
8.3 Supplementary cementitious material.
______________________________________________________________________________
9. CONDITIONING
9.1 Allow materials to stabilize to the test environment before testing.
65
______________________________________________________________________________
10. PROCEDURE
10.1 Place 50 mL of water in a 500 mL widemouthed jar.
10.2 For a control mixture, use 20 g of cement only. For test mixtures use 16 g of cement and 4 g of supplementary cementitious material, and then hand blend them in the bowl.
10.3 Pour the dry blend into the water in the jar.
10.4 Cap the jar and shake vigorously for 15 s.
10.5 Measure a quantity of air-entraining admixture using the dropper, and then add to the jar.
10.6 Add water and start timer.
10.7 Shake the jar for an additional 15 s.
10.8 Place the jar in an upright position for 45 s and remove the cap.
10.9 Observe the stability of the foam. A stable foam may be defined as the state where bubbles exist as continuous foam over the entire surface of the suspension in the jar. An unstable state is recognized by discontinuities in the foam.
10.10 Repeat sections 10.1 through 10.9 with other dosages of air-entrained admixture and determine the minimum amount of air-entrained admixture required to produce a stable foam.
66
______________________________________________________________________________
11. CALCULATION AND INTERPRETATION OF RESULTS
11.1 Calculate the foam index as a percentage using the following equation:
Foam Index = 100 (amount of AEA required for test mixture) /(amount of AEA required for control mixture)
11.2 A foam index greater than 100 percent indicates that more air-entraining admixture will be required to produce the same amount of entrained air in a concrete mixture using the tested supplementary cementitious material than in a similar mixture that does not contain the SCM.
11.3 A change of foam index of more than 50 percent between tests of an SCM indicates a likely significant change in composition of the SCM.
______________________________________________________________________________
12. REPORT
Report the following information:
12.1 Date and time of test. 12.2 Source of materials. 12.3 Foam index to a whole percentage point.
______________________________________________________________________________
13. PRECISION AND BIAS
13.1 Precision and bias have not been determined for this test.
67
______________________________________________________________________________
14. KEYWORDS
Fly ash, supplementary cementitious material, air-entraining admixture, foam stability, air void system
______________________________________________________________________________
15. REFERENCES
V. Dodson. “Foam Index Test.” Presentation at the Transportation Research Board, Washington, D.C., January 1980.
S. H. Gebler and P .Klieger. “Effect of Fly Ash on the Air-Void Stability of Concrete,” Portland Cement Association, Skokie, IL. Research and Development Bulletin, RD 085, 1983.
R. Meininger, “Use of Fly Ash in Concrete—Report of Recent NSGA-NRMCA Research Laboratory Studies.” Presentation at NRMCA Quality Control Conference, St. Louis, MO. July 1980.


69
APPENDIX F: DRAFT STANDARD TEST METHOD FOR FOAM DRAINAGE ANALYSIS METHOD
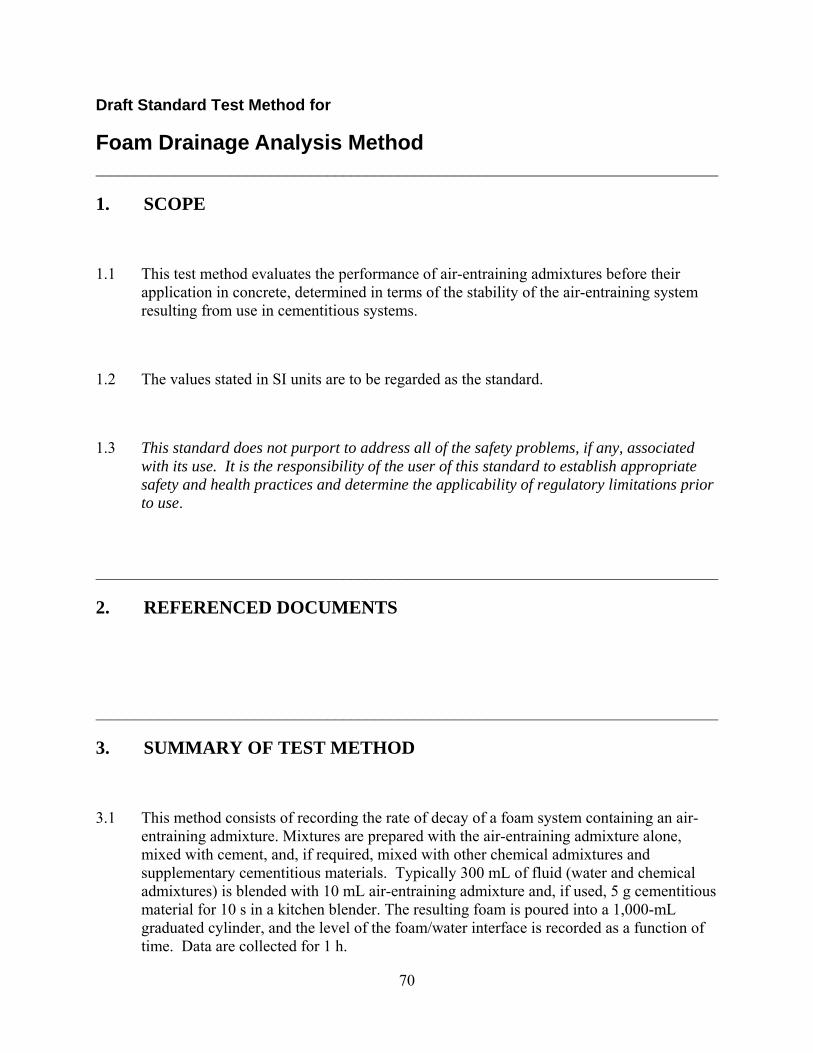
70
Draft Standard Test Method for
Foam Drainage Analysis Method ______________________________________________________________________________
1. SCOPE
1.1 This test method evaluates the performance of air-entraining admixtures before their application in concrete, determined in terms of the stability of the air-entraining system resulting from use in cementitious systems.
1.2 The values stated in SI units are to be regarded as the standard.
1.3 This standard does not purport to address all of the safety problems, if any, associated with its use. It is the responsibility of the user of this standard to establish appropriate safety and health practices and determine the applicability of regulatory limitations prior to use.
______________________________________________________________________________
2. REFERENCED DOCUMENTS
______________________________________________________________________________
3. SUMMARY OF TEST METHOD
3.1 This method consists of recording the rate of decay of a foam system containing an air-entraining admixture. Mixtures are prepared with the air-entraining admixture alone, mixed with cement, and, if required, mixed with other chemical admixtures and supplementary cementitious materials. Typically 300 mL of fluid (water and chemical admixtures) is blended with 10 mL air-entraining admixture and, if used, 5 g cementitious material for 10 s in a kitchen blender. The resulting foam is poured into a 1,000-mL graduated cylinder, and the level of the foam/water interface is recorded as a function of time. Data are collected for 1 h.
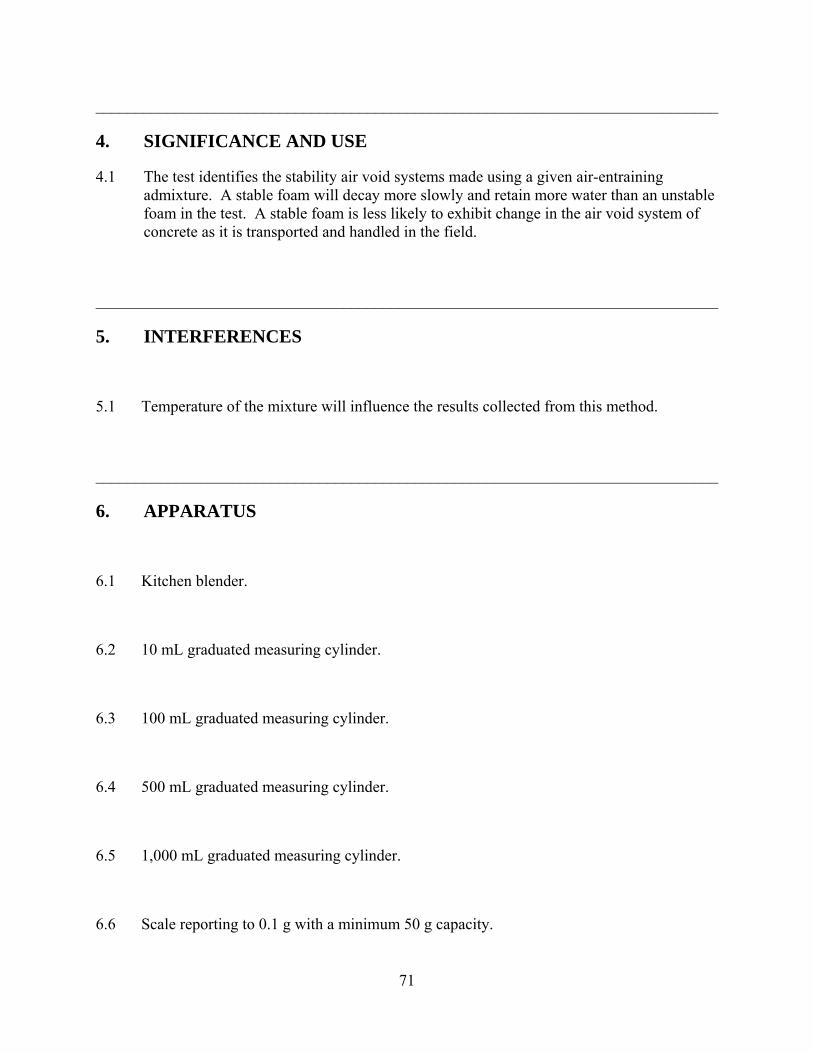
71
______________________________________________________________________________
4. SIGNIFICANCE AND USE
4.1 The test identifies the stability air void systems made using a given air-entraining admixture. A stable foam will decay more slowly and retain more water than an unstable foam in the test. A stable foam is less likely to exhibit change in the air void system of concrete as it is transported and handled in the field.
______________________________________________________________________________
5. INTERFERENCES
5.1 Temperature of the mixture will influence the results collected from this method.
______________________________________________________________________________
6. APPARATUS
6.1 Kitchen blender.
6.2 10 mL graduated measuring cylinder.
6.3 100 mL graduated measuring cylinder.
6.4 500 mL graduated measuring cylinder.
6.5 1,000 mL graduated measuring cylinder.
6.6 Scale reporting to 0.1 g with a minimum 50 g capacity.
72
6.7 Stop watch.
______________________________________________________________________________
7. REAGENTS, MATERIALS
7.1 Potable water.
7.2 Chemical admixtures.
______________________________________________________________________________
8. TEST SPECIMENS
8.1 Air-entraining admixture.
8.2 Portland cement.
8.3 Supplementary cementitious materials.
8.4 Chemical admixtures.
73
______________________________________________________________________________
9. CONDITIONING
9.1 Allow materials to stabilize at the test temperature before testing.
______________________________________________________________________________
10. PROCEDURE
The test is normally conducted as a suite to evaluate the performance of a given air-entraining admixture alone, and in the presence of cement, supplementary cementitious materials and other chemical admixtures. The following procedure is repeated with different combinations of ingredients, as required by the experimental plan.
10.1 Measure 300 mL of fluid (water and 50 mL of chemical admixtures if required) into the blender.
10.2 Measure 10 mL air-entraining admixture and add to the blender.
10.3 Add 5 g cementitious materials, if required.
10.4 Turn the blender on at a medium setting for 10 s.
10.5 Immediately pour the resulting foam into a 1,000 ml graduated cylinder.
10.6 Record the volume of fluid at the bottom of the cylinder as a function of time, for up to 60 min.
74
______________________________________________________________________________
11. CALCULATION AND INTERPRETATION OF RESULTS
11.1 Determine Vd as the amount of water drained from the foam at time t for each recorded reading.
11.2 Calculate 1/t for each recorded reading (where t is in min).
11.3 Plot Vd versus 1/t.
11.4 Determine the Y-intercept and the slope of the plot based on the following equation:
Vd = V0 – 1/(k * t)
11.5 V0, Y-intercept, may be considered to be the amount drained from the foam at the end of the test (t = infinity).
11.6 –1/k, the slope, indicates the rate of water drainage from the foam.
11.7 The lower the value of –1/k, and the higher the value of V0, the less stable the foam.
11.8 Some admixtures can be strongly influenced by the presence of cement, supplementary cementitious materials, or chemical admixtures, and they should be tested in the combination likely to be used in the project being considered.
______________________________________________________________________________
12. REPORT
Report the following information:
12.1 Date and time of test. 12.2 Combinations of materials used and dosages.
75
12.3 Calculated V0 and −1/k parameters.
______________________________________________________________________________
13. PRECISION AND BIAS
13.1 Precision and bias have not been determined for this test.
______________________________________________________________________________
14. KEYWORDS
Foam stability, air void system
______________________________________________________________________________
15. REFERENCE
W. Cross, E. Duke, J. Kellar, and D. Johnston, Investigation of Low Compressive Strengths of Concrete Paving, Precast and Structural Concrete, South Dakota Department of Transportation Report SD98-03-F. 2000.


77
REPORT REFERENCE
1. R.L. Kozikowski, Jr., D.B. Vollmer, P.C. Taylor, and S.H. Gebler. “Factors Affecting the Origin of Air-Void Clustering.” PCA R&D Serial No. 2789, Portland Cement Association. Skokie, IL. 2005.

HRDI-12/08-06(1M500)E RecycledRecyclable