Embed Size (px)
Citation preview
Identifying High Throughput Paths in 802.11
Mesh Networks : A Model-based Approach
Theodoros Salonidis (Thomson) Michele Garetto (University of Torino) Amit Saha (Tropos) Edward Knightly (Rice University)
2
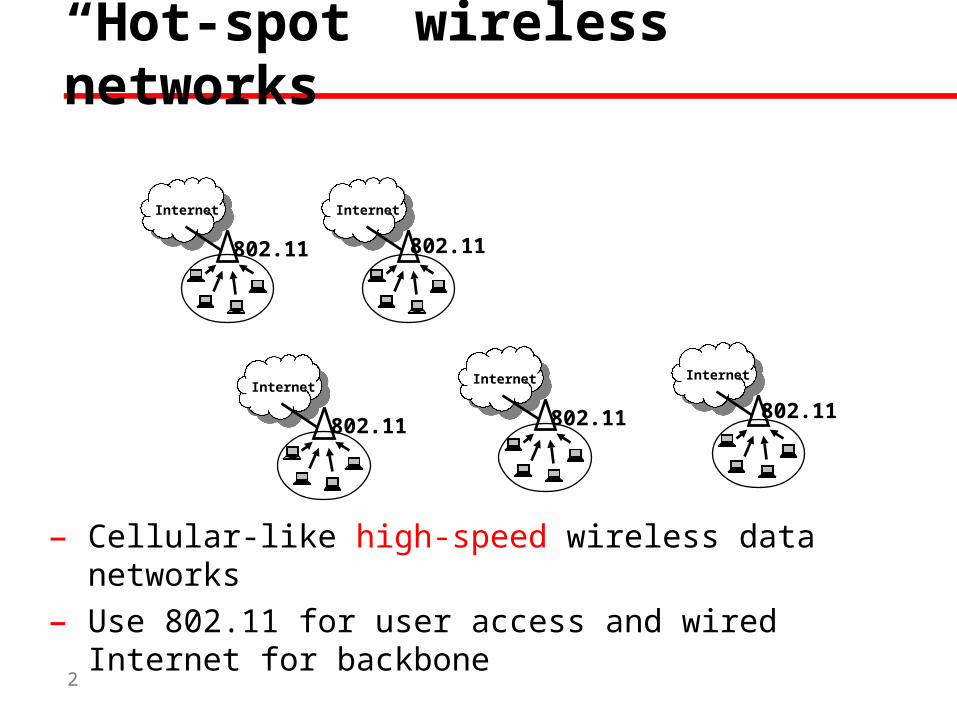
“Hot-spot” wireless networks
Internet Internet
InternetInternet Internet
– Cellular-like high-speed wireless data networks
– Use 802.11 for user access and wired Internet for backbone
802.11
802.11
802.11
802.11 802.11
3
Internet
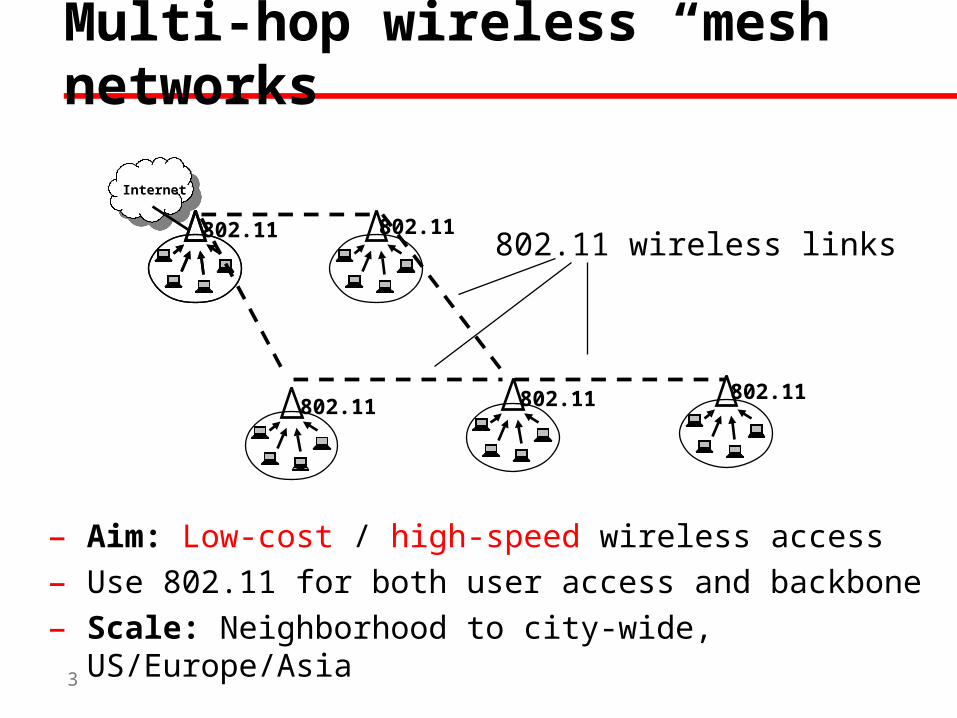
– Aim: Low-cost / high-speed wireless access
– Use 802.11 for both user access and backbone
– Scale: Neighborhood to city-wide, US/Europe/Asia
802.11 wireless links802.11
802.11
802.11
802.11 802.11
Multi-hop wireless “mesh” networks
4
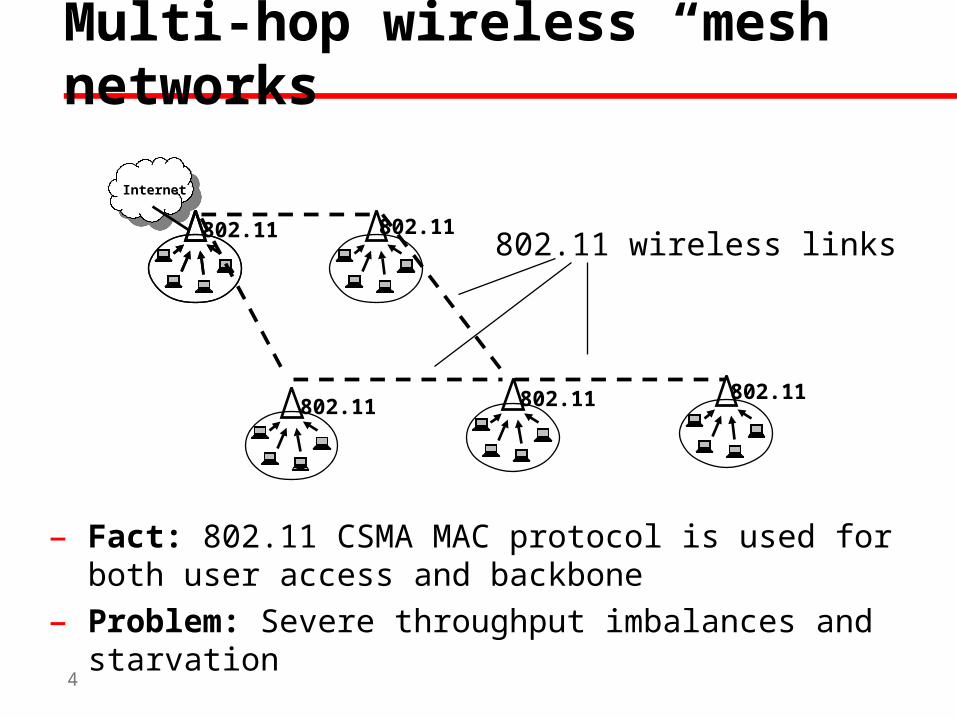
Multi-hop wireless “mesh” networks
Internet
– Fact: 802.11 CSMA MAC protocol is used for both user access and backbone
– Problem: Severe throughput imbalances and starvation
802.11 wireless links802.11
802.11
802.11
802.11 802.11
5
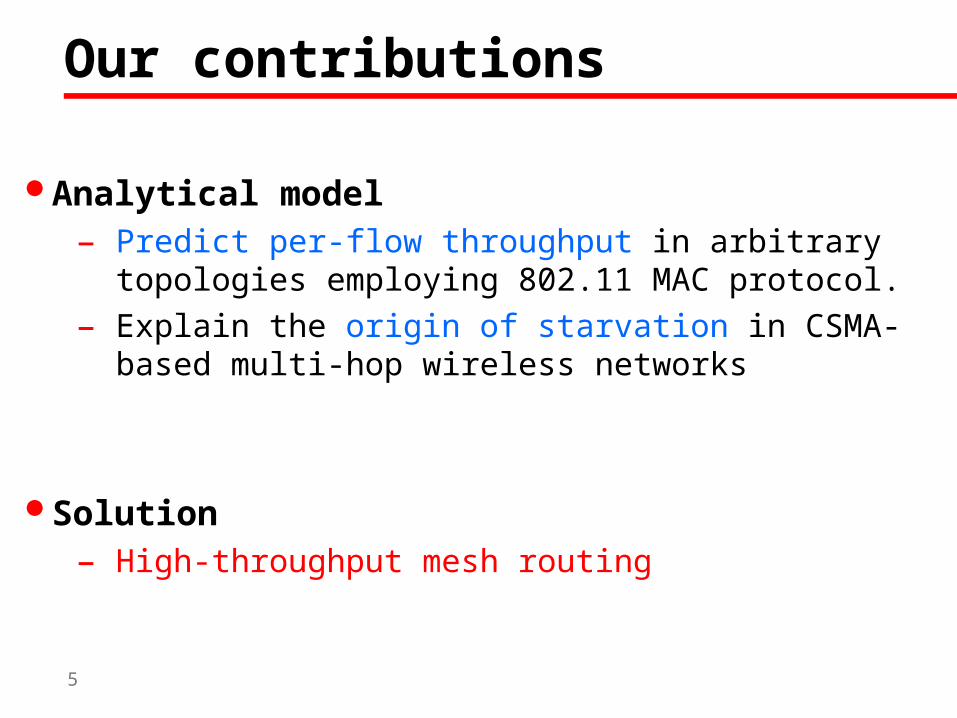
Our contributions
Analytical model– Predict per-flow throughput in arbitrary topologies employing
802.11 MAC protocol.
– Explain the origin of starvation in CSMA-based multi-hop wireless networks
Solution– High-throughput mesh routing
6
Roadmap
Overview of multi-hop 802.11 model
Technique for available bandwidth computation
Comparison of existing loss-based routing metrics with new routing metric that directly computes high-throughput paths
7
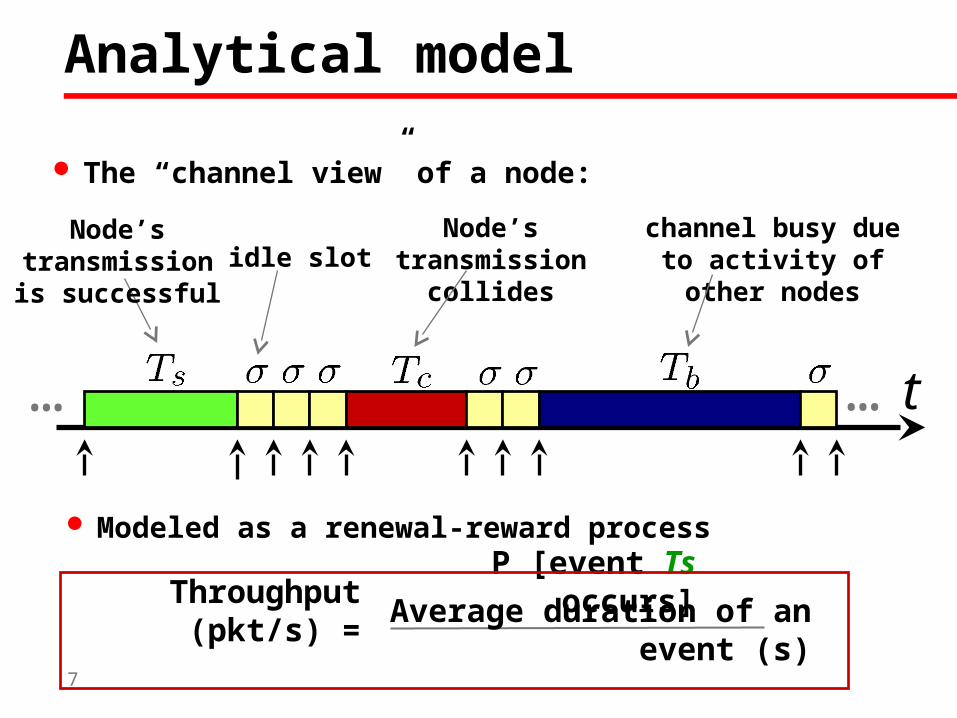
The “channel view” of a node:
… …
Node’s transmission is successful idle slot
Node’s transmission collides
t
channel busy due to activity of other nodes
Modeled as a renewal-reward process
Throughput (pkt/s) =P [event Ts occurs]
Average duration of an event (s)
Analytical model
8
… …t
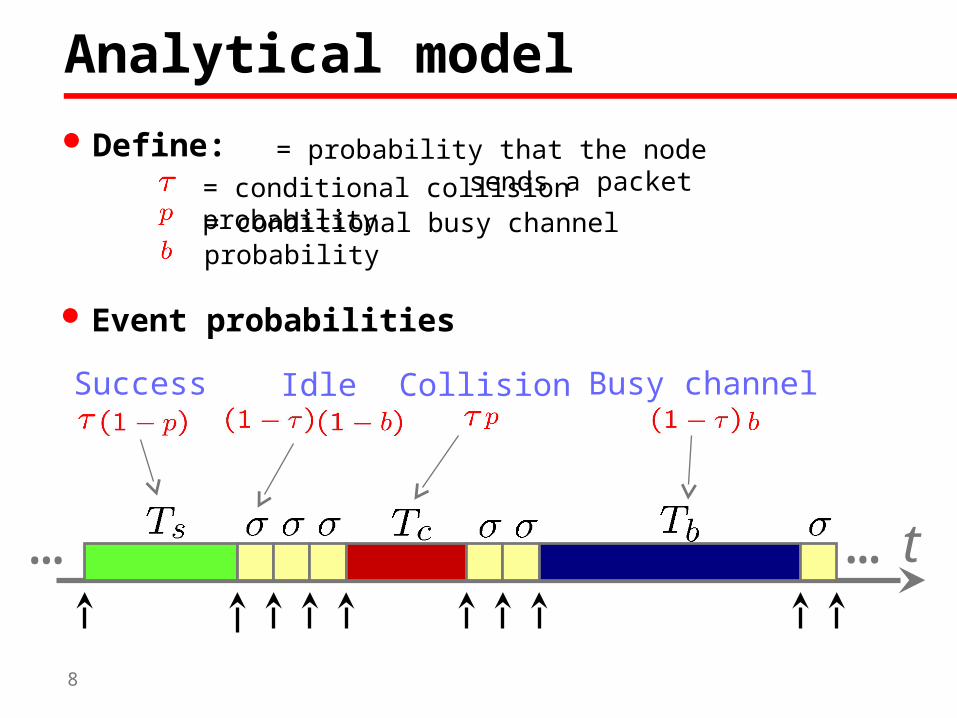
Define: = probability that the node sends a packet
= conditional collision probability= conditional busy channel probability
Success Idle Collision Busy channel
Event probabilities
Analytical model
9
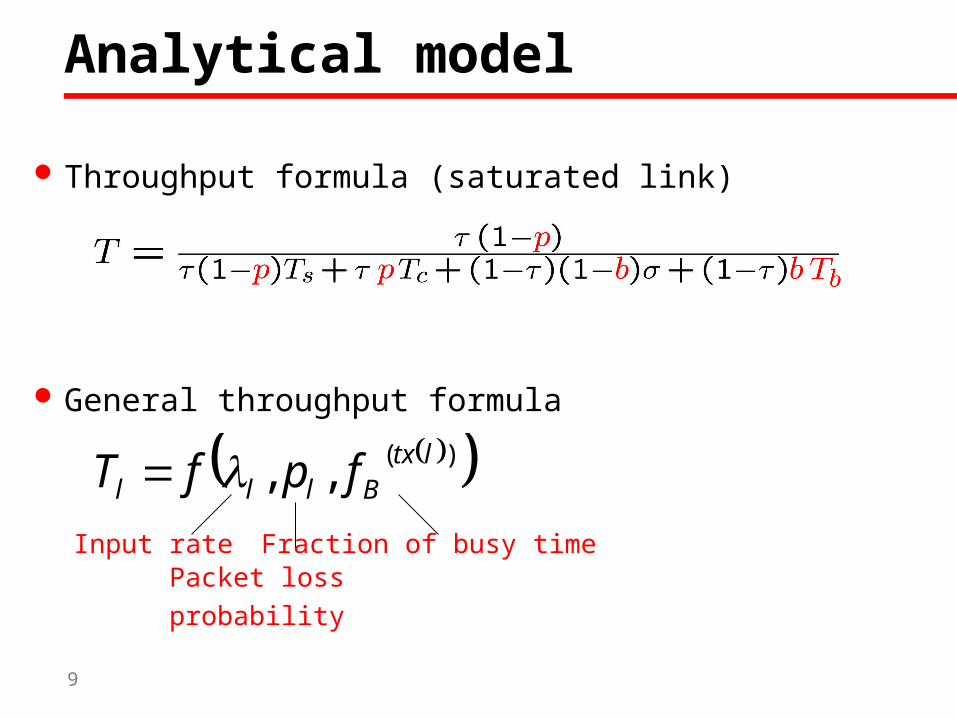
Throughput formula (saturated link)
General throughput formula
)(,, ltxBlll fpfT
Input ratePacket loss
probability
Fraction of busy time
Analytical model
10
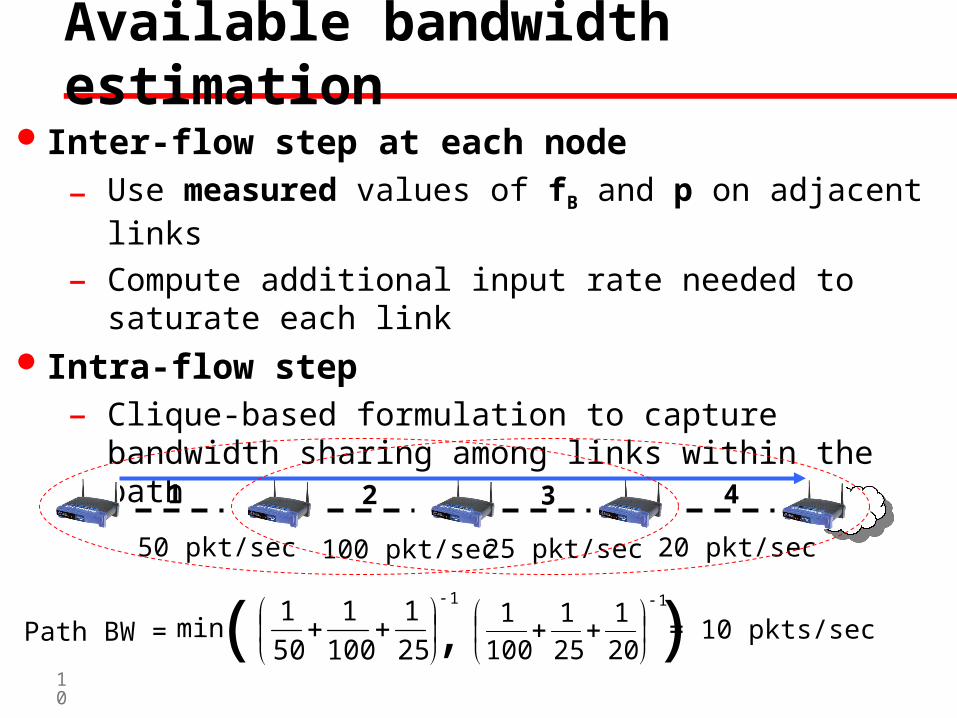
Available bandwidth estimation
1
25
1
100
1
50
1
Inter-flow step at each node
– Use measured values of fB and p on adjacent links
– Compute additional input rate needed to saturate each linkIntra-flow step
– Clique-based formulation to capture bandwidth sharing among links within the path
1 2 43
50 pkt/sec 100 pkt/sec 25 pkt/sec 20 pkt/sec
1
20
1
25
1
100
1
Path BW = min ( ) = 10 pkts/sec ,
11
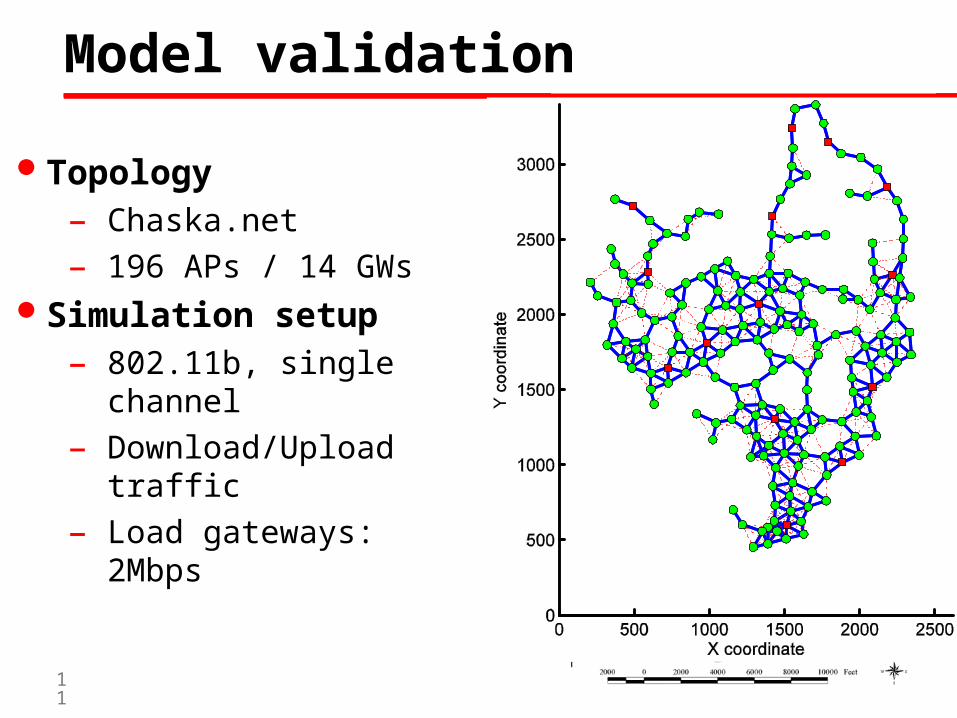
Model validation
Topology– Chaska.net
– 196 APs / 14 GWs Simulation setup
– 802.11b, single channel
– Download/Upload traffic
– Load gateways: 2Mbps
12
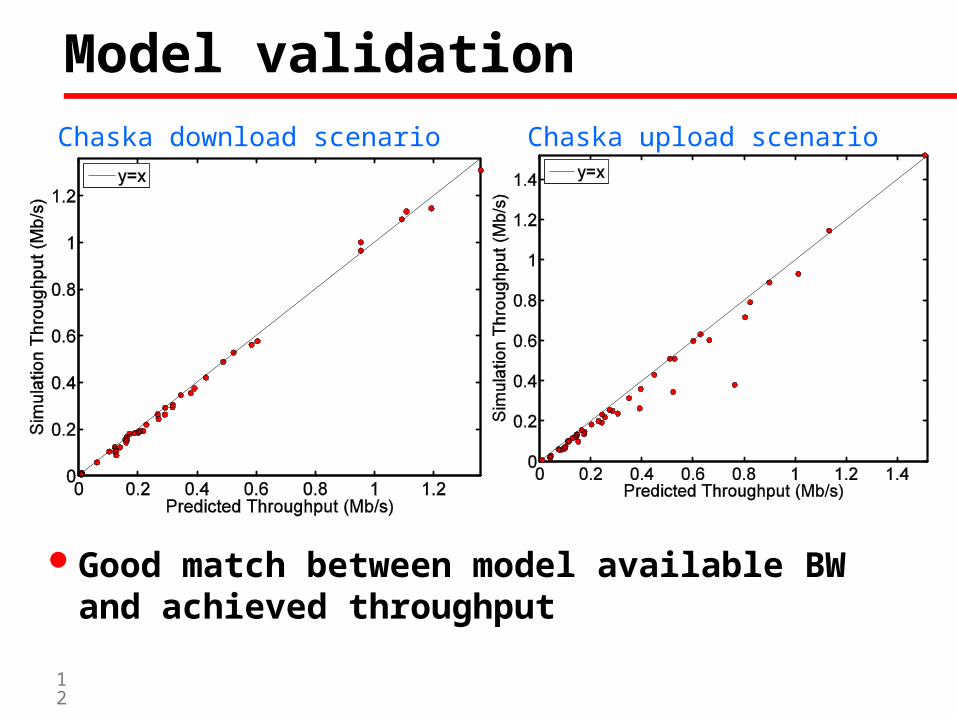
Model validation
Chaska download scenario Chaska upload scenario
Good match between model available BW and achieved throughput
13
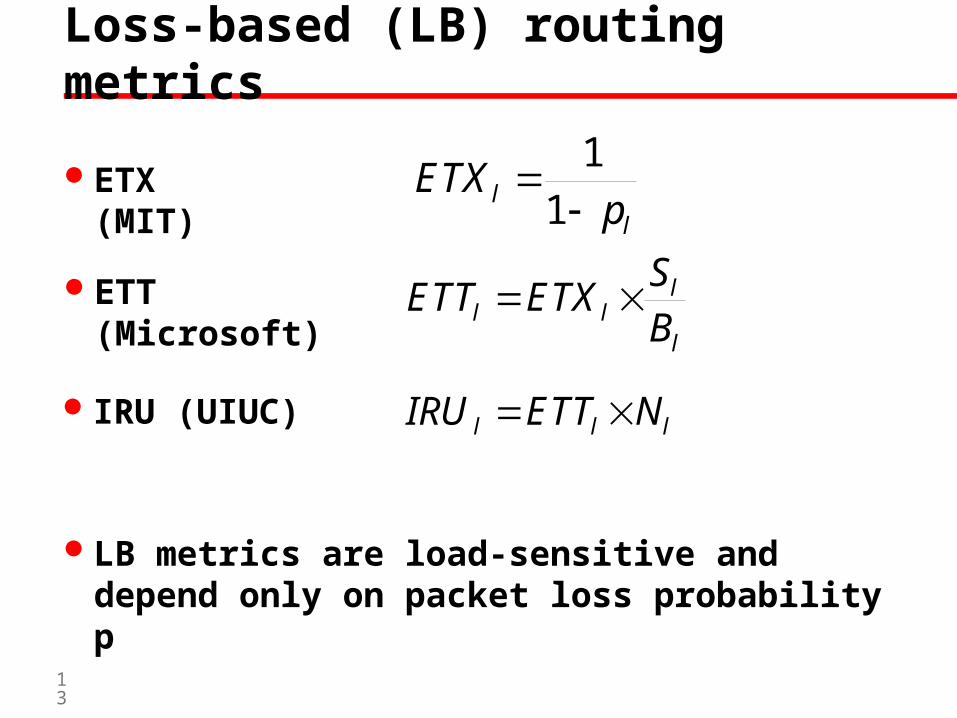
Loss-based (LB) routing metrics
ETX (MIT)
ETT (Microsoft)
IRU (UIUC)
LB metrics are load-sensitive and depend only on packet loss probability p
ll p
ETX
1
1
l
lll B
SETXETT
lll NETTIRU
14
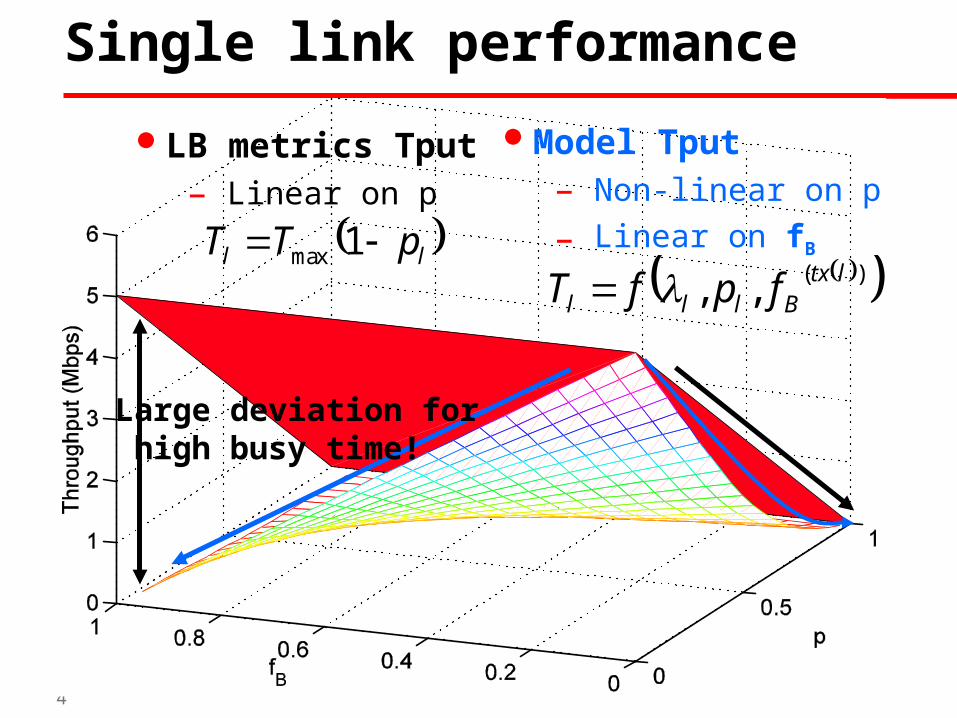
Single link performance
Large deviation for high busy time!
LB metrics Tput– Linear on p
ll pTT 1max
Model Tput– Non-linear on p
– Linear on fB
)(,, ltxBlll fpfT

15
LB metrics can pick suboptimal pathsAG1 B
C
G2?
Load C->G1
Achievable G1
Achievable unused G2
LB metrics Tput loss
16
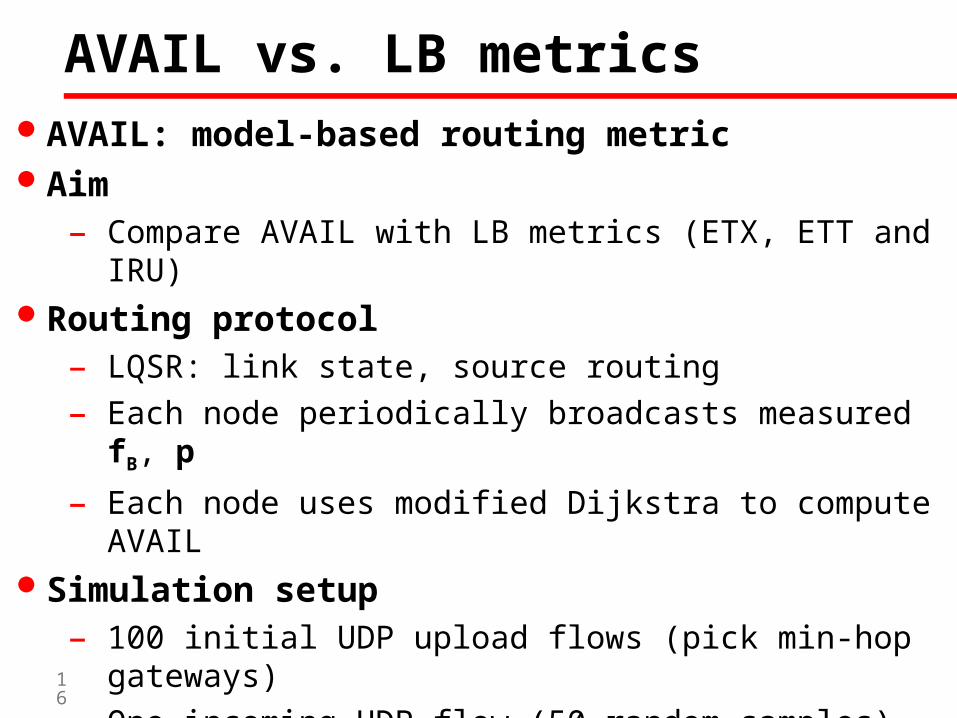
AVAIL vs. LB metricsAVAIL: model-based routing metricAim
– Compare AVAIL with LB metrics (ETX, ETT and IRU)Routing protocol
– LQSR: link state, source routing
– Each node periodically broadcasts measured fB, p
– Each node uses modified Dijkstra to compute AVAILSimulation setup
– 100 initial UDP upload flows (pick min-hop gateways)
– One incoming UDP flow (50 random samples)Rate limiting
– For all metrics, incoming flow rate-limited based on model
17
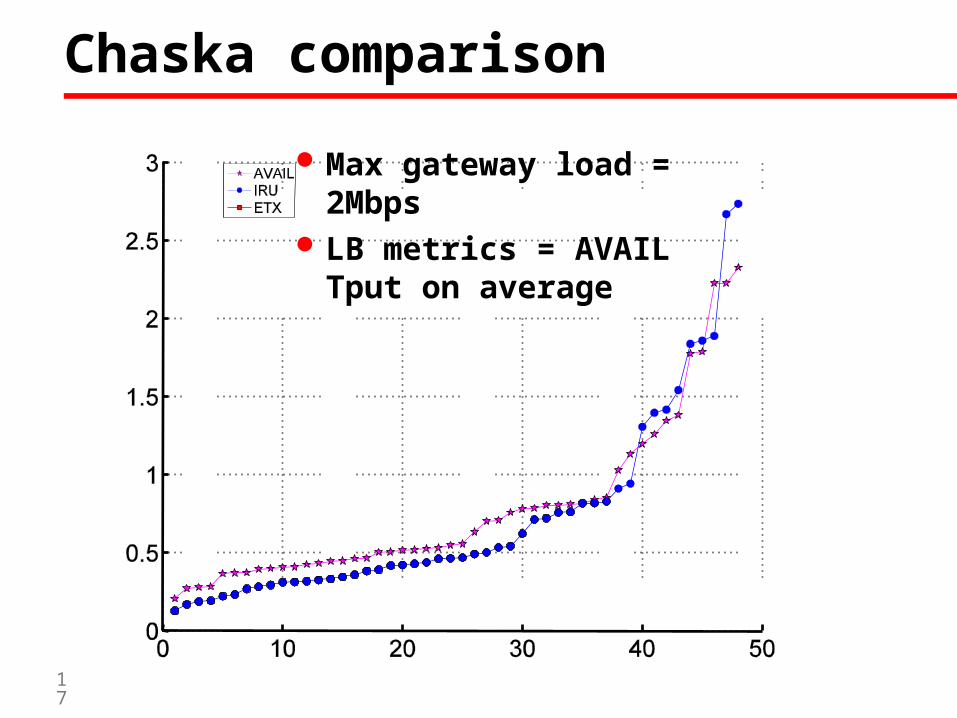
Chaska comparison
Max gateway load = 2Mbps LB metrics = AVAIL Tput on
average
18
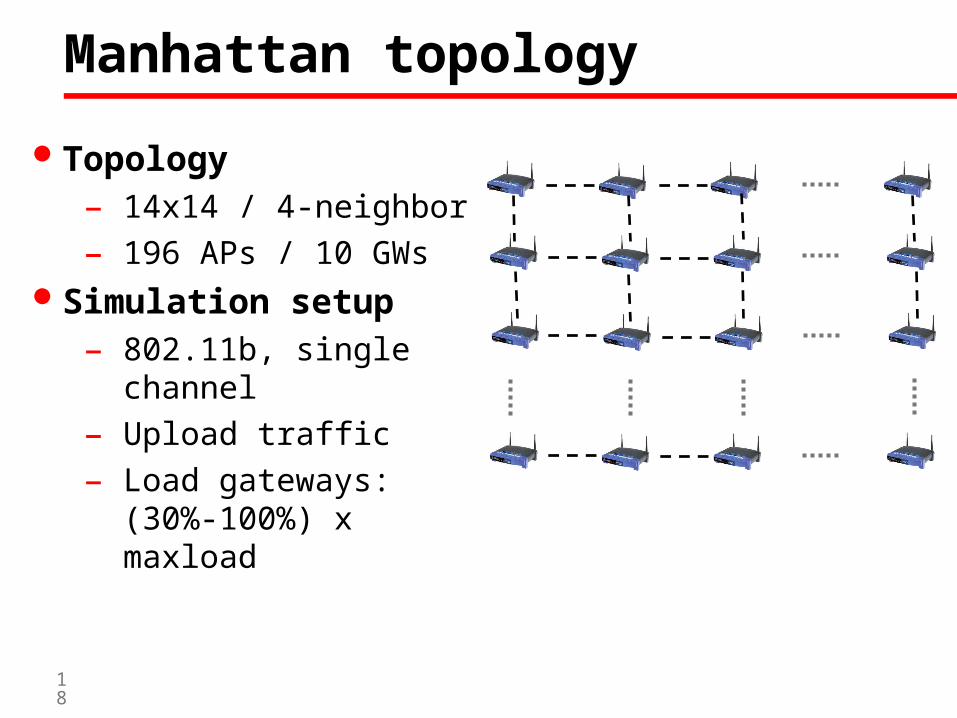
Manhattan topology
Topology– 14x14 / 4-neighbor
– 196 APs / 10 GWs Simulation setup
– 802.11b, single channel
– Upload traffic
– Load gateways: (30%-100%) x maxload
19
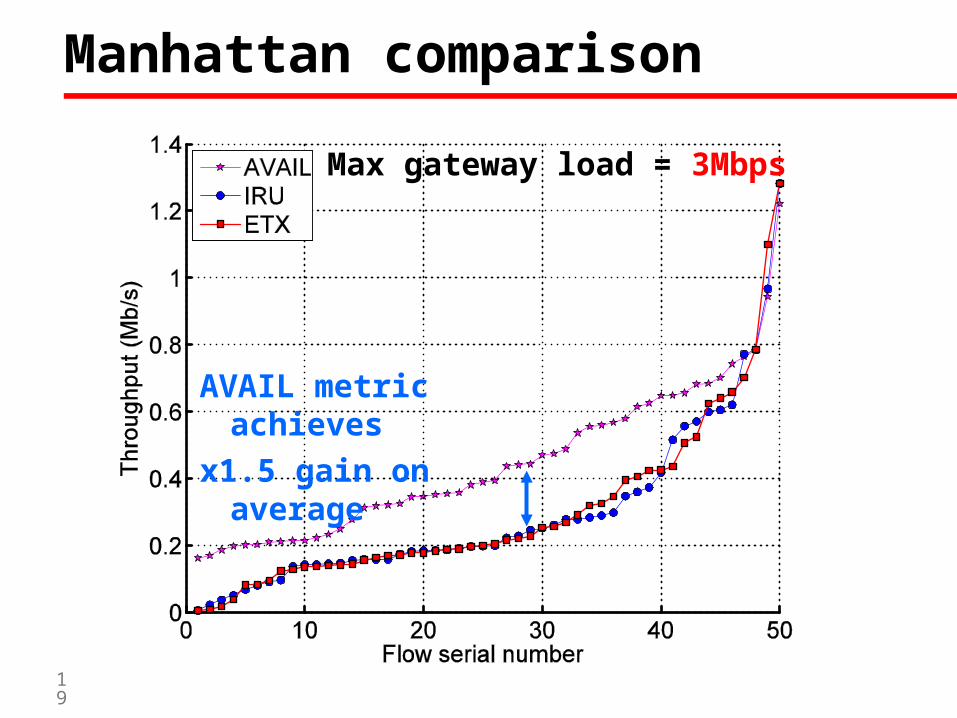
Manhattan comparison
Max gateway load = 3Mbps
AVAIL metric achieves
x1.5 gain on average
20
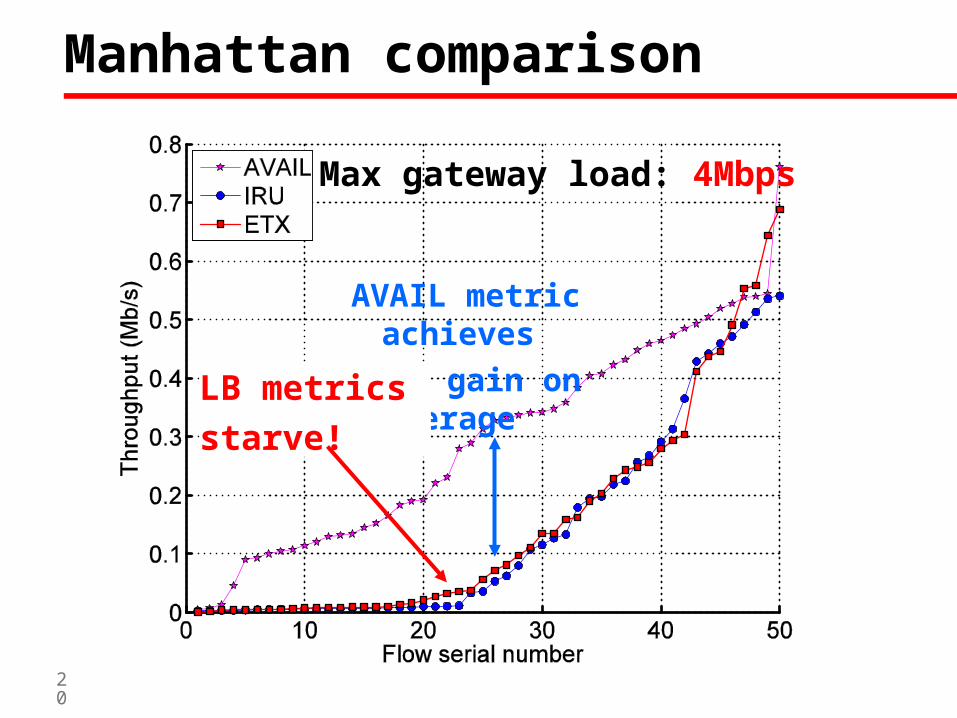
Manhattan comparison
Max gateway load: 4Mbps
AVAIL metric achieves
x2.4 gain on average
LB metrics
starve!
21
Analytical model accurately predicts available bandwidth
Busy time crucial for high throughput routing
LB metrics can pick suboptimal/starving paths
Topologies that allow spatial reuse and longer paths yield highest gains
Conclusions