Embed Size (px)
Citation preview
129129
4chapter
This chapter examines why some episodes of financial stress lead to economic downturns and others have only a limited impact on the overall economy. The analysis indicates that episodes of financial turmoil characterized by banking sector distress are more likely to be associated with severe and protracted downturns than episodes of stress centered mainly in securities or foreign exchange markets. Countries with more arm’s-length financial systems seem particularly vulnerable to sharp contractions in economic activity, because of the greater procyclicality of leverage in their banking systems. This chapter draws implications for economic prospects in the United States and the euro area and considers how policy responses could help limit the output consequences of the current and future finan-cial crises.
The financial turmoil that began in the summer of 2007 has mutated into a full-blown crisis, encompassing broader securities markets and the banking
systems of several advanced economies. How will macroeconomic activity be affected, and what can policymakers do both to reduce the eco-nomic consequences of this crisis and to forestall such crises in the future? Although past episodes of stress in banking, securities, and/or foreign exchange markets have only sometimes been associated with economic downturns (Figure 4.1, top panel), these downturns have tended to be more severe (Figure 4.1, bottom panel).
An important concept in assessing the impact of financial stress on economic activity is the role of financial cycles, which have been a con-stant feature of the economic landscape despite the evolution of financial systems through inno-
vation and regulatory changes. Financial systems are inherently procyclical, with growth in credit, leverage, and asset prices often reinforcing the underlying economic dynamic—and in some cases leading to a buildup of financial imbal-ances followed by a sharp correction (see Borio, 2007; Goodhart, 1996; and Minsky, 1992).
The impact of financial cycles on the real economy remains subject to debate in both academic and policy circles. One strand of research emphasizes the role of the financial accelerator in amplifying the effects of financial cycles on the real economy through its effect on the value of collateral and thereby on the willingness of the financial system to provide credit to the economy (Bernanke and Gertler, 1995; Bernanke, Gertler, and Gilchrist, 1999; and Kiyotaki and Moore, 1997). In this view, shocks that affect the creditworthiness of bor-rowers tend to accentuate swings in output. Another branch of inquiry focuses on lenders’ balance sheets and the relationship between bank capital and aggregate credit, the so-called bank capital channel (Bernanke, Lown, and Friedman, 1991; Kashyap and Stein, 1995; Peek and Rosengren, 1995; and Altunbas, Gamba-corta, and Marqués, 2007). When bank capital is eroded, banks become more reluctant to lend and may be forced to deleverage, lead-ing to sharper economic downturns. Another area of analysis is the extent to which the role of the financial accelerator in the economy varies with the type of financial system (World Economic Outlook, September 2006; and Rajan and Zingales, 2003). The general trend toward greater reliance on arm’s-length financing and less reliance on relationship-based lending may have left economies better able to absorb finan-cial stress, as both households and firms can now substitute away from banks to markets (and thus benefit from the so-called twin engines of the financial system).
Financial StreSS and economic downturnS
The main authors of this chapter are Subir Lall, Roberto Cardarelli, and Selim Elekdag, with support from Angela Espiritu and Gavin Asdorian. Hyun Song Shin provided consultancy support. Jörg Decressin and Tim Lane were chapter supervisors.

chapter 4 Financial StreSS and economic downturnS
130
Against this background, this chapter addresses the following questions: Why are some periods of financial stress associated with slow-downs, or even recessions, while others appear to have little impact on the real economy? What role is played by the size or location of finan-cial imbalances or the state of households’ and firms’ balance sheets? Has financial innovation reduced the role of banks in propagating shocks from the financial system to the real economy?
To answer these questions, this chapter ana-lyzes episodes of financial stress and economic cycles in 17 advanced economies during the past three decades.1 It draws lessons from these episodes by differentiating among them on the basis of the conditions in place at the start of the financial stress episode, including the state of households’ and firms’ balance sheets and the dynamics of credit and asset prices in the run-up to the stress episode; the type of finan-cial stress involved (that is, whether related to banks, securities markets, or foreign exchange markets); and the policy responses. Taken together, these factors provide a comprehen-sive window on the channels and mechanisms through which financial stress affects economic cycles.2 While establishing the causality between financial stress and economic downturns poses an inherently difficult challenge, the analysis in the chapter makes an attempt to address this issue by explicitly accounting for the effects of the most common types of shocks studied in the macroeconomic literature.
The key findings of this chapter are the following:
1The countries included in this study are Australia, Aus-tria, Belgium, Canada, Denmark, Finland, France, Ger-many, Italy, Japan, Netherlands, Norway, Spain, Sweden, Switzerland, United Kingdom, and United States.
2This broader approach complements recent research on the empirical relationship between asset prices—such as equity and house prices and bond spreads—and the dynamics of output during the course of the business cycle (see Cihák and Koeva Brooks, forthcoming; and Claessens, Kose, and Terrones, 2008) or between bank capital, lending, and output (see Bayoumi and Melander, 2008; and Kashyap, Rajan, and Stein, 2008, in the context of the United States).
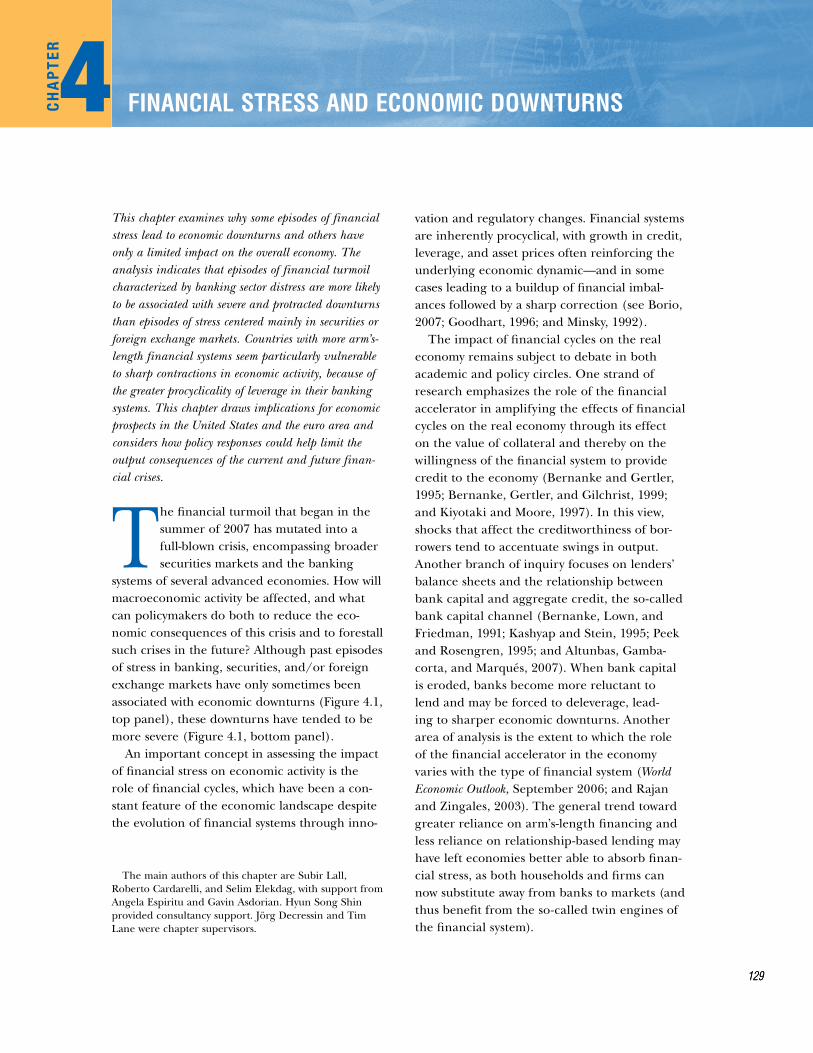
Sources: Haver Analytics; OECD, Analytic Database; OECD, Economic Outlook (2008); and IMF staff calculations. Measured as the cumulative output loss when output was below the Hodrick-Prescott trend for slowdowns and cumulative output loss until recovery for recessions.
Figure 4.1. Financial Stress and Output Loss
Only about half the episodes of financial stress identified in Chapter 4 for advanced economies over the past three decades were followed by economic downturns. Slowdowns and recessions preceded by financial stress tend to be longer and more severe.
-5
-4
-3
-2
-1
0
Preceded by financial
stress
Not preceded
by financial stress
Preceded by financial
stress
Not preceded
by financial stress
Slowdowns Recessions
Cumulative Output Loss during Slowdowns and Recessions(median; percent of GDP)
0
20
40
60
80
100
1201980s1990s2000s
All Followed by slowdowns
Followed by recessions
Other
Number of Financial Stress Episodes
1
1
131
• Episodes of financial turmoil characterized by banking distress are more often associated with severe and protracted downturns than episodes of stress centered mainly in securities or foreign exchange markets.
• The likelihood that financial stress will be followed by a downturn appears to be associ-ated with the extent to which house prices and aggregate credit rise in the period before the financial stress. Moreover, greater reli-ance on external financing by households and nonfinancial firms is associated with sharper downturns in the aftermath of financial stress.
• Countries with more-arm’s-length financial systems appear to be vulnerable to sharper contractions in economic activity in the wake of banking stress, because leverage in the banking system appears to be more procy-clical in countries characterized by greater financial innovation.
• The importance of core financial intermedi-aries in transmitting financial shocks to the real economy suggests that policies that help restore the capital base of these institutions within a strong framework of financial stability can help alleviate downturns.
• The patterns of asset prices and aggregate credit in the United States during the current episode of financial stress appear similar to those of previous episodes that were fol-lowed by recessions. In particular, changes in the pattern of household net borrowing—a measure of reliance on external financing—closely track the trajectory of past recessions. Nonfinancial firms entered the turmoil from a relatively strong position. Combined with the large losses sustained by core banking institutions, these factors suggest that the United States continues to face considerable recession risks, even though real interest rates are low by the standards of financial-stress-driven recessions. In the euro area, house-holds’ relatively strong balance sheets offer some protection against a sharp downturn, despite the sizable increases of asset prices and credit ratios preceding the financial turmoil.
The rest of the chapter is structured as fol-lows. The next section elaborates the concept of financial stress that is employed in this chapter, and uses this concept to identify episodes of financial turmoil during the past three decades. The chapter then analyzes the behavior of economic cycles following these financial stress episodes. The section that follows discusses the factors that differentiate episodes that were associated with economic downturns from those that were not. Following the macro-level analy-sis is a micro analysis, using bank-level data, of the procyclicality of investment banks’ and com-mercial banks’ leverage in both arm’s-length and relationship-based financial systems. The chapter then focuses on six of the most well-known episodes of banking-related financial stress and places the current financial turmoil in historical context. The concluding section outlines some implications for policy.
identifying episodes of Financial StressFinancial systems—both financial institu-
tions and the channels of intermediation—have historically been prone to periods of rapid expansion followed by corrections.3 To better understand the impact of financial cycles on the economy, it is useful to look for previous episodes of financial stress that share common features with the current one.
The current episode began in early 2007 as a generally orderly repricing of risk for assets linked to U.S. subprime mortgages. By the summer, it had rapidly escalated into a severe liquidity squeeze in the banking systems in the United States and western Europe and was caus-ing serious dislocations in the interbank fund-
3See Kindleberger and Aliber (2005) for a history of financial crises. A well-known exposition of this procy-clical feature of financial systems is Minsky’s financial instability hypothesis (Minsky, 1992), which posits that financial markets encourage businesses and individuals to take on too much risk, generating ruinous boom-and-bust cycles.
identiFying epiSodeS oF Financial StreSS
chapter 4 Financial StreSS and economic downturnS
132
ing market.4 The crisis mutated again more recently, as heavy credit losses raised questions about the capital strength of many banks. More-over, the stress has spread across various market segments in emerging as well as advanced economies, with these segments marked by a loss of liquidity, falling valuations, rising risk aversion, and heightened volatility. Foreign exchange markets have also been affected by heightened uncertainty about the safety and soundness of global financial assets and the impact of financial stress on economic perfor-mance. Given these key features of the current financial market turmoil, any characterization of previous financial stress episodes should take into account conditions in the banking sector, the state of nonbank intermediation through equities and bonds, and the behavior of foreign exchange markets.
The academic literature on financial crises has relied largely on historical narratives of well-known systemic banking crises, when bank capital was eroded, lending was disrupted, and there was often the need for significant public intervention (see, for example, Caprio and Klingebiel, 2003). An extension of this approach is to augment the narratives about banking crises with narratives of currency crises, when reserves were depleted and/or there was a significant change in the exchange rate mechanisms (see, for example, Kaminsky and Reinhart, 1999; and Reinhart and Rogoff, 2008). Pure securities market stress episodes have not been examined as comprehensively, especially those involving multiple countries,
4For a detailed analysis of the interbank funding mar-ket in the context of the current turmoil, see Chapters 1 and 2 of the October 2008 Global Financial Stability Report (IMF, 2008). The supply of liquid funds in the interbank market dried up because many banks were in need of such funds, and those with surplus funds refrained from lending, owing to concerns about the creditworthiness of their counterparts. This affected both commercial banks, which rely largely on retail deposits to fund their lending activities, and investment banks and broker-dealers, which rely more on wholesale funding markets. Universal banks, which combine features of both commercial and invest-ment banks, faced similar constraints.
although studies for single countries are instruc-tive (Shiller, 1999).
Although such narrative approaches to identi-fying financial crises provide a rich database of episodes, they are less well suited to the pur-poses of this chapter for a number of reasons. First, these are the episodes known to have had large output consequences and/or to have required significant public intervention. Less attention has been given to “near misses”—epi-sodes of financial stress with little macroeco-nomic impact—which could serve as useful counterfactuals. Second, the episodes identified are typically of considerable length and involve stresses of varying intensity, making it diffi-cult to identify both when the financial stress peaked and whether there was any meaningful causal relationship to an economic downturn. Finally, even the most comprehensive databases focus on banking crises and currency crises and pay little attention to pure securities market stresses or liquidity squeezes, such as the U.S. stock market crash of 1987 and the collapse of U.S. hedge fund Long-Term Capital Manage-ment (LTCM) in 1998. With leverage in bank-ing systems linked to securitization, it would seem important to simultaneously analyze the banking and securities channels of intermedia-tion to determine the degree of interaction between the two.
To overcome these limitations, this chapter identifies episodes of financial stress as extreme values of a composite variable—the “Financial Stress Index” (FSI)—which is built using market-based indicators in real time and of high fre-quency.5 The FSI for each country is constructed as an average of the following indicators:• three banking-related variables: the “beta” of
banking sector stocks;6 the spread between
5A similar approach is used by Illing and Liu (2006).6The beta of banking stocks is a measure of the correla-
tion between the total returns to the banking sector stock index and the overall stock market index. A beta greater than 1—indicating that banking stocks move more than proportionately against the overall stock market—suggests that the banking sector is relatively risky. The FSI com-putes the betas as the coefficient on the rolling returns of
133
interbank rates and the yield on treasury bills—the so-called TED spread, which mea-sures the premium banks charge each other over treasury bill rates; and the slope of the yield curve;
• three securities-market-related variables: corporate bond spreads, stock market returns, and time-varying stock return volatility; and
• one foreign exchange variable: time-varying effective exchange rate volatility.7
The advantage of utilizing such an index is the ability to more precisely date by quarter the start, peak, and end of a financial stress episode and thereby to calculate its duration. Moreover, such an index facilitates the identi-fication of four fundamental characteristics of financial stress events: large shifts in asset prices (stock and bond market returns); an abrupt increase in risk/uncertainty (stock and foreign exchange volatility); abrupt shifts in liquidity (TED spreads); and the health of the banking system (the beta of banking sector stocks and the yield curve, which affects the profitability of intermediating short-term liabilities into long-term assets). Looking at these subcomponents can help identify which types of financial stress episodes have been associated with larger output consequences: banking-related, securities-mar-ket-related, currency-related, or a combination of these.
This chapter uses financial market (asset-price-based) variables to identify periods when the financial sector is under strain and its ability to intermediate may be impaired. This strategy has three major advantages over using a quantity-based index (an approach that the corporate finance literature might suggest).
each country’s banking sector subindex regressed on the returns of the country’s overall stock market index. The FSI considers the beta only during periods when returns are negative to focus on adverse shocks to banks. Accord-ingly, in high-stress episodes, this indicator would reflect an unusually large drop in banking stock prices relative to overall market prices.
7All variables are weighted by the inverse of their vari-ance in order to reduce the impact on the overall index of the more volatile variables. See Appendix 4.1 on the construction of the index.
First, asset-price-based variables are easy to monitor and compute on a comparable basis across a large set of countries. Second, move-ments in broader financial asset prices can be expected to have a greater impact on the ability of financial firms to supply intermediation services than on the ability of specific nonfi-nancial firms to fund new investment, which is much more closely tied to developments in their particular sector. Third, it is useful to initially consider a broad range of financial stress events using asset prices and then use quantity-based variables to identify which of those financial stress episodes are associated with a significant economic downturn. The underlying hypothesis is that only a subset of the universe of asset-price-based stress episodes reflects true underly-ing distress in the balance sheets of financial intermediaries that have an impact on overall economic activity by restricting the supply of credit; others merely reflect normal market corrections.
Using the seven variables described above, the FSI is constructed for each of the 17 coun-tries in the sample. Episodes of financial stress are identified as those periods when the index for a country is more than one standard deviation above its trend (identified using the Hodrick-Prescott filter), which signals that one or more of the banking, securities, and/or foreign exchange market variables shifted abruptly.
Overall, 113 financial stress episodes during the past 30 years were identified in the 17 coun-tries considered in this chapter (Table 4.1). Of these, 43 episodes were driven mainly by stress in the banking sector (that is, the banking vari-ables accounted for most of the FSI increase), 50 episodes reflected primarily turmoil in the securities market, and 20 episodes reflected primarily turmoil in the foreign exchange market. In some cases, stresses in one segment of the financial system eventually migrated into the other segments. For example, in 17 of the 70 episodes that reflected stress primarily in the securities or foreign exchange markets, the banking variables accounted for at least one-
identiFying epiSodeS oF Financial StreSS
chapter 4 Financial StreSS and economic downturnS
134
third of the spike in the FSI. This implies that there are actually 60 episodes in the sample with banking-related financial stress—episodes for which banks were either the most or the second most important factor, contributing at least one-third of the FSI spike.
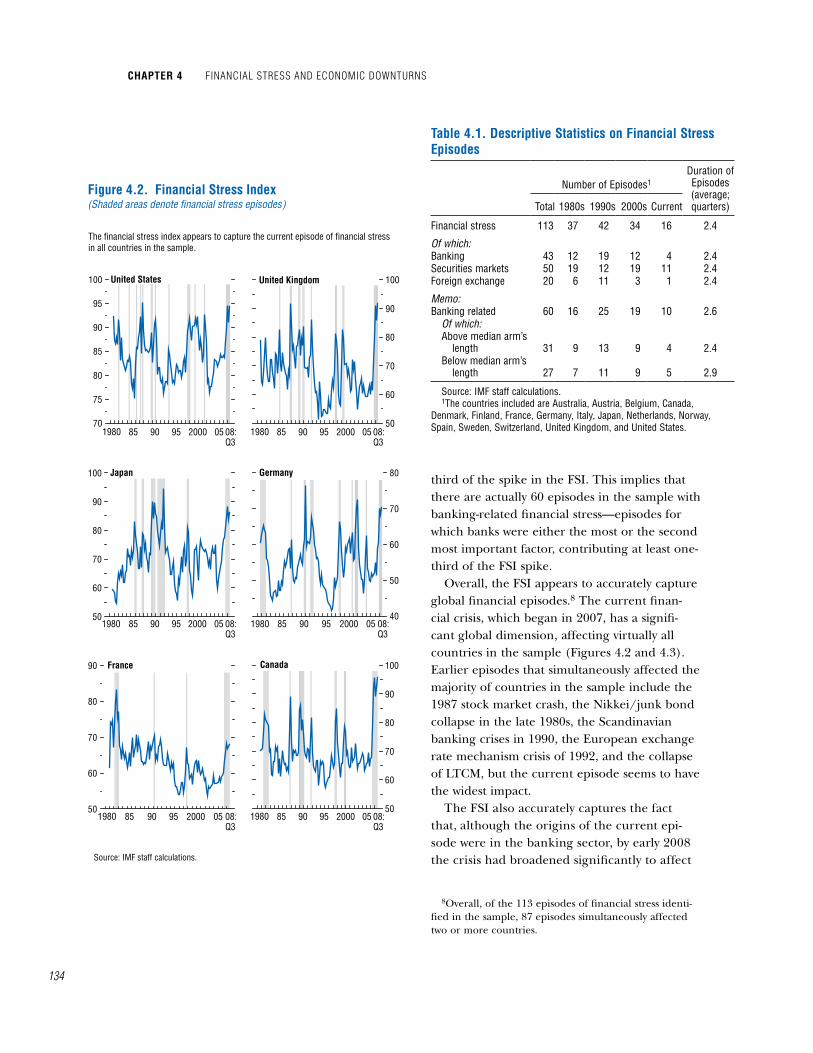
Overall, the FSI appears to accurately capture global financial episodes.8 The current finan-cial crisis, which began in 2007, has a signifi-cant global dimension, affecting virtually all countries in the sample (Figures 4.2 and 4.3). Earlier episodes that simultaneously affected the majority of countries in the sample include the 1987 stock market crash, the Nikkei/junk bond collapse in the late 1980s, the Scandinavian banking crises in 1990, the European exchange rate mechanism crisis of 1992, and the collapse of LTCM, but the current episode seems to have the widest impact.
The FSI also accurately captures the fact that, although the origins of the current epi-sode were in the banking sector, by early 2008 the crisis had broadened significantly to affect
8Overall, of the 113 episodes of financial stress identi-fied in the sample, 87 episodes simultaneously affected two or more countries.
40
50
60
70
80
50
60
70
80
90
100
Source: IMF staff calculations.
Japan
Figure 4.2. Financial Stress Index(Shaded areas denote financial stress episodes)
The financial stress index appears to capture the current episode of financial stress in all countries in the sample.
Germany
70
75
80
85
90
95
100 United States
1980 85 90 95 2000 05 08:Q3
50
60
70
80
90
100United Kingdom
1980 85 90 95 2000 05 08:Q3
1980 85 90 95 2000 05 08:Q3
1980 85 90 95 2000 05 08:Q3
50
60
70
80
90 France
1980 85 90 95 2000 05 08:Q3
50
60
70
80
90
100Canada
1980 85 90 95 2000 05 08:Q3
table 4.1. descriptive Statistics on Financial Stress episodes
Duration of Episodes(average; quarters)
Number of Episodes1
Total 1980s 1990s 2000s Current
Financial stress 113 37 42 34 16 2.4
Of which:Banking 43 12 19 12 4 2.4Securities markets 50 19 12 19 11 2.4Foreign exchange 20 6 11 3 1 2.4
Memo:Banking related 60 16 25 19 10 2.6
Of which:Above median arm’s
length 31 9 13 9 4 2.4Below median arm’s
length 27 7 11 9 5 2.9
Source: IMF staff calculations.1The countries included are Australia, Austria, Belgium, Canada,
Denmark, Finland, France, Germany, Italy, Japan, Netherlands, Norway, Spain, Sweden, Switzerland, United Kingdom, and United States.
135
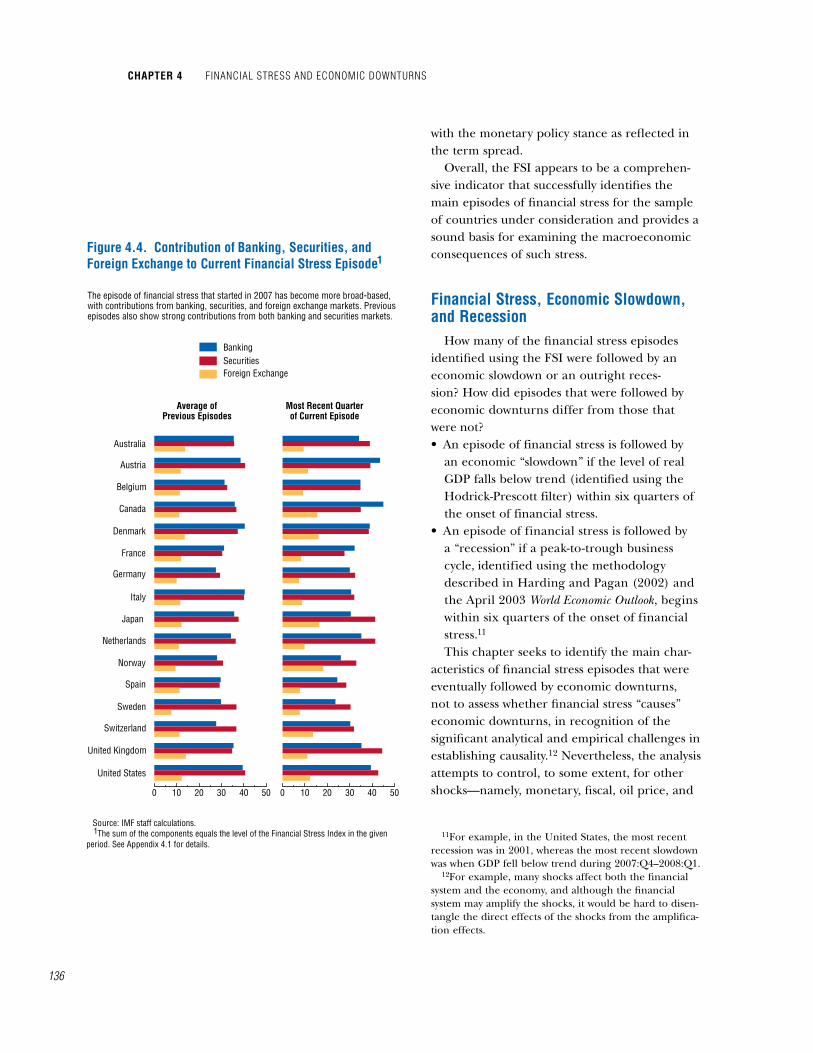
the securities and foreign exchange markets as well (Figure 4.4). Moreover, the index indi-cates that all past episodes of banking-related stress also had significant securities market components.
The country-specific FSIs for the 17 countries considered in this chapter show that the FSI peaks, which correspond to periods of financial stress, generally overlap accurately with well-known financial stress episodes in these coun-tries over the past three decades, including the current episode (see Figure 4.2). Specifically, the FSI captures over 90 percent of the banking crises and over 80 percent of the currency crises identified in the literature.9
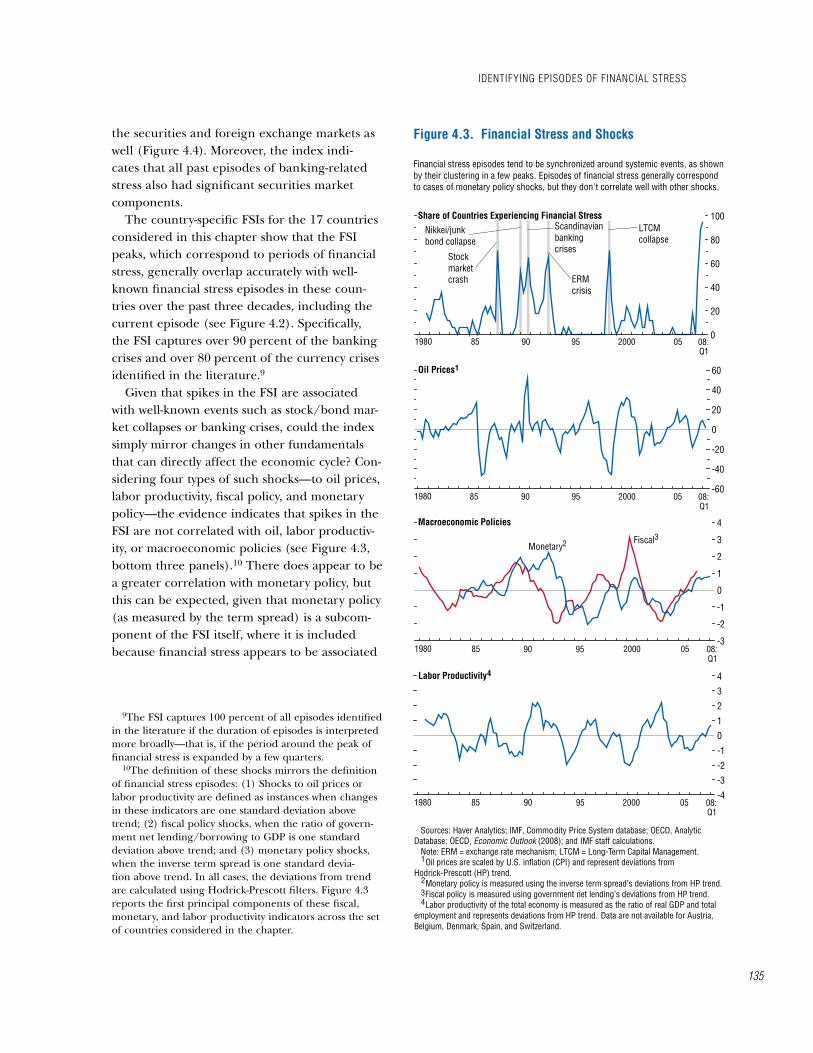
Given that spikes in the FSI are associated with well-known events such as stock/bond mar-ket collapses or banking crises, could the index simply mirror changes in other fundamentals that can directly affect the economic cycle? Con-sidering four types of such shocks—to oil prices, labor productivity, fiscal policy, and monetary policy—the evidence indicates that spikes in the FSI are not correlated with oil, labor productiv-ity, or macroeconomic policies (see Figure 4.3, bottom three panels).10 There does appear to be a greater correlation with monetary policy, but this can be expected, given that monetary policy (as measured by the term spread) is a subcom-ponent of the FSI itself, where it is included because financial stress appears to be associated
9The FSI captures 100 percent of all episodes identified in the literature if the duration of episodes is interpreted more broadly—that is, if the period around the peak of financial stress is expanded by a few quarters.
10The definition of these shocks mirrors the definition of financial stress episodes: (1) Shocks to oil prices or labor productivity are defined as instances when changes in these indicators are one standard deviation above trend; (2) fiscal policy shocks, when the ratio of govern-ment net lending/borrowing to GDP is one standard deviation above trend; and (3) monetary policy shocks, when the inverse term spread is one standard devia-tion above trend. In all cases, the deviations from trend are calculated using Hodrick-Prescott filters. Figure 4.3 reports the first principal components of these fiscal, monetary, and labor productivity indicators across the set of countries considered in the chapter.
0
20
40
60
80
100Share of Countries Experiencing Financial Stress
1980 85 90 95 2000 05 08:Q1
LTCM collapse
Stock market crash
Nikkei/junk bond collapse
ERM crisis
Scandinavian banking crises
Figure 4.3. Financial Stress and Shocks
Financial stress episodes tend to be synchronized around systemic events, as shown by their clustering in a few peaks. Episodes of financial stress generally correspond to cases of monetary policy shocks, but they don't correlate well with other shocks.
-60
-40
-20
0
20
40
60
1980 85 90 95 2000 05 08:Q1
Oil Prices1
-4
-3
-2
-1
0
1
2
3
4Labor Productivity
1980 85 90 95 2000 05 08:Q1
4
Sources: Haver Analytics; IMF, Commodity Price System database; OECD, Analytic Database; OECD, Economic Outlook (2008); and IMF staff calculations. Note: ERM = exchange rate mechanism; LTCM = Long-Term Capital Management. Oil prices are scaled by U.S. inflation (CPI) and represent deviations from Hodrick-Prescott (HP) trend. Monetary policy is measured using the inverse term spread’s deviations from HP trend. Fiscal policy is measured using government net lending’s deviations from HP trend. Labor productivity of the total economy is measured as the ratio of real GDP and total employment and represents deviations from HP trend. Data are not available for Austria, Belgium, Denmark, Spain, and Switzerland.
1
234
1980 85 90 95 2000 05 08:Q1
-3
-2
-1
0
1
2
3
4Macroeconomic Policies
2Monetary3Fiscal
identiFying epiSodeS oF Financial StreSS
chapter 4 Financial StreSS and economic downturnS
136
with the monetary policy stance as reflected in the term spread.
Overall, the FSI appears to be a comprehen-sive indicator that successfully identifies the main episodes of financial stress for the sample of countries under consideration and provides a sound basis for examining the macroeconomic consequences of such stress.
Financial Stress, economic Slowdown, and recession
How many of the financial stress episodes identified using the FSI were followed by an economic slowdown or an outright reces-sion? How did episodes that were followed by economic downturns differ from those that were not?• An episode of financial stress is followed by
an economic “slowdown” if the level of real GDP falls below trend (identified using the Hodrick-Prescott filter) within six quarters of the onset of financial stress.
• An episode of financial stress is followed by a “recession” if a peak-to-trough business cycle, identified using the methodology described in Harding and Pagan (2002) and the April 2003 World Economic Outlook, begins within six quarters of the onset of financial stress.11
This chapter seeks to identify the main char-acteristics of financial stress episodes that were eventually followed by economic downturns, not to assess whether financial stress “causes” economic downturns, in recognition of the significant analytical and empirical challenges in establishing causality.12 Nevertheless, the analysis attempts to control, to some extent, for other shocks—namely, monetary, fiscal, oil price, and
11For example, in the United States, the most recent recession was in 2001, whereas the most recent slowdown was when GDP fell below trend during 2007:Q4–2008:Q1.
12For example, many shocks affect both the financial system and the economy, and although the financial system may amplify the shocks, it would be hard to disen-tangle the direct effects of the shocks from the amplifica-tion effects.
0 10 20 30 40 50 0 10 20 30 40 50
Australia
Figure 4.4. Contribution of Banking, Securities, and Foreign Exchange to Current Financial Stress Episode
The episode of financial stress that started in 2007 has become more broad-based, with contributions from banking, securities, and foreign exchange markets. Previous episodes also show strong contributions from both banking and securities markets.
Austria
Belgium
Canada
Denmark
France
Germany
Italy
Japan
Netherlands
Norway
Spain
Sweden
Switzerland
United Kingdom
United States
BankingSecuritiesForeign Exchange
Most Recent Quarter of Current Episode
Average ofPrevious Episodes
Source: IMF staff calculations. The sum of the components equals the level of the Financial Stress Index in the given period. See Appendix 4.1 for details.
1
1
137
labor productivity shocks—that may affect the relationship between financial stress and eco-nomic cycles.
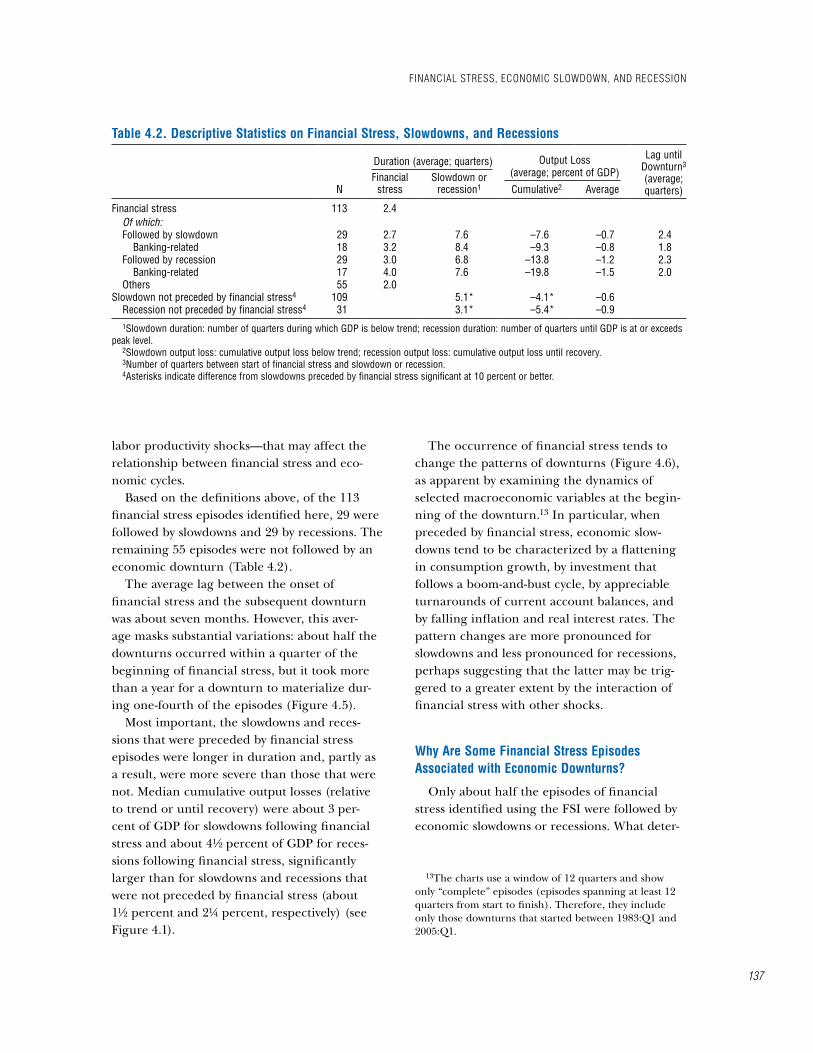
Based on the definitions above, of the 113 financial stress episodes identified here, 29 were followed by slowdowns and 29 by recessions. The remaining 55 episodes were not followed by an economic downturn (Table 4.2).
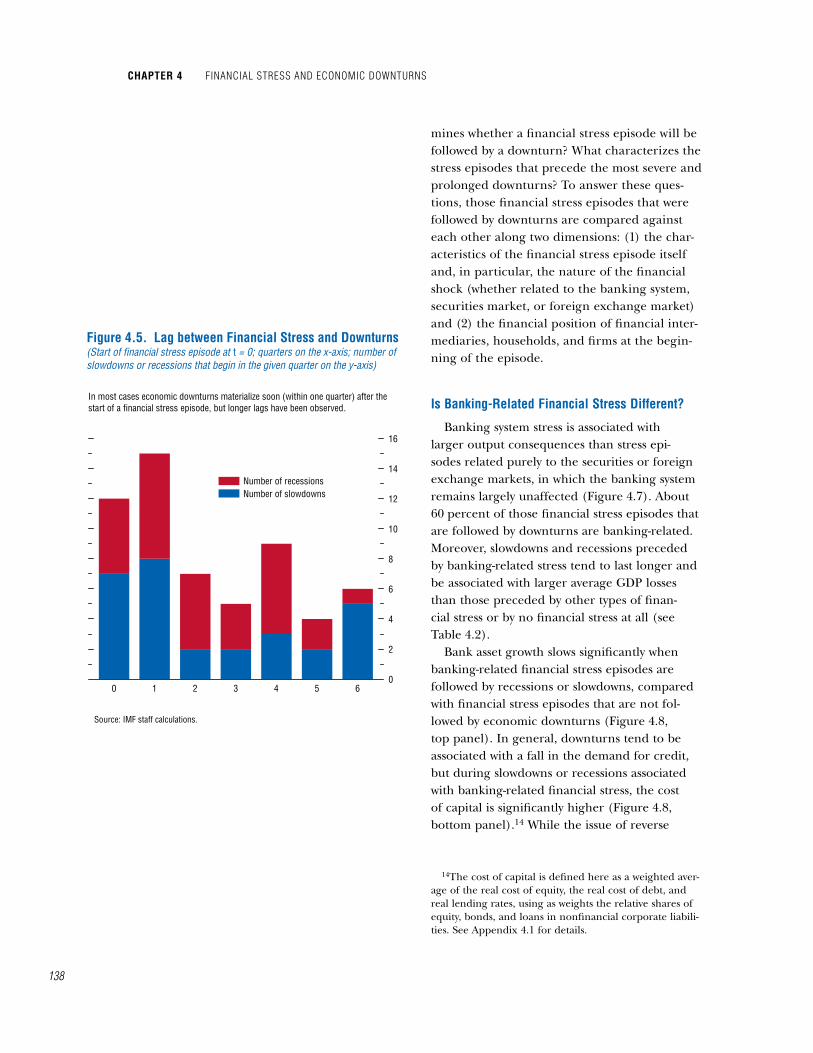
The average lag between the onset of financial stress and the subsequent downturn was about seven months. However, this aver-age masks substantial variations: about half the downturns occurred within a quarter of the beginning of financial stress, but it took more than a year for a downturn to materialize dur-ing one-fourth of the episodes (Figure 4.5).
Most important, the slowdowns and reces-sions that were preceded by financial stress episodes were longer in duration and, partly as a result, were more severe than those that were not. Median cumulative output losses (relative to trend or until recovery) were about 3 per-cent of GDP for slowdowns following financial stress and about 4½ percent of GDP for reces-sions following financial stress, significantly larger than for slowdowns and recessions that were not preceded by financial stress (about 1½ percent and 2¼ percent, respectively) (see Figure 4.1).
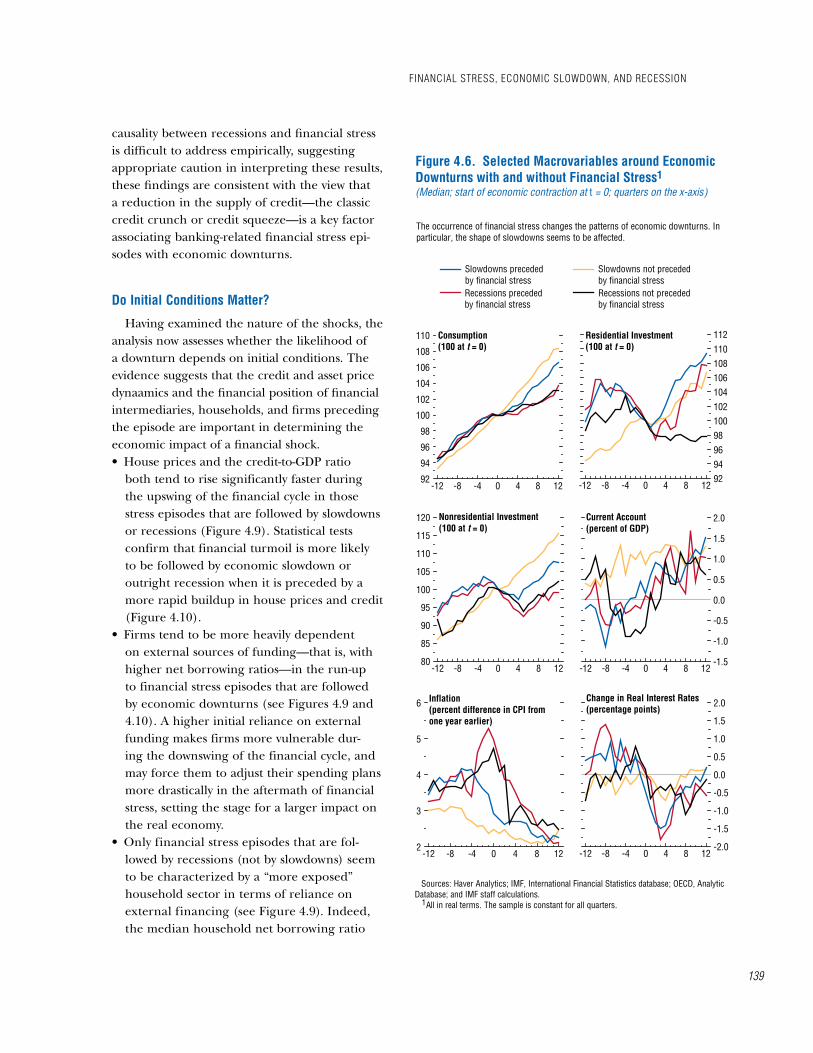
The occurrence of financial stress tends to change the patterns of downturns (Figure 4.6), as apparent by examining the dynamics of selected macroeconomic variables at the begin-ning of the downturn.13 In particular, when preceded by financial stress, economic slow-downs tend to be characterized by a flattening in consumption growth, by investment that follows a boom-and-bust cycle, by appreciable turnarounds of current account balances, and by falling inflation and real interest rates. The pattern changes are more pronounced for slowdowns and less pronounced for recessions, perhaps suggesting that the latter may be trig-gered to a greater extent by the interaction of financial stress with other shocks.
why are Some Financial Stress episodes associated with economic downturns?
Only about half the episodes of financial stress identified using the FSI were followed by economic slowdowns or recessions. What deter-
13The charts use a window of 12 quarters and show only “complete” episodes (episodes spanning at least 12 quarters from start to finish). Therefore, they include only those downturns that started between 1983:Q1 and 2005:Q1.
table 4.2. descriptive Statistics on Financial Stress, Slowdowns, and recessions
Duration (average; quarters) Output Loss Lag until Downturn3 (average; quarters)N
Financial stress
Slowdown or recession1
(average; percent of GDP)
Cumulative2 Average
Financial stress 113 2.4Of which:Followed by slowdown 29 2.7 7.6 –7.6 –0.7 2.4
Banking-related 18 3.2 8.4 –9.3 –0.8 1.8Followed by recession 29 3.0 6.8 –13.8 –1.2 2.3
Banking-related 17 4.0 7.6 –19.8 –1.5 2.0Others 55 2.0
Slowdown not preceded by financial stress4 109 5.1* –4.1* –0.6Recession not preceded by financial stress4 31 3.1* –5.4* –0.91Slowdown duration: number of quarters during which GDP is below trend; recession duration: number of quarters until GDP is at or exceeds
peak level.2Slowdown output loss: cumulative output loss below trend; recession output loss: cumulative output loss until recovery. 3Number of quarters between start of financial stress and slowdown or recession.4Asterisks indicate difference from slowdowns preceded by financial stress significant at 10 percent or better.
Financial StreSS, economic Slowdown, and receSSion
chapter 4 Financial StreSS and economic downturnS
138
mines whether a financial stress episode will be followed by a downturn? What characterizes the stress episodes that precede the most severe and prolonged downturns? To answer these ques-tions, those financial stress episodes that were followed by downturns are compared against each other along two dimensions: (1) the char-acteristics of the financial stress episode itself and, in particular, the nature of the financial shock (whether related to the banking system, securities market, or foreign exchange market) and (2) the financial position of financial inter-mediaries, households, and firms at the begin-ning of the episode.
is Banking-related Financial Stress different?
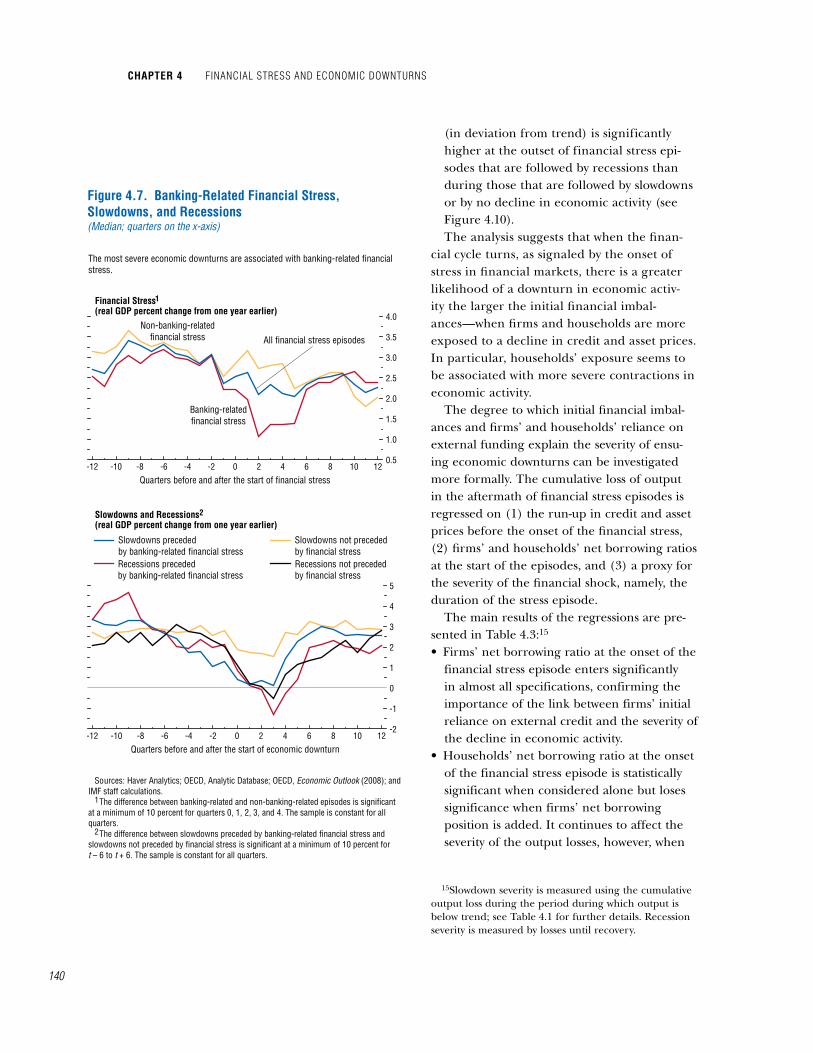
Banking system stress is associated with larger output consequences than stress epi-sodes related purely to the securities or foreign exchange markets, in which the banking system remains largely unaffected (Figure 4.7). About 60 percent of those financial stress episodes that are followed by downturns are banking-related. Moreover, slowdowns and recessions preceded by banking-related stress tend to last longer and be associated with larger average GDP losses than those preceded by other types of finan-cial stress or by no financial stress at all (see Table 4.2).
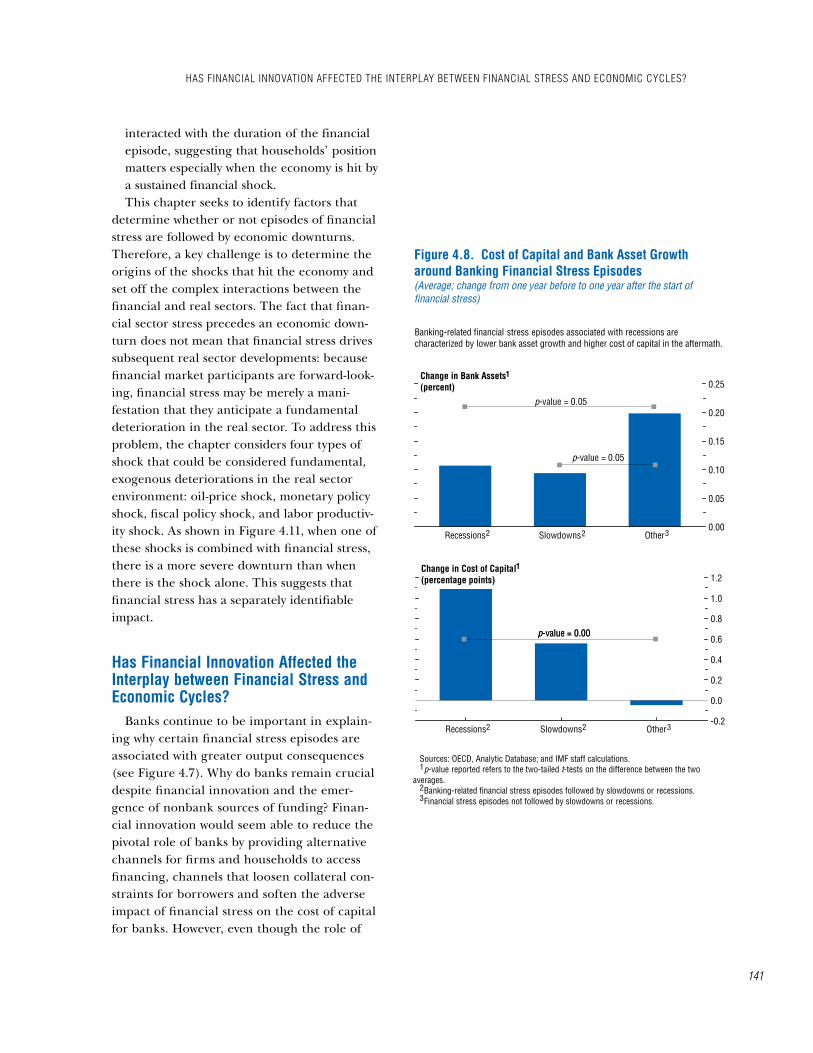
Bank asset growth slows significantly when banking-related financial stress episodes are followed by recessions or slowdowns, compared with financial stress episodes that are not fol-lowed by economic downturns (Figure 4.8, top panel). In general, downturns tend to be associated with a fall in the demand for credit, but during slowdowns or recessions associated with banking-related financial stress, the cost of capital is significantly higher (Figure 4.8, bottom panel).14 While the issue of reverse
14The cost of capital is defined here as a weighted aver-age of the real cost of equity, the real cost of debt, and real lending rates, using as weights the relative shares of equity, bonds, and loans in nonfinancial corporate liabili-ties. See Appendix 4.1 for details.
0 1 2 3 4 5 60
2
4
6
8
10
12
14
16
Figure 4.5. Lag between Financial Stress and Downturns(Start of financial stress episode at t = 0; quarters on the x-axis; number of slowdowns or recessions that begin in the given quarter on the y-axis)
In most cases economic downturns materialize soon (within one quarter) after the start of a financial stress episode, but longer lags have been observed.
Source: IMF staff calculations.
Number of slowdownsNumber of recessions
139
causality between recessions and financial stress is difficult to address empirically, suggesting appropriate caution in interpreting these results, these findings are consistent with the view that a reduction in the supply of credit—the classic credit crunch or credit squeeze—is a key factor associating banking-related financial stress epi-sodes with economic downturns.
do initial conditions matter?
Having examined the nature of the shocks, the analysis now assesses whether the likelihood of a downturn depends on initial conditions. The evidence suggests that the credit and asset price dynaamics and the financial position of financial intermediaries, households, and firms preceding the episode are important in determining the economic impact of a financial shock.• House prices and the credit-to-GDP ratio
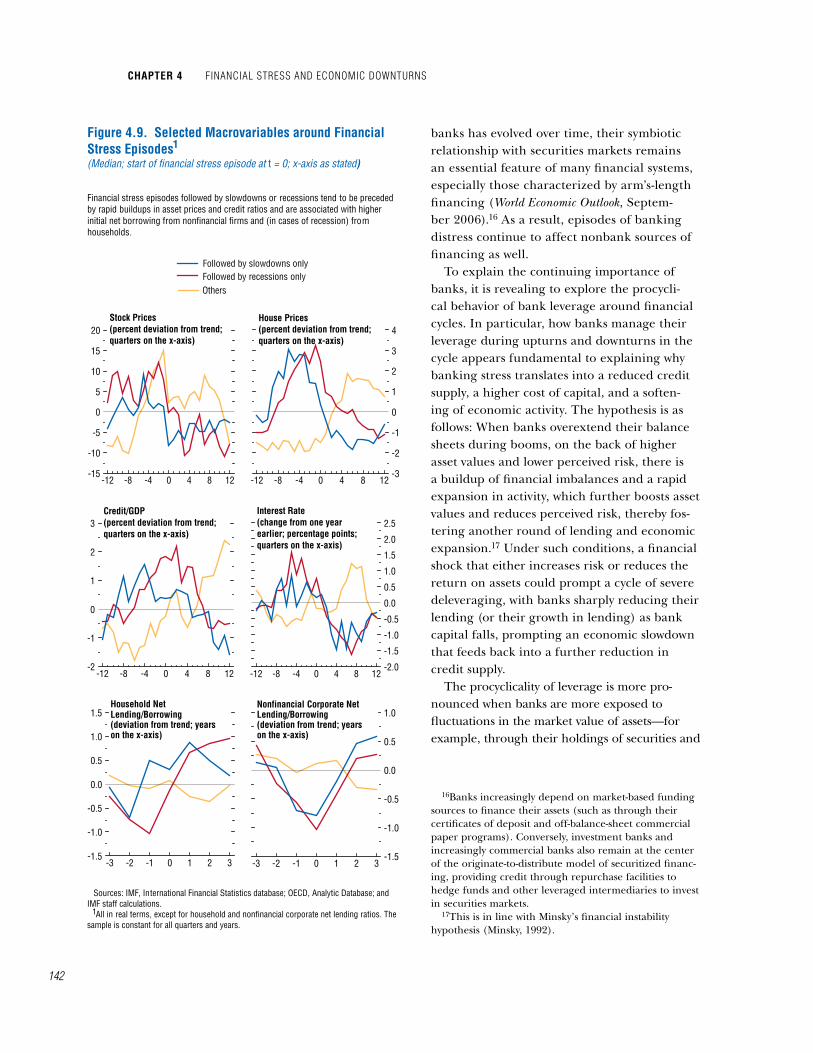
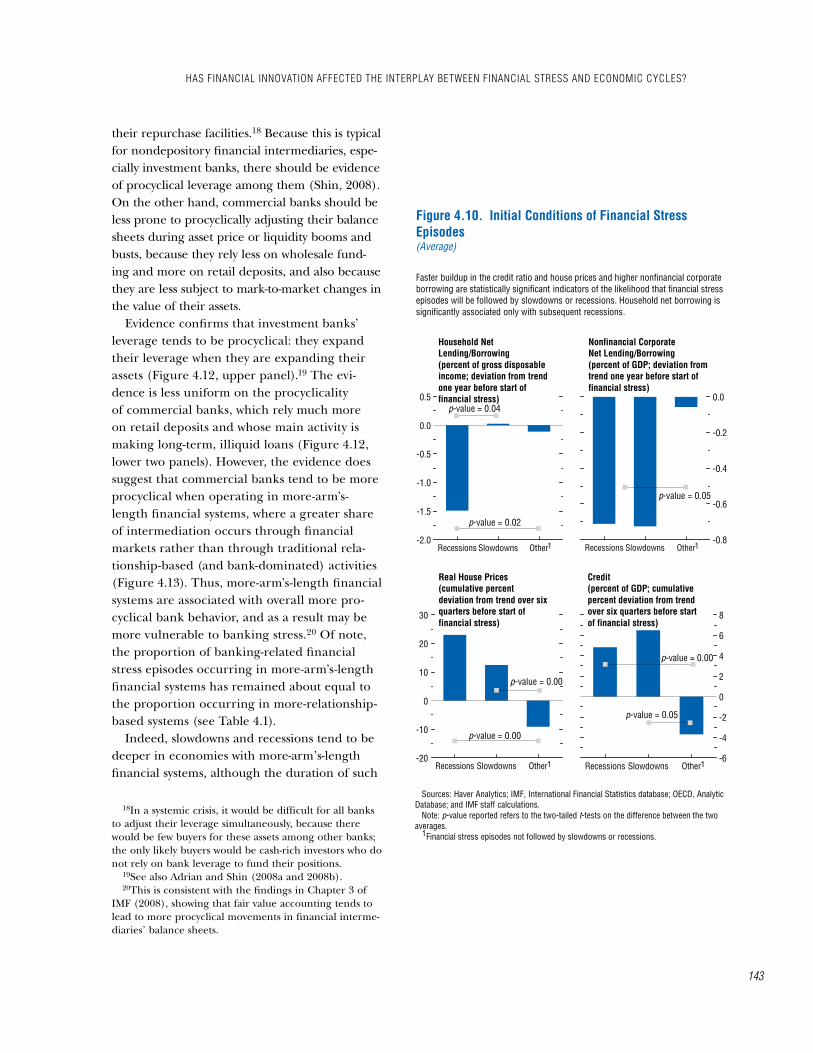
both tend to rise significantly faster during the upswing of the financial cycle in those stress episodes that are followed by slowdowns or recessions (Figure 4.9). Statistical tests confirm that financial turmoil is more likely to be followed by economic slowdown or outright recession when it is preceded by a more rapid buildup in house prices and credit (Figure 4.10).
• Firms tend to be more heavily dependent on external sources of funding—that is, with higher net borrowing ratios—in the run-up to financial stress episodes that are followed by economic downturns (see Figures 4.9 and 4.10). A higher initial reliance on external funding makes firms more vulnerable dur-ing the downswing of the financial cycle, and may force them to adjust their spending plans more drastically in the aftermath of financial stress, setting the stage for a larger impact on the real economy.
• Only financial stress episodes that are fol-lowed by recessions (not by slowdowns) seem to be characterized by a “more exposed” household sector in terms of reliance on external financing (see Figure 4.9). Indeed, the median household net borrowing ratio
-12 -8 -4 0 4 8 1292
94
96
98
100
102
104
106
108
110 Consumption(100 at t = 0)
-12 -8 -4 0 4 8 1292949698100102104106108110112Residential Investment
(100 at t = 0)
-12 -8 -4 0 4 8 1280
85
90
95
100
105
110
115
120 Nonresidential Investment(100 at t = 0)
-12 -8 -4 0 4 8 12-1.5
-1.0
-0.5
0.0
0.5
1.0
1.5
2.0Current Account(percent of GDP)
-12 -8 -4 0 4 8 122
3
4
5
6 Inflation(percent difference in CPI from one year earlier)
-12 -8 -4 0 4 8 12-2.0
-1.5
-1.0
-0.5
0.0
0.5
1.0
1.5
2.0Change in Real Interest Rates(percentage points)
Slowdowns precededby financial stressRecessions precededby financial stress
Figure 4.6. Selected Macrovariables around Economic Downturns with and without Financial Stress(Median; start of economic contraction at t = 0; quarters on the x-axis)
The occurrence of financial stress changes the patterns of economic downturns. In particular, the shape of slowdowns seems to be affected.
Sources: Haver Analytics; IMF, International Financial Statistics database; OECD, Analytic Database; and IMF staff calculations. All in real terms. The sample is constant for all quarters.
Slowdowns not precededby financial stressRecessions not precededby financial stress
1
1
Financial StreSS, economic Slowdown, and receSSion
chapter 4 Financial StreSS and economic downturnS
140
(in deviation from trend) is significantly higher at the outset of financial stress epi-sodes that are followed by recessions than during those that are followed by slowdowns or by no decline in economic activity (see Figure 4.10).The analysis suggests that when the finan-
cial cycle turns, as signaled by the onset of stress in financial markets, there is a greater likelihood of a downturn in economic activ-ity the larger the initial financial imbal-ances—when firms and households are more exposed to a decline in credit and asset prices. In particular, households’ exposure seems to be associated with more severe contractions in economic activity.
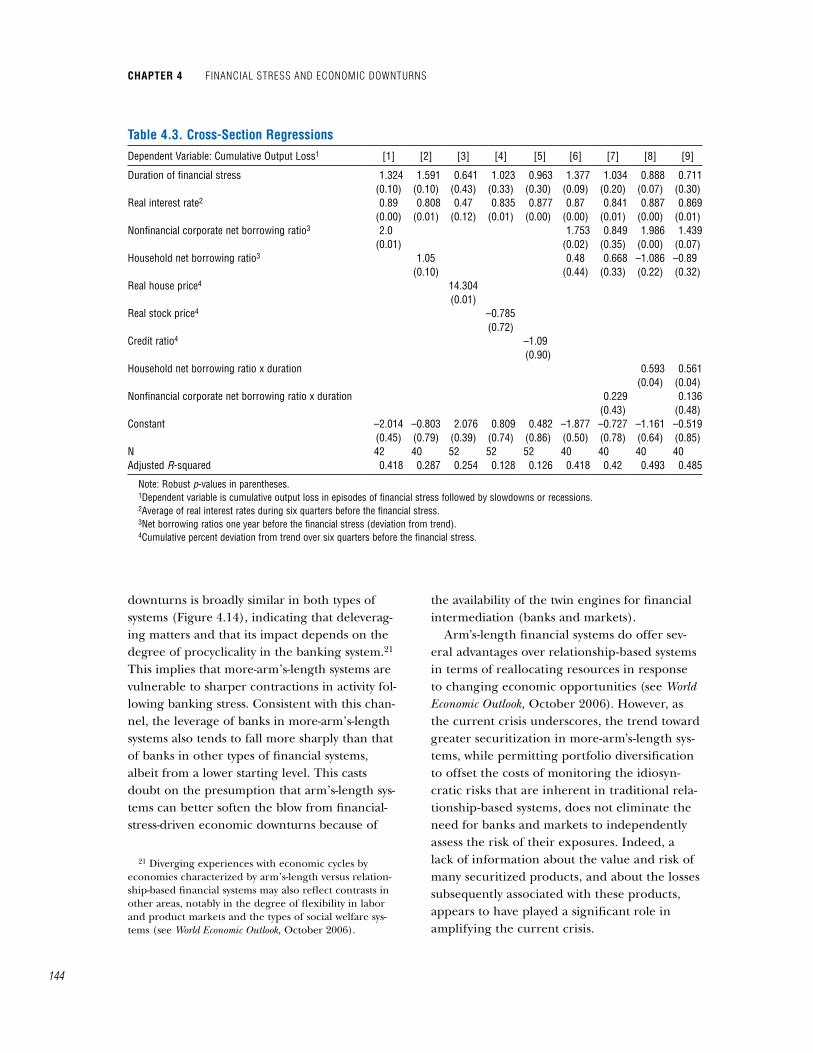
The degree to which initial financial imbal-ances and firms’ and households’ reliance on external funding explain the severity of ensu-ing economic downturns can be investigated more formally. The cumulative loss of output in the aftermath of financial stress episodes is regressed on (1) the run-up in credit and asset prices before the onset of the financial stress, (2) firms’ and households’ net borrowing ratios at the start of the episodes, and (3) a proxy for the severity of the financial shock, namely, the duration of the stress episode.
The main results of the regressions are pre-sented in Table 4.3:15
• Firms’ net borrowing ratio at the onset of the financial stress episode enters significantly in almost all specifications, confirming the importance of the link between firms’ initial reliance on external credit and the severity of the decline in economic activity.
• Households’ net borrowing ratio at the onset of the financial stress episode is statistically significant when considered alone but loses significance when firms’ net borrowing position is added. It continues to affect the severity of the output losses, however, when
15Slowdown severity is measured using the cumulative output loss during the period during which output is below trend; see Table 4.1 for further details. Recession severity is measured by losses until recovery.
-12 -10 -8 -6 -4 -2 0 2 4 6 8 10 120.5
1.0
1.5
2.0
2.5
3.0
3.5
4.0
All financial stress episodes
Banking-relatedfinancial stress
Figure 4.7. Banking-Related Financial Stress, Slowdowns, and Recessions(Median; quarters on the x-axis)
Non-banking-relatedfinancial stress
Financial Stress(real GDP percent change from one year earlier)
The most severe economic downturns are associated with banking-related financial stress.
1
Quarters before and after the start of financial stress
Slowdowns precededby banking-related financial stressRecessions precededby banking-related financial stress
Slowdowns not precededby financial stressRecessions not precededby financial stress
Quarters before and after the start of economic downturn-12 -10 -8 -6 -4 -2 0 2 4 6 8 10 12
-2
-1
0
1
2
3
4
5
Sources: Haver Analytics; OECD, Analytic Database; OECD, Economic Outlook (2008); and IMF staff calculations. The difference between banking-related and non-banking-related episodes is significant at a minimum of 10 percent for quarters 0, 1, 2, 3, and 4. The sample is constant for all quarters. The difference between slowdowns preceded by banking-related financial stress and slowdowns not preceded by financial stress is significant at a minimum of 10 percent for t – 6 to t + 6. The sample is constant for all quarters.
1
2
Slowdowns and Recessions(real GDP percent change from one year earlier)
2
141
interacted with the duration of the financial episode, suggesting that households’ position matters especially when the economy is hit by a sustained financial shock.This chapter seeks to identify factors that
determine whether or not episodes of financial stress are followed by economic downturns. Therefore, a key challenge is to determine the origins of the shocks that hit the economy and set off the complex interactions between the financial and real sectors. The fact that finan-cial sector stress precedes an economic down-turn does not mean that financial stress drives subsequent real sector developments: because financial market participants are forward-look-ing, financial stress may be merely a mani-festation that they anticipate a fundamental deterioration in the real sector. To address this problem, the chapter considers four types of shock that could be considered fundamental, exogenous deteriorations in the real sector environment: oil-price shock, monetary policy shock, fiscal policy shock, and labor productiv-ity shock. As shown in Figure 4.11, when one of these shocks is combined with financial stress, there is a more severe downturn than when there is the shock alone. This suggests that financial stress has a separately identifiable impact.
has Financial innovation affected the interplay between Financial Stress and economic cycles?
Banks continue to be important in explain-ing why certain financial stress episodes are associated with greater output consequences (see Figure 4.7). Why do banks remain crucial despite financial innovation and the emer-gence of nonbank sources of funding? Finan-cial innovation would seem able to reduce the pivotal role of banks by providing alternative channels for firms and households to access financing, channels that loosen collateral con-straints for borrowers and soften the adverse impact of financial stress on the cost of capital for banks. However, even though the role of
Recessions Slowdowns Other0.00
0.05
0.10
0.15
0.20
0.25
Recessions Slowdowns Other-0.2
0.0
0.2
0.4
0.6
0.8
1.0
1.2
Figure 4.8. Cost of Capital and Bank Asset Growth around Banking Financial Stress Episodes(Average; change from one year before to one year after the start of financial stress)
Banking-related financial stress episodes associated with recessions are characterized by lower bank asset growth and higher cost of capital in the aftermath.
Sources: OECD, Analytic Database; and IMF staff calculations. p-value reported refers to the two-tailed t-tests on the difference between the two averages. Banking-related financial stress episodes followed by slowdowns or recessions. Financial stress episodes not followed by slowdowns or recessions.
Change in Cost of Capital(percentage points)
Change in Bank Assets(percent)
p-value = 0.05
p-value = 0.05
3
p-value = 0.00p-value = 0.00
23
2 2
2 2
3
1
1
1
HaS Financial innovation aFFected tHe interplay between Financial StreSS and economic cycleS?
chapter 4 Financial StreSS and economic downturnS
142
banks has evolved over time, their symbiotic relationship with securities markets remains an essential feature of many financial systems, especially those characterized by arm’s-length financing (World Economic Outlook, Septem-ber 2006).16 As a result, episodes of banking distress continue to affect nonbank sources of financing as well.
To explain the continuing importance of banks, it is revealing to explore the procycli-cal behavior of bank leverage around financial cycles. In particular, how banks manage their leverage during upturns and downturns in the cycle appears fundamental to explaining why banking stress translates into a reduced credit supply, a higher cost of capital, and a soften-ing of economic activity. The hypothesis is as follows: When banks overextend their balance sheets during booms, on the back of higher asset values and lower perceived risk, there is a buildup of financial imbalances and a rapid expansion in activity, which further boosts asset values and reduces perceived risk, thereby fos-tering another round of lending and economic expansion.17 Under such conditions, a financial shock that either increases risk or reduces the return on assets could prompt a cycle of severe deleveraging, with banks sharply reducing their lending (or their growth in lending) as bank capital falls, prompting an economic slowdown that feeds back into a further reduction in credit supply.
The procyclicality of leverage is more pro-nounced when banks are more exposed to fluctuations in the market value of assets—for example, through their holdings of securities and
16Banks increasingly depend on market-based funding sources to finance their assets (such as through their certificates of deposit and off-balance-sheet commercial paper programs). Conversely, investment banks and increasingly commercial banks also remain at the center of the originate-to-distribute model of securitized financ-ing, providing credit through repurchase facilities to hedge funds and other leveraged intermediaries to invest in securities markets.
17This is in line with Minsky’s financial instability hypothesis (Minsky, 1992).
-12 -8 -4 0 4 8 12-15
-10
-5
0
5
10
15
20
-12 -8 -4 0 4 8 12-3
-2
-1
0
1
2
3
4House Prices(percent deviation from trend; quarters on the x-axis)
Stock Prices(percent deviation from trend; quarters on the x-axis)
Sources: IMF, International Financial Statistics database; OECD, Analytic Database; and IMF staff calculations. All in real terms, except for household and nonfinancial corporate net lending ratios. The sample is constant for all quarters and years.
1
Figure 4.9. Selected Macrovariables around Financial Stress Episodes(Median; start of financial stress episode at t = 0; x-axis as stated)
Financial stress episodes followed by slowdowns or recessions tend to be preceded by rapid buildups in asset prices and credit ratios and are associated with higher initial net borrowing from nonfinancial firms and (in cases of recession) from households.
-12 -8 -4 0 4 8 12-2.0
-1.5
-1.0
-0.5
0.0
0.5
1.0
1.5
2.0
2.5
-12 -8 -4 0 4 8 12-2
-1
0
1
2
3Credit/GDP(percent deviation from trend; quarters on the x-axis)
Interest Rate(change from one year earlier; percentage points; quarters on the x-axis)
Others
Followed by slowdowns onlyFollowed by recessions only
-3 -2 -1 0 1 2 3-1.5
-1.0
-0.5
0.0
0.5
1.0
1.5Household Net Lending/Borrowing(deviation from trend; years on the x-axis)
-3 -2 -1 0 1 2 3-1.5
-1.0
-0.5
0.0
0.5
1.0Nonfinancial Corporate Net Lending/Borrowing(deviation from trend; years on the x-axis)
1
143
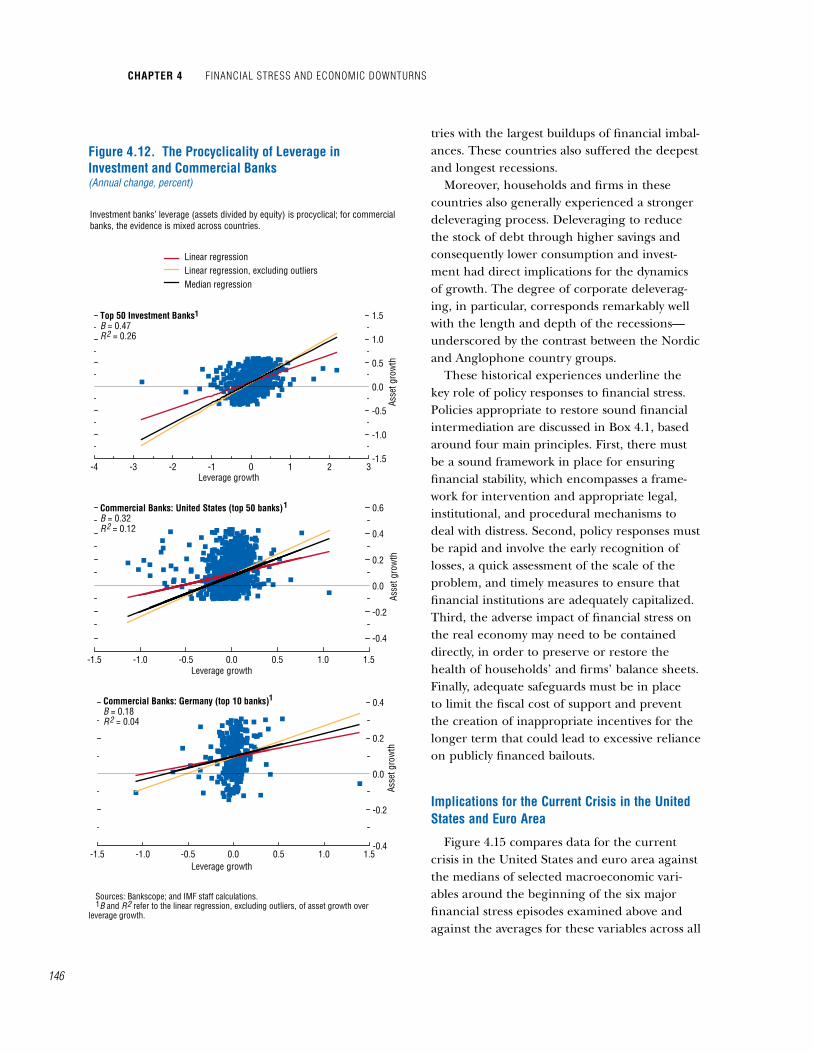
their repurchase facilities.18 Because this is typical for nondepository financial intermediaries, espe-cially investment banks, there should be evidence of procyclical leverage among them (Shin, 2008). On the other hand, commercial banks should be less prone to procyclically adjusting their balance sheets during asset price or liquidity booms and busts, because they rely less on wholesale fund-ing and more on retail deposits, and also because they are less subject to mark-to-market changes in the value of their assets.
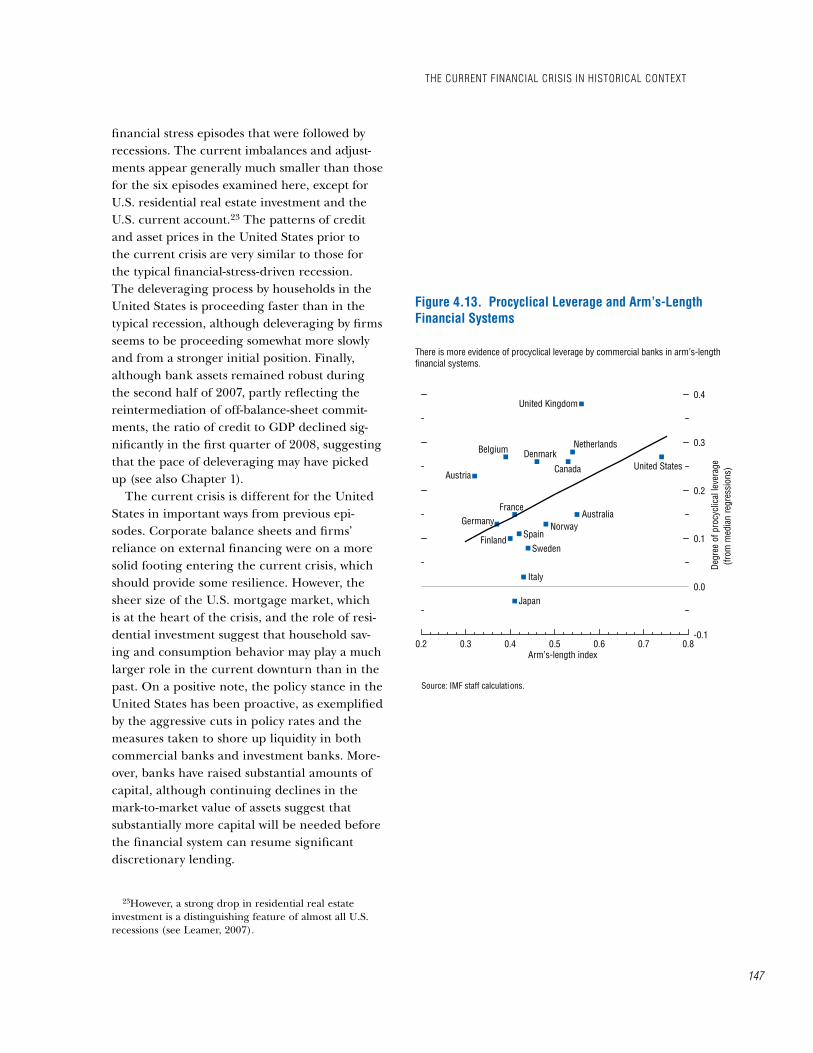
Evidence confirms that investment banks’ leverage tends to be procyclical: they expand their leverage when they are expanding their assets (Figure 4.12, upper panel).19 The evi-dence is less uniform on the procyclicality of commercial banks, which rely much more on retail deposits and whose main activity is making long-term, illiquid loans (Figure 4.12, lower two panels). However, the evidence does suggest that commercial banks tend to be more procyclical when operating in more-arm’s-length financial systems, where a greater share of intermediation occurs through financial markets rather than through traditional rela-tionship-based (and bank-dominated) activities (Figure 4.13). Thus, more-arm’s-length financial systems are associated with overall more pro-cyclical bank behavior, and as a result may be more vulnerable to banking stress.20 Of note, the proportion of banking-related financial stress episodes occurring in more-arm’s-length financial systems has remained about equal to the proportion occurring in more-relationship-based systems (see Table 4.1).
Indeed, slowdowns and recessions tend to be deeper in economies with more-arm’s-length financial systems, although the duration of such
18In a systemic crisis, it would be difficult for all banks to adjust their leverage simultaneously, because there would be few buyers for these assets among other banks; the only likely buyers would be cash-rich investors who do not rely on bank leverage to fund their positions.
19See also Adrian and Shin (2008a and 2008b).20This is consistent with the findings in Chapter 3 of
IMF (2008), showing that fair value accounting tends to lead to more procyclical movements in financial interme-diaries’ balance sheets.
Recessions Slowdowns Other-2.0
-1.5
-1.0
-0.5
0.0
0.5
Recessions Slowdowns Other-0.8
-0.6
-0.4
-0.2
0.0
Recessions Slowdowns Other-6
-4
-2
0
2
4
6
8
Recessions Slowdowns Other-20
-10
0
10
20
30
Sources: Haver Analytics; IMF, International Financial Statistics database; OECD, Analytic Database; and IMF staff calculations. Note: p-value reported refers to the two-tailed t-tests on the difference between the two averages. Financial stress episodes not followed by slowdowns or recessions.
Household Net Lending/Borrowing(percent of gross disposable income; deviation from trend one year before start of financial stress)
Nonfinancial CorporateNet Lending/Borrowing(percent of GDP; deviation from trend one year before start of financial stress)
Real House Prices(cumulative percent deviation from trend over six quarters before start of financial stress)
Credit(percent of GDP; cumulative percent deviation from trend over six quarters before start of financial stress)
Figure 4.10. Initial Conditions of Financial Stress Episodes (Average)
Faster buildup in the credit ratio and house prices and higher nonfinancial corporate borrowing are statistically significant indicators of the likelihood that financial stress episodes will be followed by slowdowns or recessions. Household net borrowing is significantly associated only with subsequent recessions.
p-value = 0.02
p-value = 0.04
p-value = 0.05
p-value = 0.00
p-value = 0.00
p-value = 0.05
p-value = 0.00
1
1 1
11
HaS Financial innovation aFFected tHe interplay between Financial StreSS and economic cycleS?
chapter 4 Financial StreSS and economic downturnS
144
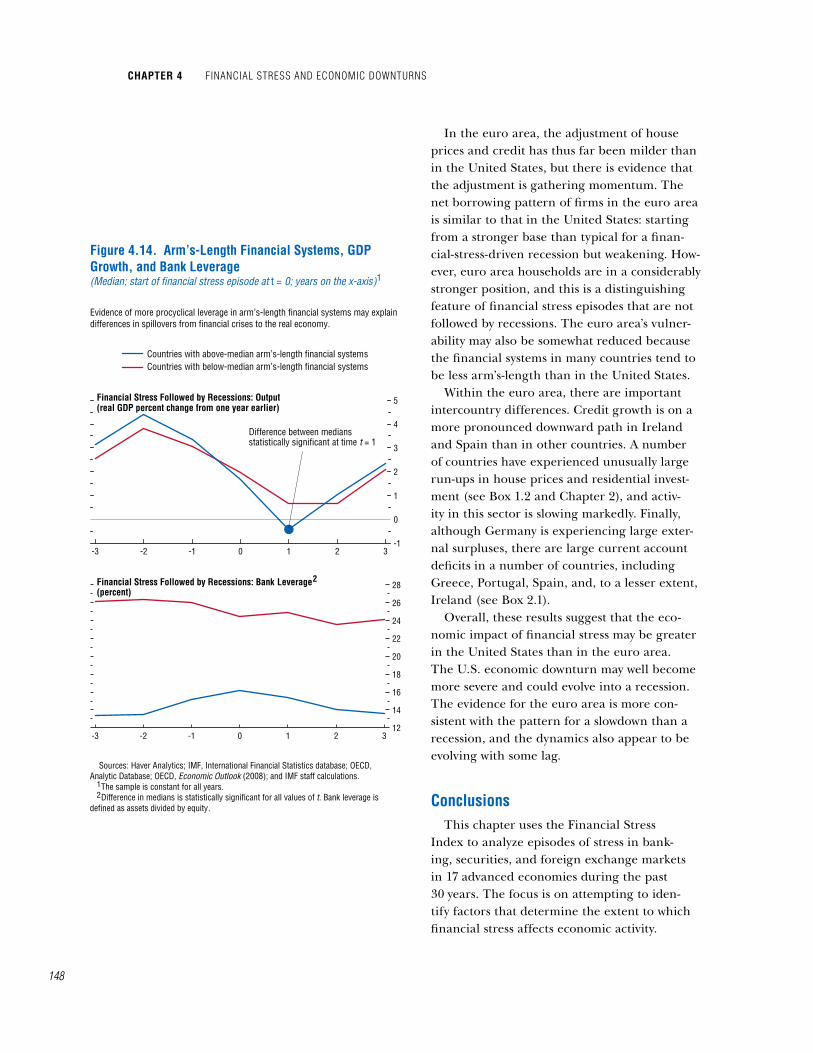
downturns is broadly similar in both types of systems (Figure 4.14), indicating that deleverag-ing matters and that its impact depends on the degree of procyclicality in the banking system.21 This implies that more-arm’s-length systems are vulnerable to sharper contractions in activity fol-lowing banking stress. Consistent with this chan-nel, the leverage of banks in more-arm’s-length systems also tends to fall more sharply than that of banks in other types of financial systems, albeit from a lower starting level. This casts doubt on the presumption that arm’s-length sys-tems can better soften the blow from financial-stress-driven economic downturns because of
21 Diverging experiences with economic cycles by economies characterized by arm’s-length versus relation-ship-based financial systems may also reflect contrasts in other areas, notably in the degree of flexibility in labor and product markets and the types of social welfare sys-tems (see World Economic Outlook, October 2006).
the availability of the twin engines for financial intermediation (banks and markets).
Arm’s-length financial systems do offer sev-eral advantages over relationship-based systems in terms of reallocating resources in response to changing economic opportunities (see World Economic Outlook, October 2006). However, as the current crisis underscores, the trend toward greater securitization in more-arm’s-length sys-tems, while permitting portfolio diversification to offset the costs of monitoring the idiosyn-cratic risks that are inherent in traditional rela-tionship-based systems, does not eliminate the need for banks and markets to independently assess the risk of their exposures. Indeed, a lack of information about the value and risk of many securitized products, and about the losses subsequently associated with these products, appears to have played a significant role in amplifying the current crisis.
table 4.3. cross-Section regressionsDependent Variable: Cumulative Output Loss1 [1] [2] [3] [4] [5] [6] [7] [8] [9]
Duration of financial stress 1.324 1.591 0.641 1.023 0.963 1.377 1.034 0.888 0.711(0.10) (0.10) (0.43) (0.33) (0.30) (0.09) (0.20) (0.07) (0.30)
Real interest rate2 0.89 0.808 0.47 0.835 0.877 0.87 0.841 0.887 0.869 (0.00) (0.01) (0.12) (0.01) (0.00) (0.00) (0.01) (0.00) (0.01)
Nonfinancial corporate net borrowing ratio3 2.0 1.753 0.849 1.986 1.439(0.01) (0.02) (0.35) (0.00) (0.07)
Household net borrowing ratio3 1.05 0.48 0.668 –1.086 –0.89(0.10) (0.44) (0.33) (0.22) (0.32)
Real house price4 14.304(0.01)
Real stock price4 –0.785(0.72)
Credit ratio4 –1.09(0.90)
Household net borrowing ratio x duration 0.593 0.561(0.04) (0.04)
Nonfinancial corporate net borrowing ratio x duration 0.229 0.136(0.43) (0.48)
Constant –2.014 –0.803 2.076 0.809 0.482 –1.877 –0.727 –1.161 –0.519(0.45) (0.79) (0.39) (0.74) (0.86) (0.50) (0.78) (0.64) (0.85)
N 42 40 52 52 52 40 40 40 40Adjusted R-squared 0.418 0.287 0.254 0.128 0.126 0.418 0.42 0.493 0.485
Note: Robust p-values in parentheses.1Dependent variable is cumulative output loss in episodes of financial stress followed by slowdowns or recessions.2Average of real interest rates during six quarters before the financial stress.3Net borrowing ratios one year before the financial stress (deviation from trend).4Cumulative percent deviation from trend over six quarters before the financial stress.

145
the current Financial crisis in historical context
This section compares the current episode of financial stress to six well-known episodes of banking-related financial stress that occurred in advanced economies during the 1990s. These episodes affected Finland, Norway, Sweden, the United Kingdom, and the United States in the early 1990s and Japan throughout the 1990s. Given the importance of banking distress in the current financial turmoil, these episodes can serve as a useful benchmark for analyzing the current conjuncture and for gauging its poten-tial macroeconomic impact.22
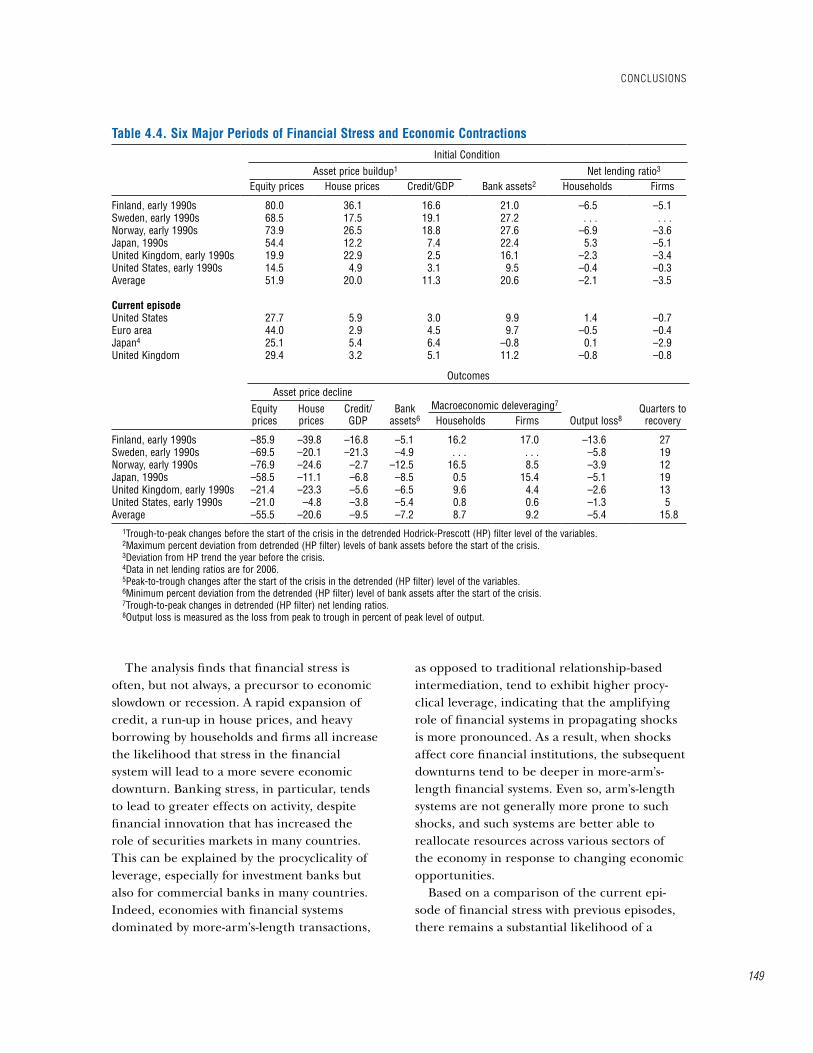
Examining the initial conditions before the onset of these six episodes confirms the main findings of the event analysis, namely, that financial stress episodes are more likely to be followed by severe economic downturns when they occur in the context of a rapid buildup in credit and house prices and a heavier reliance on credit by firms and households. Broadly speaking, the episodes characterized by the largest asset price and credit booms were in the Nordic countries in the early 1990s, where increases in credit ratios, assets prices, and bank assets were abnormally high (see Table 4.4, top panel). At the same time, borrow-ing by households and firms was initially much larger in Finland and Norway than in the other countries. Japanese firms relied extensively on external financing, but this was balanced at least partially by the saving patterns of house-holds. In contrast, before the crises in the Anglophone countries, asset price imbalances were moderate and balance sheets were not under tremendous strain.
The countries with larger financial imbalances and balance sheet vulnerabilities at the onset of an episode experienced more severe output contractions (see Table 4.4, lower panel). The most dramatic collapses in asset prices, bank asset growth, and credit occurred in the coun-
22This approach is in line with other studies, includ-ing Reinhart and Rogoff (2008). See also J.P. Morgan Research (2008).
-12 -8 -4 0 4 8 12-1
0
1
2
3
4
-12 -8 -4 0 4 8 12-1
0
1
2
3
4
5
-12 -8 -4 0 4 8 12-1
0
1
2
3
4
5
-12 -8 -4 0 4 8 120
1
2
3
4
5
Preceded by shock onlyPreceded by financial stress and shock
Figure 4.11. Financial Stress and Economic Downturns: Controlling for Four Main Shocks(Median of GDP percent change from one year earlier; start of economic contraction at t = 0; quarters on the x-axis)
Economic downturns tend to be more severe when preceded by financial stress episodes.
Sources: Haver Analytics; IMF, Commodity Price System database; OECD, Analytic Database; OECD, Economic Outlook (2008); and IMF staff calculations. Oil prices are scaled by U.S. inflation (CPI). Oil-price shock is identified if oil price is one standard deviation above Hodrick-Prescott (HP) trend. Monetary policy is measured using the inverse term spread. Monetary policy shock is identified if the inverse term spread is one standard deviation above HP trend. Fiscal policy is measured using government net lending. Fiscal shock is identified if government net lending is one standard deviation above HP trend. Labor productivity of the total economy is measured as the ratio of real GDP and total employment. Productivity shock is identified if labor productivity is one standard deviation below HP trend. Data are not available for Austria, Belgium, Denmark, Spain, and Switzerland.
1
2
3
Oil-Price Shock1 Monetary Policy Shock2
Fiscal Policy Shock 3 Labor Productivity4
4
tHe current Financial criSiS in HiStorical context
chapter 4 Financial StreSS and economic downturnS
146
tries with the largest buildups of financial imbal-ances. These countries also suffered the deepest and longest recessions.
Moreover, households and firms in these countries also generally experienced a stronger deleveraging process. Deleveraging to reduce the stock of debt through higher savings and consequently lower consumption and invest-ment had direct implications for the dynamics of growth. The degree of corporate deleverag-ing, in particular, corresponds remarkably well with the length and depth of the recessions— underscored by the contrast between the Nordic and Anglophone country groups.
These historical experiences underline the key role of policy responses to financial stress. Policies appropriate to restore sound financial intermediation are discussed in Box 4.1, based around four main principles. First, there must be a sound framework in place for ensuring financial stability, which encompasses a frame-work for intervention and appropriate legal, institutional, and procedural mechanisms to deal with distress. Second, policy responses must be rapid and involve the early recognition of losses, a quick assessment of the scale of the problem, and timely measures to ensure that financial institutions are adequately capitalized. Third, the adverse impact of financial stress on the real economy may need to be contained directly, in order to preserve or restore the health of households’ and firms’ balance sheets. Finally, adequate safeguards must be in place to limit the fiscal cost of support and prevent the creation of inappropriate incentives for the longer term that could lead to excessive reliance on publicly financed bailouts.
implications for the current crisis in the united States and euro area
Figure 4.15 compares data for the current crisis in the United States and euro area against the medians of selected macroeconomic vari-ables around the beginning of the six major financial stress episodes examined above and against the averages for these variables across all
Figure 4.12. The Procyclicality of Leverage in Investment and Commercial Banks(Annual change, percent)
Sources: Bankscope; and IMF staff calculations. B and R refer to the linear regression, excluding outliers, of asset growth over leverage growth.
-4 -3 -2 -1 0 1 2 3-1.5
-1.0
-0.5
0.0
0.5
1.0
1.5
Asse
t gro
wth
Leverage growth
-1.5 -1.0 -0.5 0.0 0.5 1.0 1.5
-0.4
-0.2
0.0
0.2
0.4
0.6
Asse
t gro
wth
Leverage growth
-1.5 -1.0 -0.5 0.0 0.5 1.0 1.5-0.4
-0.2
0.0
0.2
0.4
Asse
t gro
wth
Leverage growth
Investment banks’ leverage (assets divided by equity) is procyclical; for commercial banks, the evidence is mixed across countries.
Linear regressionLinear regression, excluding outliersMedian regression
Commercial Banks: Germany (top 10 banks)B = 0.18R = 0.04
1
Commercial Banks: United States (top 50 banks)B = 0.32R = 0.12
1
Top 50 Investment BanksB = 0.47R = 0.26
1
1
2
2
2
2
147
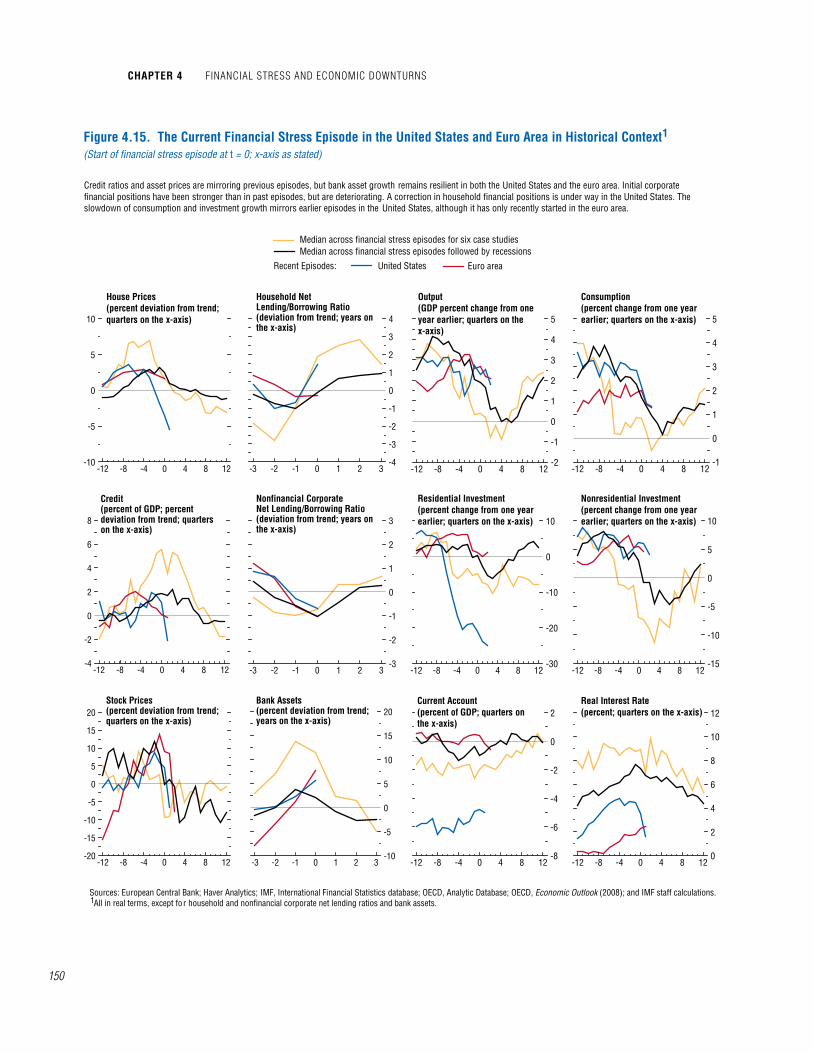
financial stress episodes that were followed by recessions. The current imbalances and adjust-ments appear generally much smaller than those for the six episodes examined here, except for U.S. residential real estate investment and the U.S. current account.23 The patterns of credit and asset prices in the United States prior to the current crisis are very similar to those for the typical financial-stress-driven recession. The deleveraging process by households in the United States is proceeding faster than in the typical recession, although deleveraging by firms seems to be proceeding somewhat more slowly and from a stronger initial position. Finally, although bank assets remained robust during the second half of 2007, partly reflecting the reintermediation of off-balance-sheet commit-ments, the ratio of credit to GDP declined sig-nificantly in the first quarter of 2008, suggesting that the pace of deleveraging may have picked up (see also Chapter 1).
The current crisis is different for the United States in important ways from previous epi-sodes. Corporate balance sheets and firms’ reliance on external financing were on a more solid footing entering the current crisis, which should provide some resilience. However, the sheer size of the U.S. mortgage market, which is at the heart of the crisis, and the role of resi-dential investment suggest that household sav-ing and consumption behavior may play a much larger role in the current downturn than in the past. On a positive note, the policy stance in the United States has been proactive, as exemplified by the aggressive cuts in policy rates and the measures taken to shore up liquidity in both commercial banks and investment banks. More-over, banks have raised substantial amounts of capital, although continuing declines in the mark-to-market value of assets suggest that substantially more capital will be needed before the financial system can resume significant discretionary lending.
23However, a strong drop in residential real estate investment is a distinguishing feature of almost all U.S. recessions (see Leamer, 2007).
Figure 4.13. Procyclical Leverage and Arm’s-Length Financial Systems
Source: IMF staff calculations.
There is more evidence of procyclical leverage by commercial banks in arm’s-length financial systems.
0.2 0.3 0.4 0.5 0.6 0.7 0.8-0.1
0.0
0.1
0.2
0.3
0.4
Arm’s-length index
Degr
ee o
f pro
cycl
ical
leve
rage
(from
med
ian
regr
essi
ons)
Belgium
Austria
Denmark
United Kingdom
Canada
Netherlands
Australia
United States
FranceGermany
SpainNorway
Finland
Japan
Italy
Sweden
tHe current Financial criSiS in HiStorical context
chapter 4 Financial StreSS and economic downturnS
148
In the euro area, the adjustment of house prices and credit has thus far been milder than in the United States, but there is evidence that the adjustment is gathering momentum. The net borrowing pattern of firms in the euro area is similar to that in the United States: starting from a stronger base than typical for a finan-cial-stress-driven recession but weakening. How-ever, euro area households are in a considerably stronger position, and this is a distinguishing feature of financial stress episodes that are not followed by recessions. The euro area’s vulner-ability may also be somewhat reduced because the financial systems in many countries tend to be less arm’s-length than in the United States.
Within the euro area, there are important intercountry differences. Credit growth is on a more pronounced downward path in Ireland and Spain than in other countries. A number of countries have experienced unusually large run-ups in house prices and residential invest-ment (see Box 1.2 and Chapter 2), and activ-ity in this sector is slowing markedly. Finally, although Germany is experiencing large exter-nal surpluses, there are large current account deficits in a number of countries, including Greece, Portugal, Spain, and, to a lesser extent, Ireland (see Box 2.1).
Overall, these results suggest that the eco-nomic impact of financial stress may be greater in the United States than in the euro area. The U.S. economic downturn may well become more severe and could evolve into a recession. The evidence for the euro area is more con-sistent with the pattern for a slowdown than a recession, and the dynamics also appear to be evolving with some lag.
conclusionsThis chapter uses the Financial Stress
Index to analyze episodes of stress in bank-ing, securities, and foreign exchange markets in 17 advanced economies during the past 30 years. The focus is on attempting to iden-tify factors that determine the extent to which financial stress affects economic activity.
-3 -2 -1 0 1 2 3-1
0
1
2
3
4
5
Sources: Haver Analytics; IMF, International Financial Statistics database; OECD, Analytic Database; OECD, Economic Outlook (2008); and IMF staff calculations. The sample is constant for all years. Difference in medians is statistically significant for all values of t. Bank leverage is defined as assets divided by equity.
Financial Stress Followed by Recessions: Output(real GDP percent change from one year earlier)
-3 -2 -1 0 1 2 312
14
16
18
20
22
24
26
28Financial Stress Followed by Recessions: Bank Leverage(percent)
Evidence of more procyclical leverage in arm’s-length financial systems may explain differences in spillovers from financial crises to the real economy.
Figure 4.14. Arm’s-Length Financial Systems, GDP Growth, and Bank Leverage(Median; start of financial stress episode at t = 0; years on the x-axis)
Countries with above-median arm’s-length financial systemsCountries with below-median arm’s-length financial systems
1
1
Difference between mediansstatistically significant at time t = 1
2
2
149
The analysis finds that financial stress is often, but not always, a precursor to economic slowdown or recession. A rapid expansion of credit, a run-up in house prices, and heavy borrowing by households and firms all increase the likelihood that stress in the financial system will lead to a more severe economic downturn. Banking stress, in particular, tends to lead to greater effects on activity, despite financial innovation that has increased the role of securities markets in many countries. This can be explained by the procyclicality of leverage, especially for investment banks but also for commercial banks in many countries. Indeed, economies with financial systems dominated by more-arm’s-length transactions,
as opposed to traditional relationship-based intermediation, tend to exhibit higher procy-clical leverage, indicating that the amplifying role of financial systems in propagating shocks is more pronounced. As a result, when shocks affect core financial institutions, the subsequent downturns tend to be deeper in more-arm’s-length financial systems. Even so, arm’s-length systems are not generally more prone to such shocks, and such systems are better able to reallocate resources across various sectors of the economy in response to changing economic opportunities.
Based on a comparison of the current epi-sode of financial stress with previous episodes, there remains a substantial likelihood of a
table 4.4. Six major periods of Financial Stress and economic contractionsInitial Condition
Asset price buildup1 Net lending ratio3
Equity prices House prices Credit/GDP Bank assets2 Households Firms
Finland, early 1990s 80.0 36.1 16.6 21.0 –6.5 –5.1Sweden, early 1990s 68.5 17.5 19.1 27.2 . . . . . .Norway, early 1990s 73.9 26.5 18.8 27.6 –6.9 –3.6Japan, 1990s 54.4 12.2 7.4 22.4 5.3 –5.1United Kingdom, early 1990s 19.9 22.9 2.5 16.1 –2.3 –3.4United States, early 1990s 14.5 4.9 3.1 9.5 –0.4 –0.3Average 51.9 20.0 11.3 20.6 –2.1 –3.5
current episodeUnited States 27.7 5.9 3.0 9.9 1.4 –0.7Euro area 44.0 2.9 4.5 9.7 –0.5 –0.4Japan4 25.1 5.4 6.4 –0.8 0.1 –2.9United Kingdom 29.4 3.2 5.1 11.2 –0.8 –0.8
OutcomesAsset price decline
Macroeconomic deleveraging7Equity prices
House prices
Credit/ GDP
Bank assets6 Households Firms Output loss8
Quarters to recovery
Finland, early 1990s –85.9 –39.8 –16.8 –5.1 16.2 17.0 –13.6 27Sweden, early 1990s –69.5 –20.1 –21.3 –4.9 . . . . . . –5.8 19Norway, early 1990s –76.9 –24.6 –2.7 –12.5 16.5 8.5 –3.9 12Japan, 1990s –58.5 –11.1 –6.8 –8.5 0.5 15.4 –5.1 19United Kingdom, early 1990s –21.4 –23.3 –5.6 –6.5 9.6 4.4 –2.6 13United States, early 1990s –21.0 –4.8 –3.8 –5.4 0.8 0.6 –1.3 5Average –55.5 –20.6 –9.5 –7.2 8.7 9.2 –5.4 15.8
1Trough-to-peak changes before the start of the crisis in the detrended Hodrick-Prescott (HP) filter level of the variables.2Maximum percent deviation from detrended (HP filter) levels of bank assets before the start of the crisis.3Deviation from HP trend the year before the crisis.4Data in net lending ratios are for 2006.5Peak-to-trough changes after the start of the crisis in the detrended (HP filter) level of the variables.6Minimum percent deviation from the detrended (HP filter) level of bank assets after the start of the crisis.7Trough-to-peak changes in detrended (HP filter) net lending ratios.8Output loss is measured as the loss from peak to trough in percent of peak level of output.
concluSionS
chapter 4 Financial StreSS and economic downturnS
150
-12 -8 -4 0 4 8 12-1
0
1
2
3
4
5
-12 -8 -4 0 4 8 12-2
-1
0
1
2
3
4
5
Output(GDP percent change from one year earlier; quarters on the x-axis)
Consumption(percent change from one year earlier; quarters on the x-axis)
-3 -2 -1 0 1 2 3-4
-3
-2
-1
0
1
2
3
4
-12 -8 -4 0 4 8 12-10
-5
0
5
10
Household Net Lending/Borrowing Ratio(deviation from trend; years on the x-axis)
House Prices(percent deviation from trend; quarters on the x-axis)
Figure 4.15. The Current Financial Stress Episode in the United States and Euro Area in Historical Context(Start of financial stress episode at t = 0; x-axis as stated)
Credit ratios and asset prices are mirroring previous episodes, but bank asset growth remains resilient in both the United States and the euro area. Initial corporate financial positions have been stronger than in past episodes, but are deteriorating. A correction in household financial positions is under way in the United States. The slowdown of consumption and investment growth mirrors earlier episodes in the United States, although it has only recently started in the euro area.
Median across financial stress episodes followed by recessions
Recent Episodes: United States Euro area
Median across financial stress episodes for six case studies
-12 -8 -4 0 4 8 12-15
-10
-5
0
5
10
-12 -8 -4 0 4 8 12-30
-20
-10
0
10
Residential Investment(percent change from one year earlier; quarters on the x-axis)
Nonresidential Investment(percent change from one year earlier; quarters on the x-axis)
-3 -2 -1 0 1 2 3-3
-2
-1
0
1
2
3
-12 -8 -4 0 4 8 12-4
-2
0
2
4
6
8
Nonfinancial CorporateNet Lending/Borrowing Ratio(deviation from trend; years on the x-axis)
Credit(percent of GDP; percent deviation from trend; quarters on the x-axis)
-12 -8 -4 0 4 8 12-8
-6
-4
-2
0
2Current Account(percent of GDP; quarters on the x-axis)
-3 -2 -1 0 1 2 3-10
-5
0
5
10
15
20
-12 -8 -4 0 4 8 12-20
-15
-10
-5
0
5
10
15
20Stock Prices(percent deviation from trend; quarters on the x-axis)
Bank Assets(percent deviation from trend; years on the x-axis)
Sources: European Central Bank; Haver Analytics; IMF, International Financial Statistics database; OECD, Analytic Database; OECD, Economic Outlook (2008); and IMF staff calculations. All in real terms, except for household and nonfinancial corporate net lending ratios and bank assets.1
-12 -8 -4 0 4 8 120
2
4
6
8
10
12Real Interest Rate(percent; quarters on the x-axis)
1
151
How can policymakers respond to financial stress, including the current global financial turmoil, in a way that ensures that the financial system is restored to health, while limiting the fallout on the economy and avoiding long-term moral hazard? Well-timed interventions aimed at financial institutions and borrowers can help restore balance sheets and incentives, mitigate the negative shock to the economy of a financial system under stress, and help to restart productive investment. But in undertak-ing these interventions, governments face the key challenge of restoring financial intermedia-tion while keeping the costs to taxpayers down, avoiding misallocations of capital, and main-taining proper incentives.
General Principles of Intervention
The experience from past episodes of finan-cial system distress suggests that the effective-ness and cost of policy responses depend on four key elements:1 • Having a sound framework for ensuring
financial sector stability helps prevent and contain financial stress. Key elements of this framework include (1) pre-crisis sanctions on undercapitalized financial institutions that pose systemic risks; (2) legal and institutional mechanisms to deal swiftly with weak finan-cial institutions, such as bank-specific bank-ruptcy regimes; (3) well-defined tools and processes for closing and rapidly reopening banks; and (4) an effective deposit insurance system.
• Speed is of the essence to minimize the impact on the real economy. Too often, regulatory forbearance and liquidity support have been used to help insolvent financial institutions recover—only to have it become
The author of this box is Luc Laeven. This box draws heavily on Calomiris, Klingebiel, and Laeven (2005).
1For an overview of existing literature on crisis resolution policies, see Hoelscher and Quintyn (2003) and Honohan and Laeven (2005).
clear later that delaying decisive intervention increased the stress on the financial system and the economy. To avoid this, policymakers should force the early recognition of losses and take steps to ensure that financial insti-tutions are adequately capitalized.
• The adverse impact of financial system dis-tress on the real economy may need to allevi-ated through measures that directly support firms and households—for example, through targeted debt relief programs to distressed borrowers and corporate restructuring programs.
• Steps should be taken to limit the costs and moral hazard implications of these policy responses. Shareholders must first absorb losses by a write-down of their equity capital. In the case of large losses, creditors also need to contribute by reducing and restructuring their claims. Borrowers must absorb some of the costs, especially if they have been imprudent. Mechanisms that link government support (such as preferred stock purchases) to privately raised capital can also help identify those banks that are truly worth saving and limit future distortions arising from moral hazard.
Specific Policy Responses
Policymakers can employ a wide range of specific emergency measures (aimed at contain-ing the crisis) and restructuring tools (aimed at restoring the normal functioning of the credit system and rebuilding banks’ and borrowers’ balance sheets).
Emergency measures include (1) regulatory capital forbearance, (2) emergency liquid-ity support, (3) government deposit guaran-tees, and (4) suspension of convertibility of deposits.2 Each of these actions can have very
2 Examining a sample of 40 banking crisis epi-sodes, Laeven and Valencia (forthcoming) show that emergency measures have often included emergency liquidity support and government deposit guarantees. Regulatory capital forbearance—suspending pruden-
Box 4.1. policies to resolve Financial System Stress and restore Sound Financial intermediation
concluSionS
chapter 4 Financial StreSS and economic downturnS
152
different consequences on the supply of credit and thus on economic activity. The appropriate policy measure depends on whether the trigger for the crisis is a loss of depositor confidence, the (regulatory) recognition of existing insol-vency, or the knock-on effects of asset price volatility, including exchange rate or house price pressures. Even during the emergency phase, however, longer-term implications must be taken into account—the risk being that restoring stability in the heat of the crisis may lead central banks to extend loans to some financial institutions that are almost certain to prove insolvent.
Specific resolution policies include (1) recapi-talizating financial institutions, (2) using asset management companies (AMCs) to resolve distressed loans, (3) offering debt forgiveness, and (4) providing incentives for loan loss write-offs.3 Countries typically apply a combination of resolution strategies—with some directed more toward financial institutions and others geared more toward borrowers—and in the process the government often incurs substantial fiscal costs.4 Here are some experiences with these types of resolution policies.
Recapitalization: Measures aimed at quickly improving the capital bases of financial institu-tions do not directly improve debtor capacity, but they make it easier for banks to recognize losses and thereby facilitate corporate restruc-turing. Government-assisted recapitalizations can, however, create moral hazard for share-holders, especially if government intervention
tial regulations and allowing technically insolvent banks to continue operating—is also a rather common response. By contrast, measures aimed at avoiding bank runs through deposit freezes and bank holidays are rarely used.
3 Laeven and Valencia (forthcoming) show that bank recapitalization occurred in three-quarters of the crises they considered, with an average fiscal cost of 6 percent of GDP. AMCs were set up in slightly more than half of the episodes in their database.
4The average fiscal cost of government intervention in the cases studied by Laeven and Valencia (forth-coming) is about 16 percent of GDP.
is small relative to the negative net worth of recipient institutions. Looking at the recapi-talization schemes adopted in the United States (starting in 1933) and Japan (1998 and 1999) helps illustrate some key issues.5 In the United States, the program mainly involved the purchase of preferred stock to enhance bank capital and included appropriate screening and incentives for participants so that only banks worth saving and those that managed their risk and capital structure more prudently received taxpayer funds. Moreover, banks receiving assistance were monitored to ensure that they made proper use of public aid. In Japan, the first program (launched in 1998) involved only small amounts, was mostly targeted to purchases of subordinated debt and loans, and was broadly spread across the banking system. A more suc-cessful recapitalization program was launched in 1999, which involved much larger purchases of preferred stocks, included more rigorous benchmarks, and participation was more nar-rowly focused.6
Asset management companies (AMCs): The main objective of government-owned AMCs is to accelerate financial restructuring by taking over nonperforming assets from banks. Two examples of successful AMCs are Securum and Retrieva in Sweden, created in 1992 to manage the problem loans of two major Swedish banks, Nordbanken and Gota Bank. Both compa-nies managed to recover much of their initial investment by selling off their assets. Factors that contributed to their success include an efficient judicial system, which allowed them
5The two Japanese programs together involved public purchase of ¥10 trillion (2 percent of GDP) of bank capital.
6The specific form of bank recapitalization often depends on the country’s insolvency regime for financial institutions. In many countries today such regimes do not allow for a speedy resolution of crises but rather prolong them. Another lesson for successful bank recapitalization is that bank capital regulations must be enforced rigorously, which can involve imposing limitations on the distribution of dividends.
Box 4.1 (concluded)
153
sharp downturn in the United States, given the similarities between the current dynam-ics of asset prices, credit ratios, and household financial positions and previous episodes that were followed by recession. Mitigating factors are the rapid monetary policy response and a relatively low real interest rate. In the euro area, by contrast, the relatively strong position of households offers some protection against a sharp downturn, despite the appreciable run-up in asset prices and the credit ratio ahead of the current financial turmoil. The euro area’s vulnerability to a deeper downturn may also be somewhat reduced because many of its financial systems are less arm’s-length, as evidenced most notably by the much smaller role for the origi-nate-to-distribute mortgage banking business model.
One factor that helps predict whether a financial stress episode will lead to a downturn is the buildup in balance sheet vulnerabilities associated with rising asset prices and credit. Policymakers therefore need to be alert to these indicators during the upswing of the financial cycle. Prudential measures and monetary policy should be used to address buildups that may leave the economy vulnerable to greater output losses in the event of a severe shock.
Should significant financial stress affect the core of the banking system, the early recogni-tion of losses and measures to support the speedy restoration of capital can help reduce the output consequences. At the same time, policymakers must seek to avoid longer-term moral hazard implications of any strategy to restore financial stability.
concluSionS
to force insolvent debtors into bankruptcy; the real-estate-related nature of their assets, which made it easier to restructure; and the strong governance mechanisms and skilled management teams in place at the companies. However, other countries have found it harder to realize these advantages, in part owing to weak legal, regulatory, and political institu-tions—banks’ assets often are transferred to the AMC at prices abovemarket value, resulting in backdoor bank recapitalization and creating moral hazard.
Debt forgiveness: Key advantages of this measure are its simplicity and speed—debt forgiveness recognizes loan losses up front and thus provides immediate relief to borrow-ers. At the same time, however, debt forgive-ness poses incentive problems because it does not impose losses on borrowers and bank shareholders. It can also undermine trust in monetary institutions and the rule of law, as it can violate monetary standards and inter-fere in private contracting. Whether it works ultimately depends on the frequency of its use and the specific circumstances of financial
distress.7 Because of the risks of moral hazard, however, debt forgiveness should be considered only as a last resort.
Loan loss write-off programs: Loan loss write-off programs are directed at supporting borrowers. Although they can be implemented quickly, loan loss write-offs may worsen incentives for prudent behavior as they do not impose losses on banks or their borrowers.
Overall, the mix of policy responses will ultimately be crisis-specific and must reflect a variety of factors, including the nature and depth of the financial crisis and the specific country circumstances. The four principles for intervention outlined here have proven to have general applicability and should be followed in every crisis, including the current one.
7 The U.S. experience in the 1930s, when gold pay-ment clauses in debt contracts were abrogated, shows that debt forgiveness can help solve coordination problems in renegotiating debt. While few individual creditors were willing to voluntarily remove these clauses, when they were forced to do so collectively, the improvement in aggregate economic circum-stances left both creditors and debtors better off.
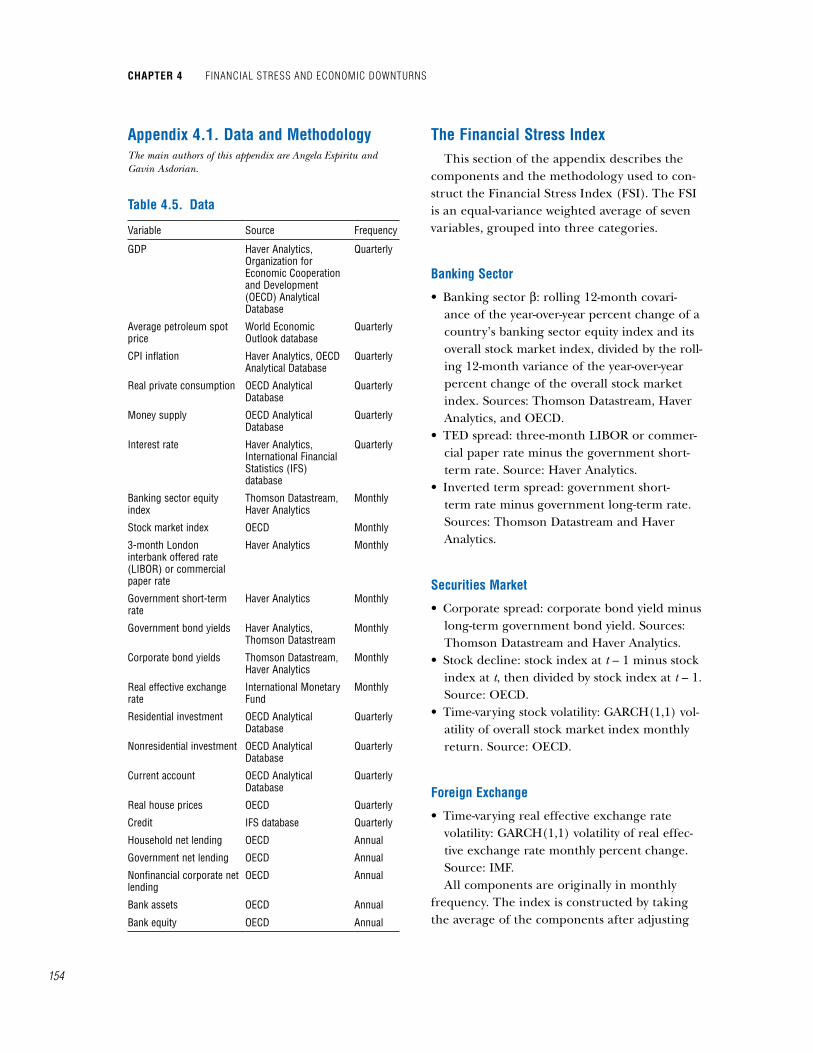
chapter 4 Financial StreSS and economic downturnS
154
appendix 4.1. data and methodologyThe main authors of this appendix are Angela Espiritu and Gavin Asdorian.
table 4.5. data
Variable Source Frequency
GDP Haver Analytics, Organization for Economic Cooperation and Development (OECD) Analytical Database
Quarterly
Average petroleum spot price
World Economic Outlook database
Quarterly
CPI inflation Haver Analytics, OECD Analytical Database
Quarterly
Real private consumption OECD Analytical Database
Quarterly
Money supply OECD Analytical Database
Quarterly
Interest rate Haver Analytics, International Financial Statistics (IFS) database
Quarterly
Banking sector equity index
Thomson Datastream, Haver Analytics
Monthly
Stock market index OECD Monthly
3-month London interbank offered rate (LIBOR) or commercial paper rate
Haver Analytics Monthly
Government short-term rate
Haver Analytics Monthly
Government bond yields Haver Analytics, Thomson Datastream
Monthly
Corporate bond yields Thomson Datastream, Haver Analytics
Monthly
Real effective exchange rate
International Monetary Fund
Monthly
Residential investment OECD Analytical Database
Quarterly
Nonresidential investment OECD Analytical Database
Quarterly
Current account OECD Analytical Database
Quarterly
Real house prices OECD Quarterly
Credit IFS database Quarterly
Household net lending OECD Annual
Government net lending OECD Annual
Nonfinancial corporate net lending
OECD Annual
Bank assets OECD Annual
Bank equity OECD Annual
the Financial Stress indexThis section of the appendix describes the
components and the methodology used to con-struct the Financial Stress Index (FSI). The FSI is an equal-variance weighted average of seven variables, grouped into three categories.
Banking Sector
• Banking sector β: rolling 12-month covari-ance of the year-over-year percent change of a country’s banking sector equity index and its overall stock market index, divided by the roll-ing 12-month variance of the year-over-year percent change of the overall stock market index. Sources: Thomson Datastream, Haver Analytics, and OECD.
• TED spread: three-month LIBOR or commer-cial paper rate minus the government short-term rate. Source: Haver Analytics.
• Inverted term spread: government short-term rate minus government long-term rate. Sources: Thomson Datastream and Haver Analytics.
Securities market
• Corporate spread: corporate bond yield minus long-term government bond yield. Sources: Thomson Datastream and Haver Analytics.
• Stock decline: stock index at t – 1 minus stock index at t, then divided by stock index at t – 1. Source: OECD.
• Time-varying stock volatility: GARCH(1,1) vol-atility of overall stock market index monthly return. Source: OECD.
Foreign exchange
• Time-varying real effective exchange rate volatility: GARCH(1,1) volatility of real effec-tive exchange rate monthly percent change. Source: IMF.All components are originally in monthly
frequency. The index is constructed by taking the average of the components after adjusting
155
for the sample mean and standardizing by the sample standard deviation. The index is then rebased so that it ranges from 0 to 100. Finally, it is converted into quarterly frequency by tak-ing the average of the monthly data. The FSI is available for 17 advanced economies starting in 1980.24
Episodes of financial stress are identified when the index is one standard deviation above its trend. Episodes that are only two quarters apart are considered a single episode. To clas-sify the cause of an episode of financial stress—either banking-related, securities-related, or foreign-exchange-related—we look at the change between the FSI from the quarter prior to the start of the episode and the maximum value of the FSI within the episode. If most of the increase stems from banking sector com-ponents, the FSI is classified as “banking.” The same rule applies if the change results mainly from the securities markets components or the foreign exchange component. Moreover, if banking contributes at least one-third of the change in the FSI, the episode is also classified as “banking-related.”
the cost of capital“Cost of capital” is defined in this chapter
as a weighted average of the real cost of bank loans, the real cost of debt, and the real cost of equity, using as weights the relative shares of equity, bonds, and loans in nonfinancial corporate liabilities. The cost of capital is based on the calculation outlined in Box 4 on p. 37 of the European Central Bank’s (ECB’s) March 2005 Monthly Bulletin. The real cost of bank loans, real cost of debt, and real cost of equity are derived as follows:• Real cost of bank loans: bank lending rates
minus one-year-forward Consensus inflation forecast. Sources: IFS, ECB, and Consensus Economics.
24Data on long-term corporate bond yields for Greece, Ireland, New Zealand, and Portugal were not available and therefore were excluded from the sample.
• Real cost of debt: corporate bond yield minus one-year-forward Consensus inflation forecast. Sources: Thomson Datastream, Haver Analyt-ics, and Consensus Economics.
• Real cost of equity: derived using a model specified in Box 2 on p. 76 of the ECB’s November 2004 Monthly Bulletin. Using avail-able data for the other variables, the real cost of equity, ht, can be calculated using the fol-lowing equation:
Dt[(1 + g) + 8(gtIBES – g)]
Pt = ———————————, ht – g
where Pt = real stock price, Dt = the current level of real dividends,gt
IBES = I/B/E/S long-term earnings-per-share growth forecast minus Consensus long-term inflation forecast,
g = long-term growth rate of real corpo-rate earnings, assumed constant at 2.5 percent.
The overall cost of capital is calculated as a weighted average of these three components with the weights defined, respectively, as loans, debt, and equity as shares of nonfinancial corpo-rate liabilities as reported in the OECD national accounts data.
Bankscope dataTwo data sets were constructed using bank-
level data obtained from the Bankscope database.25 The first data set included only investment banks as classified by the Bankscope database (“Investment Bank/Securities House”). The second data set, referenced in the chapter as “commercial banks,” included banks with the following Bankscope classifications: Commercial Bank, Savings Bank, Cooperative Bank, Real Estate/Mortgage Bank, and Medium & Long Term Credit Bank.
25Bankscope database published by Bureau van Dijk Electronic Publishing (BvDEP): www.bvdep.com.
appendix 4.1. data and metHodology
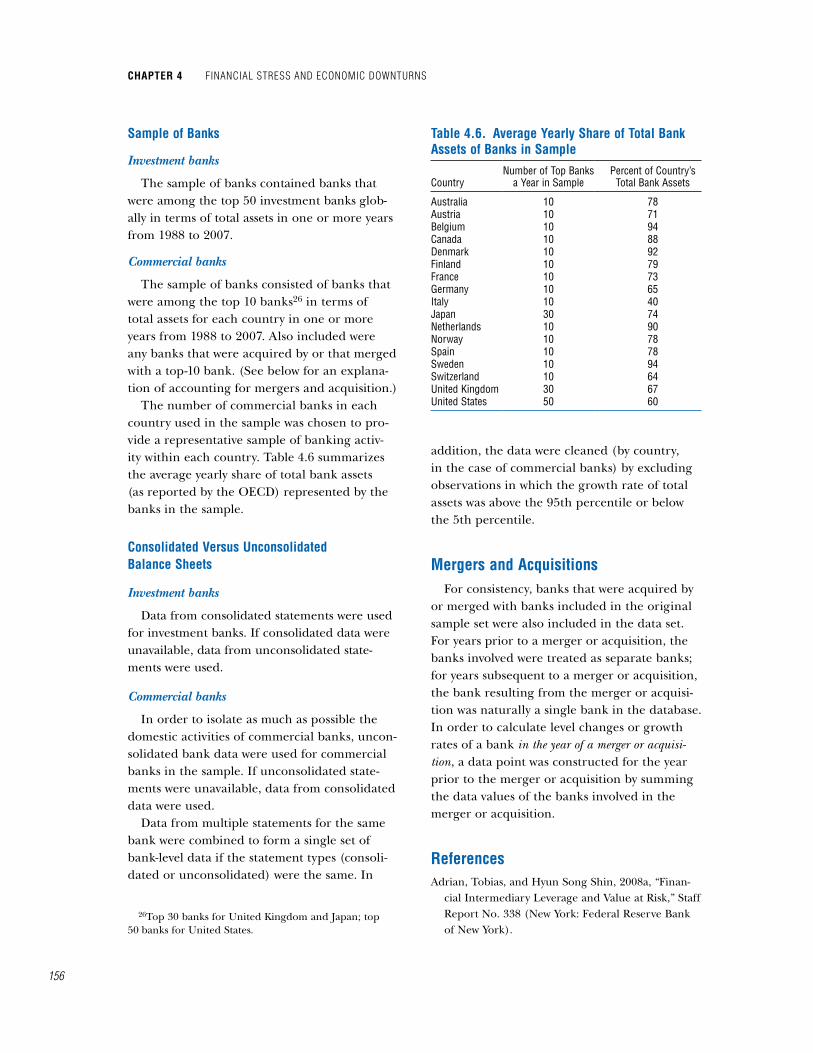
chapter 4 Financial StreSS and economic downturnS
156
Sample of Banks
Investment banks
The sample of banks contained banks that were among the top 50 investment banks glob-ally in terms of total assets in one or more years from 1988 to 2007.
Commercial banks
The sample of banks consisted of banks that were among the top 10 banks26 in terms of total assets for each country in one or more years from 1988 to 2007. Also included were any banks that were acquired by or that merged with a top-10 bank. (See below for an explana-tion of accounting for mergers and acquisition.)
The number of commercial banks in each country used in the sample was chosen to pro-vide a representative sample of banking activ-ity within each country. Table 4.6 summarizes the average yearly share of total bank assets (as reported by the OECD) represented by the banks in the sample.
consolidated Versus unconsolidated Balance Sheets
Investment banks
Data from consolidated statements were used for investment banks. If consolidated data were unavailable, data from unconsolidated state-ments were used.
Commercial banks
In order to isolate as much as possible the domestic activities of commercial banks, uncon-solidated bank data were used for commercial banks in the sample. If unconsolidated state-ments were unavailable, data from consolidated data were used.
Data from multiple statements for the same bank were combined to form a single set of bank-level data if the statement types (consoli-dated or unconsolidated) were the same. In
26Top 30 banks for United Kingdom and Japan; top 50 banks for United States.
addition, the data were cleaned (by country, in the case of commercial banks) by excluding observations in which the growth rate of total assets was above the 95th percentile or below the 5th percentile.
mergers and acquisitionsFor consistency, banks that were acquired by
or merged with banks included in the original sample set were also included in the data set. For years prior to a merger or acquisition, the banks involved were treated as separate banks; for years subsequent to a merger or acquisition, the bank resulting from the merger or acquisi-tion was naturally a single bank in the database. In order to calculate level changes or growth rates of a bank in the year of a merger or acquisi-tion, a data point was constructed for the year prior to the merger or acquisition by summing the data values of the banks involved in the merger or acquisition.
referencesAdrian, Tobias, and Hyun Song Shin, 2008a, “Finan-
cial Intermediary Leverage and Value at Risk,” Staff Report No. 338 (New York: Federal Reserve Bank of New York).
table 4.6. average Yearly Share of total Bank assets of Banks in Sample
CountryNumber of Top Banks
a Year in Sample Percent of Country’s
Total Bank Assets
Australia 10 78 Austria 10 71 Belgium 10 94 Canada 10 88 Denmark 10 92 Finland 10 79 France 10 73 Germany 10 65 Italy 10 40 Japan 30 74 Netherlands 10 90 Norway 10 78 Spain 10 78 Sweden 10 94 Switzerland 10 64 United Kingdom 30 67 United States 50 60
157
——— , 2008b, “Liquidity and Leverage,” Staff Report No. 328 (New York: Federal Reserve Bank of New York).
Altunbas, Yener, Leonardo Gambacorta, and David Marqués, 2007, “Securitisation and the Bank Lend-ing Channel,” ECB Working Paper No. 838 (Frank-furt am Main: European Central Bank).
Bayoumi, Tamim, and Ola Melander, 2008, “Credit Matters: Empirical Evidence on U.S. Macro-Finan-cial Linkages,” IMF Working Paper 08/169 (Wash-ington: International Monetary Fund).
Bernanke, Ben, and Mark Gertler, 1995, “Inside the Black Box: The Credit Channel of Monetary Policy Transmission,” Journal of Economic Perspectives, Vol. 9 (Autumn), pp. 27–48.
———, and Simon Gilchrist, 1999, “The Financial Accelerator in a Quantitative Business Cycle Frame-work,” Handbook of Macroeconomics, Vol. 1C (Amster-dam: North-Holland), pp. 1341–93.
Bernanke, Ben, Cara Lown, and Benjamin Friedman, 1991, “The Credit Crunch,” Brookings Papers on Eco-nomic Activity: 2, Brookings Institution, pp. 205–47.
Borio, Claudio, 2007, “Change and Constancy in the Financial System: Implications for Financial Distress and Policy,” BIS Working Paper No. 237 (Basel: Bank for International Settlements, October).
Calomiris, Charles W., Daniela Klingebiel, and Luc Laeven, 2005, “Financial Crisis Policies and Resolu-tion Mechanisms: A Taxonomy from Cross-Country Experience,” in Systemic Financial Crises: Containment and Resolution, ed. by Patrick Honohan and Luc Laeven (Cambridge, Massachusetts: Cambridge University Press), pp. 25–75.
Caprio, Gerard, and Daniela Klingebiel, 2003, “Episodes of Systematic and Borderline Financial Crises,” Dataset 1 (Washington: World Bank).
Cihak, Martin, and Petya Koeva Brooks, forthcoming, “From Subprime Loans to Subprime Growth? Evi-dence for the Euro Area,” Working Paper (Wash-ington: International Monetary Fund).
Claessens, Stijn, M. Ayhan Kose, and Marco E. Ter-rones, 2008, “What Happens During Recessions, Crunches and Busts?” (unpublished; Washington: International Monetary Fund, August 5).
Goodhart, Charles, 1996, “An Incentive Structure for Financial Regulation,” LSE Financial Markets Group Special Paper No. 88 (London: London School of Economics and Political Science, July).
Harding, Don, and Adrian Pagan, 2002, “Dissecting the Cycle: A Methodological Investigation,” Journal of Monetary Economics, Vol. 49 (March), pp. 365–81.
Hoelscher, David S., and Marc Quintyn, 2003, Manag-ing Systemic Banking Crises (Washington: Interna-tional Monetary Fund).
Honohan, Patrick, and Luc Laeven, eds., 2005, Finan-cial Crises: Containment and Resolution (Cambridge, Massachusetts: Cambridge University Press).
Illing, Mark, and Ying Liu, 2006, “Measuring Financial Stress in a Developed Country: An Application to Canada,” Journal of Financial Stability, Vol. 2 (Octo-ber), pp. 243–65.
International Monetary Fund (IMF), 2008, Global Financial Stability Report: Financial Stress and Dele-veraging—Macro-Financial Implications and Policy (Washington, October).
J.P. Morgan Research, 2008, “Credit and Growth: The Case of the Euro Area” (June 19).
Kaminsky, Graciela, and Carmen Reinhart, 1999, “The Twin Crises: The Causes of Banking and Balance-of-Payments Problems,” American Economic Review, Vol. 89 (June), pp. 473–500.
Kashyap, Anil, Raghuram Rajan, and Jeremy Stein, 2008, “Rethinking Capital Regulation,” paper prepared for the Federal Reserve Bank of Kansas City symposium, “Maintaining Stability in a Changing Financial Sys-tem,” Jackson Hole, Wyoming, August 21–23.
Kashyap, Anil, and Jeremy Stein, 1995, “The Impact of Monetary Policy on Bank Balance Sheets,” Carnegie-Rochester Conference Series on Public Policy, Vol. 42 (June), pp. 151–95.
Kindleberger, Charles, and Robert Aliber, 2005, Manias, Panics, and Crashes: A History of Financial Crises (Hoboken, New Jersey: John Wiley & Sons, 5th ed.).
Kiyotaki, Nobuhiro, and John Moore, 1997, “Credit Cycles,” Journal of Political Economy, Vol. 105 (April), pp. 211–48.
Laeven, Luc, and Fabian Valencia, forthcoming, “Sys-temic Banking Crises: A New Database” Working Paper (Washington: International Monetary Fund).
Leamer, Edward, 2007, “Housing Is the Business Cycle,” presented at the Jackson Hole Symposium on Housing, Housing Finance, and Monetary Policy, August 30–September 1, 2007.
Minsky, Hyman, 1992, “The Financial Instability Hypothesis,” Jerome Levy Economics Institute Working Paper No. 74 (Annandale-on-Hudson, New York: Bard College, May).
Peek, Joe, and Eric Rosengren, 1995, “The Capital Crunch: Neither a Borrower Nor a Lender Be,” Journal of Money, Credit and Banking, Vol. 27, No. 3, pp. 625–38.
reFerenceS
chapter 4 Financial StreSS and economic downturnS
158
Rajan, Raghuram, and Luigi Zingales, 2003, “Banks and Markets: The Changing Character of European Finance,” CEPR Discussion Paper No. 3865 (London: Centre for Economic Policy Research).
Reinhart, Carmen, and Kenneth Rogoff, 2004, “The Modern History of Exchange Rate Arrangements: A Reinterpretation,” Quarterly Journal of Economics, Vol. 119, No. 1 (February), pp. 1–48.
———, 2008, “Is the 2007 U.S. Sub-Prime Financial Crisis So Different? An International Historical
Comparison,” NBER Working Paper No. 13761 (Cambridge, Massachusetts: National Bureau of Economic Research).
Shiller, Robert J., 1999, “Measuring Bubble Expec-tations and Investor Confidence,” NBER Work-ing Paper No. 7008 (Cambridge, Massachusetts: National Bureau of Economic Research).
Shin, Hyun Song, 2008, “Reflections on Modern Bank Runs: A Case Study of Northern Rock,” Working Paper (unpublished; Princeton, New Jersey: Prince-ton University).