Embed Size (px)
Citation preview
This is an Author Accepted Manuscript copy of an article accepted for publication in Research Policy (2/14/2014).
1
Identifying emerging topics in science and technology1
Henry Smalla, Kevin W. Boyackb* and Richard Klavansc a
[email protected] SciTech Strategies, Inc., 105 Rolling Road, Bala Cynwyd, PA 19004 USA
SciTech Strategies, Inc., 8421 Manuel Cia Pl. NE, Albuquerque, NM 87122 USA Phone: 1-505-856-1267
SciTech Strategies, Inc., 2405 White Horse Road, Berwyn, PA 19312 USA
* Corresponding author Abstract The identification of emerging topics is of current interest to decision makers in both government and industry. Although many case studies present retrospective analyses of emerging topics, few studies actually nominate emerging topics for consideration by decision makers. We present a novel approach to identifying emerging topics in science and technology. Two large scale models of the scientific literature, one based on direct citation, and the other based on co-citation, are combined to nominate emerging topics using a difference function that rewards clusters that are new and growing rapidly. The top 25 emergent topics are identified for each year 2007 through 2010. These topics are classified and characterized in various ways in order to understand the motive forces behind their emergence, whether scientific discovery, technological innovation, or exogenous events. Topics are evaluated by searching for recent major awards associated with the topic or its key researchers. The evidence presented suggests that the methodology nominates a viable list of emerging topics suitable for inspection by decision makers.
Keywords citation-based modeling; emerging topics; scientific discovery, technological innovation; exogenous events
1 Introduction The evolution of topics, including emerging topics in science and technology, has been of interest to governments, companies, and individual scientists for a number of years. Sponsored research in this area has come in waves. For example, in the United States the NSF TRACES program of the 1960s attempted to trace important events in the R&D process. DARPA's Topic Detection and Tracking (TDT) program started in the late 1990's and ran for several years. More recently, IARPA's Foresight and Understanding from Scientific Exposition (FUSE) program (http://www.iarpa.gov/Programs/ia/FUSE/fuse.html) was funded in 2011 to "develop automated methods that aid in the systematic, continuous, and comprehensive assessment of technical emergence using information found in published scientific, technical, and patent literature." The recent America Competes Act explicitly
1 A preliminary version of this paper based on 2010 data only was presented at the ISSI 2013 conference (Small et al., 2013).
This is an Author Accepted Manuscript copy of an article accepted for publication in Research Policy (2/14/2014).
2
mentions identification of emerging and innovative areas as a specific goal. Today there are conferences and societies dedicated to the study of emerging technologies. Despite this long-term and recent interest in emerging technologies and its prominence as a topic of interest – a Scopus search for "emerging technology(ies)" returns over 13,000 articles – identification of emerging topics in science and technology remains a challenge. In a recent review of definitions and techniques, Cozzens et al. (2010) report that most studies of emerging technologies are retrospective analyses of pre-determined areas rather than methodological studies designed to identify emerging technologies. For example, Takeda et al. (2009) named nanobiotechnology as an emerging and important domain within nanotechnology, and then used bibliometric techniques to characterize the structure of topics within that domain. While characterization of recent work is important and helps current participants in a technology to understand its history and landscape, these types of studies cannot identify the currently emerging topics that are of interest to funding bodies and practitioners worldwide. Few studies have proposed techniques to identify emerging topics and fewer still have nominated a list of emerging topics from the literature. This study proposes a new technique for identifying emerging topics from a broad citation database, and uses that technique to nominate over 70 topics from recent years as emergent. These topics are characterized in terms of their key inception events and motive forces, applications and various metrics. Evidence is gathered and presented to show that these topics and their key researchers are extraordinary in many ways, thus suggesting that the methodology produces very useful results. This paper proceeds with a discussion of related work, which is followed by descriptions of the new technique, nominated emergent topics and their characterization, evidence associated with those topics, and a discussion of the results in the context of science policy.
2 Related Work 2.1 Defining emergence The concept of emergence is one that is "widely used but seldom defined" (Cozzens et al., 2010), even among studies of emerging technologies. This is perhaps due to the fact that the term emergence is used in many different ways (Corning, 2002, de Haan, 2006). As it relates to topics in science and technology, Alexander et al. (2012) provide a history of emergence and its various usages. Goldstein (1999) ascribed the following properties to emergence: radical novelty; coherence, correlation, wholeness; global or macro; dynamical (not pre-given wholes); and ostensive, perceivable. When comparing these properties with those from other definitions, there is nearly universal agreement on two properties associated with emergence – novelty (or newness) and growth. 2.2 Identifying emergent topics While most retrospective analyses of emerging technologies have been focused simply on characterization of their topics of interest, some few studies have been conducted to develop methods to more easily identify emerging topics. Cozzens et al. (2010) classified these automated methods into two main groups – 1) searching for rapid growth of publications in an existing category or vocabulary (e.g., MeSH) structure, and 2) data mining, which is further characterized as creating structure from a data set using co-occurrence clustering (e.g., co-author, co-word, co-citation) and looking for emergence within that structure. A third group allowed for combinations of these two main approach types.
This is an Author Accepted Manuscript copy of an article accepted for publication in Research Policy (2/14/2014).
3
Of the methods based on identification of rapid growth within categories or vocabularies, the burst detection approach of Kleinberg (2002) is perhaps the most widely used. Kleinberg models time-dependent data using an infinite-state automaton; bursts appear naturally as state transitions. Although originally designed to analyze data streams (e.g., news articles), it has been widely adopted for bibliometrics use (cf., Mane and Börner, 2004) and has been incorporated in larger tool sets such as Citespace II (Chen, 2006), Sci2, and the Network Workbench (Börner et al., 2010). Other studies have used simpler approaches. For example, Ohniwa, Hibino and Takeyasu (2010) identified emerging MeSH terms in seven different five year periods from 1972-2006 by calculating an increment rate for each term and time period, defined as the number of times each term occurred during the final two years divided by the number of times the term occurred during the first three years of the time period. Those terms with the highest increment rate are the most emergent terms. The use of five year periods damped out year-to-year fluctuations in the data, leading to a compelling historical view of the ebb and flow of topics. However, the large time window also makes the method less useful from a recency standpoint. The use of data mining to create structure (through clustering) which is then analyzed for emergent subtopics has also been explored in different ways. Nearly fifty years ago Garfield (Garfield et al., 1964) pioneered the 'historiograph', using direct citation linkages to show the dominant evolutionary pathways within a research topic. Later, clusters of highly co-cited documents that were linked from year to year were used to detect emergence (Small, 1977). Small identified hot fields (i.e., what we might now call emergent topics) as those clusters with a high number of recent papers and a high mean publication year. Although thresholds and normalizations have changed (Small, 1999, Boyack and Klavans, 2014), the basic process of creating annual co-citation clusters and linking those annual clusters into longitudinal strands or threads has changed very little over the past 35 years. Upham and Small (2010) defined research fronts (co-citation clusters) using ISI (now Thomson Web of Science) data from 1999-2004 to identify the top 20 emergent topics within that set. Chen and colleagues used a combination of co-citation analysis and burst detection to characterize emerging trends in the fields of mass extinction and terrorism (Chen, 2006), peptic ulcer, gene targeting and string theory (Chen et al., 2009) and regenerative medicine (Chen et al., 2012). They found that the most emergent clusters were typically associated with key articles that experienced not only a burst in citation counts but which also exhibited high betweenness centrality. In other words, these were clusters that were based on key discoveries that effectively bridged two or more existing topics. Co-citation is not the only clustering approach that has been used to identify emerging topics. Hopcroft et al. (2004) identified several emerging communities using bibliographic coupling with the Citeseer database, comparing clusterings from two different time periods (1990-1998 and 1990-2001). They found that although small changes in the data typically led to significant changes in the clusters, using those few clusters that remained largely unchanged over several clustering runs produced good results. Direct citation, the technique at the core of Garfield's historiography, was later used by Shibata and colleagues (Shibata et al., 2008, Shibata et al., 2010) to cluster sets of documents on gallium nitride, complex networks, and regenerative medicine. Annual clusterings were done with a fixed starting year – e.g., 1990-2000, 1990-2001, 1990-2002, etc. – and clusters from each model with high overlap were matched and linked to show evolution in field structure. This method is capable of effectively showing births, deaths, splits, and merges in the cluster structure.
This is an Author Accepted Manuscript copy of an article accepted for publication in Research Policy (2/14/2014).
4
Methods that combine growth in vocabularies with rigorous cluster analysis are less common than either of the constituent approaches. Schiebel, Roche and colleagues (Roche et al., 2010, Schiebel et al., 2010) classify keywords from field-based subsets of the PASCAL database as unusual terms, established terms, or cross-section terms based on their relative frequencies. Cluster analysis is used to link clusters of terms between two time periods, and emergent terms are identified as those unusual terms that become established or cross-section in the later time period. Guo, Weingart and Börner (2011) propose a model that simultaneously looks at bursting keywords, growth in number of authors, and changes in the interdisciplinarity of cited references. Results of their study show that emergent areas of science are consistent with a pattern where rapid growth in the number of authors is followed by an increase in the interdisciplinarity of cited references, and then finally by bursts in the keyword structure. Two relatively recent studies are not easily classified into either of our two main groups of emergence detection methods. Tu and Seng (2012) suggest that the measurement of novelty should be a key part of the identification of novel topics, and define an emergence point at the intersection between a novelty index (1/age) and the cumulative growth curve for a topic. Unfortunately, this method requires sufficient time for the growth curve to be known, and thus cannot be used accurately for recent topics. Bettencourt, Kaiser and Kaur (2009) use network analysis to show that the collaboration pattern among researchers within an emergent topic experiences a distinct and rapid topological transition from small disconnected graphs to a large connected component. Although most of the studies mentioned above listed emerging topics within the fields they studied, only the work by Small (Small, 2006, Upham and Small, 2010) has nominated lists of emerging topics across a wide swath of science. The only other studies of which we are aware that have nominated emergent topics across the sciences are more traditional foresight studies that have relied upon human input. For example, Katz et al. (2001) used co-citation analysis to select highly co-cited articles, and then obtained 190 short-term and 111 long-term predictions of emerging developments from authors of those articles. Although studies like this take advantage of the tacit knowledge of scholars, they also take a tremendous amount of time and effort to conduct. This study differs from the studies listed above in several important ways. First, and perhaps most importantly, we develop a methodology that enables analysis that is far more global than any such analysis done to date. While most previous studies have considered only the literature on a topic, thus limiting the context in which the results can be interpreted, our methodology works on an entire corpus of literature, such as the citation databases of Scopus or the Web of Science. Results can thus be interpreted from a more global perspective. Second, most previous studies have been of the case study variety where a literature search is conducted for a specific topic expected to be emergent, and then methods are used to verify that, in fact, emergence has occurred, or to characterize which subparts have been the most emergent. In contrast, our new methodology requires no upfront assumption as to whether a particular topic might be emergent or not. Finally, most previous studies have been highly retrospective, looking back at emergence that occurred five, ten, or even thirty years ago. Our new methodology allows emergent topics to be identified as they are emerging. 3 Methodology A new methodology for identification of emerging topics from large citation databases is developed in this article. Briefly, the Scopus database (1996-2010, over 17 million articles) is

This is an Author Accepted Manuscript copy of an article accepted for publication in Research Policy (2/14/2014).
5
clustered in two different ways, thus creating two separate global models of the literature. One model is based on co-citation (after the manner of Small) and the other is based on direct citation (after the manner of Garfield). Although both models are citation-based, they have different distributional characteristics and reflect two different organizing principles. These two models are intersected to identify those clusters of activity that most dramatically exhibit the two nearly universal properties of emergence mentioned above – newness and growth – across both models at particular points in time. Descriptions of both models and of the process for nominating emergent clusters are given below. 3.2 Co-citation model The global co-citation model was created using a multi-step process (see Figure 1). First, clusters of cited papers are created for each separate year within the citation database. Second, current papers from the annual slice are assigned to the clusters of cited references based on their bibliographies. Each cluster thus consists of current year papers and the group of common cited references that most informed the current work. These annual clusters tend to be small (14 current papers and 25 reference papers, on average) and narrowly focused at the scientific problem level. Finally, clusters from adjacent years are linked using shared reference papers into cluster strings (called threads), which turns a series of static views of the structure of science into a dynamic view. A detailed protocol is available in Boyack and Klavans (2014).
Figure 1. Conceptual view of two global models of science.
Co-citation threads defined in this manner tend to be of short duration because the groups of references that are cited in common by multiple authors (which is what defines threads) can shift rapidly. Most threads only last a single year; these reflect failed experiments and the shifting focus of individual researchers as they assimilate recent results from themselves and others. Of those threads that last two or more years, the average thread duration is 3.7 years. For purposes of this study, we define "new" threads for a given year to be those that begin in the previous or current year, that is, are only one or two years old. Using this logic, Table 1 shows that roughly 55% of papers in the co-citation model are in threads that most closely meet the "newness" requirement of emergence. Table 1 also shows that the co-citation model has very high coverage – nearly 96% of papers with at least one reference from Scopus are included in this model.

This is an Author Accepted Manuscript copy of an article accepted for publication in Research Policy (2/14/2014).
6
Table 1. Characteristics of the two global models of the literature.
Year # Papers with references
% Coverage CC model
%CC <3 yr old
% Coverage DC model
%DC <3 yr old
1996 790,167 95.2% 84.6% 1997 813,002 95.3% 87.4% 1998 827,847 95.3% 54.7% 89.8% 16.5% 1999 847,523 95.3% 54.9% 91.6% 10.1% 2000 919,062 95.4% 56.7% 92.1% 8.0% 2001 1,008,232 95.7% 58.2% 92.4% 7.0% 2002 1,046,624 96.0% 57.9% 92.4% 5.8% 2003 1,122,955 96.2% 57.4% 92.8% 4.6% 2004 1,261,328 96.1% 58.5% 92.7% 3.9% 2005 1,385,243 96.2% 57.7% 92.8% 2.7% 2006 1,510,164 96.1% 56.4% 92.9% 1.6% 2007 1,617,817 95.6% 54.9% 92.6% 1.0% 2008 1,721,399 95.6% 54.2% 92.3% 0.5% 2009 1,827,891 96.0% 53.8% 92.2% 0.3% 2010 1,875,218 96.4% 53.9% 92.2% 0.1% ALL 18,574,472 95.8% 91.8%
3.2 Direct citation model Creation of the direct citation model is much simpler both conceptually and in practice (see Figure 1). Citation links between articles are used to create clusters of articles using the full set of Scopus articles in a single clustering process. Direct citation clustering was done using the VOS methodology and algorithm recently developed by Waltman and Van Eck (2012) at Leiden University.2 This algorithm uses a variant of modularity-based clustering, which attempts to maximize the ratio of links within clusters to links between clusters. To account for the different linkage degrees of different papers (outlinks and inlinks, or citing and cited links), each link is normalized by the number of references in the citing paper, and K50 (modified cosine) values are then calculated from the full matrix. Rather than using all links, we reduce the size of the calculation by filtering links, keeping up to 15 links (based on the highest K50 values) per paper (Boyack and Klavans, 2010). The resulting set of papers and filtered links is used as input to the VOS clustering code. Direct citation at this global scale essentially scales up the original local methods of Price (1965) and Garfield et al. (1964), creating, in effect, a large set of detailed historiographs. Direct citation tends to create clusters that are somewhat broader conceptually and of much longer duration than are the co-citation threads. Over half of the 84,163 direct citation clusters in our model lasted for all 15 years. In addition, the birth and death years for direct citation clusters are not as clearly delineated as are the births and deaths of co-citation threads. In part, this is because co-citation threads are only allowed to link sequential years, while many direct citation clusters skip publication years once they have started. We consider the start of a direct citation cluster to be the year at which the cluster has enough critical mass to continue into the future – in other words, we consider a leading tail with only a few papers per year to be a pre-
2 The VOS clustering code was run 10 times at a single level with a minimum cluster size (nmin) of 20, and resolution (r) of 5 x 10⁻⁵. VOS employs a quality function which rewards links between papers in the same cluster and penalizes links between papers in different clusters. Of the 10 VOS solutions, we used the single solution that maximized the quality function as our model.
This is an Author Accepted Manuscript copy of an article accepted for publication in Research Policy (2/14/2014).
7
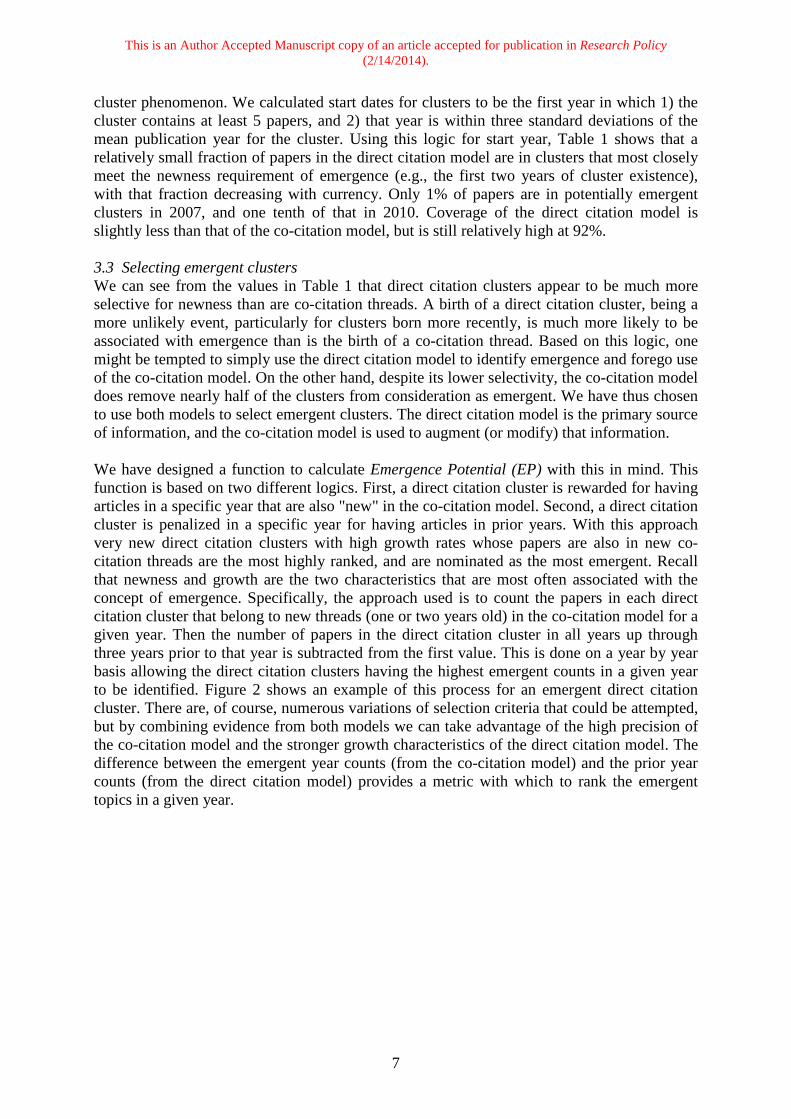
cluster phenomenon. We calculated start dates for clusters to be the first year in which 1) the cluster contains at least 5 papers, and 2) that year is within three standard deviations of the mean publication year for the cluster. Using this logic for start year, Table 1 shows that a relatively small fraction of papers in the direct citation model are in clusters that most closely meet the newness requirement of emergence (e.g., the first two years of cluster existence), with that fraction decreasing with currency. Only 1% of papers are in potentially emergent clusters in 2007, and one tenth of that in 2010. Coverage of the direct citation model is slightly less than that of the co-citation model, but is still relatively high at 92%. 3.3 Selecting emergent clusters We can see from the values in Table 1 that direct citation clusters appear to be much more selective for newness than are co-citation threads. A birth of a direct citation cluster, being a more unlikely event, particularly for clusters born more recently, is much more likely to be associated with emergence than is the birth of a co-citation thread. Based on this logic, one might be tempted to simply use the direct citation model to identify emergence and forego use of the co-citation model. On the other hand, despite its lower selectivity, the co-citation model does remove nearly half of the clusters from consideration as emergent. We have thus chosen to use both models to select emergent clusters. The direct citation model is the primary source of information, and the co-citation model is used to augment (or modify) that information. We have designed a function to calculate Emergence Potential (EP) with this in mind. This function is based on two different logics. First, a direct citation cluster is rewarded for having articles in a specific year that are also "new" in the co-citation model. Second, a direct citation cluster is penalized in a specific year for having articles in prior years. With this approach very new direct citation clusters with high growth rates whose papers are also in new co-citation threads are the most highly ranked, and are nominated as the most emergent. Recall that newness and growth are the two characteristics that are most often associated with the concept of emergence. Specifically, the approach used is to count the papers in each direct citation cluster that belong to new threads (one or two years old) in the co-citation model for a given year. Then the number of papers in the direct citation cluster in all years up through three years prior to that year is subtracted from the first value. This is done on a year by year basis allowing the direct citation clusters having the highest emergent counts in a given year to be identified. Figure 2 shows an example of this process for an emergent direct citation cluster. There are, of course, numerous variations of selection criteria that could be attempted, but by combining evidence from both models we can take advantage of the high precision of the co-citation model and the stronger growth characteristics of the direct citation model. The difference between the emergent year counts (from the co-citation model) and the prior year counts (from the direct citation model) provides a metric with which to rank the emergent topics in a given year.
This is an Author Accepted Manuscript copy of an article accepted for publication in Research Policy (2/14/2014).
8
Figure 2. Calculation of Emergence Potential (EP) using a direct citation cluster on
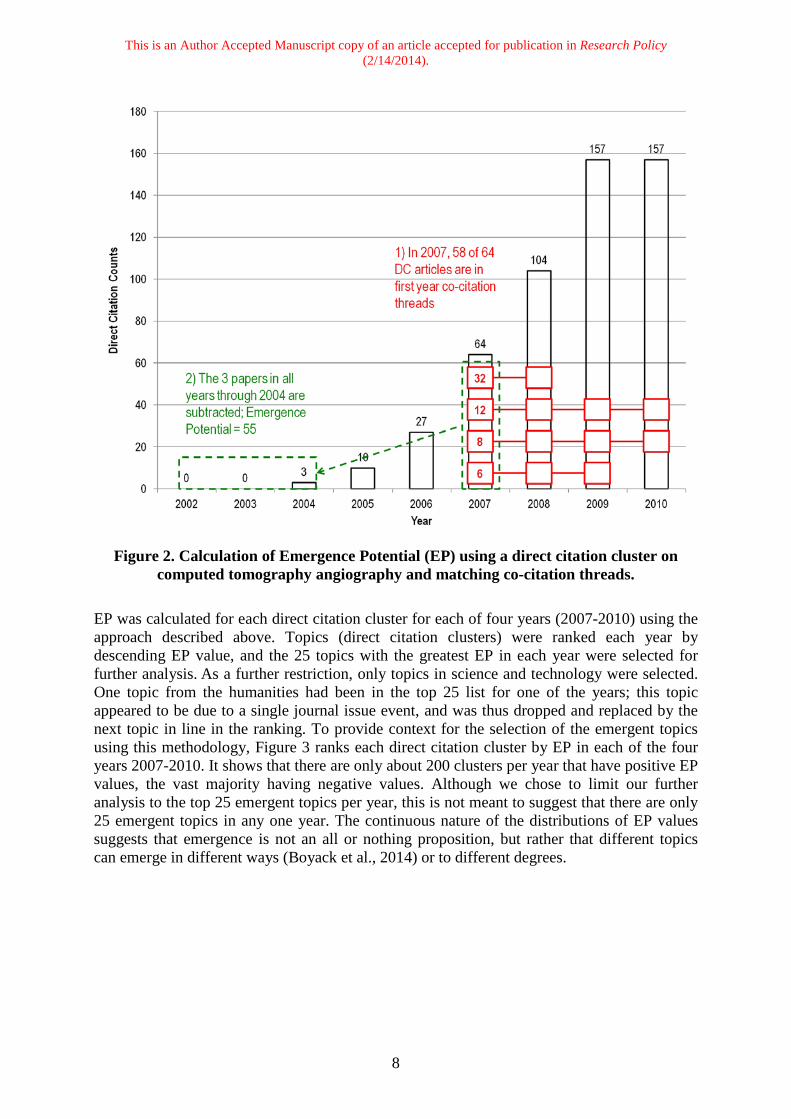
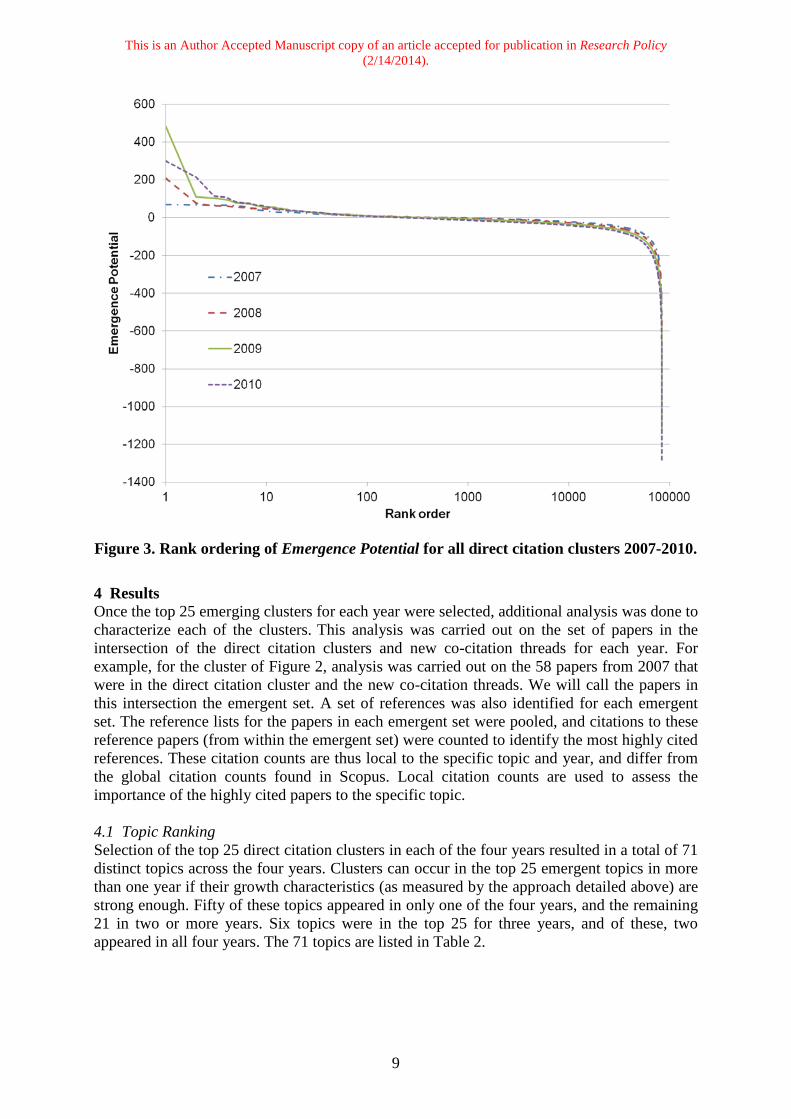
computed tomography angiography and matching co-citation threads. EP was calculated for each direct citation cluster for each of four years (2007-2010) using the approach described above. Topics (direct citation clusters) were ranked each year by descending EP value, and the 25 topics with the greatest EP in each year were selected for further analysis. As a further restriction, only topics in science and technology were selected. One topic from the humanities had been in the top 25 list for one of the years; this topic appeared to be due to a single journal issue event, and was thus dropped and replaced by the next topic in line in the ranking. To provide context for the selection of the emergent topics using this methodology, Figure 3 ranks each direct citation cluster by EP in each of the four years 2007-2010. It shows that there are only about 200 clusters per year that have positive EP values, the vast majority having negative values. Although we chose to limit our further analysis to the top 25 emergent topics per year, this is not meant to suggest that there are only 25 emergent topics in any one year. The continuous nature of the distributions of EP values suggests that emergence is not an all or nothing proposition, but rather that different topics can emerge in different ways (Boyack et al., 2014) or to different degrees.
This is an Author Accepted Manuscript copy of an article accepted for publication in Research Policy (2/14/2014).
9
Figure 3. Rank ordering of Emergence Potential for all direct citation clusters 2007-2010. 4 Results Once the top 25 emerging clusters for each year were selected, additional analysis was done to characterize each of the clusters. This analysis was carried out on the set of papers in the intersection of the direct citation clusters and new co-citation threads for each year. For example, for the cluster of Figure 2, analysis was carried out on the 58 papers from 2007 that were in the direct citation cluster and the new co-citation threads. We will call the papers in this intersection the emergent set. A set of references was also identified for each emergent set. The reference lists for the papers in each emergent set were pooled, and citations to these reference papers (from within the emergent set) were counted to identify the most highly cited references. These citation counts are thus local to the specific topic and year, and differ from the global citation counts found in Scopus. Local citation counts are used to assess the importance of the highly cited papers to the specific topic. 4.1 Topic Ranking Selection of the top 25 direct citation clusters in each of the four years resulted in a total of 71 distinct topics across the four years. Clusters can occur in the top 25 emergent topics in more than one year if their growth characteristics (as measured by the approach detailed above) are strong enough. Fifty of these topics appeared in only one of the four years, and the remaining 21 in two or more years. Six topics were in the top 25 for three years, and of these, two appeared in all four years. The 71 topics are listed in Table 2.
This is an Author Accepted Manuscript copy of an article accepted for publication in Research Policy (2/14/2014).
10
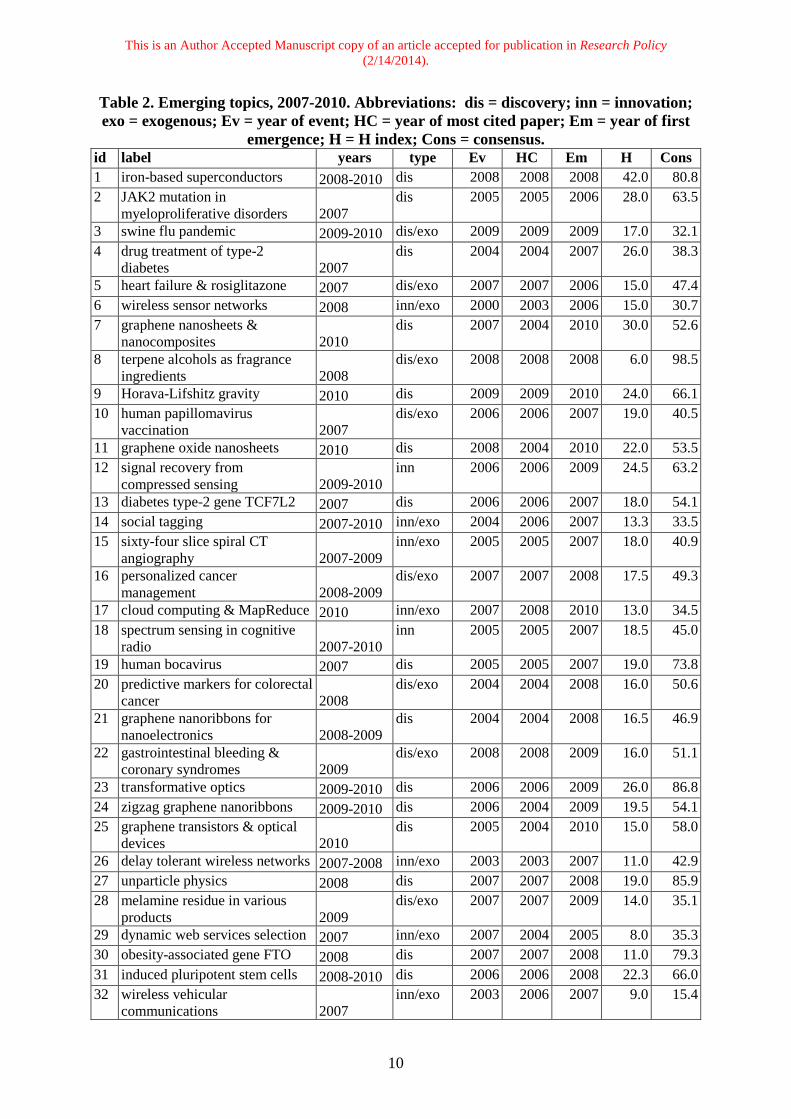
Table 2. Emerging topics, 2007-2010. Abbreviations: dis = discovery; inn = innovation; exo = exogenous; Ev = year of event; HC = year of most cited paper; Em = year of first
emergence; H = H index; Cons = consensus. id label years type Ev HC Em H Cons 1 iron-based superconductors 2008-2010 dis 2008 2008 2008 42.0 80.8 2 JAK2 mutation in
myeloproliferative disorders 2007 dis 2005 2005 2006 28.0 63.5
3 swine flu pandemic 2009-2010 dis/exo 2009 2009 2009 17.0 32.1 4 drug treatment of type-2
diabetes 2007 dis 2004 2004 2007 26.0 38.3
5 heart failure & rosiglitazone 2007 dis/exo 2007 2007 2006 15.0 47.4 6 wireless sensor networks 2008 inn/exo 2000 2003 2006 15.0 30.7 7 graphene nanosheets &
nanocomposites 2010 dis 2007 2004 2010 30.0 52.6
8 terpene alcohols as fragrance ingredients 2008
dis/exo 2008 2008 2008 6.0 98.5
9 Horava-Lifshitz gravity 2010 dis 2009 2009 2010 24.0 66.1 10 human papillomavirus
vaccination 2007 dis/exo 2006 2006 2007 19.0 40.5
11 graphene oxide nanosheets 2010 dis 2008 2004 2010 22.0 53.5 12 signal recovery from
compressed sensing 2009-2010 inn 2006 2006 2009 24.5 63.2
13 diabetes type-2 gene TCF7L2 2007 dis 2006 2006 2007 18.0 54.1 14 social tagging 2007-2010 inn/exo 2004 2006 2007 13.3 33.5 15 sixty-four slice spiral CT
angiography 2007-2009 inn/exo 2005 2005 2007 18.0 40.9
16 personalized cancer management 2008-2009
dis/exo 2007 2007 2008 17.5 49.3
17 cloud computing & MapReduce 2010 inn/exo 2007 2008 2010 13.0 34.5 18 spectrum sensing in cognitive
radio 2007-2010 inn 2005 2005 2007 18.5 45.0
19 human bocavirus 2007 dis 2005 2005 2007 19.0 73.8 20 predictive markers for colorectal
cancer 2008 dis/exo 2004 2004 2008 16.0 50.6
21 graphene nanoribbons for nanoelectronics 2008-2009
dis 2004 2004 2008 16.5 46.9
22 gastrointestinal bleeding & coronary syndromes 2009
dis/exo 2008 2008 2009 16.0 51.1
23 transformative optics 2009-2010 dis 2006 2006 2009 26.0 86.8 24 zigzag graphene nanoribbons 2009-2010 dis 2006 2004 2009 19.5 54.1 25 graphene transistors & optical
devices 2010 dis 2005 2004 2010 15.0 58.0
26 delay tolerant wireless networks 2007-2008 inn/exo 2003 2003 2007 11.0 42.9 27 unparticle physics 2008 dis 2007 2007 2008 19.0 85.9 28 melamine residue in various
products 2009 dis/exo 2007 2007 2009 14.0 35.1
29 dynamic web services selection 2007 inn/exo 2007 2004 2005 8.0 35.3 30 obesity-associated gene FTO 2008 dis 2007 2007 2008 11.0 79.3 31 induced pluripotent stem cells 2008-2010 dis 2006 2006 2008 22.3 66.0 32 wireless vehicular
communications 2007 inn/exo 2003 2006 2007 9.0 15.4
This is an Author Accepted Manuscript copy of an article accepted for publication in Research Policy (2/14/2014).
11
33 cardiovascular events in type-2 diabetes 2008-2010
dis/exo 2008 2008 2008 12.3 57.6
34 multi-channel wireless mesh networks 2007
inn/exo 2006 2005 2007 8.0 37.7
35 crystallographic software 2008-2009 inn/exo 2007 2007 2008 7.5 92.9 36 cognitive radio with spectrum
sharing 2008-2009 inn/exo 2003 2005 2008 11.5 52.0
37 spectrum allocation in cognitive radio 2010
inn/exo 2005 2005 2010 11.0 28.8
38 two-way relay wireless networks 2008-2009
inn 2000 2000 2008 12.5 37.9
39 late thrombosis with drug-eluting stents 2007
dis 2005 2005 2006 29.0 45.2
40 bortezomib in relapsed multiple myeloma 2008
dis 2005 2005 2008 16.0 29.0
41 IDH1 & IDH2 mutations in cancer 2010
dis 2009 2009 2010 16.0 75.0
42 RFID & supply chain management 2007
inn/exo 2003 2005 2007 9.0 14.5
43 epitaxial graphene 2010 dis 2006 2004 2010 23.0 58.8 44 COX-2 drugs & myocardial
infarction risk 2007 dis/exo 2004 2005 2005 12.0 33.9
45 policy issues in cognitive radio 2007, 2009 inn/exo 2003 2005 2007 11.0 31.6 46 swine flu pandemic & seasonal
flu 2010 dis/exo 2009 2009 2010 10.0 39.1
47 quantum transport properties of graphene 2007-2008
dis 2005 2005 2007 15.5 66.6
48 metabolic syndrome definition in Japan 2007
dis/exo 2006 2001 2006 9.0 29.1
49 crystallographic validation 2010 inn/exo 2009 2009 2010 10.0 95.5 50 energy-efficient wireless sensor
networks 2007 inn 2004 2004 2006 10.0 40.8
51 security in vehicular ad hoc networks 2008
inn/exo 2006 2007 2008 7.0 33.3
52 comparative effectiveness of medical treatments 2009
inn/exo 2009 2009 2009 5.0 12.0
53 metabolic syndrome & cardiovascular disease 2007
dis/exo 2005 2005 2006 15.0 46.3
54 influenza virus transmission 2009 dis/exo 2009 2007 2009 8.0 19.7 55 mechanical properties of
graphene 2010 dis 2008 2008 2010 16.0 50.0
56 web services & mashups 2008-2009 inn/exo 2004 2005 2008 5.5 15.5 57 pandemic control measures 2007 dis/exo 2004 2005 2006 13.0 42.6 58 nanotechnology risk analysis 2008 dis/exo 2007 2005 2008 6.0 18.9 59 microRNAs & cancer 2009 dis 2006 2006 2009 14.0 47.2 60 metal-organic frameworks 2009-2010 dis/exo 2009 2008 2009 15.0 35.3 61 social networks 2010 inn/exo 2006 2007 2010 7.0 26.2 62 network-on-chip 2007 inn 2001 2002 2004 17.0 38.4 63 materials for sorption of organic
pollutants 2008 dis/exo 2004 1999 2008 13.0 27.4
64 cooperative diversity in wireless networks 2007
inn 2004 2004 2007 8.0 42.9
This is an Author Accepted Manuscript copy of an article accepted for publication in Research Policy (2/14/2014).
12
65 cloud computing 2010 inn/exo 2006 2009 2010 10.0 31.4 66 noble metal nanocrystals 2009-2010 dis 2007 2007 2009 12.5 44.2 67 distributed consensus in multi-
agent networks 2007 inn 2004 2004 2007 14.0 43.3
68 microporous metal-organic frameworks 2008
dis 2004 2004 2008 13.0 46.0
69 RNA-seq & ultra-high-throughput-sequencing 2009
dis/exo 2008 2008 2009 11.0 38.7
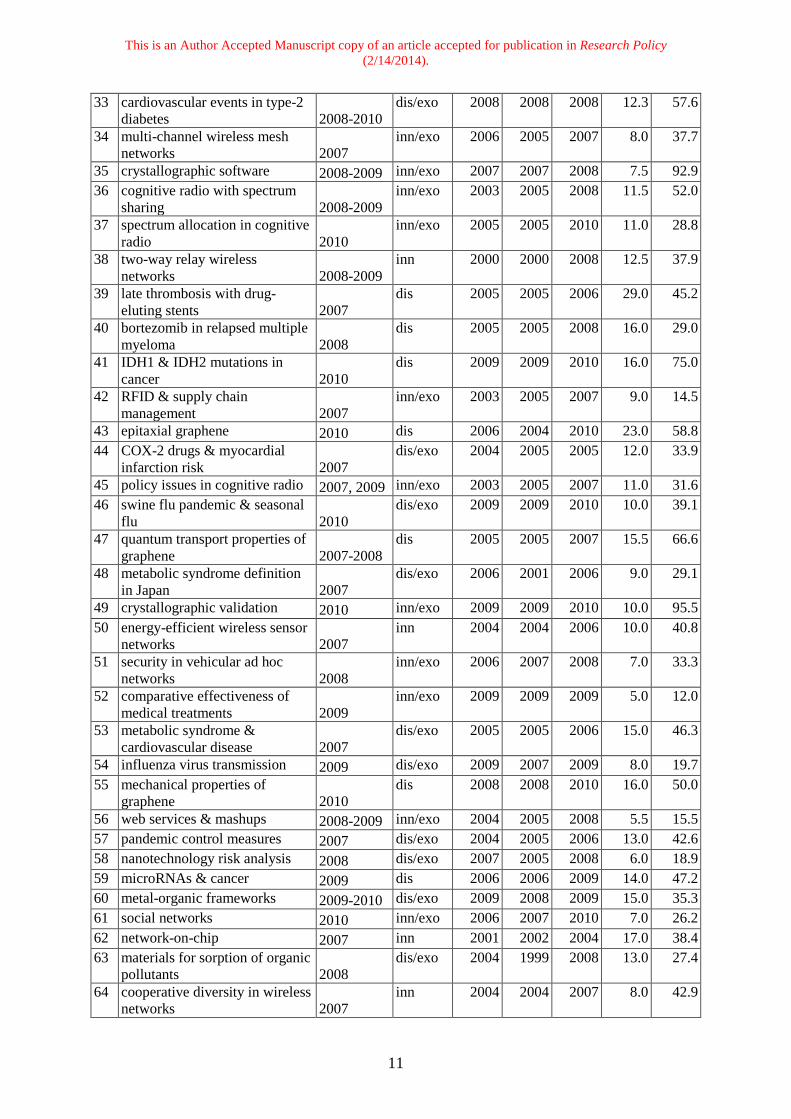
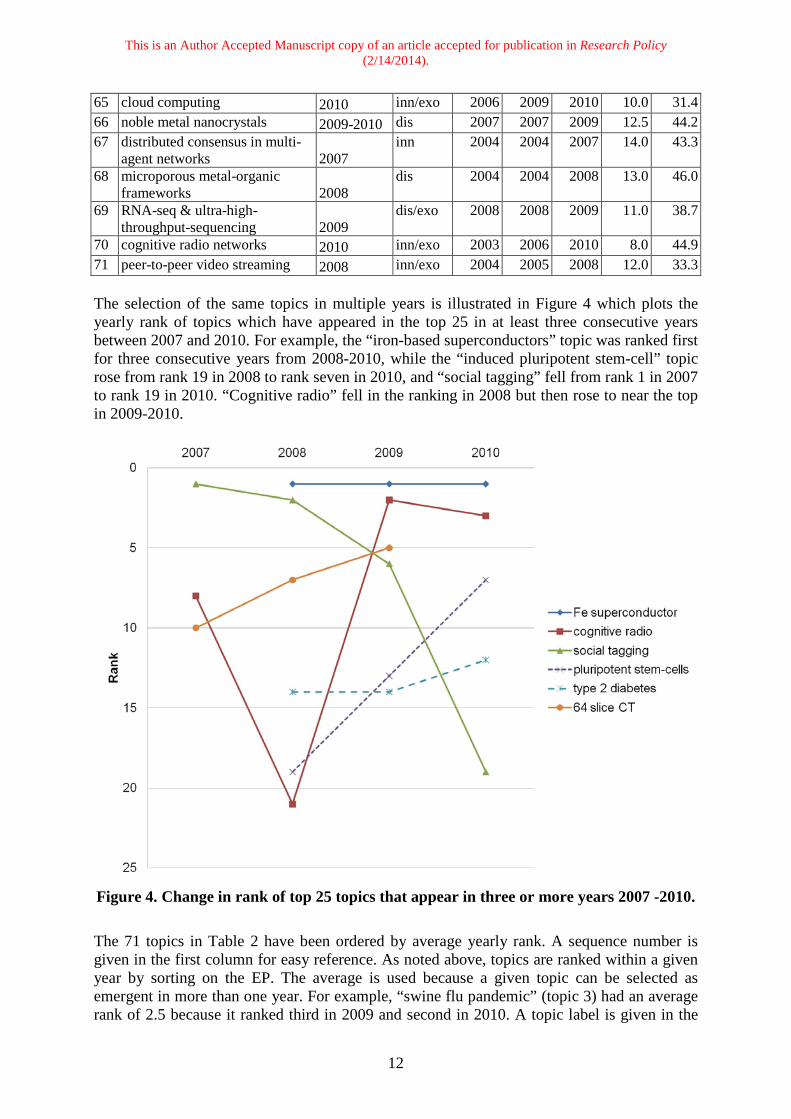
70 cognitive radio networks 2010 inn/exo 2003 2006 2010 8.0 44.9 71 peer-to-peer video streaming 2008 inn/exo 2004 2005 2008 12.0 33.3 The selection of the same topics in multiple years is illustrated in Figure 4 which plots the yearly rank of topics which have appeared in the top 25 in at least three consecutive years between 2007 and 2010. For example, the “iron-based superconductors” topic was ranked first for three consecutive years from 2008-2010, while the “induced pluripotent stem-cell” topic rose from rank 19 in 2008 to rank seven in 2010, and “social tagging” fell from rank 1 in 2007 to rank 19 in 2010. “Cognitive radio” fell in the ranking in 2008 but then rose to near the top in 2009-2010.
Figure 4. Change in rank of top 25 topics that appear in three or more years 2007 -2010. The 71 topics in Table 2 have been ordered by average yearly rank. A sequence number is given in the first column for easy reference. As noted above, topics are ranked within a given year by sorting on the EP. The average is used because a given topic can be selected as emergent in more than one year. For example, “swine flu pandemic” (topic 3) had an average rank of 2.5 because it ranked third in 2009 and second in 2010. A topic label is given in the
This is an Author Accepted Manuscript copy of an article accepted for publication in Research Policy (2/14/2014).
13
second column which is based on a manual analysis of the titles and abstracts of papers in the emergent set. The third column labelled “years” gives the first and last years in which the topic was identified as emergent during the period 2007-2010. For example, the first ranked topic “iron-based superconductors” was selected in 2008, 2009 and 2010. 4.2 Classification We can get an overview of the topics by making rough classification into three broad disciplines: 1. medicine and life sciences, 2. computer science and engineering, and 3. physical and chemical sciences. The discipline with the largest representation is medicine and life sciences with 29 topics. Within this broad area seven topics deal with the connection between genes and disease. Some of the diseases covered are myeloproliferative disorders, diabetes, obesity, brain and other cancers. Five topics deal with infectious diseases such as flu and respiratory infections. Another group of five topics concerns the adverse effects of drugs or other medical procedures, including failed clinical trials and outcomes of stent implantations. Four topics deal with successful drug and vaccine therapies. Toxicological studies of various substances and general medical policy have three topics each. Finally, a topic on medical equipment and perhaps the most revolutionary medical area of all the medical topics, induction of pluripotent stem-cells, round out the life science set. The pluripotent stem-cell topic is aimed at using a patient’s own cells to create stem-cells engineered to treat disease or regrow organs. The second most highly represented discipline is computer science and engineering with a total of 24 topics. Within this discipline by far the most topics deal with networked communications, particularly wireless, with 16 topics. Areas covered include cognitive radio, sensor networks, delay-tolerant networks, vehicular networks, consensus in networks, information flow, cooperative diversity, video streaming and RFID. Three sets having two topics each concern web services, social network studies, and cloud computing. Finally, chip design to decouple computation from communication, and signal compression to enhance video signals each have one topic. The third broad discipline is physical and chemical sciences with 18 topics. Of these the largest subgroup contains eight topics devoted to graphene, including graphene nanosheets and nanocomposites, epitaxial graphene, nanoelectronics, nanoribbons, quantum transport and mechanical properties of graphene. Three topics deal with other materials such as metal organic frameworks and noble nanocrystals. Another three concern what might be called basic physics: quantum gravity, unparticle physics, and the control of electromagnetic fields. Two topics are on crystallography and one each on pollutant sorption and perhaps the most dramatic emergence of any of the topics, iron-based superconductors. 4.3 Motive forces Another way of thinking about the topics is to consider the reason for their emergence, for example, a discovery in science or an innovation in a technology. In addition, outside or exogenous factors might have played a role in either discovery or innovation. An analysis of the type of event responsible for the emergence is given in the column of Table 2 labelled “type”. The determination was made by examining the emergent set papers, and the papers they frequently referenced. In Table 2 “discovery” refers to scientific areas where a new or unexpected finding is made or fundamental knowledge is gained. An example is the first topic on the list, iron-based high temperature superconductors, which was a discovery of superconductivity in a new class of materials not previously thought to be a good candidate for superconductivity (Hosono, 2008).
This is an Author Accepted Manuscript copy of an article accepted for publication in Research Policy (2/14/2014).
14
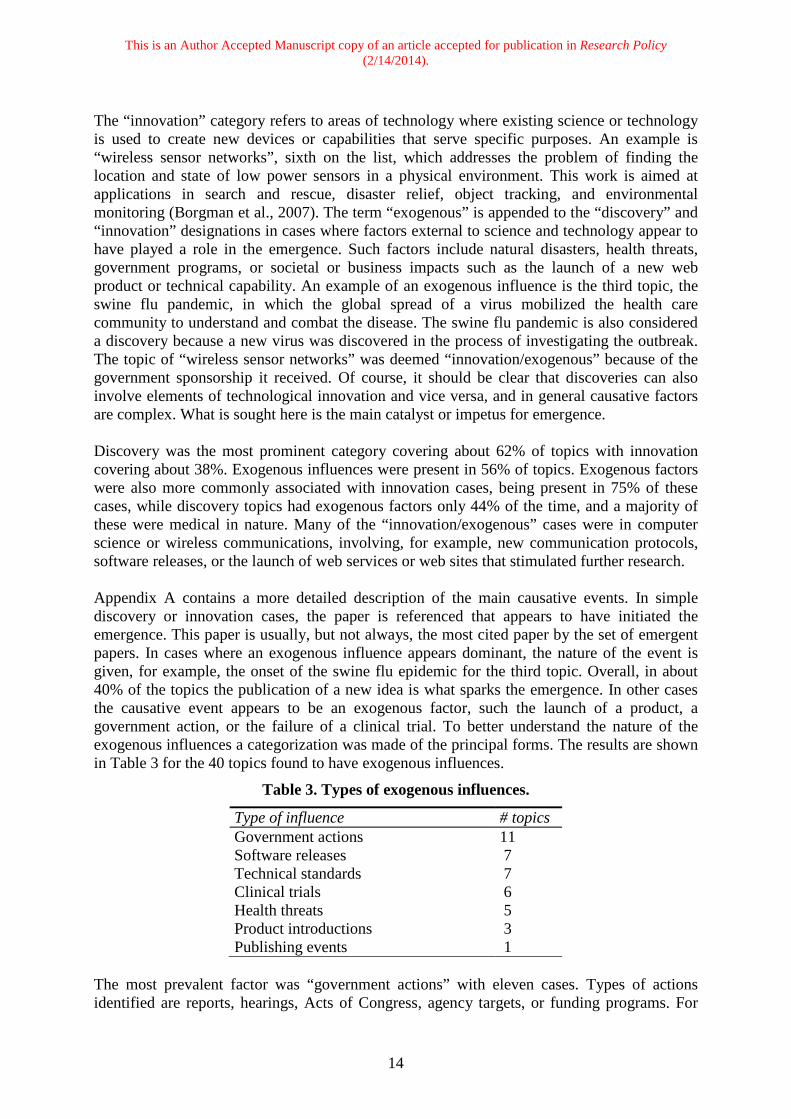
The “innovation” category refers to areas of technology where existing science or technology is used to create new devices or capabilities that serve specific purposes. An example is “wireless sensor networks”, sixth on the list, which addresses the problem of finding the location and state of low power sensors in a physical environment. This work is aimed at applications in search and rescue, disaster relief, object tracking, and environmental monitoring (Borgman et al., 2007). The term “exogenous” is appended to the “discovery” and “innovation” designations in cases where factors external to science and technology appear to have played a role in the emergence. Such factors include natural disasters, health threats, government programs, or societal or business impacts such as the launch of a new web product or technical capability. An example of an exogenous influence is the third topic, the swine flu pandemic, in which the global spread of a virus mobilized the health care community to understand and combat the disease. The swine flu pandemic is also considered a discovery because a new virus was discovered in the process of investigating the outbreak. The topic of “wireless sensor networks” was deemed “innovation/exogenous” because of the government sponsorship it received. Of course, it should be clear that discoveries can also involve elements of technological innovation and vice versa, and in general causative factors are complex. What is sought here is the main catalyst or impetus for emergence. Discovery was the most prominent category covering about 62% of topics with innovation covering about 38%. Exogenous influences were present in 56% of topics. Exogenous factors were also more commonly associated with innovation cases, being present in 75% of these cases, while discovery topics had exogenous factors only 44% of the time, and a majority of these were medical in nature. Many of the “innovation/exogenous” cases were in computer science or wireless communications, involving, for example, new communication protocols, software releases, or the launch of web services or web sites that stimulated further research. Appendix A contains a more detailed description of the main causative events. In simple discovery or innovation cases, the paper is referenced that appears to have initiated the emergence. This paper is usually, but not always, the most cited paper by the set of emergent papers. In cases where an exogenous influence appears dominant, the nature of the event is given, for example, the onset of the swine flu epidemic for the third topic. Overall, in about 40% of the topics the publication of a new idea is what sparks the emergence. In other cases the causative event appears to be an exogenous factor, such the launch of a product, a government action, or the failure of a clinical trial. To better understand the nature of the exogenous influences a categorization was made of the principal forms. The results are shown in Table 3 for the 40 topics found to have exogenous influences.
Table 3. Types of exogenous influences.
Type of influence # topics Government actions Software releases Technical standards Clinical trials Health threats Product introductions Publishing events
11 7 7 6 5 3 1
The most prevalent factor was “government actions” with eleven cases. Types of actions identified are reports, hearings, Acts of Congress, agency targets, or funding programs. For
This is an Author Accepted Manuscript copy of an article accepted for publication in Research Policy (2/14/2014).
15
example, the topic on comparative effectiveness of medical treatments (topic 52) was the subject of a congressional report in 2007 and received funding of $1.1 billion in 2009 under the American Recovery and Reinvestment Act. Cognitive radio, which is covered by five separate topics and deals with various systems to make better use of available radio spectrum and spectrum sensing, did not grow in an emergent way until after the FCC hearings of 2003 and establishment of a DARPA framework, despite the fact that the original paper on the subject appeared several years earlier (Mitola III and Maguire Jr., 1999). The second most frequent type of influence is “software releases” with seven instances. Examples are web 2.0 services, cloud software, video streaming, and crystallographic software. A related category is “technical standards” also with seven topics. This group includes standards, definitions, protocols, and recommendations by professional societies and international non-governmental bodies. Examples are recommendations for internet standards, communication protocols, disease definitions, and organic pollutant designations. The next category “clinical trials” is relevant to six topics. Four of these pertain to drug trials which failed or led to warnings, for example, for diabetes drug treatments and treatment of colorectal cancer with COX-2 inhibitors. Two other trials had positive recommendations, for the HPV vaccine and Erbitux for cancers. “Health threats” are factors in five topics. Four of these are flu epidemics, and one with food contamination by melamine. “Product introductions” is the next category with three topics. Two of these relate to the introduction of medical technologies, a new CT scanner and a genome analyzer. Finally, one exogenous case was the result of a publishing event, namely a special issue of a journal where the articles cite one another. This phenomenon has been called a “single issue cluster” (Small, 2006) and can lead to false positives in citation based emergence detection. Appendix A also includes information on the apparent goal or objective of each topic, and on the size of the topic (in number of papers) as of the year in which the topic first appeared in the top 25. In the case of a basic science topic, for example the ninth topic on Horava-Lifshitz gravity, the objective is simply to gain a better theoretical understanding of gravity by reconciling quantum theory and general relativity. Another basic physics topic without apparent practical application is unparticle physics (topic 27) which posits a low-energy state in which no particles can exist. In cases of technological innovation and in some science topics, work is usually undertaken with practical outcomes in mind, such as disease treatments or new materials. Interestingly, all of the topics, with the exception of two in basic physics, appeared to aim toward some kind of practical application, even if much basic research remained to be done before that goal is reached. About a quarter of the topics envision specific devices or physical products coming out of the research, such as graphene based devices, fuel cells or drugs, but the majority look to improvements in services, for example health care or software. 4.4 Event timing In emergence detection we are, naturally, dealing with detecting something after the fact or at best as it is happening. Lacking any definitive information on when specific topics have emerged, except perhaps expert opinion, we need to find an alternative means to characterize the performance of our methodology. For this purpose we will use the timing of the critical events we have identified for each topic, whether internal or exogenous. The column of Table 2 labelled “Ev” gives the year of the event that appears to be most influential for emergence. In cases where a specific paper is driving emergence, this is the publication year of a paper; in other cases it is the year in which the exogenous event occurred. Where a publication year is given in “Ev”, it is usually the same as the publication year of the most cited paper in the
This is an Author Accepted Manuscript copy of an article accepted for publication in Research Policy (2/14/2014).
16
column labelled “HC”. In a few topics, however, the most cited paper appears not to be the most proximate to the emergence, and the year of a lesser cited paper is given. Examples of where the most cited paper differs from the paper that appears to have directly stimulated the topic are some of the graphene related areas. The most cited papers for these topics are usually the original graphene discovery papers by Novoselov and Geim (2004), while the paper most germane to the specific graphene topic corresponds to another highly cited paper, usually within the top two or three. For example, in topic 7 on graphene the most cited paper is by Novoselov and Geim from 2004, but the second most cited paper by Stankovich et al. from 2007 on the synthesis of graphene nanosheets was more relevant to the topic (see Appendix A). It is also possible that the most cited paper will change from year to year if the topic is emergent in multiple years. In the few cases where it does change, we use the most cited paper in the year of first emergence. The timing of our detection of emergence is of course critical and we have defined this as the appearance of a topic in the top 25 for some year. Up to now we have only been concerned with what topics are emergent in the four years 2007-2010. But because topics can be in the top 25 in multiple years, we need to find the first year that it appeared in a top 25 list whether or not it is within our four year period. Since the first emergence can occur prior to 2007, top 25 rankings were generated going back several years. As it turns out, the earliest year a topic in the 2007-2010 period appeared in a top 25 set for any prior year was 2004. The column labelled “Em” is the year in which the topic was first observed to emerge in the top 25 for some year. Only 11 of the 71 topics were found to emerge prior to the 2007-2010 timeframe. Based on this retrospective analysis, we can say that most topics are not identified as emergent in more than one year. The year 2008 had the most new cases of emergence with 19, but eleven were emergent only in that year. This does not mean, however, that the topics do not persist either as direct citation clusters or as co-citation threads, but only that their growth characteristics in later years are less marked. With the event year, year of first emergence and year of the most cited papers we are able to compute three time lags of interest: the time lag from the triggering event to publication of the most cited paper, the lag from the event to the year of first emergence, and the lag from publication of the most cited paper to first emergence. These can be easily computed from the columns in Table 2. In the case of “HC-Ev”, lags will be positive if the most cited paper is published after the triggering event and negative if the most cited paper precedes the key event. The five of the twelve negative time lags are graphene topics where the most cited discovery paper by Novoselov and Geim was published prior to the highly cited paper which was most relevant to the topic. Positive time lags, on the other hand, tend to be associated with exogenous stimuli, such as new software, web products, or government standards that stimulate research and result in highly cited papers at later dates. An example here is cognitive radio where FCC hearings and the DARPA architecture for cognitive radio preceded the most cited paper by Haykin in 2006. Across all topics, however, the average lag from event to most cited paper is near zero, suggesting that often the event and most cited paper are very close in time. The second type of lag, “Em-Ev”, is a measure of the ability of our system to detect emergence at an early stage. Large positive lags indicate a delay in detection, and there are only two cases of negative lags. Negative lags, where the influential event comes after
This is an Author Accepted Manuscript copy of an article accepted for publication in Research Policy (2/14/2014).
17
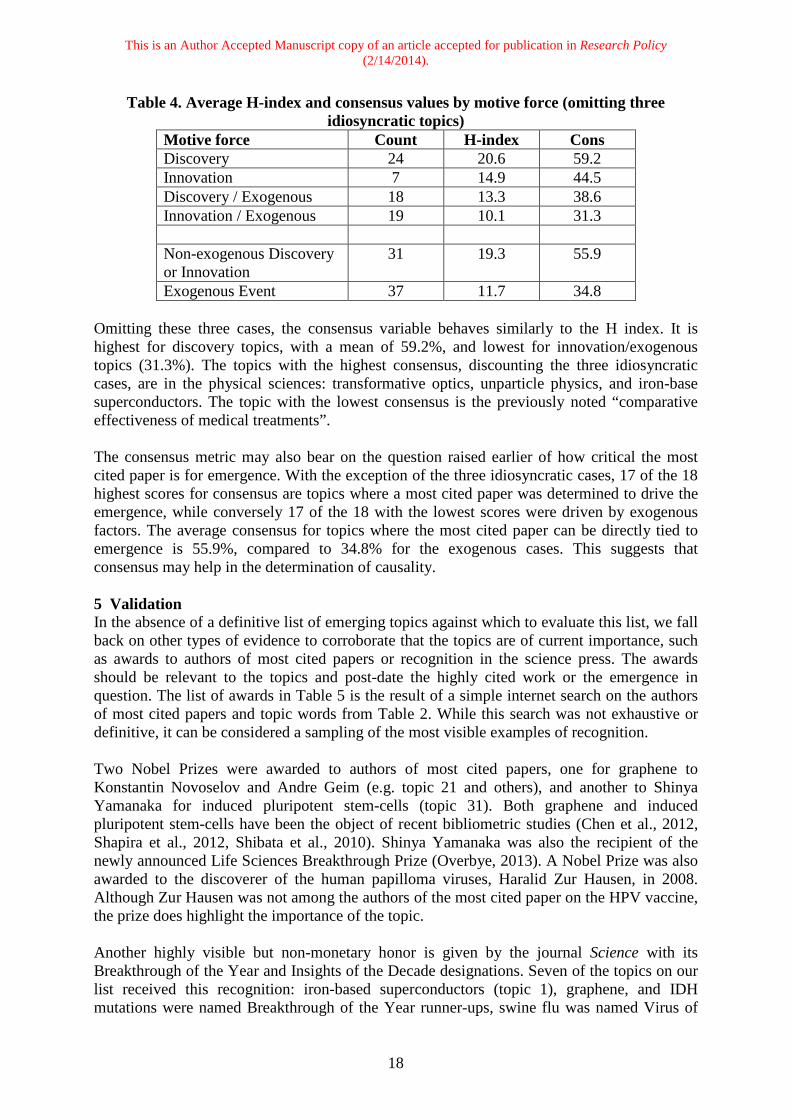
bibliometric emergence would suggest some degree of clairvoyance on the part of our system, but both cases are understandable. In one case, research on web services selection may have prompted the World-wide-web Consortium to come up with a new standard, and in the other case researchers announced the adverse effects of a diabetes drug prior to FDA issuing a drug safety alert. Overall, the average delay in detection across the 71 topics is 2.3 years. The largest lags are mainly innovation cases, often involving exogenous factors, where delays may be due to technical or development issues, as were likely the case for cognitive radio and some wireless technologies. A few graphene topics also experienced substantial lags perhaps associated with such issues. Lastly the lag between the year of the most cited paper and our detection of emergence is known as “Em-HC”. Positive lags predominate indicating that the most cited paper was published prior to the topic’s emergence. The average lag from most cited paper to emergence is 2.3 years, the same as the lag from event to emergence which is expected since the lag from the event to the most cited paper was near zero. There is only one case of a negative lag which was the previously mentioned diabetes drug safety alert where the most cited paper and the FDA alert came out one year after topic’s emergence. A number of topics have large positive lags where the publication of the most cited paper pre-dates emergence by several years. For example, for the topic “sorption of organic pollutants” the publication of the most cited paper came nine years prior to emergence. 4.5 Topic Citedness It is also of interest to investigate the citedness of the topics, although it is well known that science topics will generally have higher citation rates than those in technology (Braun et al., 1985). The column of Table 2 labelled “H” gives the topic H index, the number of papers N cited at or above N times, indicating the number of highly cited papers in the topic (Hirsch, 2005). Not surprisingly, the average rank of the topic has an inverse correlation with H of about -0.6 which reflects in part the fact that larger topics are ranked higher by the EP, and these have more papers and higher citation rates. Also, topics driven by exogenous events, such as swine flu, cloud computing and social tagging, have lower H values. Non-exogenous discovery and innovation topics have an average H of 19.3 compared to 11.7 for exogenous cases (see Table 4). Pure discovery topics as a group have the highest average H of 20.6 which is twice the value for innovation/exogenous topics. The highest H index of 42 is for iron-based superconductors (topic 1) while the lowest is for “comparative effectiveness of medical treatments” (topic 52), in effect an area of research created by congressional mandate and lacking a scientific or technical base. The last column in Table 2 is labelled “cons”, and gives the percentage of emergent papers in a topic that cite the most cited paper. This metric could be interpreted as the degree of consensus within the topic on its key paper, or the pervasiveness of influence of the most cited paper. The highest scores on this metric belong to topics where idiosyncratic factors are dominant, namely the “single journal issue” topic on toxicology noted previously (topic 8), and the two crystallography software topics (35 and 49). Consensus is high for the single issue case because the papers in the journal’s issue are all citing the lead article. In each of the crystallography cases the top papers are on software for computing or validating crystal structures which are widely used by crystallographers.
This is an Author Accepted Manuscript copy of an article accepted for publication in Research Policy (2/14/2014).
18
Table 4. Average H-index and consensus values by motive force (omitting three idiosyncratic topics)
Motive force Count H-index Cons Discovery 24 20.6 59.2 Innovation 7 14.9 44.5 Discovery / Exogenous 18 13.3 38.6 Innovation / Exogenous 19 10.1 31.3 Non-exogenous Discovery or Innovation
31 19.3 55.9
Exogenous Event 37 11.7 34.8 Omitting these three cases, the consensus variable behaves similarly to the H index. It is highest for discovery topics, with a mean of 59.2%, and lowest for innovation/exogenous topics (31.3%). The topics with the highest consensus, discounting the three idiosyncratic cases, are in the physical sciences: transformative optics, unparticle physics, and iron-base superconductors. The topic with the lowest consensus is the previously noted “comparative effectiveness of medical treatments”. The consensus metric may also bear on the question raised earlier of how critical the most cited paper is for emergence. With the exception of the three idiosyncratic cases, 17 of the 18 highest scores for consensus are topics where a most cited paper was determined to drive the emergence, while conversely 17 of the 18 with the lowest scores were driven by exogenous factors. The average consensus for topics where the most cited paper can be directly tied to emergence is 55.9%, compared to 34.8% for the exogenous cases. This suggests that consensus may help in the determination of causality. 5 Validation In the absence of a definitive list of emerging topics against which to evaluate this list, we fall back on other types of evidence to corroborate that the topics are of current importance, such as awards to authors of most cited papers or recognition in the science press. The awards should be relevant to the topics and post-date the highly cited work or the emergence in question. The list of awards in Table 5 is the result of a simple internet search on the authors of most cited papers and topic words from Table 2. While this search was not exhaustive or definitive, it can be considered a sampling of the most visible examples of recognition. Two Nobel Prizes were awarded to authors of most cited papers, one for graphene to Konstantin Novoselov and Andre Geim (e.g. topic 21 and others), and another to Shinya Yamanaka for induced pluripotent stem-cells (topic 31). Both graphene and induced pluripotent stem-cells have been the object of recent bibliometric studies (Chen et al., 2012, Shapira et al., 2012, Shibata et al., 2010). Shinya Yamanaka was also the recipient of the newly announced Life Sciences Breakthrough Prize (Overbye, 2013). A Nobel Prize was also awarded to the discoverer of the human papilloma viruses, Haralid Zur Hausen, in 2008. Although Zur Hausen was not among the authors of the most cited paper on the HPV vaccine, the prize does highlight the importance of the topic. Another highly visible but non-monetary honor is given by the journal Science with its Breakthrough of the Year and Insights of the Decade designations. Seven of the topics on our list received this recognition: iron-based superconductors (topic 1), graphene, and IDH mutations were named Breakthrough of the Year runner-ups, swine flu was named Virus of

This is an Author Accepted Manuscript copy of an article accepted for publication in Research Policy (2/14/2014).
19
the Year (topics 3 and 46), and “cell reprogramming” (aka pluripotent stem-cells), “metamaterials” (aka transformative optics, topic 23), and “next generation genomics” (aka ultra-high-throughput-sequencing, topic 69) were designated Insights of the Decade.
Table 5. Awards and recognition for topics and authors of most cited papers id person/topic Award year 1 Hideo Hosono Bernd T. Matthias Prize 2009 1 iron-based superconductivity Science: Breakthrough of the year runner-up 2008 3 swine flu virus Science: Virus of the year 2009 6 John Stankovic IEEE Distributed Processing Annual
Distinguished Achievement Award 2006
6 Tarek Abdelzaher IEEE Outstanding Technical Achievement and Leadership Awards
2012
10 HPV Nobel Prize to Haralid Zur Hausen 2008 12 David Dohono IEEE Information Theory Society Paper Award 2008 13 David Altshuler American Diabetes Association Outstanding
Scientific Achievement Award 2012
18 Joseph Mitola IEEE TCCN Recognition Award 2011 23 Metamaterials Science: Insights of the decade 2010 23 John Pendry Willis E. Lamb Award for Laser Science and
Quantum Optics 2010
23 John Pendry UNESCO-Niels Bohr gold medal 2009 28 Cathy Brown American Association of Veterinary Laboratory
Diagnosticians Best paper Award 2008
31 Shinya Yamanaka Nobel Prize 2012 31 cell reprogramming Science: Insights of the decade 2010 31 Shinya Yamanaka Breakthrough Prize in Life Sciences 2013 34 Ian Akyildiz IEEE W. Wallace McDowell Award 2011 35 George Sheldrick Gregori Aminoff Prize 2009 38 Rudolf Ahlswede IEEE Claude Shannon award 2006 40 Paul G. Richardson Warren Alpert Foundation Prize 2012 41 IDH1 & IDH2 mutations in
cancer Science: Breakthrough of the year runner-up 2008
41 Bert Vogelstein Breakthrough Prize in Life Sciences 2013 47 Graphene Science: Breakthrough of the year runner-up 2009 47 Konstantin Novoselov and
Andre Geim Nobel Prize 2010
49 Anthony Spek Kenneth Trueblood award 2010 59 Carlo Croce Albert Szent-Györgyi Prize for Progress in Cancer
Research 2013
62 Giovanni De Micheli IEEE Mac Van Valkenburg Award 2012 64 J. Nicholas Laneman Presidential Early-Career Award for Scientists and
Engineers 2006
66 Zhung Lin Wang Materials Research Society medal 2011 67 Reza Olfati-Saber Presidential Early Career Award for Scientists and
Engineers 2010
69 next generation genomics Science: Insights of the decade 2010
This is an Author Accepted Manuscript copy of an article accepted for publication in Research Policy (2/14/2014).
20
A number of topics and authors were multiply recognized. For example, Hideo Hosono received the Bernd T. Matthias Prize for his discovery of iron-based superconductors, and Sir John Pendry was awarded the UNESCO-Niels Bohr gold medal and the Willis E. Lamb Award for Laser Science and Quantum Optics for his work on transformative optics and metamaterials. Pendry’s work has potential for many novel optical applications such as optical cloaking. On the technology side seven awards were associated with IEEE. David Dohono received an IEEE award for his work on compressed sensing (topic 12), an award he shared with the author of the second most cited paper in the topic by Emmanuel Candes. Four authors received IEEE awards for work on various kinds of wireless network communications: two authors of a most cited paper, John Stankovic and Tarek Abdelzaher for wireless sensor networks (topic 6), Ian Akyildiz for wireless mesh networks, and Rudolf Ahlswede for wireless relay networks. Joseph Mitola was recognized by IEEE for his pioneering work on cognitive radio (topic 18 and others), and Giovanni De Micheli for networks-on-chips (topic 62). Two other authors of most cited papers on wireless topics received Presidential Early-Career awards. Authors of top papers for each of the two crystallography topics on our list received awards: Anthony Spek for his work on crystallographic validation software (topic 49) and George Sheldrick for his work on the SHELX system (topic 35). Finally, a number of medical researchers received awards from various medical societies and foundations for topics such as diabetes, toxicology, multiple myeloma, and microRNAs. Overall about one-third of the 71 topics could be associated with awards on this cursory internet survey. While this search for awards is necessarily incomplete, it provides evidence that at least some of the topics and their highly cited authors have received recent recognition for work that has topical relevance and post-dates publication of the most cited papers. In all, “discovery” topics received 20 awards and “innovation” topics eleven, close to the expected proportion given the mix of discovery and innovation types which suggests that technology received nearly its fair share. Comparing topics associated with awards with those that were not, the only indicator that stands out as significantly different is the citing paper consensus (Table 2) which is on average ten percentage points higher for the topics with awards. Regarding the timing of awards, in 19 of 24 cases the awards came after topic emergence. In only one case (topic 41) the award preceded the publication year of the highly cited paper and then by only one year. By way of comparison, we also identified 25 non-emergent clusters and did a search for awards given to authors of the most highly cited articles in those clusters. The twenty-five largest non-emergent clusters in the direct citation model were chosen for this analysis because they had large number of papers, and were thus a suitable comparison for the emergent clusters in terms of size in the 2007-2010 time window. In addition, these large clusters could be expected to contain highly cited articles which would provide suitable candidate names for an award search. The highly cited articles in these clusters averaged 447 citations each (as of 2010), with a range of 121 to 1878 citations. Senior authors were chosen for each article, and a search was done for awards to these authors. We found that awards were given to four of the 25 authors – these awards included a distinguished medal in poultry science, a research prize for a plasma device, and a company early achievement award – but no major awards of the type listed in Table 5 were awarded to this group of authors. This is an admittedly small sample of authors. However, the fact that an inexhaustive search found that
This is an Author Accepted Manuscript copy of an article accepted for publication in Research Policy (2/14/2014).
21
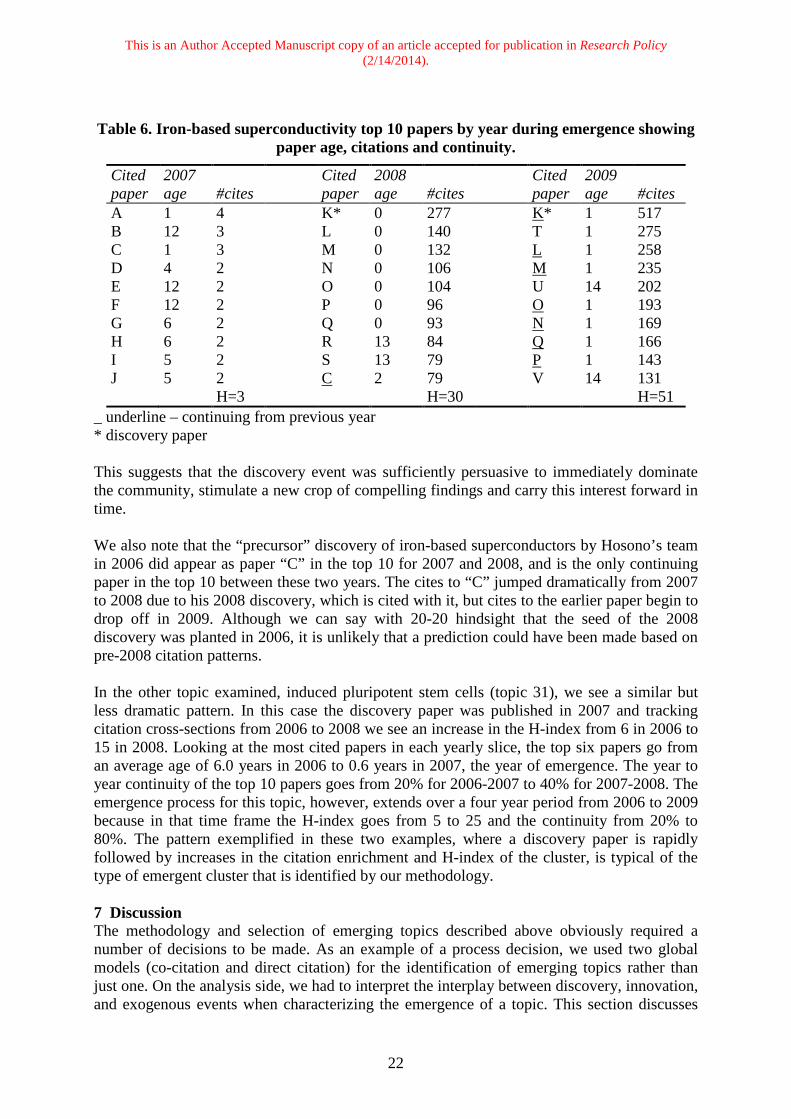
nearly one third of our nominated set of topics and key researchers were associated with major awards, while a comparison group of authors of highly cited papers from non-emergent clusters with a similar level of activity received none, suggests that our new methodology has nominated a strong set of emerging topics. 6 Citations during emergence Up to this point we have characterized emerging topics at a relatively high level. This section elaborates on the process of emergence by showing the pattern of citations and associated growth within emergent clusters. Two examples are given. To gain a better understanding of the process of emergence, the pattern of citations was examined during the period of emergence for the first ranked topic, iron-based superconductors and topic 31, induced pluripotent stem cells. In 2008 high temperature superconductivity was reported for the first time in an iron-based compound (called an iron pnictide) by a group of Japanese researchers headed by Hideo Hosono. This paper is by far the most cited in this topic. Previously the known high-temperature superconductors were mainly copper-based, and the last new superconducting material to be discovered was a magnesium-diboride compound in 2001. The expectation was that a ferromagnetic material such as iron would not be a good candidate for superconductivity. To quote the discoverer Hosono: “Our discovery of iron-based high-Tc superconductors smashed the monopoly of CuO2 for high-Tc which had continued over the past 20 years. It has turned out that several unique properties are favoured for application, among these are high critical magnetic fields and the less anisotropic nature of current flow.” (Hosono, 2008). Subsequently other iron-based superconductors were found with higher transition temperatures by other researchers. Interestingly the work of Hosono’s group that led to the discovery in 2008 was on magnetic semiconductors based on transition metals. In fact, in 2006 and 2007 he had discovered superconductivity in ferromagnetic materials based on iron and nickel, but with lower critical temperatures, which at the time did not attract much attention. The object of the following analysis is to see how the emergence unfolded in 2008 from a citation perspective, and whether the earlier “precursor” discoveries of 2006 and 2007 played any role. The analysis is based on all citation links extracted from the direct citation cluster for this topic. Since in this case a specific discovery paper had appeared in 2008 which was critical to the topic, the procedure was to make annual time slices into the citation network and compute the most cited papers in each year. Table 6 gives the ten most cited papers for each of three years, 2007-2009 which spans the year of emergence 2008. We use letter codes to identify the papers and also show the age of the cited papers with respect to the citing year. The discovery paper is indicated by an asterisk, and the letter code for the paper is tagged with superscript b if the paper continues from the prior year. First we observe a dramatic increase in the H index across the time slices coinciding with the appearance of the discovery paper at the top of the ranking in 2008 when H goes from 3 to 30. Of course, this goes hand in hand with a rapid increase in the number of papers and citations in the direct citation cluster. Second we see a decrease in the age of the cited papers. In the year of emergence the top seven papers have an age of 0, that is, were published in the citing year. This compares with an average age of 6.8 years in the year prior to emergence. Third we see a low continuity of cited papers within the top 10 prior to emergence (1/10), and a high continuity of cited papers following emergence (7/10). Of course, high post-emergence continuity leads to an aging of the highly cited work, which will continue unless new papers become highly cited.
This is an Author Accepted Manuscript copy of an article accepted for publication in Research Policy (2/14/2014).
22
Table 6. Iron-based superconductivity top 10 papers by year during emergence showing paper age, citations and continuity.
Cited paper
2007 age
#cites
Cited paper
2008 age
#cites
Cited paper
2009 age
#cites
A 1 4 K* 0 277 K* 1 517 B 12 3 L 0 140 T 1 275 C 1 3 M 0 132 L 1 258 D 4 2 N 0 106 M 1 235 E 12 2 O 0 104 U 14 202 F 12 2 P 0 96 O 1 193 G 6 2 Q 0 93 N 1 169 H 6 2 R 13 84 Q 1 166 I 5 2 S 13 79 P 1 143 J 5 2 C 2 79 V 14 131 H=3 H=30 H=51
_ underline – continuing from previous year * discovery paper This suggests that the discovery event was sufficiently persuasive to immediately dominate the community, stimulate a new crop of compelling findings and carry this interest forward in time. We also note that the “precursor” discovery of iron-based superconductors by Hosono’s team in 2006 did appear as paper “C” in the top 10 for 2007 and 2008, and is the only continuing paper in the top 10 between these two years. The cites to “C” jumped dramatically from 2007 to 2008 due to his 2008 discovery, which is cited with it, but cites to the earlier paper begin to drop off in 2009. Although we can say with 20-20 hindsight that the seed of the 2008 discovery was planted in 2006, it is unlikely that a prediction could have been made based on pre-2008 citation patterns. In the other topic examined, induced pluripotent stem cells (topic 31), we see a similar but less dramatic pattern. In this case the discovery paper was published in 2007 and tracking citation cross-sections from 2006 to 2008 we see an increase in the H-index from 6 in 2006 to 15 in 2008. Looking at the most cited papers in each yearly slice, the top six papers go from an average age of 6.0 years in 2006 to 0.6 years in 2007, the year of emergence. The year to year continuity of the top 10 papers goes from 20% for 2006-2007 to 40% for 2007-2008. The emergence process for this topic, however, extends over a four year period from 2006 to 2009 because in that time frame the H-index goes from 5 to 25 and the continuity from 20% to 80%. The pattern exemplified in these two examples, where a discovery paper is rapidly followed by increases in the citation enrichment and H-index of the cluster, is typical of the type of emergent cluster that is identified by our methodology. 7 Discussion The methodology and selection of emerging topics described above obviously required a number of decisions to be made. As an example of a process decision, we used two global models (co-citation and direct citation) for the identification of emerging topics rather than just one. On the analysis side, we had to interpret the interplay between discovery, innovation, and exogenous events when characterizing the emergence of a topic. This section discusses
This is an Author Accepted Manuscript copy of an article accepted for publication in Research Policy (2/14/2014).
23
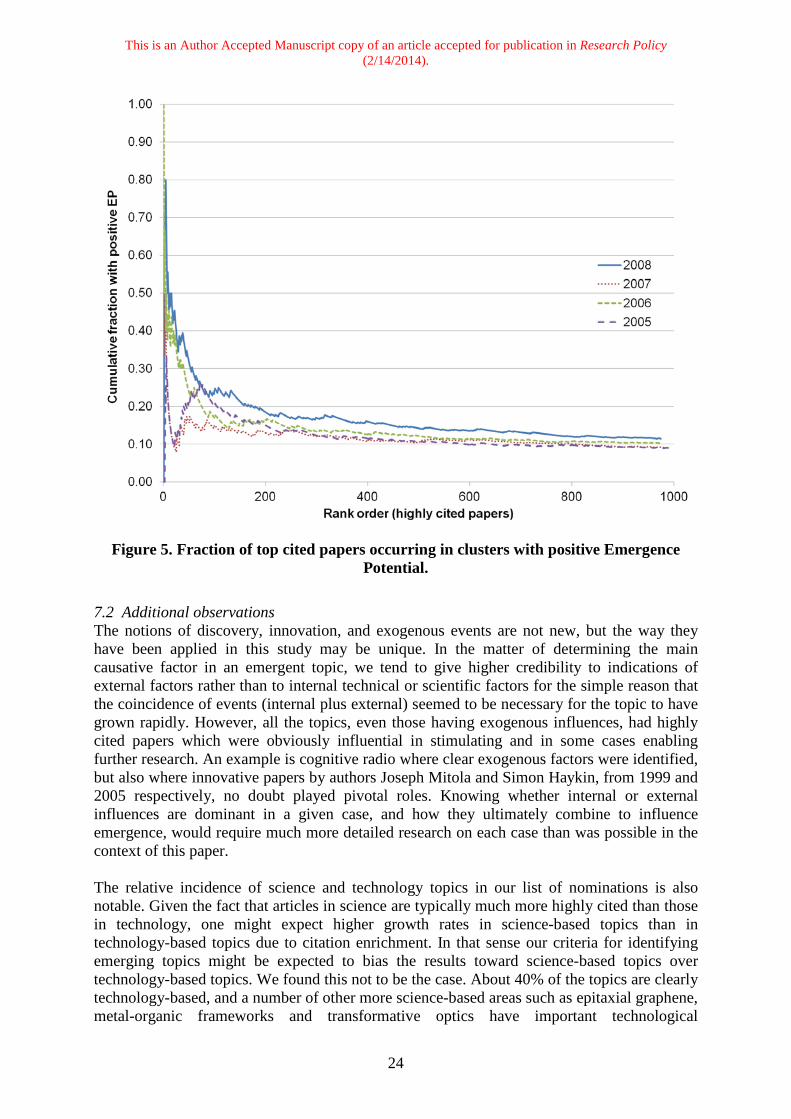
some of these choices and their ramifications, as well as general observations and points where further research would be useful. 7.1 Alternate methods A fundamental question regarding our selection methodology is whether alternative approaches could perform equally well. Our reasoning for using two models to identify emergent topics rather than just one model is given above in Section 3.3. One might naturally ask if use of both models was required, or if using the direct citation model might be sufficient given that it was much more selective than the co-citation model in terms of cluster births. One way to start to answer that question is to compare the set of emerging topics obtained using both models with the set of emerging topics that would have been nominated using only the direct citation model. The top 25 emerging topics in each year 2007-2010 using only the direct citation model were identified using the same protocol listed above. However, rather than using co-citation counts for the emergence year, direct citation counts were used. For the example shown in Figure 2, the number of direct citation counts in 2007 (64) was used in place of the co-citation counts (58), and the resulting EP value was 61 instead of 55. Comparison of the two result sets across the four year time period shows that 31 of the nominated topics were common between the two methods, while 40 topics were unique to the set based on both models, and 31 topics were unique to the set based solely on direct citation. The direct citation model nominated 62 unique topics across the four year window while the combined model nominated 71 unique topics. Thus, use of the direct citation model alone nominated more cases of multi-year emergence. The fraction of topics with major awards in Table 5 is roughly the same for the direct citation only and combined methods. Although this analysis does not pass judgment on the quality of the results, it does show that use of both models provided a more stringent set of criterion which gave significantly different results than using the direct citation model alone. The question of the relationship between emergence and highly cited papers is another that should be considered. Clusters that grow quickly – part of our definition of emergence – are often associated with highly cited papers. Could not one then simply search for the most highly cited papers in a particular year and assume that they are the seeds of emergent clusters? To investigate this question we took the 1000 most highly cited papers from each year 2005-2008, identified the clusters in which those papers were located, and then calculated the cumulative fraction of those papers that occurred in clusters with positive EP two years later. The two year time lag was chosen given our finding that the average time lag between the key highly cited paper and cluster emergence was 2.3 years. Figure 5 shows that roughly 10% of the 1000 most highly cited papers each year (roughly equivalent to the 0.05% most highly cited) are associated with clusters with positive EP values. Rank order matters; the few most highly cited papers are more likely than the rest to be associated with newer clusters. However, it is clear that the majority of clusters containing highly cited papers are not those associated with novelty and growth – i.e., the dominant properties of emergence. The fact that 90% of the most highly cited papers are associated with non-emergent clusters suggests that highly cited papers by themselves are not good nominators of emerging topics, and that a more elaborate methodology, such as the one introduced in this article, is needed.
This is an Author Accepted Manuscript copy of an article accepted for publication in Research Policy (2/14/2014).
24
Figure 5. Fraction of top cited papers occurring in clusters with positive Emergence
Potential. 7.2 Additional observations The notions of discovery, innovation, and exogenous events are not new, but the way they have been applied in this study may be unique. In the matter of determining the main causative factor in an emergent topic, we tend to give higher credibility to indications of external factors rather than to internal technical or scientific factors for the simple reason that the coincidence of events (internal plus external) seemed to be necessary for the topic to have grown rapidly. However, all the topics, even those having exogenous influences, had highly cited papers which were obviously influential in stimulating and in some cases enabling further research. An example is cognitive radio where clear exogenous factors were identified, but also where innovative papers by authors Joseph Mitola and Simon Haykin, from 1999 and 2005 respectively, no doubt played pivotal roles. Knowing whether internal or external influences are dominant in a given case, and how they ultimately combine to influence emergence, would require much more detailed research on each case than was possible in the context of this paper. The relative incidence of science and technology topics in our list of nominations is also notable. Given the fact that articles in science are typically much more highly cited than those in technology, one might expect higher growth rates in science-based topics than in technology-based topics due to citation enrichment. In that sense our criteria for identifying emerging topics might be expected to bias the results toward science-based topics over technology-based topics. We found this not to be the case. About 40% of the topics are clearly technology-based, and a number of other more science-based areas such as epitaxial graphene, metal-organic frameworks and transformative optics have important technological

This is an Author Accepted Manuscript copy of an article accepted for publication in Research Policy (2/14/2014).
25
components. Within technology we saw the very strong representation of various forms of wireless networked communications. Although we did not count topics under the general rubric of “computer science”, one could argue that nearly one-half the technology topics are oriented toward computer science, and their appearance possibly reflects the strong representation of this subject in the Scopus database. The prevalence of technology topics is only slightly higher than the 36% which was reported in our preliminary study of the top 25 emergent topics from 2010 (Small, Boyack & Klavans, 2013). Citation patterns in emerging topics are also of interest. The citation patterns investigated for two of the topics suggest a general pattern which might hold for discovery-based science involving the combined factors of citedness, age and continuity of highly cited papers during the emergence process. Of course, an increase in citedness is expected due to the growth of the topic which is part of our selection method. But a decrease in age and subsequent continuity of highly cited papers are understandable only if we posit an event that spawns a new crop of highly visible papers that become dominant. We do not yet know whether this pattern holds for other topics in the list particularly those not associated with specific discovery papers, let alone for wider samples of emerging and non-emerging topics in general. The resolution of the topics resulting from the direct citation clustering is another feature of interest. For example, our list of emerging topics contains eight topics related to graphene and five related to cognitive radio. A case could easily be made that each of these should be represented by only a single topic. On the other hand, we find that the higher resolution afforded by the current approach is useful in that it can distinguish between subtopics within a larger topic, and can highlight emergence at the subtopic level. In the case of graphene, our method draws distinctions between, for example, fabrication, electronic or mechanical properties, geometric forms, optoelectronics, etc. and these distinctions are usually apparent in the emergent papers as well as a different mix of highly cited papers. In addition, the time sequencing can be important. In the case of graphene, electronic properties emerged in 2007, nanoribbon applications emerged in 2008, and mechanical properties, nanosheets, and transistors all emerged in 2010. This type of detail may be of use to decision makers. 7.3 Future considerations Given the complexity of the models used in this study and the number of potential variables in the process, there are undoubtedly many directions in which future research might go. Since one factor in our detection methodology is growth in the direct citation network, we could ask whether the topics identified are prone to bandwagon effects (Frickel and Gross, 2005). Such a tendency could be the result of an availability of a large pool of researchers with adequate support to be able to rapidly exploit a new finding. Such might be the case, for example, with the high temperature superconductivity community within materials science and applied physics. Or we might ask whether emergent topics in general are biased toward areas offering practical outcomes, where researchers are more easily recruited by the potential for technological payoffs. At first glance the dominance of practical goals may seem counter to our expectation that basic or pure research is undirected and undertaken simply for the sake of new knowledge. We find, instead, that the types of topics found to be emergent have a decidedly practical bent. Perhaps these are the types of areas that can most readily attract the attention and resources required to grow rapidly. We might also ask whether the implicit goals and objectives (as listed in Appendix A) might function as motivating factors in their own right. In a sense the quest for new drugs, materials, or devices continuously underlies scientific practice whether or not a particular solution or external stimulus is at hand.

This is an Author Accepted Manuscript copy of an article accepted for publication in Research Policy (2/14/2014).
26
Another way to pose this question about the prominence of technology and practical outcomes is to ask why we do not see more topics in basic physics, chemistry, biology, and geosciences and whether such topics may have less dramatic growth characteristics? Perhaps varying the selection parameters for matching direct citation clusters and co-citation threads would give a stronger representation of these disciplines, for example, changing the window for computing EP or using a percentage increase function. The methodology used for selecting emerging topics, specifically the EP, is clearly biased toward the larger topics with higher numbers of matching papers. Smaller topics with high percentage increase in papers could easily be missed. Additional work to quantify the effect of cluster size might result in ways to nominate smaller topics with high fractional growth rates as emergent. The average time lag from either discovery or exogenous events to topic emergence was about 2.3 years using our system. If such a system is to be used to guide funding decisions, even shorter lag times of perhaps a year or less, are desirable. Further experiments should be undertaken to identify ways of minimizing lag times. In modelling the emergence process at the paper level we need to further investigate the factors of citedness, paper age, and continuity of the highly cited papers. These variables might eventually be part of an emergence index, in conjunction with the topic growth rate. Obviously the precision of topic paper identification is critical in such an analysis, and the combination of direct citation and co-citation methods used here has contributed to this accuracy. Other potentially fruitful paths toward shorter lag times include adjustment in the way co-citation threads are built and characterized to provide greater selectivity. Indicators based on changes in collaboration networks (Bettencourt et al., 2009) or the interdisciplinary structure of references (Guo et al., 2011) may prove very useful when combined with our citation-based approach. Future advances which reduce the lag time to near zero have the potential to move us toward systems that can be predictive rather than focused on detection. 8 Conclusions We have demonstrated that two citation based methodologies, direct citation clustering and co-citation threading, operating independently on multiple years of a comprehensive citation database can be combined to identify emerging topics in science and technology. The direct citation cluster provides a broad picture of longitudinal growth for a topic while co-citation threads give a more fine-grained picture which is sensitive to changes at the problem level. Matching papers from the two solutions and taking into account the earlier history of each topic in the form of the Emergence Potential provides the new detection methodology. Validation, while not direct, can be achieved by searching for recognition of the topics in the press and post-emergence awards to leading scientists. Perhaps the most important implication of the present work is that detection by citation-based methods is feasible using a global approach to data analysis rather than a local or case study approach which has predominated up to now. The motive forces behind emergence are found to be either specific discoveries or innovations that could often be associated with published papers, or to external events that stimulated work in the topics. Highly cited papers played a key role in about 40% of the 71 topics (see Appendix A), including mainly science areas but also a few technological ones. It is likely that most of these discoveries and innovations could not have been anticipated, even though with hindsight we might be able to identify precursor discoveries in the direct citation network that provide hints that possible breakthroughs are forthcoming. The consensus indicator which
This is an Author Accepted Manuscript copy of an article accepted for publication in Research Policy (2/14/2014).
27
measures the agreement within a topic on the importance of a highly cited paper may help determine whether the motive force behind emergence is a specific discovery or an exogenous event. Further confirmation of the importance of these papers could also be sought by surveys or interview methods. The role of exogenous influences, which were a factor in over one-half of topics, also deserves further attention. Government actions were found to be the most prevalent of these factors. However, to the best of our knowledge the impact of government policy on emergence has not been previously studied in any systematic manner. Previous bibliometric case studies have been carried out on topics clearly associated with external events such as the 9/11 and anthrax terrorist attacks (Chen, 2006, Morris et al., 2003), but the mention of exogenous events seems not to be common. This study shows that such events may be more influential on emergence than previously considered. Many exogenous stimuli are not immediately evident from the technical literature, and only become evident upon more in-depth investigation using broader sources. One task for future research will be to use this list of topics and similar lists from other years to see if common preconditions to discovery and innovation can be found, such as converging literatures (Swanson and Smalheiser, 1996) or turning points (Chen et al., 2009). It is also of interest to study the fate of these emerging topics in later years. Did work continue, decline or disappear? Having a reasonably certain inventory of emergent topics as a quasi-gold standard opens up many new research possibilities, for example, studies of sentiment word changes during emergence, or correlated social network or institutional factors. This research has been motivated by the need to find new policy tools which can effectively exploit the massive scientific and technical databases that are currently available and will continue to be deployed. The identification of emerging topics in science and technology has been a longstanding problem, a solution to which has the potential to affect how funds are allocated to research, strategic planning, national, university and firm competiveness, and individual research priorities. The automated generation of a comprehensive and multidisciplinary inventory of such topics now seems feasible. Beyond that we see the possibility of gaining insights into the process of emergence that may provide further indicators or early signals of possible emergence events, and will contribute to our basic understanding of how science and technology develop and change. Acknowledgments Scopus data from 1996 to 2010 were generously provided by Elsevier under an agreement with SciTech Strategies, Inc. We would like to thank Ludo Waltman and Nees Jan van Eck and CWTS for use of the direct citation clustering software. This research is supported by the Intelligence Advanced Research Projects Activity (IARPA) via Department of Interior National Business Center (DoI/NBC) contract number D11PC20152. The U.S. Government is authorized to reproduce and distribute reprints for Governmental purposes notwithstanding any copyright annotation thereon. Disclaimer: The views and conclusions contained herein are those of the authors and should not be interpreted as necessarily representing the official policies or endorsements, either expressed or implied, of IARPA, DoI/NBC, or the U.S. Government. The sponsor had no role in study design; data collection, analysis or interpretation; writing of the report; and in the decision to publish.
This is an Author Accepted Manuscript copy of an article accepted for publication in Research Policy (2/14/2014).
28
References ALEXANDER, J., CHASE, J., NEWMAN, N., PORTER, A. & ROESSNER, J. D. 2012. Emergence
as a conceptual framework for understanding scientific and technological progress. 2012 Proceedings of Portland International Center for Management of Engineering and Technology: Technology Management for Emerging Technologies, PICMET'12, 1286-1292.
BETTENCOURT, L. M. A., KAISER, D. I. & KAUR, J. 2009. Scientific discovery and topological transitions in collaboration networks. Journal of Informetrics, 3, 210-221.
BORGMAN, C. L., WALLIS, J. C. & ENYEDY, N. 2007. Little science confronts the data deluge: Habitat ecology, embedded sensor networks, and digital libraries. International Journal on Digital Libraries, 7, 17-30.
BÖRNER, K., HUANG, W., LINNEMEIER, M., DUHON, R. J., PHILLIPS, P., MA, N., ZOSS, A. M., GUO, H. & PRICE, M. A. 2010. Rete-netzwerk-red: Analyzing and visualizating scholarly networks using the Network Workbench Tool. Scientometrics, 83, 863-876.
BOYACK, K. W. & KLAVANS, R. 2010. Co-citation analysis, bibliographic coupling, and direct citation: Which citation approach represents the research front most accurately? Journal of the American Society for Information Science and Technology, 61, 2389-2404.
BOYACK, K. W. & KLAVANS, R. 2014. Creation of a highly detailed, dynamic, global model and map of science. Journal of the Association for Information Science and Technology, DOI: 10.1002/asi.22990.
BOYACK, K. W., KLAVANS, R., SMALL, H. & UNGAR, L. 2014. Characterizing the emergence of two nanotechnology topics using a contemporaneous global micro-model of science. Journal of Engineering and Technology Management, DOI: 10.1016/j.jengtecman.2013.07.001.
BRAUN, T., GLÄNZEL, W. & SCHUBERT, A. 1985. Scientometric indicators: A 32 country comparative evaluation of publishing performance and citation impact, Singapore, World Scientific Publishing.
CHEN, C. 2006. CiteSpace II: Detecting and visualizing emerging trends and transient patterns in scientific literature. Journal of the American Society for Information Science and Technology, 57, 359-377.
CHEN, C., CHEN, Y., HOROWITZ, M., HOU, H., LIU, Z. & PELLIGRINO, D. 2009. Towards an explanatory and computational theory of scientific discovery. Journal of Informetrics, 3, 191-209.
CHEN, C., HU, Z., LIU, S. & TSENG, H. 2012. Emerging topics in regenerative medicine: A scientometric analysis in CiteSpace. Expert Opinion on Biological Therapy, 12, 593-608.
CORNING, P. A. 2002. The re-emergence of "emergence": A venerable concept in search of a theory. Complexity, 7, 18-30.
COZZENS, S., GATCHAIR, S., KANG, J., KIM, K., LEE, H. J., ORDONEZ, G. & PORTER, A. 2010. Emerging technologies: Quantitative identification and measurement. Technology Analysis and Strategic Management, 22, 361-376.
DE HAAN, J. 2006. How emergence arises. Ecological Complexity, 3, 293-301. FRICKEL, S. & GROSS, N. 2005. A general theory of scientific/intellectual movements. American
Sociological Review, 70, 204-232. GARFIELD, E., SHER, I. H. & TORPIE, R. J. 1964. The use of citation data in writing the history of
science, Philadelphia, Institute for Scientific Information. GOLDSTEIN, J. 1999. Emergence as a construct: History and issues. Emergence, 1, 49-72. GUO, H., WEINGART, S. & BÖRNER, K. 2011. Mixed-indicators model for identifying emerging
research areas. Scientometrics, 89, 421-435. HIRSCH, J. E. 2005. An index to quantify an individual's scientific research output. Proceedings of
the National Academy of Sciences of the USA, 102, 16569-16572. HOPCROFT, J., KHAN, O., KULIS, B. & SELMAN, B. 2004. Tracking evolving communities in
large linked networks. Proceedings of the National Academy of Sciences of the USA, 101, 5249-5253.
HOSONO, H. 2008. Interview in ScienceWatch.com [Online]. Available: http://archive.sciencewatch.com/dr/erf/2008/08decerf/08decerfHoso/.
KATZ, J. S., STEWART, S., GOW, T. A. K. & MARTIN, B. 2001. Science Foresight Project Final Report Volume 1, DSTL/TR01697. Defence Science and Technology Laboratory/MOD.
This is an Author Accepted Manuscript copy of an article accepted for publication in Research Policy (2/14/2014).
29
KLEINBERG, J. M. 2002. Bursty and hierarchical structure in streams. Proceedings of the 8th ACM SIGKDD International Conference on Knowledge Discovery and Data Mining, 91-101.
MANE, K. & BÖRNER, K. 2004. Mapping topics and topic bursts in PNAS. Proceedings of the National Academy of Sciences of the USA, 101, 5287-5290.
MITOLA III, J. & MAGUIRE JR., G. Q. 1999. Cognitive radio: Making software radios more personal. IEEE Personal Communications, 6, 13-18.
MORRIS, S. A., YEN, G., WU, Z. & ASNAKE, B. 2003. Time line visualization of research fronts. Journal of the American Society for Information Science and Technology, 54, 413-422.
NOVOSELOV, K. S., GEIM, A. K., MOROZOV, S. V., JIANG, D., ZHANG, Y., DUBONOS, S. V., GRIGORIEVA, I. V. & FIRSOV, A. A. 2004. Electric field effect in atomically thin carbon films. Science, 306, 666-669.
OHNIWA, R. L., HIBINO, A. & TAKEYASU, K. 2010. Trends in research foci in life science fields over the last 30 years monitored by emerging topics. Scientometrics, 85, 111-127.
OVERBYE, D. 2013. At $3 million, new award gives medical researchers a dose of celebrity. New York Times, Feb. 20, 2013.
PRICE, D. J. D. 1965. Networks of scientific papers. Science, 149, 510-515. ROCHE, I., BESAGNI, D., FRANÇOIS, C., HÖRLESBERGER, M. & SCHIEBEL, E. 2010.
Identification and characterisation of technological topics in the field of Molecular Biology. Scientometrics, 82, 663-676.
SCHIEBEL, E., HÖRLESBERGER, M., ROCHE, I., FRANÇOIS, C. & BESAGNI, D. 2010. An advanced diffusion model to identify emergent research issues: The case of optoelectronic devices. Scientometrics, 83, 765-781.
SHAPIRA, P., YOUTIE, J. & ARORA, S. 2012. Early patterns of commercial activity in graphene. Journal of Nanoparticle Research, 14, art. num. 811.
SHIBATA, N., KAJIKAWA, Y., TAKEDA, Y. & MATSUSHIMA, K. 2008. Detecting emerging research fronts based on topological measures in citation networks of scientific publications. Technovation, 28, 758-775.
SHIBATA, N., KAJIKAWA, Y., TAKEDA, Y., SAKATA, I. & MATSUSHIMA, K. 2010. Detecting emerging research fronts in regenerative medicine by the citation network analysis of scientific publications. Technological Forecasting & Social Change, 78, 274-282.
SMALL, H. 1977. A co-citation model of a scientific specialty: A longitudinal study of collagen research. Social Studies of Science, 7, 139-166.
SMALL, H. 1999. Visualizing science by citation mapping. Journal of the American Society for Information Science, 50, 799-813.
SMALL, H. 2006. Tracking and predicting growth areas in science. Scientometrics, 68, 595-610. SMALL, H., BOYACK, K. W. & KLAVANS, R. 2013. Identifying emerging topics by combining
direct citation and co-citation. In: GORRAIZ, J., SCHIEBEL, E., GUMPENBERGER, C., HÖRLESBERGER, M. & MOED, H. (eds.) 14th International Conference of the International Society for Scientometrics and Informetrics. Vienna, Austria.
SWANSON, D. R. & SMALHEISER, N. R. 1996. Undiscovered public knowledge: A ten-year update. Knowledge, Discovery and Data Mining Proceedings, 295-298.
TAKEDA, Y., MAE, S., KAJIKAWA, Y. & MATSUSHIMA, K. 2009. Nanobiotechnology as an emerging research domain from nanotechnology: A bibliometric approach. Scientometrics, 80, 23-38.
TU, Y.-N. & SENG, J.-L. 2012. Indices of novelty for emerging topic detection. Information Processing & Management, 48, 303-325.
UPHAM, S. P. & SMALL, H. 2010. Emerging research fronts in science and technology: Patterns of new knowledge development. Scientometrics, 83, 15-38.
WALTMAN, L. & VAN ECK, N. J. 2012. A new methodology for constructing a publication-level classification system of science. Journal of the American Society for Information Science and Technology, 63, 2378-2392.
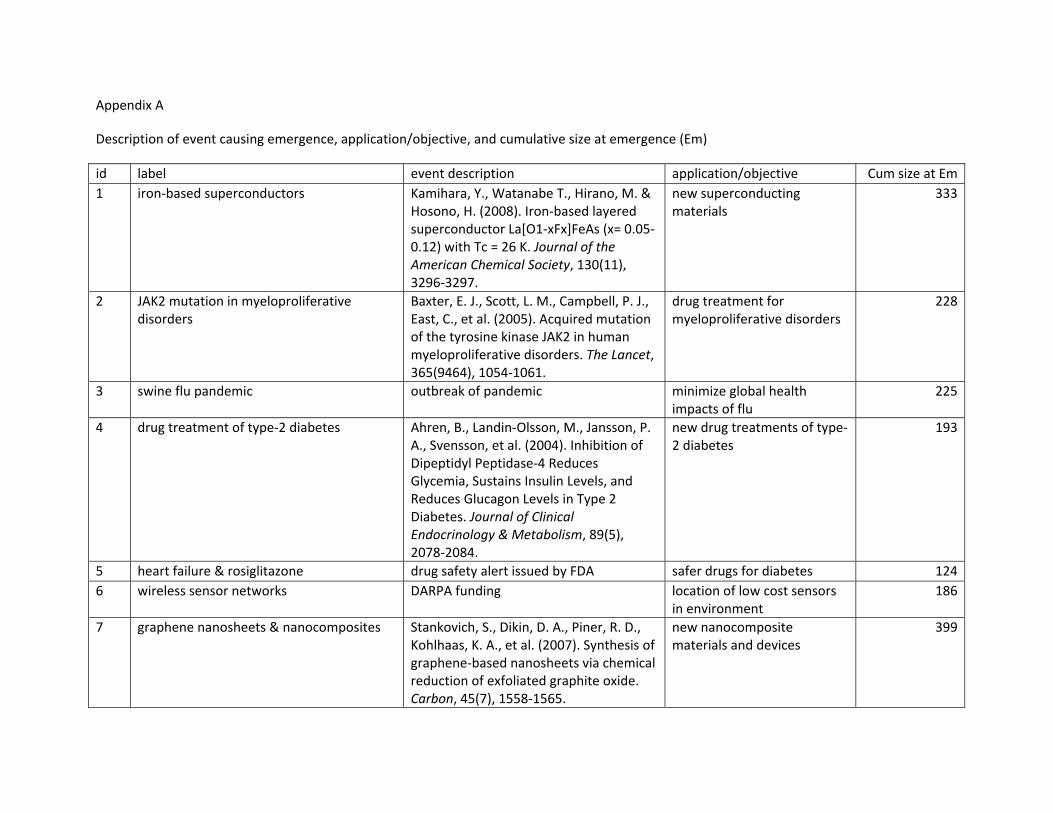
Appendix A
Description of event causing emergence, application/objective, and cumulative size at emergence (Em)
id label event description application/objective Cum size at Em1 iron‐based superconductors Kamihara, Y., Watanabe T., Hirano, M. &
Hosono, H. (2008). Iron‐based layered superconductor La[O1‐xFx]FeAs (x= 0.05‐0.12) with Tc = 26 K. Journal of the American Chemical Society, 130(11), 3296‐3297.
new superconducting materials
333
2 JAK2 mutation in myeloproliferative disorders
Baxter, E. J., Scott, L. M., Campbell, P. J., East, C., et al. (2005). Acquired mutation of the tyrosine kinase JAK2 in human myeloproliferative disorders. The Lancet, 365(9464), 1054‐1061.
drug treatment for myeloproliferative disorders
228
3 swine flu pandemic outbreak of pandemic minimize global health impacts of flu
225
4 drug treatment of type‐2 diabetes Ahren, B., Landin‐Olsson, M., Jansson, P. A., Svensson, et al. (2004). Inhibition of Dipeptidyl Peptidase‐4 Reduces Glycemia, Sustains Insulin Levels, and Reduces Glucagon Levels in Type 2 Diabetes. Journal of Clinical Endocrinology & Metabolism, 89(5), 2078‐2084.
new drug treatments of type‐2 diabetes
193
5 heart failure & rosiglitazone drug safety alert issued by FDA safer drugs for diabetes 1246 wireless sensor networks DARPA funding location of low cost sensors
in environment 186
7 graphene nanosheets & nanocomposites Stankovich, S., Dikin, D. A., Piner, R. D., Kohlhaas, K. A., et al. (2007). Synthesis of graphene‐based nanosheets via chemical reduction of exfoliated graphite oxide. Carbon, 45(7), 1558‐1565.
new nanocomposite materials and devices
399
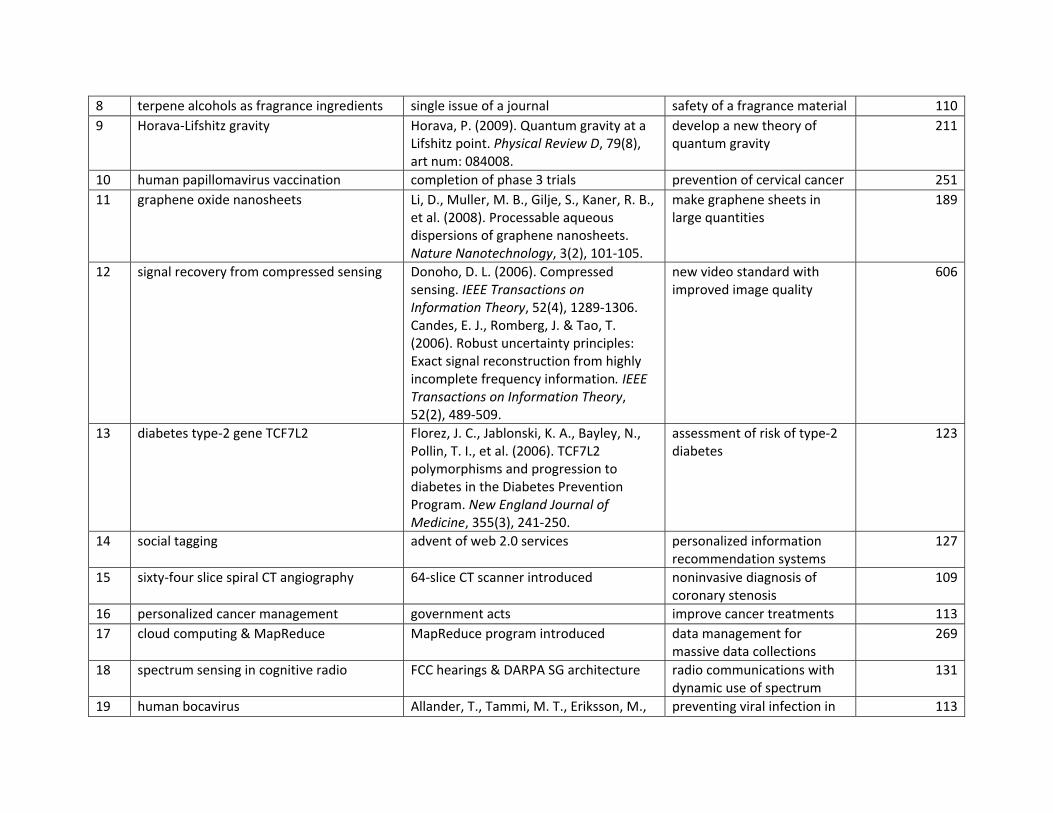
8 terpene alcohols as fragrance ingredients single issue of a journal safety of a fragrance material 1109 Horava‐Lifshitz gravity Horava, P. (2009). Quantum gravity at a
Lifshitz point. Physical Review D, 79(8), art num: 084008.
develop a new theory of quantum gravity
211
10 human papillomavirus vaccination completion of phase 3 trials prevention of cervical cancer 25111 graphene oxide nanosheets Li, D., Muller, M. B., Gilje, S., Kaner, R. B.,
et al. (2008). Processable aqueous dispersions of graphene nanosheets. Nature Nanotechnology, 3(2), 101‐105.
make graphene sheets in large quantities
189
12 signal recovery from compressed sensing Donoho, D. L. (2006). Compressed sensing. IEEE Transactions on Information Theory, 52(4), 1289‐1306. Candes, E. J., Romberg, J. & Tao, T. (2006). Robust uncertainty principles: Exact signal reconstruction from highly incomplete frequency information. IEEE Transactions on Information Theory, 52(2), 489‐509.
new video standard with improved image quality
606
13 diabetes type‐2 gene TCF7L2 Florez, J. C., Jablonski, K. A., Bayley, N., Pollin, T. I., et al. (2006). TCF7L2 polymorphisms and progression to diabetes in the Diabetes Prevention Program. New England Journal of Medicine, 355(3), 241‐250.
assessment of risk of type‐2 diabetes
123
14 social tagging advent of web 2.0 services personalized information recommendation systems
127
15 sixty‐four slice spiral CT angiography 64‐slice CT scanner introduced noninvasive diagnosis of coronary stenosis
109
16 personalized cancer management government acts improve cancer treatments 11317 cloud computing & MapReduce MapReduce program introduced data management for
massive data collections 269
18 spectrum sensing in cognitive radio FCC hearings & DARPA SG architecture radio communications with dynamic use of spectrum
131
19 human bocavirus Allander, T., Tammi, M. T., Eriksson, M., preventing viral infection in 113
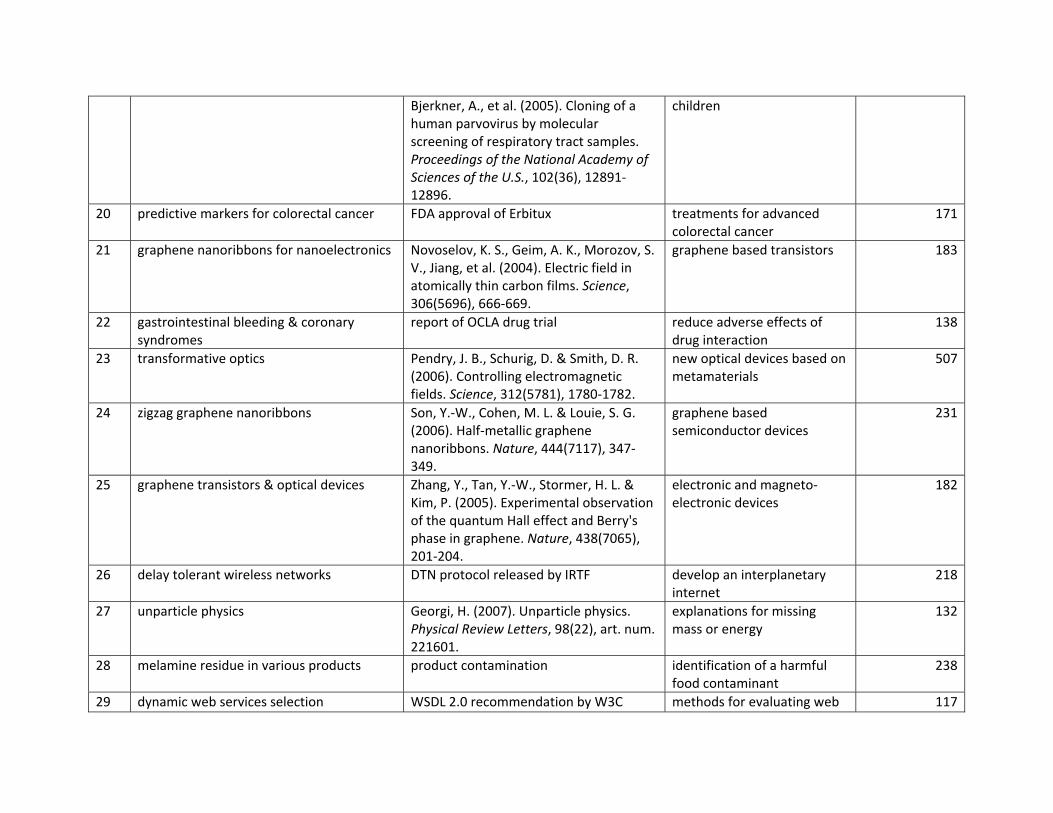
Bjerkner, A., et al. (2005). Cloning of a human parvovirus by molecular screening of respiratory tract samples. Proceedings of the National Academy of Sciences of the U.S., 102(36), 12891‐12896.
children
20 predictive markers for colorectal cancer FDA approval of Erbitux treatments for advanced colorectal cancer
171
21 graphene nanoribbons for nanoelectronics Novoselov, K. S., Geim, A. K., Morozov, S. V., Jiang, et al. (2004). Electric field in atomically thin carbon films. Science, 306(5696), 666‐669.
graphene based transistors 183
22 gastrointestinal bleeding & coronary syndromes
report of OCLA drug trial reduce adverse effects of drug interaction
138
23 transformative optics Pendry, J. B., Schurig, D. & Smith, D. R. (2006). Controlling electromagnetic fields. Science, 312(5781), 1780‐1782.
new optical devices based on metamaterials
507
24 zigzag graphene nanoribbons Son, Y.‐W., Cohen, M. L. & Louie, S. G. (2006). Half‐metallic graphene nanoribbons. Nature, 444(7117), 347‐349.
graphene based semiconductor devices
231
25 graphene transistors & optical devices Zhang, Y., Tan, Y.‐W., Stormer, H. L. & Kim, P. (2005). Experimental observation of the quantum Hall effect and Berry's phase in graphene. Nature, 438(7065), 201‐204.
electronic and magneto‐electronic devices
182
26 delay tolerant wireless networks DTN protocol released by IRTF develop an interplanetary internet
218
27 unparticle physics Georgi, H. (2007). Unparticle physics. Physical Review Letters, 98(22), art. num. 221601.
explanations for missing mass or energy
132
28 melamine residue in various products product contamination identification of a harmful food contaminant
238
29 dynamic web services selection WSDL 2.0 recommendation by W3C methods for evaluating web 117
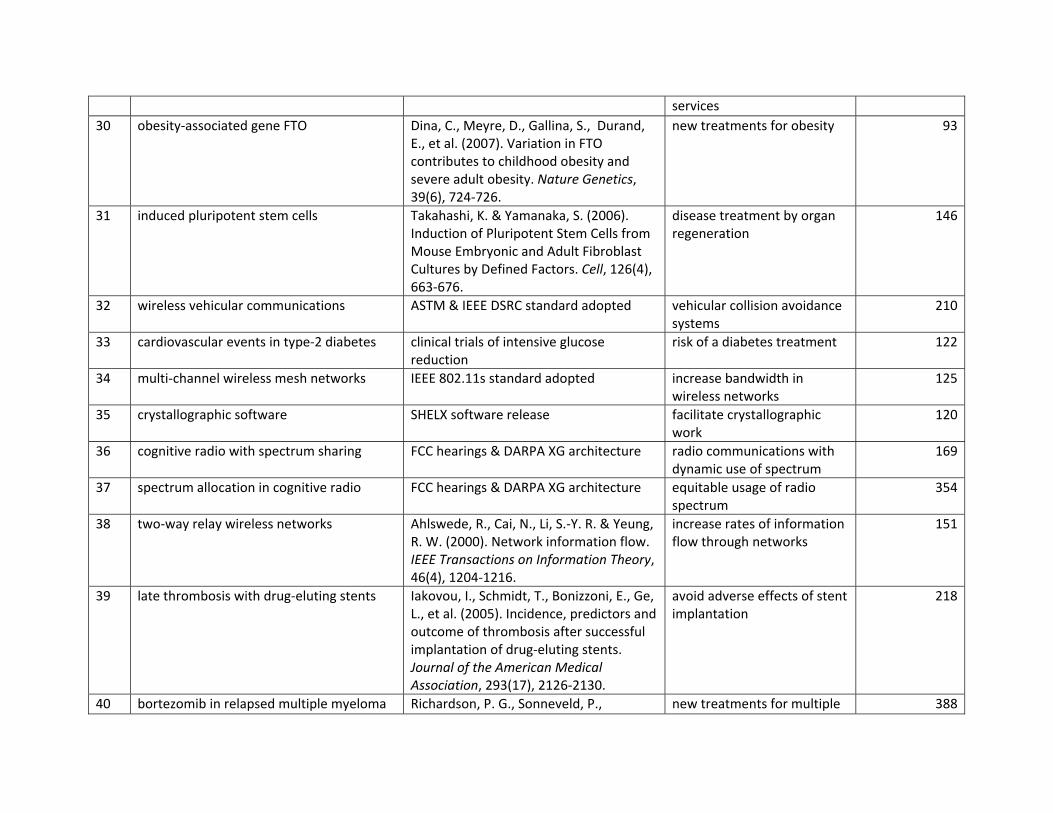
services 30 obesity‐associated gene FTO Dina, C., Meyre, D., Gallina, S., Durand,
E., et al. (2007). Variation in FTO contributes to childhood obesity and severe adult obesity. Nature Genetics, 39(6), 724‐726.
new treatments for obesity 93
31 induced pluripotent stem cells Takahashi, K. & Yamanaka, S. (2006). Induction of Pluripotent Stem Cells from Mouse Embryonic and Adult Fibroblast Cultures by Defined Factors. Cell, 126(4), 663‐676.
disease treatment by organ regeneration
146
32 wireless vehicular communications ASTM & IEEE DSRC standard adopted vehicular collision avoidance systems
210
33 cardiovascular events in type‐2 diabetes clinical trials of intensive glucose reduction
risk of a diabetes treatment 122
34 multi‐channel wireless mesh networks IEEE 802.11s standard adopted increase bandwidth in wireless networks
125
35 crystallographic software SHELX software release facilitate crystallographic work
120
36 cognitive radio with spectrum sharing FCC hearings & DARPA XG architecture radio communications with dynamic use of spectrum
169
37 spectrum allocation in cognitive radio FCC hearings & DARPA XG architecture equitable usage of radio spectrum
354
38 two‐way relay wireless networks Ahlswede, R., Cai, N., Li, S.‐Y. R. & Yeung, R. W. (2000). Network information flow. IEEE Transactions on Information Theory, 46(4), 1204‐1216.
increase rates of information flow through networks
151
39 late thrombosis with drug‐eluting stents Iakovou, I., Schmidt, T., Bonizzoni, E., Ge, L., et al. (2005). Incidence, predictors and outcome of thrombosis after successful implantation of drug‐eluting stents. Journal of the American Medical Association, 293(17), 2126‐2130.
avoid adverse effects of stent implantation
218
40 bortezomib in relapsed multiple myeloma Richardson, P. G., Sonneveld, P., new treatments for multiple 388
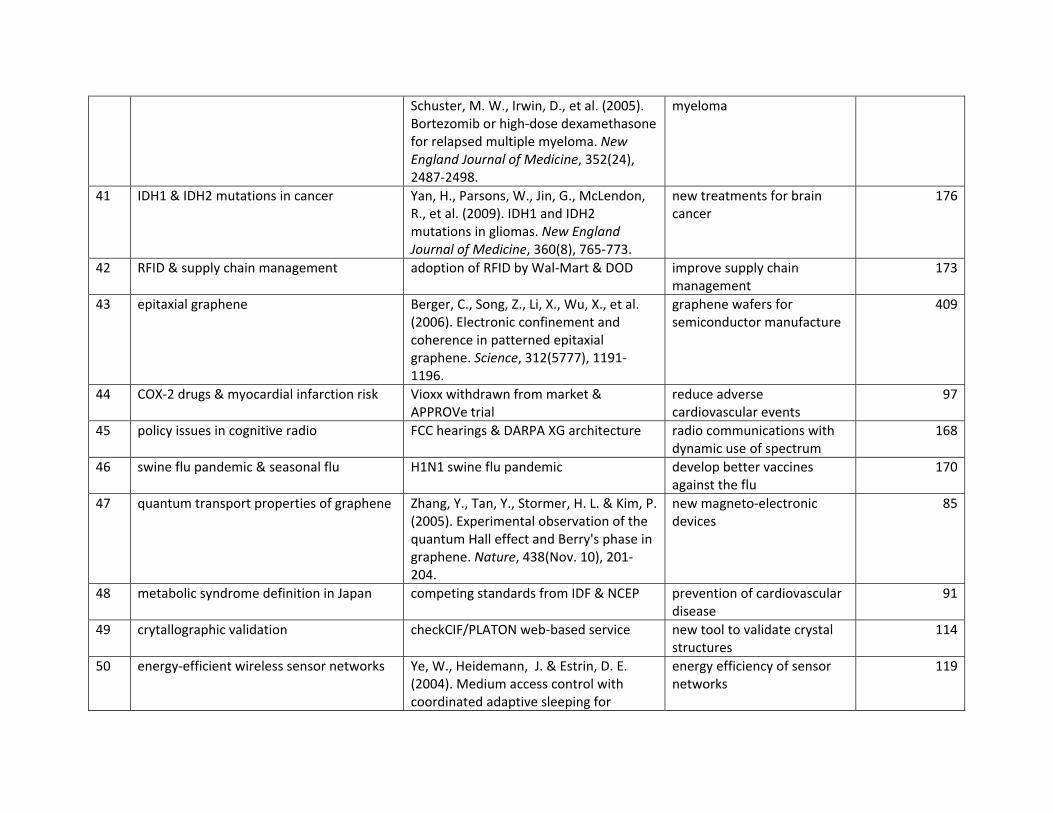
Schuster, M. W., Irwin, D., et al. (2005). Bortezomib or high‐dose dexamethasone for relapsed multiple myeloma. New England Journal of Medicine, 352(24), 2487‐2498.
myeloma
41 IDH1 & IDH2 mutations in cancer Yan, H., Parsons, W., Jin, G., McLendon, R., et al. (2009). IDH1 and IDH2 mutations in gliomas. New England Journal of Medicine, 360(8), 765‐773.
new treatments for brain cancer
176
42 RFID & supply chain management adoption of RFID by Wal‐Mart & DOD improve supply chain management
173
43 epitaxial graphene Berger, C., Song, Z., Li, X., Wu, X., et al. (2006). Electronic confinement and coherence in patterned epitaxial graphene. Science, 312(5777), 1191‐1196.
graphene wafers for semiconductor manufacture
409
44 COX‐2 drugs & myocardial infarction risk Vioxx withdrawn from market & APPROVe trial
reduce adverse cardiovascular events
97
45 policy issues in cognitive radio FCC hearings & DARPA XG architecture radio communications with dynamic use of spectrum
168
46 swine flu pandemic & seasonal flu H1N1 swine flu pandemic develop better vaccines against the flu
170
47 quantum transport properties of graphene Zhang, Y., Tan, Y., Stormer, H. L. & Kim, P. (2005). Experimental observation of the quantum Hall effect and Berry's phase in graphene. Nature, 438(Nov. 10), 201‐204.
new magneto‐electronic devices
85
48 metabolic syndrome definition in Japan competing standards from IDF & NCEP prevention of cardiovascular disease
91
49 crytallographic validation checkCIF/PLATON web‐based service new tool to validate crystal structures
114
50 energy‐efficient wireless sensor networks Ye, W., Heidemann, J. & Estrin, D. E. (2004). Medium access control with coordinated adaptive sleeping for
energy efficiency of sensor networks
119
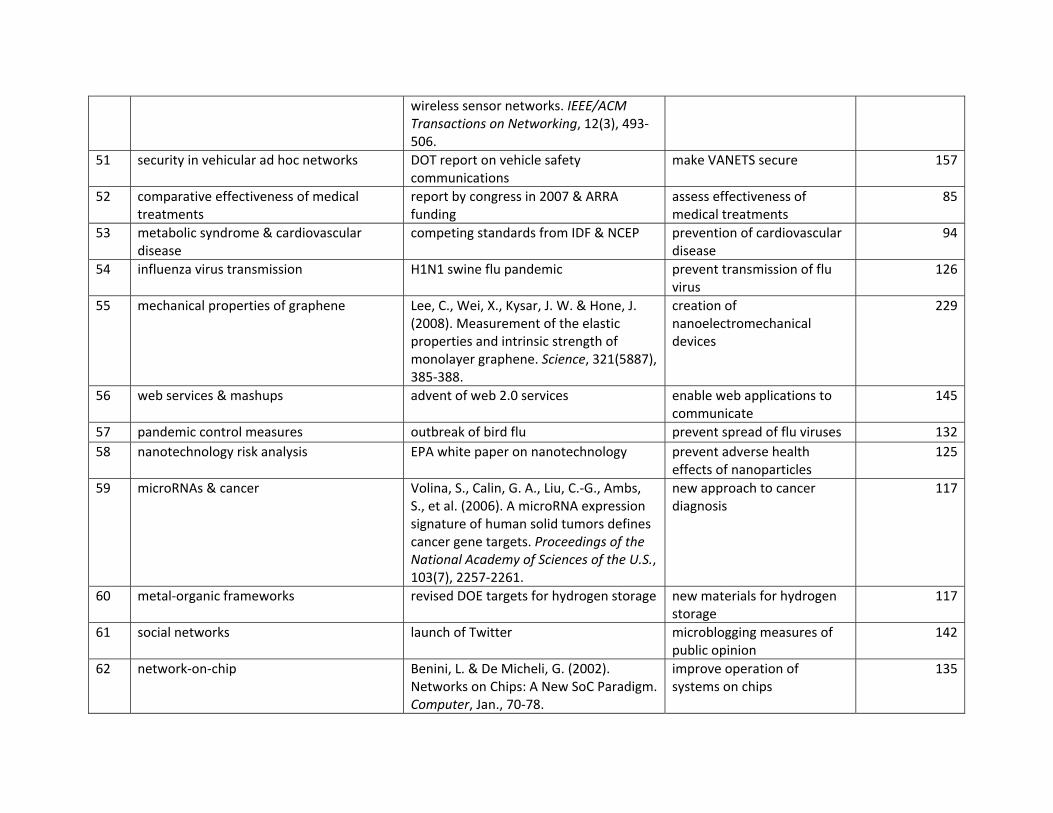
wireless sensor networks. IEEE/ACM Transactions on Networking, 12(3), 493‐506.
51 security in vehicular ad hoc networks DOT report on vehicle safety communications
make VANETS secure 157
52 comparative effectiveness of medical treatments
report by congress in 2007 & ARRA funding
assess effectiveness of medical treatments
85
53 metabolic syndrome & cardiovascular disease
competing standards from IDF & NCEP prevention of cardiovascular disease
94
54 influenza virus transmission H1N1 swine flu pandemic prevent transmission of flu virus
126
55 mechanical properties of graphene Lee, C., Wei, X., Kysar, J. W. & Hone, J. (2008). Measurement of the elastic properties and intrinsic strength of monolayer graphene. Science, 321(5887), 385‐388.
creation of nanoelectromechanical devices
229
56 web services & mashups advent of web 2.0 services enable web applications to communicate
145
57 pandemic control measures outbreak of bird flu prevent spread of flu viruses 13258 nanotechnology risk analysis EPA white paper on nanotechnology prevent adverse health
effects of nanoparticles 125
59 microRNAs & cancer Volina, S., Calin, G. A., Liu, C.‐G., Ambs, S., et al. (2006). A microRNA expression signature of human solid tumors defines cancer gene targets. Proceedings of the National Academy of Sciences of the U.S., 103(7), 2257‐2261.
new approach to cancer diagnosis
117
60 metal‐organic frameworks revised DOE targets for hydrogen storage new materials for hydrogen storage
117
61 social networks launch of Twitter microblogging measures of public opinion
142
62 network‐on‐chip Benini, L. & De Micheli, G. (2002). Networks on Chips: A New SoC Paradigm. Computer, Jan., 70‐78.
improve operation of systems on chips
135
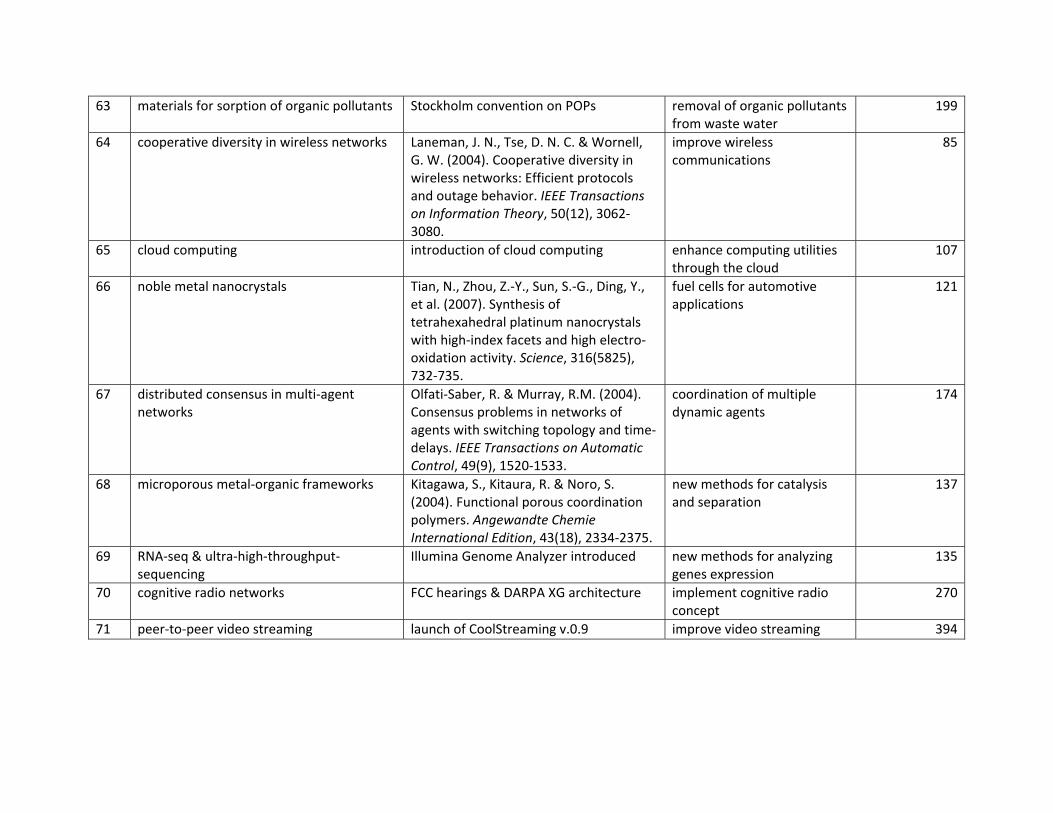
63 materials for sorption of organic pollutants Stockholm convention on POPs removal of organic pollutants from waste water
199
64 cooperative diversity in wireless networks Laneman, J. N., Tse, D. N. C. & Wornell, G. W. (2004). Cooperative diversity in wireless networks: Efficient protocols and outage behavior. IEEE Transactions on Information Theory, 50(12), 3062‐3080.
improve wireless communications
85
65 cloud computing introduction of cloud computing enhance computing utilities through the cloud
107
66 noble metal nanocrystals Tian, N., Zhou, Z.‐Y., Sun, S.‐G., Ding, Y., et al. (2007). Synthesis of tetrahexahedral platinum nanocrystals with high‐index facets and high electro‐oxidation activity. Science, 316(5825), 732‐735.
fuel cells for automotive applications
121
67 distributed consensus in multi‐agent networks
Olfati‐Saber, R. & Murray, R.M. (2004). Consensus problems in networks of agents with switching topology and time‐delays. IEEE Transactions on Automatic Control, 49(9), 1520‐1533.
coordination of multiple dynamic agents
174
68 microporous metal‐organic frameworks Kitagawa, S., Kitaura, R. & Noro, S. (2004). Functional porous coordination polymers. Angewandte Chemie International Edition, 43(18), 2334‐2375.
new methods for catalysis and separation
137
69 RNA‐seq & ultra‐high‐throughput‐sequencing
Illumina Genome Analyzer introduced new methods for analyzing genes expression
135
70 cognitive radio networks FCC hearings & DARPA XG architecture implement cognitive radio concept
270
71 peer‐to‐peer video streaming launch of CoolStreaming v.0.9 improve video streaming 394