Embed Size (px)
Citation preview

Research Report
Identifying Efficiencies in the Supply Chain for Training Ammunition
Methods, Models, and Recommendations
Dwayne M. Butler, Anthony Atler, Stephen M. Worman, Lily Geyer, Bonnie Magnuson
Prepared for the United States Army Approved for public release; distribution unlimited
ARROYO CENTER

Limited Print and Electronic Distribution Rights
This document and trademark(s) contained herein are protected by law. This representation of RAND intellectual property is provided for noncommercial use only. Unauthorized posting of this publication online is prohibited. Permission is given to duplicate this document for personal use only, as long as it is unaltered and complete. Permission is required from RAND to reproduce, or reuse in another form, any of its research documents for commercial use. For information on reprint and linking permissions, please visit www.rand.org/pubs/permissions.html.
The RAND Corporation is a research organization that develops solutions to public policy challenges to help make communities throughout the world safer and more secure, healthier and more prosperous. RAND is nonprofit, nonpartisan, and committed to the public interest.
RAND’s publications do not necessarily reflect the opinions of its research clients and sponsors.
Support RANDMake a tax-deductible charitable contribution at
www.rand.org/giving/contribute
www.rand.org
For more information on this publication, visit www.rand.org/t/rr952
Published by the RAND Corporation, Santa Monica, Calif. © Copyright 2016 RAND Corporation
R® is a registered trademark.

iii
Preface
This report is the result of an investigation of the supply chain for delivering training ammunition to units of the United States Army. The training ammunition supply chain is a large target of opportunity by which the Army can operate more efficiently and avoid unnecessary costs in this era of increasingly reduced resources. This document describes the methods and tools used to analyze the retail level of the ammunition supply chain and offers recommendations for the Army to gain efficiencies therein.
The study reviewed the generation of ammunition requirements, stockpile management processes, and policies and practices at Continental United States (CONUS)-based Ammunition Supply Points (ASPs) and Installation Ammunition Management Offices (IAMO). Additionally, an examination of historical policy, and the U.S. Marine Corps was conducted in order to draw other insights and identify best practices.
The research detailed in this report was conducted in fiscal year 2012. This research was sponsored by U.S. Army Materiel Command (AMC) and conducted within the RAND Arroyo Center’s Forces and Logistics Program. RAND Arroyo Center, part of the RAND Corporation, is a federally funded research and development center sponsored by the United States Army.
The Project Unique Identification Code (PUIC) for the project that produced this document is HQD126220.
For more information about the Arroyo Center’s Forces and Logistics Program, contact the director, Bruce Held, by e-mail at [email protected]; by phone at 310-393-0411, extension 7405; or by mail at the RAND Corporation, 1776 Main Street, Santa Monica, CA 90401-3208. For more information on RAND Arroyo Center, contact the director of operations (telephone 310-393-0411, extension 6419, fax 310-451-6952; email [email protected]), or visit Arroyo’s website at http://www.rand.org/ard.html.
iv
Executive Summary
The U.S. Army Materiel Command (AMC) asked RAND Arroyo Center to analyze the U.S. Army’s training ammunition supply chain to determine where cost reductions could be realized while maintaining or improving service levels. The project targeted a goal of achieving a more efficient supply chain for CONUS-based training ammunition with an eye toward meeting the Army’s requirements for operational preparedness in light of current fiscal constraints. The study reviewed the generation of ammunition requirements, stockpile management processes, and policies and practices at CONUS-based Ammunition Supply Points (ASPs) and Installation Ammunition Management Offices (IAMO). Additionally, an examination of historical policy and the U.S. Marine Corps was conducted in order to draw other insights and identify best practices. This report offers recommendations for achieving efficiencies at the retail level of the supply chain.

v
Contents
Preface ........................................................................................................................................... iii Executive Summary ........................................................................................................................ iv Contents ........................................................................................................................................... v Figures .......................................................................................................................................... vii Tables .......................................................................................................................................... viii Summary ......................................................................................................................................... ix Acknowledgments ....................................................................................................................... xiii Abbreviations ............................................................................................................................... xiv 1. Introduction and Methodology .................................................................................................... 1
Problem Scope ........................................................................................................................................... 2 Methodology Overview ............................................................................................................................. 3 Literature Review ..................................................................................................................................... 4 Data Collection and the RAND ASP Benchmarking Tool ....................................................................... 4 U.S. Marine Corps Case Study ................................................................................................................. 4 Ammunition Community Insights ............................................................................................................ 5 Final Analysis and Creation of Recommendations ................................................................................... 8
2. RAND Ammunition Supply Point Benchmarking Tool ............................................................. 9 RAND ASP Benchmarking Tool Design Requirements ........................................................................... 9 Design Description .................................................................................................................................. 10 Theoretical Approach ............................................................................................................................. 10 Data Sources ........................................................................................................................................... 15 Application of the RAND ASP Benchmarking Tool .............................................................................. 16 Identifying Performance Differences Among ASPs ............................................................................... 16 Guiding Root Cause Analysis ................................................................................................................. 17 Demonstrating the Diversity of Characteristics and Performance Within the Army ASP Community . 18
3. Case Study of the United States Marine Corps ......................................................................... 20 U.S. Marine Corps Comparison .............................................................................................................. 20
4. Findings, Recommendations, and Directions for Future Research ........................................... 24 Findings and Recommendations ............................................................................................................. 24 Condensed Recommendation List ........................................................................................................... 24 Conclusions and Directions for Future Research .................................................................................... 31
Appendix A. Recommendations Within the Ammunition Supply Chain Models and DOTMLPF Framework ........................................................................................................... 33
Appendix B. Design Structure and Data Fields of the RAND Ammunition Supply Point Benchmarking Tool ................................................................................................................. 37

vi
Appendix C. Identifying Efficiencies in the Supply Chain for Training Ammunition Case Study—Fort Hood ................................................................................................................... 44
Appendix D. RAND Ammunition Supply Point Survey ............................................................... 57
References ..................................................................................................................................... 63

vii
Figures
1.1. Overview of the Training Ammunition Processes from Demand Forecast to Disbursement ......................................................................................................................... 6
1.2. RAND Army ASP SIPOC Model ............................................................................................ 7 2.1. RAND ASP Benchmarking Tool Design Theory .................................................................... 11 2.2. Percentage Of “Unforecasted Requests” Related to Training Unit Issue Transactions
for Ten Pilot ASPs in 2011 .................................................................................................. 17 2.3. Ammunition Expenditure Rates by ASP, Grouped into Manpower Bins .............................. 18 2.4. Average Number of Transactions Conducted per Person Annually at Different ASPs ......... 19 A.1. Macro Level Areas for Improvement Identified in the Ammunition Supply Chain ............. 33 A.2. Areas for Improvement Within the RAND ASP SIPOC Model ........................................... 34 A.3. Recommendations Mapped to the Ammunition Supply Chain ............................................. 36 A.4. Recommendations Mapped to the ASP SIPOC Model .........................................................36B.1. Sheet One: Button to Initiate Tool Processes ........................................................................ 37 B.2. Sheet Two: Tool Use and Data Management Directions ...................................................... 38 B.3. Sheet Three: Data Sources and Definitions ........................................................................... 38 B.4. Sheet Four: Input Data ........................................................................................................... 39 B.5. Sheet Five: Bin Identification ................................................................................................ 39 B.6. Sheet Six: Lists of Input Options for Certain Data Fields ..................................................... 40 B.7. Sheet Seven: System-Wide Descriptive Statistics ................................................................. 40 B.8. Sheet Eight: Overall Performance Tables .............................................................................. 41 B.9. Sheet Nine: Regional Performance Tables ............................................................................ 42 B.10. Sheet Ten: Personnel Performance Tables .......................................................................... 43 C.1. Residue Display Board .......................................................................................................... 51 C.2. Steps and Platform Installed for Brass Deformer .................................................................. 53 C.3. Table with Roller Bar Installation ......................................................................................... 54 C.4. Table Without Roller Bar Installation ................................................................................... 54 C.5. Cover over Grating and Metal Plate ...................................................................................... 55 C.6. Plate Cover ............................................................................................................................. 56

viii
Tables
3.1. Findings and Recommendation Topics Partially Influenced by Marine Corps Comparison .......................................................................................................................... 23
A.1. Recommendations Produced to Increase Efficiencies in the Ammunition Supply Chain .................................................................................................................................... 35
C.1. Descriptive Statistics Across Selected ASPs ......................................................................... 45 C.2. Ammunition Residue Yard Brass Conversion Chart ............................................................. 50

ix
Summary
Army munitions are fundamental to Army activities across the range of military operations. Yet munitions are challenging to manage given their unique supply-class properties. Safety and security, accountability and authorization, and methods to identify requirements are part and parcel of the munitions supply chain and make it especially complex. This complexity requires intricate coordination among stakeholders throughout the entire Army, including the Department of the Army (DA)-G3 and the DA-G4; execution agents, such as the U.S. Army Materiel Command (AMC), and their subordinate units; and tactical-level organizations, such as installation Ammunition Supply Points (ASPs) and Army units. Given the range of concerns and stakeholders, there are numerous points in the supply chain at which inefficiencies are possible. Areas of inefficiency could degrade the performance of the supply chain as well as add large, but ultimately avoidable, monetary costs.
The U.S. Army Materiel Command (AMC) asked RAND Arroyo Center to assess the U.S. Army’s training ammunition supply chain to determine where cost reductions could be realized while still maintaining or improving service levels.
Study Methods and Analysis
Like many of its civilian counterparts, the Department of Defense (DoD) subdivides the supply chain into two levels: wholesale and retail. AMC asked that RAND focus primarily on the retail level of the supply chain: the ASPs, where ammunition is stored on bases, distributed to training units, and received from depots, vendors, and other ASPs.
The team leveraged an AMC-provided process map, described in the first chapter of this report, to explore the training ammunition supply chain. Using this process map as a guide, the team identified and collected empirical data, as well as relevant qualitative information, by means of semi-structured interviews in 2011 and 2012.
Special emphasis was placed on identifying and collecting any metrics used to report on the performance of the training ammunition supply chain. To supplement the existing information, the research team created and distributed a survey to ASP personnel and conducted interviews with various stakeholders. This first round of data collection identified a need for enterprise-level or central metrics for ASPs. The ammunition community does not have a standard set of metrics by which to oversee or govern operations across the enterprise. As a result, RAND developed the RAND ASP Benchmarking Tool. This tool and the data collection used to populate it allowed the research team to conduct comparisons of ten sample ASPs across dimensions that included cost, performance, tasks lists, and resources.
x
After determining the relative effectiveness and efficiency of individual ASP attributes using the RAND ASP Benchmarking Tool, the team conducted an in-depth case study of the ASP at Fort Hood, Texas. The practices identified at Fort Hood were loosely binned into the categories of stock management, education, time management, and equipment and facilities efficiencies.Appendix C of this report provides the Fort Hood case study.
Finally, RAND conducted a case study of the ammunition supply chain of the United States Marine Corps (USMC) for applicable best business practices the Army could leverage. The USMC sister-service comparison identified a number of significant differences that offer important insights for the Army’s management of its ASPs. While the number and scale of the Marine Corps ASPs may differ, some of their best practices—enterprise-wide information sharing among practitioners, for instance—were comparable regardless of scale.
Findings and Recommendations In December 2012, a total of 16 discrete findings and recommendations were presented to
AMC to close out the study. For the purpose of this report, those suggestions have been condensed into a prioritized list of 11 recommendations having impacts that range from greatest to least in terms of upgrading the efficiency level in the ammunition community. The 11 recommendations, with brief descriptions, are as follows:
Recommendation 1: Develop standardized metrics and critical information requirements for the ammunition community.
As evidenced by the study team’s need to create a benchmarking tool, the Army lacks a central set of metrics or critical information requirements that are uniform across the ammunition enterprise. This is exacerbated by a plethora of automation systems through which nonstandard metrics or key information must pass to various stakeholders. In order to better make decisions and ensure that ammunition practitioners are seeing a common picture and speaking the same language when they communicate, the Army needs to establish a centralized set of metrics and critical information requirements list. This is especially the case in light of the Army’s current drive to integrate ammunition management into a centralized enterprise resource planning system.
Recommendation 2: Provide guidance and support to improve unit-level forecasting.
Customer units are in need of assistance to consistently and accurately forecast their demands for training ammunition to make workload more balanced and predictable for the ASPs and to avoid the inefficiencies associated with shipping and distributing ammunition that is not needed. While some installations have developed tools that automatically adjust unit forecasts, such tools are not widely used and are not standardized across the service.

xi
Recommendation 3: Provide training to unit personnel who draw ammunition and hold them accountable for procedural discrepancies.
Army ASP personnel highlighted significant increases in unscheduled workload due to high volumes of units being unprepared to receive the ammunition at the ASP. Some locations reported rates as high as 90 percent of unit pick-ups that involved unprepared customers, while others reported problems with only 5 percent. Cross-leveling practices across the installations and/or centrally managing customer pick-up training, in addition to holding unit leaders accountable, will help reduce this workload-exacerbating dynamic.
Recommendation 4: Develop Standard Operating Procedures (SOPs).
Many ASPs suffer from a lack of written SOPs that capture necessary day-to-day activities and describe essential tasks for ammunition technicians. Despite differences across ASPs, AMC should provide guidance on how ASPs should develop functional SOPs. Furthermore, requiring all ASPs to have an SOP and holding the leaders accountable where they are not in compliance is also needed.
Recommendation 5: Standardize the rules of allocation for personnel and equipment assigned to ASPs and IAMOs.
ASP managers lack the Tables of Distribution and Allowance (TDAs) needed to identify authorized personnel and equipment for each location. A lack of TDAs complicates manpower management and makes it difficult to develop Position Descriptions (PDs) for ammunition personnel. Furthermore, there is no standard list of equipment available. The Army could standardize a list of authorized personnel and equipment for each site and authorize site-specific requirements on a case-by-case basis.
Recommendation 6: Establish clearly defined position descriptions for ASP personnel and IAMOs.
Currently, there is no standard by which to assess which ASP personnel are over- or under-worked. This affects the ability to make overall ASP staffing recommendations. The Army is in need of clearly defined PDs for ASP personnel that include specific troop and time-to-task metrics for measuring workload and creating training plans. Efficiencies may be gained by describing PDs, command relationships, and the lines of communication between Installation Ammunition Managers and ASP personnel.
Recommendation 7: Seek improved methods for employing active and reserve duty ammunition soldiers.
Ammunition professionals comprise a low-density, highly skilled career field, and ASP managers use borrowed manpower, over-hires, overtime, and contractor personnel to fill gaps. In some cases, it may be possible for ASP managers to obtain the use of local, active duty, and

xii
reserve duty units to assist in surges of workload where appropriate. Also, ASP managers should conduct deliberate and detailed manpower analysis.
Recommendation 8: Address safety shortfalls.
The study revealed a number of procedures that are potentially hazardous for personnel manning ASP sites. As these deficiencies relate directly to the safety of personnel, addressing them is of paramount importance. Examples of notable safety shortfalls are provided in Chapter 4.
Recommendation 9: Improve knowledge sharing across the ammunition community.
Stakeholder discussions suggested that the Army ammunition community is in need of a more prolific knowledge sharing system. A regular publication or website could serve as a central point to share information on standardized tools and business applications.
Recommendation 10: Investigate the potential for continuous inventory control to enhance inventory accountability.
As an example, the USMC’s Inventory Accuracy Control Team incrementally conducts continuous inventories in similar fashion to those set forth in Army regulations for classes of supplies other than ammunition. Conducting more-frequent incremental inventories will bolster inventory accuracy and improve manpower utilization.
Recommendation 11: Consider reducing the residue and reconciliation burden on the ASPs.
Army ASPs invest substantial amounts of time, equipment, manpower, training, and facilities for residue and reconciliation processes and appears to be the only military service in the DoD conducting operations in this manner. Unlike the USMC, for example, whose units drive directly to a Defense Reutilization and Marketing Office (DRMO) to have residue recycled or thrown away, Army units return dunnage directly to the ASP where it is sorted, weighed, and documented.
Measuring ASP and Community Performance
To overcome the lack of metrics addressed in recommendation 1 above, RAND developed a benchmarking tool that allowed for quantitative comparisons across ASPs, using a wide range of metrics. The tool served the RAND study by illuminating a baseline for ASP performance; it also provides an initial suite of metrics the Army can apply and expand more broadly.
xiii
Acknowledgments
RAND gratefully acknowledges all those who participated in and facilitated our collection of data from multiple sources, including the soldiers and Marines, Department of Defense civilians and contractors, and personnel from U.S. Army Materiel Command, U.S. Army Sustainment Command, U.S. Joint Munitions Command, and those Ammunition Supply Points and Installation Ammunition Management Offices who graciously offered their time to fill out surveys and opened their doors to our research team. We thank them for their willingness to inform this study. We would also like to extend our thanks to Patrick Mills and David Oaks for their thorough and thoughtful reviews, which greatly improved the strength of this manuscript.

xiv
Abbreviations
AHA Ammunition Holding Area AMC Army Materiel Command APG Aberdeen Proving Ground ARFORGEN Army Force Generation ARY Ammunition Residue Yard ASP Ammunition Supply Point ATACS Automated Tactical Ammunition Classification System BAO Battalion/Brigade Ammunition Officer CAM Centralized Ammunition Manager CONUS Continental United States DA Department of the Army DAC Department of the Army Civiliandemil demilitarization DODAAC Department of Defense Activity Address Code DODIC Department of Defense Identification Code DOL Directorate of Logistics
DOTMLPF Doctrine, Organization, Training, Materiel, Leadership and
Education, Personnel and Facilities DRMO Defense Reutilization and Marketing Office EDUR Electronic Daily Unit Report EOD Explosive Ordnance Disposal FORSCOM Forces Command FY fiscal year HQDA Headquarters, Department of the Army IAC Inventory Accuracy Control IAM Installation Ammunition Manager IAMO Installation Ammunition Management Office IAW In Accordance With IMCOM Installation Management Command JMC Joint Munitions Command JP Joint Publication MAKE Marine Ammunition Knowledge Enterprise MARCORSYSCOM Marine Corps Systems Command MARID Marine Infantry Division MOA Memorandums of Agreement

xv
MTOE Military Table of Organization and Equipment NCO Non-Commissioned Officer NEW Net Explosive Weight NLAC National Level Ammunition CapabilityNLT No Later Than PD Position Descriptions PM Program Manager OIC Officer in charge QASAS Quality Assurance Specialist (Ammunition Surveillance) QD Quantity Distance SCS Supply Control Study SINCGARS Single Channel Ground and Airborne Radio System SIPOC Suppliers-Inputs-Processes-Outputs-Customers SME Subject Matter Expert SOP Standard Operating Procedures STAMIS Standard Army Management Information System T&R Training and Readiness TAMIS Total Ammunition Management Information System TDA Table of Distribution and Allowances TRADOC Training and Doctrine Command USMC United States Marine Corps WARS Worldwide Ammunition Reporting System
1
1. Introduction and Methodology
In 2010, the U.S. Army distinguished its profession of arms as one that is “unique because of the lethality of our weapons and our operations. Soldiers are tasked to do many things besides combat operations, but ultimately . . . the core purpose and reason the Army exists is to apply lethal force.”1 As suggested here, Army munitions are central to the preparation and conduct of armed conflict. Munitions are used every day of the year during training at numerous military installations and in exercises around the world as well as in combat operations.
Because munitions are critical to the Army’s operations, their management must be optimized so as to enhance strategic response and force sustainment. Any failure along this supply chain can result in the immediate lack of readiness, injury, or loss of life of Army and civilian personnel, and failure to achieve the operational successes on which the country’s security rests. Ammunition supply chain mismanagement can also be costly since such a volatile commodity can be expensive to move and relocate. These and other reasons make Army munitions an especially challenging and important class of supply to manage.
First, ammunition (Class V items) includes hazardous materials with sensitive safety and security requirements. Second, unlike other consumable commodities, munitions are considered a “free issue” to units. Because budgets and internal markets mechanisms are lacking, ammunition demand is controlled through a rigorous process of authorizations based on the forecasting of training requirements by the operational community or consumers of the ammunition. This differs from other commodities. With little to no analogous application outside of military use, munitions are provided to Army units through a combination of pushing during times of expected combat and pulling for training and resupply.2 Both processes use a rigorous requirements determination process controlled by operations personnel across the Army, working in tandem with the stockpile managers under the control of the sustainment community.
Finally, adding to the complexity involved in managing such a commodity is the intricate coordination among stakeholders throughout the entire Army, with the service-level stakeholders of the DA-G3 and the DA-G4 as the proponent partnership. It is important to note that the DA-G3 is responsible for the requirements determination side of the ammunition supply chain in concert with ammunition users in Army organizations. The stockpile management side of the ammunition supply chain is represented at the service level by the DA-G4, with the U.S. Army Materiel Command (AMC) and its subordinate units serving as the materiel integrators for
1 “The Profession of Arms,” Army White Paper, December 8, 2010, online. 2 Class V differentiation characteristics were provided by DA-G4.

2
ammunition as a commodity and as stockpile managers through the ammunition supply points at the point-of-use level.
RAND Arroyo Center was asked by AMC to assess the Army’s training ammunition supply chain to determine how service levels could be maintained or improved while reducing affiliated costs. Like many of its civilian counterparts, the Department of Defense subdivides the supply chain into two levels: wholesale and retail.3 AMC asked RAND to focus primarily on the retail level of the supply chain: the ammunition supply points (ASPs) where ammunition is stored on bases, distributed to training units, and received from depots, vendors, and other ASPs.
Problem Scope Ideally, a cost efficiency study would include direct comparisons of standardized
performance metrics and financial costs for given functions over time. Additionally, measuring the relative manpower efficiency would compare actual ASP operations at different locations to universal troop-to-task or time-to-task standards. However, as the research team began mapping the supply chain and investigating the processes that ASPs employed, it became apparent that measuring efficiencies and comparing ASPs to one another would be challenging for a number of reasons:4
• No standard ASP exists. ASPs vary widely in certain key attributes, including their number of transactions or workload; number and types of customers; types of personnel assigned (military, contractor, or DoD civilian); and operating practices.
• ASP operating budgets do not exist. No standard requirements exist by which ASP managers are to monitor or control operating budgets or maintain itemized accountability of costs. Each installation manages its resources differently.
• Baselines for common ASP processes do not exist. Position descriptions, performance standards, and universal troop-to-task guidelines were not standardized throughout the retail ammunition enterprise. In addition to different processes being conducted at any given location, there was no standard expectation of performance across the service for common functions. For example, the task of inspecting 1,000 rounds of a common type of bullet returned to the ASP may take longer at one location than at others and there are no standards identified for how long it should take. The absence of performance standards made it difficult to discern whether any given ASP is over- or under-
3 The wholesale level involves planning for, and providing, bulk quantities of materiel, with major functions including development, requirements, determination, procurement, distribution, maintenance, and disposal. The retail level activities place the specific demands for supplies and equipment with the wholesaler, maintains accounts for the users, and distributes stock to users. 4 These challenges were generally identified throughout interviews and survey responses from ASP personnel during the summer of 2012.

3
performing. Furthermore, diverse equipment allocations across the different ASPs limit the efficacy of comparing any individual ASP to a single standard.
• Measuring actual workload is limited and is not captured in one database. Some ASP workload data, such as the number of ammunition issues conducted, number of customers an ASP serves, and the additional work created by failed residue inspections, are captured in various locations. Reportedly, these data are currently dispersed in at least 23 different information systems and databases, and much of the information is collected at a level that does not accurately describe the workload being conducted.5 For example, the number of issues does not account for the significant difference between the workload required to inspect, transport, and issue a single container of small arms munitions and that required for a large, unit-combined arms training exercise with diverse and more problematic types of ammunition. Likewise, the number of customer units may provide a general sense of how much of the Army a given ASP supports, but the figures do not indicate whether a given customer unit was supported once per year or fifty times per year, limiting its effectiveness as a measure of workload.
• Army ASP operations are not monitored at the central enterprise level nor does a system exist by which to do so. Individual installations and ASPs may maintain records of specific data to monitor their own performance over time, but there did not appear to be any service-wide performance metrics for ASPs. Thus, the service itself is limited in identifying which ASPs are performing poorly or well; this precludes determining those that are performing efficiently as well.
• Performance and cost efficiencies cannot be measured by a single metric. ASP operations include numerous interrelated tasks. We found that it is possible to perform some individual processes effectively and efficiently; however, those individual successes may come at a cost to adjacent processes. For example, in order to achieve overall efficiencies associated with logistics, ammunition issues cannot be examined in isolation from inventory and transportation costs.
Methodology Overview To overcome the complexity of the training ammunition enterprise, RAND utilized a
methodology that consisted of five phases:
5 RAND interviews with officials from AMC, ASC, and JMC in January 2013 identified that the Logistics Information Warehouse run by the Logistics Support Activity was conceptualized as an enterprise solution and depository for all logistics data. However, multiple systems and “plug-in” programs are used for ammunition processes. Many of these are currently in the process of undergoing changes, while other useful data are not collected at all. Furthermore, DA G-4 review programs captured approximately 120 different elements for their assessments, many of which officials found highly subjective.

4
Literature Review
This phase primarily comprised a literature review of doctrine, ASP audit reports, and investigations. These products included those internal and external to the Department of the Army and the Department of Defense. AMC and its subordinate commands were also instrumental in providing briefings and policy documents for RAND’s review. The primary objective of this phase was to develop a holistic overview of the training ammunition system, including stakeholders, systems, and practices.
Data Collection and the RAND ASP Benchmarking Tool
As mentioned above, the ammunition community has no central system of metrics and uses dozens of different data systems. Thus, RAND searched for ammunition-related data in multiple databases and then tested a number of potential performance metrics that could be measured using the available data. RAND primarily drew data from three information systems: Standard Army Ammunition System–Modernized (SAAS-MOD), Total Army Munitions Information System (TAMIS), and the Worldwide Ammunition Reporting System–New Technology (WARS-NT). Elements of these data included transactional histories of munitions issued to training units, numbers and types of units supported by ASPs whether training unit requests were forecasted or not, amounts and types of ammunition authorized to training units, amounts of ammunition returned to ASPs, and many more.
Once the types of data available were determined, RAND worked with Army ammunition Subject Matter Experts (SMEs) to inductively develop a set of possible metrics that could be assessed. In order to measure some of the desired values, RAND developed the RAND ASP Benchmarking Tool, which served as a consolidated database for various data collected from ammunition information systems, interviews, and surveys. With all the required data accessible by a single tool, calculations and comparisons of ASPs across the community became possible. The RAND ASP Benchmarking Tool is discussed in detail in Chapter 2.
U.S. Marine Corps Case Study
A case study of the U.S. Marine Corps training ammunition supply chain was conducted to identify best practices that may be applicable to the Army. Given the noted uniqueness of the Army’s ammunition supply chain, the closest example RAND could find was the U.S. Marine Corps’ management of training ammunition. As a land-based, military service, the Marine Corps shares similar training requirements, uses almost entirely the same types of munitions, and applies similar logistics business processes. The USMC management of training ammunition is described in detail in Chapter 3.

5
Ammunition Community Insights
Informed by quantitative comparisons of ASPs and suggested practices identified during analysis, RAND then sought the opinions and information of Army ammunition management practitioners directly. The two techniques used included a RAND-developed survey, which can be found in Appendix D, and a series of semi-structured interviews. The survey was distributed online to all CONUS ASPs; the team received dozens of responses from individual participants. Ten installations, including a USMC site, were then selected for site visits and more in-depth interviews with personnel from ASPs and Installation Ammunition Management Offices (s). Selection of those installations was intended to get a as great a variety as possible with regard to ASP sizes, types of units supported, geographic locations, and number and type of assigned personnel.
RAND used two broad models of the training ammunition supply chain from which to generate the questions used in both the survey and the interview protocols. The first model was provided by AMC to represent the flow of information and munitions—from requirements generation through multiple forecasting, reviews, requests and authorization processes, and finally to the cross-leveling of stocks to meet demands (Figure 1.1).6
6 Figure 1.1 is a modified chart provided to RAND by AMC. Although only specific steps in the process map were applicable to the focus of this study, the entire figure is provided here to highlight the complexity involved in the process and to show where in the chain of events RAND’s examination primarily occurred. Only the last arrow (if the requested ammunition is on hand at the ASP) or the last two arrows (if not on hand at ASP) represent physical distribution; the rest involve the transfer of information among the stakeholders.
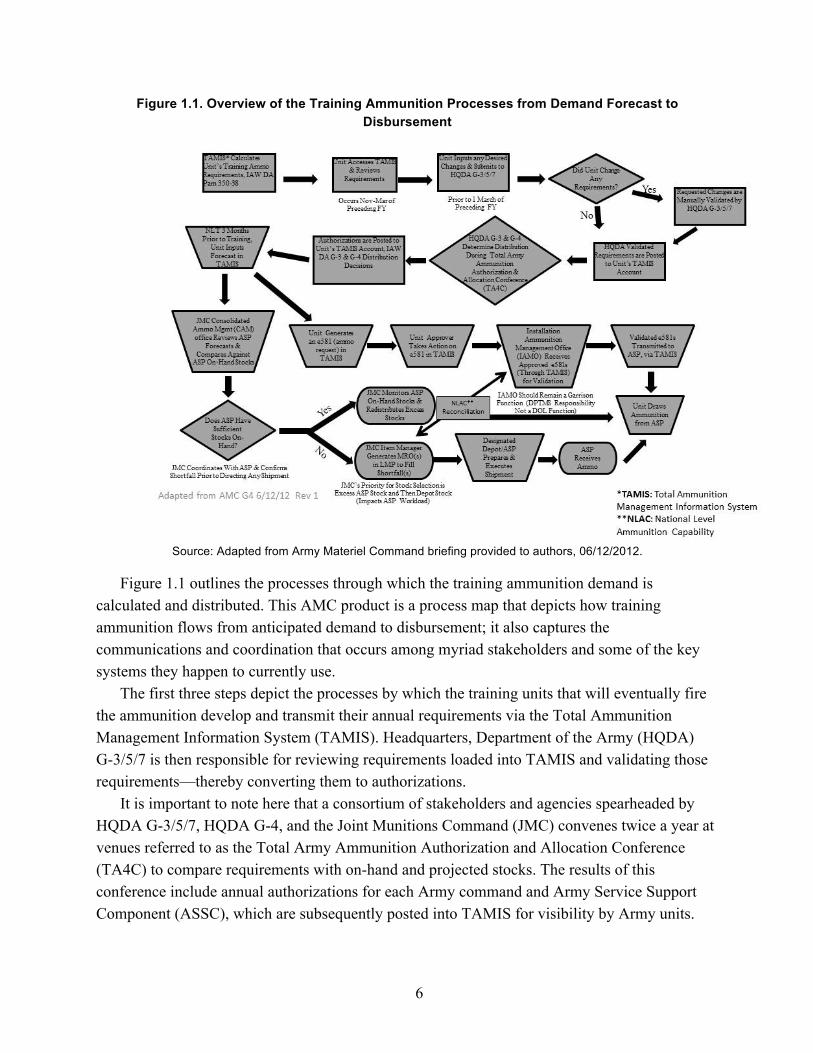
6
Figure 1.1. Overview of the Training Ammunition Processes from Demand Forecast to Disbursement
Source: Adapted from Army Materiel Command briefing provided to authors, 06/12/2012.
Figure 1.1 outlines the processes through which the training ammunition demand is calculated and distributed. This AMC product is a process map that depicts how training ammunition flows from anticipated demand to disbursement; it also captures the communications and coordination that occurs among myriad stakeholders and some of the key systems they happen to currently use.
The first three steps depict the processes by which the training units that will eventually fire the ammunition develop and transmit their annual requirements via the Total Ammunition Management Information System (TAMIS). Headquarters, Department of the Army (HQDA) G-3/5/7 is then responsible for reviewing requirements loaded into TAMIS and validating those requirements—thereby converting them to authorizations.
It is important to note here that a consortium of stakeholders and agencies spearheaded by HQDA G-3/5/7, HQDA G-4, and the Joint Munitions Command (JMC) convenes twice a year at venues referred to as the Total Army Ammunition Authorization and Allocation Conference (TA4C) to compare requirements with on-hand and projected stocks. The results of this conference include annual authorizations for each Army command and Army Service Support Component (ASSC), which are subsequently posted into TAMIS for visibility by Army units.
7
The training units are then responsible for forecasting their monthly expected ammunition needs at least 90 days in advance. The JMC’s Consolidated Ammunition Management (CAM) office conducts monthly reviews of forecasted needs and on-hand stocks at each installation in order to create shipping instructions in the form of Materiel Release Orders (MROs) that ensure on-hand stocks meet expected demands. These MROs are submitted in the Logistics Management Program and can direct ammunition to be delivered from depots or other installation ASPs to those ASPs in need of resupply.
When a unit identifies a specific ammunition requirement, it submits an ammunition request with an electronic form-581 (e-581), which in turn is submitted in TAMIS. A unit approver must approve that request, which is then validated by an Installation Ammunition Management Office. These approvals and validations are also conducted in the TAMIS program. Once validated, the e-581 request is sent to the ASP, which prepares the ammunition for the unit to draw the munitions on the date specified in the request.
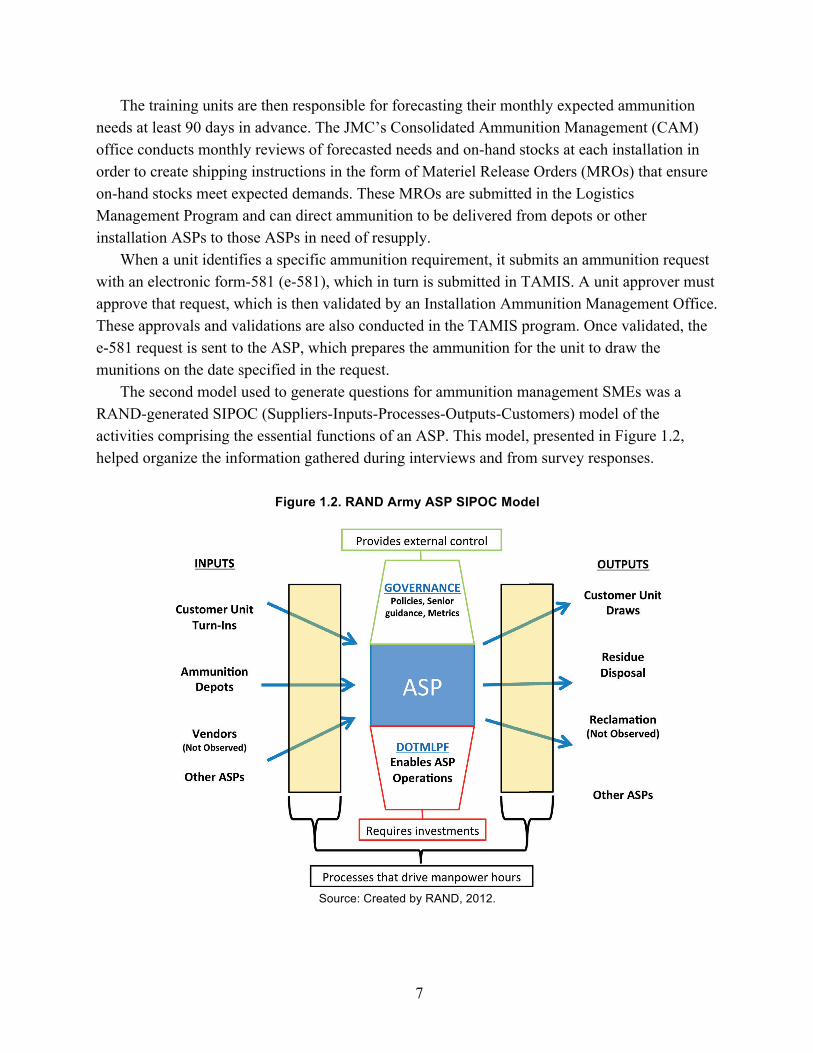
The second model used to generate questions for ammunition management SMEs was a RAND-generated SIPOC (Suppliers-Inputs-Processes-Outputs-Customers) model of the activities comprising the essential functions of an ASP. This model, presented in Figure 1.2, helped organize the information gathered during interviews and from survey responses.
Figure 1.2. RAND Army ASP SIPOC Model
Source: Created by RAND, 2012.

8
Findings from each ASP that RAND investigated were then compared and combined with insights gained from the RAND ASP Benchmarking Tool, USMC case study. In order to demonstrate the level of detail and types of inquiries made at each ASP, a case study of one installation, Fort Hood, was prepared and published as a separate RAND report. That case study can also be found in Appendix C.
Final Analysis and Creation of Recommendations
Information and insights that were combined included the data from ammunition information systems, outputs of the RAND ASP Benchmarking Tool, the case study of the Marine Corps, survey responses, and information collected from semi-structured interviews at ten ASPs. A number of trends were identified when information from these various sources was compared, and a total of 16 discrete recommendations were formed. The recommendations were formulated such that they could be implemented independently of one another and were aligned with respective elements of the Joint Force’s Doctrine, Organization, Training, Materiel, Leadership and Education, Personnel and Facilities (DOTMLPF) framework. For the purpose of this report those suggestions have been condensed into a prioritized list of 11 recommendations having impacts that range from greatest to least in terms of upgrading the efficiency level in the ammunition community. The study’s final findings and condensed recommendations are discussed in detail in Chapter 4 and Appendix A.

9
2. RAND Ammunition Supply Point Benchmarking Tool
Given the lack of cost data, task standards, performance metrics, and the varied characteristics of ASPs, RAND decided to benchmark Army ASPs by means of a tool capable of establishing performance baselines. Without such a tool, the insights gained during SME interviews could be seen primarily as subjective judgments. The RAND ASP Benchmarking Tool allowed for additional quantitative comparisons across ASPs using a wide range of metrics.
While the quantitative comparisons alone could be misleading due to the subtle differences among ASPs, at least three benefits of using the benchmarking tool were identified. First, the tool illuminated a baseline for ASP performance. Second, the tool served as a prototype for a standardized assessment tool, which the Army lacked at the time. Finally, the tool provides an initial suite of metrics the Army can apply and expand more broadly. The remainder of this chapter describes the tool’s design and implementation as it was executed during the study.
RAND ASP Benchmarking Tool Design Requirements
Driving the design of any instrument is a set of concrete and measurable criteria referred to as design requirements.7 In order to develop a useful product for the specific study tasks, RANDdetermined that the RAND ASP Benchmarking Tool would have to meet the following design requirements:
• Customization. Since the RAND ASP Benchmarking Tool was created during the early stages of the data collection phase of the project, it had to be responsive to quick changes. This flexibility was required as the research team learned more about the operations and performance of ASPs. The iterative process of refining both data collection and tool design made it imperative that the tool be easily customizable as new characteristics and metrics of interest were identified.
• Ease of use. The RAND research team valued ease of use to facilitate handing the tool over to the Army for future development and use if desired.
• Reliance on existing data for inputs. Various Army data system managers provided the RAND team with access to large amounts of data from numerous sources. While some data were obtained from the RAND-created survey and interviews, the intent of this tool was to avoid creating additional reporting demands for ASP and Installation Ammunition Management Office (IAMO) personnel in the future.
7 See “How to Write a Design Report,” University of Minnesota, Department of Mechanical Engineering website, 2013.
10
• Outputs displaying a comparative snapshot of multiple ASPs during the same time periods. Given the myriad variables in ASP operations, time was an important commonality to control for. Given the dynamic training environment over the last dozen years of war, the RAND research team wanted to be able to compare performance at different ASPs during the same time period or, if data constraints made that impossible, during similar time periods. As discussed later, the RAND ASP Benchmarking Tool also has significant potential to be used for trend analysis at one or more ASPs to assess progress over time.
Design Description
Theoretical Approach
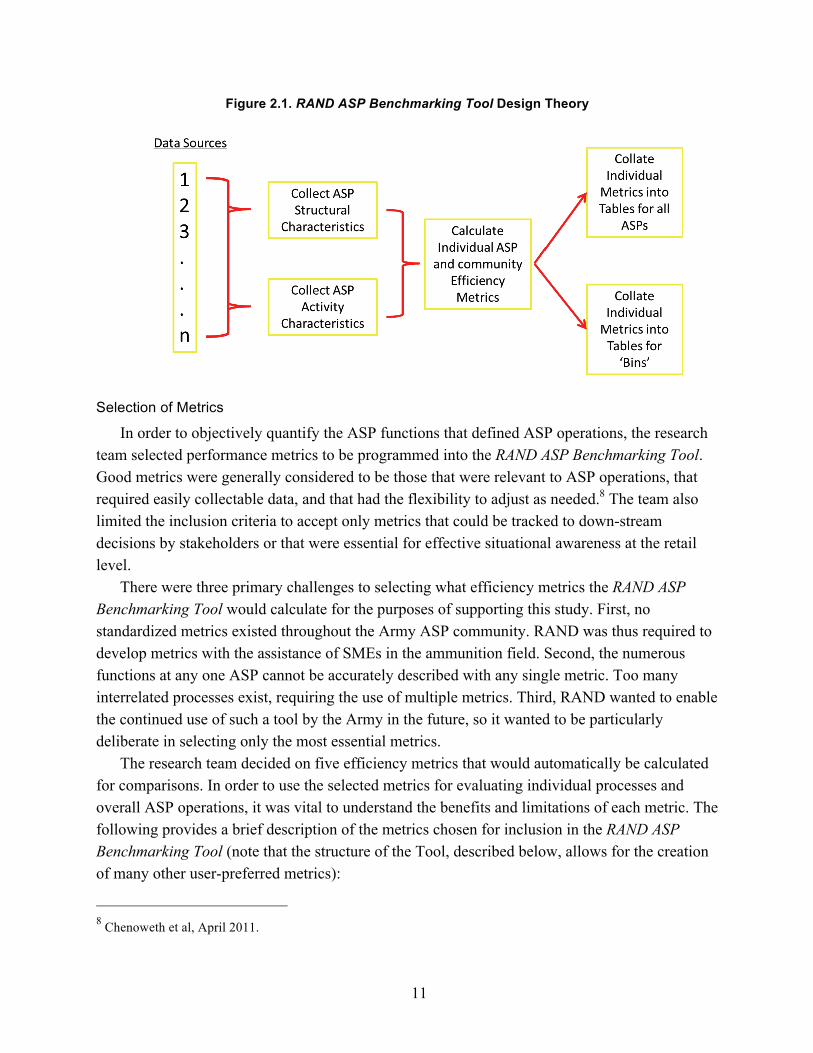
Design Theory
Figure 2.1 depicts the design philosophy of the RAND ASP Benchmarking Tool. It was designed to use data pulled from numerous sources and to separate those data into structural- and activity-related characteristics of individual ASPs. Structural attributes simply delineated ASPs by region (Southeast, Southwest, Midwest, Northeast, and Northwest) based on dollar value of total on-hand stock, and by workforce arrangement (active duty, Department of the Army (DA) civilians, contractors, and different combinations of all three types). Activity characteristics targeted data related to the workload and stockage volume at ASPs.
The tool’s next function was to calculate efficiency metrics selected by the research team and described in the next section. A part of this step included a calculation of descriptive statistical outcomes for the community of ASPs as a whole that could be used as a baseline for comparing all ASPs to the mean or median scores for any given efficiency metric.
Finally, the tool collated individual ASP scores into tables for comparisons. Given the incongruent structural and activity characteristics described above, the tool was designed to give users more options than simply viewing all ASP results at once. It also organizes ASPs into pre-determined “bins” in order to group ASPs with similar characteristics that can control for several variables for more-appropriate comparisons.
11
Figure 2.1. RAND ASP Benchmarking Tool Design Theory
Selection of Metrics
In order to objectively quantify the ASP functions that defined ASP operations, the research team selected performance metrics to be programmed into the RAND ASP Benchmarking Tool. Good metrics were generally considered to be those that were relevant to ASP operations, that required easily collectable data, and that had the flexibility to adjust as needed.8 The team also limited the inclusion criteria to accept only metrics that could be tracked to down-stream decisions by stakeholders or that were essential for effective situational awareness at the retail level.
There were three primary challenges to selecting what efficiency metrics the RAND ASP Benchmarking Tool would calculate for the purposes of supporting this study. First, no standardized metrics existed throughout the Army ASP community. RAND was thus required to develop metrics with the assistance of SMEs in the ammunition field. Second, the numerous functions at any one ASP cannot be accurately described with any single metric. Too many interrelated processes exist, requiring the use of multiple metrics. Third, RAND wanted to enable the continued use of such a tool by the Army in the future, so it wanted to be particularly deliberate in selecting only the most essential metrics.
The research team decided on five efficiency metrics that would automatically be calculated for comparisons. In order to use the selected metrics for evaluating individual processes and overall ASP operations, it was vital to understand the benefits and limitations of each metric. The following provides a brief description of the metrics chosen for inclusion in the RAND ASP Benchmarking Tool (note that the structure of the Tool, described below, allows for the creation of many other user-preferred metrics):
8 Chenoweth et al, April 2011.

12
Metric 1: Percentage of “unforecasted requests” related to training unit issue transactions
Training units are required to forecast their future ammunition expenditures at least three months in advance. Within weeks of actually drawing a portion of that ammunition to be fired, the unit will submit a separate request as an “e581” form in the Total Ammunition Management Information System (TAMIS). A request to draw training ammunition that was not forecasted earlier is considered an “unforecasted request.”9 Since ASPs manage their inventories based on unit forecasts, these types of requests often create additional, unplanned workloads for ASP personnel. They also increase the likelihood that unit requests lack sourcing and thus degrade the potential for training soldiers.
• How this metric was calculated: TAMIS tracks whether or not each e581 form is “valid,” meaning the request had been properly forecasted, or “invalid,” meaning the request is unforecasted. The RAND team counted invalid, unforecasted requests for 2011 for each ASP. Separately, the Worldwide Ammunition Reporting System (WARS) data were used to find the number of transactions considered issues performed by each ASP in 2011. Each ASP’s number of unforecasted requests was then divided by the number of issue transactions to find the unforecasted requests as a percentage of issues.
• Benefits: Larger percentages of “unforecasted requests” detect where training units are most likely to under-forecast their ammunition requirements and create additional workloads for ASPs. This can also serve as an indicator for the relationships and communication between ASPs, Installation Ammunition Managers (IAMs), and training units.
• Limitations: This metric only identifies half of the forecasting challenge, under-forecasting. ASPs that serve units who over-forecast, request, and draw less ammunition than originally forecasted will score well on this metric. However, the excess ammunition that is delivered to the ASP creates additional, unnecessary workloads and requires resources to inspect, store, account for, and potentially redistribute the ammunition, which is also inefficient.
Metric 2: Percentage of expended ammunition related to quantities authorized to be expended
When a training unit’s request to draw ammunition is approved, it does not necessarily mean that the unit will actually fire it all. Many times a training unit will draw ammunition from an ASP, keep it for the duration of their training, and then return it to the ASP for various reasons. The two transactions of issue and return are manpower-intensive processes requiring transportation, inspections, accountability procedures, and potentially repackaging.
9 RAND interviews with AMC and JMC officials during the summer of 2012.

13
• How this metric was calculated: TAMIS data were used to sum the total current authorizations, meaning the amount of ammunition a unit is authorized to draw, as well as total expenditures, meaning the amount of ammunition a unit reports that it has fired, over the years 2007 through 2012.10 For each ASP, total expenditures were divided by total current authorizations to calculate this rate.
• Benefits: This metric can assist in identifying where significant, unplanned workloads are created when training units return ammunition to the ASP. The workload needed to issue and return the same ammunition, which arguably provides the customer unit no training value, represents an inefficient use of resources.
• Limitations: A training unit that draws ammunition may have planned training events poorly or experienced factors outside their control, which would require it to expend less ammunition than planned. Some units have been known to expend additional rounds in a manner that does not have any training value, effectively wasting the ammunition along with all of the resources invested in getting it to the installation in the first place. It was also clear, based on installation amnesty practices, that a number of units often discard unused ammunition in ways that not only increase security concerns but also create additional future work that would have been avoided through a proper return. Furthermore, some commanders believed that there was training value in having soldiers carry real ammunition that was not easily simulated with training aids available to those units.
Metric 3: Estimated percentage of storage capacity used
ASPs store ammunition in large structures called “magazines,” which come in a variety of types and specifications. Numerous safety regulations, physical storage space, and storage practices conducive to efficient inventory and transactions must all be reconciled by ASP managers as ammunition continuously flows in and out of an ASP. This metric is a snapshot in time of how much potential storage space is currently occupied by ammunition.
• How this metric was calculated: The RAND research team asked ASP officials to estimate this figure within the ASP survey. It was then validated through more details collected during in-person interviews at the various installations.
• Benefits: This metric was initially selected to determine if there were locations with excessive open space that could potentially hold more ammunition if needed for redistribution purposes. However, it was also useful when combined with other information gathered. For example, an ASP that is near full capacity, as many were, and has ammunition that has been stored there for many years, requires resources to store and maintain accountability while simultaneously creating the potential for not receiving ammunition required to satisfy near-term forecasts.
10 RAND interviews with AMC and JMC officials during the summer of 2012.

14
• Limitations: Since the data were collected through a survey and interviews versus a standardized tracking mechanism, the figures relied on personal estimates. In addition to having varied customer demands, every ASP has different configurations of magazines and thus different amounts of potential capacity in the first place.
Metric 4: Percentage of “unserviceable assets” related to total assets
Ammunition that is determined to be damaged or faulty to the degree that it cannot be safely expended is considered an “unserviceable asset.” This metric identified how much of an ASP’s total on-hand munitions was being stored despite its being useless to the units the ASP supports.
• How this metric was calculated: Worldwide Ammunition Reporting System (WARS) data provided the total number of assets in each ASP measured in short tons, as well as how many of the assets in short tons were considered unserviceable when the data were pulled in the fall of 2012. The unserviceable short tons were divided by the total short tons at each ASP to calculate this percentage.
• Benefits: Since unserviceable ammunition is categorized as never having been issued from the ASP to a training unit, maintaining stocks of it creates unnecessary costs. This metric helps identify where resources are being wasted to store, account for, and secure unserviceable ammunition. At the many installations that were near full storage capacity, this figure could also identify the potential for an ASP not to be capable of receiving incoming needed and serviceable munitions.
• Limitations: The hundreds of types of ammunition an ASP may store have wide-ranging dimensions, weights, and challenges for handling and storing. By assessing “unserviceable assets” solely by weight, other specifications that may reduce or increase the actual associated costs are not accounted for.
Metric 5: Number of annual transactions per ASP worker
A transaction is conducted anytime a training unit is issued or returns ammunition, as well as when the ASP receives ammunition from the wholesale level or when the ASP sends ammunition away for destruction or other purposes. These transactions are major drivers of overall workload within an ASP. This metric was selected in order to estimate the approximate workload conducted by individuals at each ASP and the respective efficient use of manpower.
• How this metric was calculated: WARS data were used to calculate the average yearly number of relevant, workload-creating transactions at each ASP over the years 2009 through 2011. This number was divided by the number of permanent personnel each ASP reported employing.
• Benefits: Every ASP conducts a different number of transactions in a given time period with differing levels of manpower. Without standards of performance for specific tasks,
15
this aggregate metric of transactions per person may provide a general sense for how efficiently manpower is used at different ASPs.
• Limitations: The number of transactions conducted at a given ASP does not provide insight into the types or quantities of ammunition that are being transported, inspected, and transferred. Different types of ammunition require significantly more time and manpower due to size, weight, and safety regulations. A transaction including large quantities of ammunition will also obviously be more demanding. Installations are all composed of different training units that use different types of training ranges. Also, return transactions that require sorting and inspecting unexpended ammunition before returning it to storage locations may be more time- and resource-intensive than issues to customers, which is not consistent across the community. Finally, it was discovered that at some installations significant numbers of training units arrive at an ASP, begin the issue process, and then fail a vehicle or safety inspection, while at other installations this is less common. If the ammunition issue is not completed, then the additional work conducted will not be recorded as a transaction. Some installations reported this happening infrequently; others suggested it happens multiple times per day.
Binning Methodology
Despite the research team’s attempts to control for a number of factors when selecting efficiency metrics, individual ASPs still had varied fundamental characteristics that were not conducive to direct comparisons for all efficiency metrics. In order to compare like ASPs with each other, all of the structural and activity characteristics collected for ASPs were divided into three separate bins: low, medium, and high. Thus, for each characteristic—such as the number of supported units, transactions, or ASP personnel—an ASP may be placed in different bins. The range of values chosen for each bin was selected by examining the overall distribution of each data field and dividing it into approximate thirds. The ranges of values were chosen with flexibility in mind—if other ASPs were added to the tool and gave a fuller picture of the distribution of each data field, the ranges of values could be reassigned to reflect more-accurate values.
Data Sources
Data were collected for ten ASPs in the first implementation of the RAND ASP Benchmarking Tool: Aberdeen Proving Ground, Fort Benning, Fort Bragg, Fort Carson, Fort Hill, Fort Hood, Fort Irwin, Fort Lewis, Camp Pendleton (USMC), and Redstone Arsenal. These ASPs were selected to provide a range of perspectives in size, location, purpose, and management. The tool was designed, however, to accept inputs for as many ASPs for which data can be collected. Data were collected in a variety of ways during the implementation phase as discussed above.
16
Application of the RAND ASP Benchmarking Tool The ten ASPs selected for examination were analyzed with the RAND ASP Benchmarking
Tool. This subset of CONUS ASPs provided useful insights and assisted in identifying efficient practices applicable to the larger community. The following describes examples of how the tool was applied to assist the research team in highlighting trends and identifying the high-performing ASP processes that were used to develop final recommendations. Note that the figures presented in this section include actual measurements that supported findings; however, ASP names have been replaced by random identifiers to protect any identifiable information.
Identifying Performance Differences Among ASPs
It became apparent early on that, other than safety regulations, a variety of procedures and techniques are applied throughout the ASP community for common tasks. This dynamic benefitted the project team in that it offered numerous methods of comparison but emphasized the challenge of comparing performance metrics that did not previously exist. The RAND ASP Benchmarking Tool, however, was effective in comparing specific efficiency metrics across multiple ASPs. Although these differences did not prove direct causal relationships between ASP processes and higher performance, the correlations were particularly helpful in narrowing the investigation during on-site interviews.
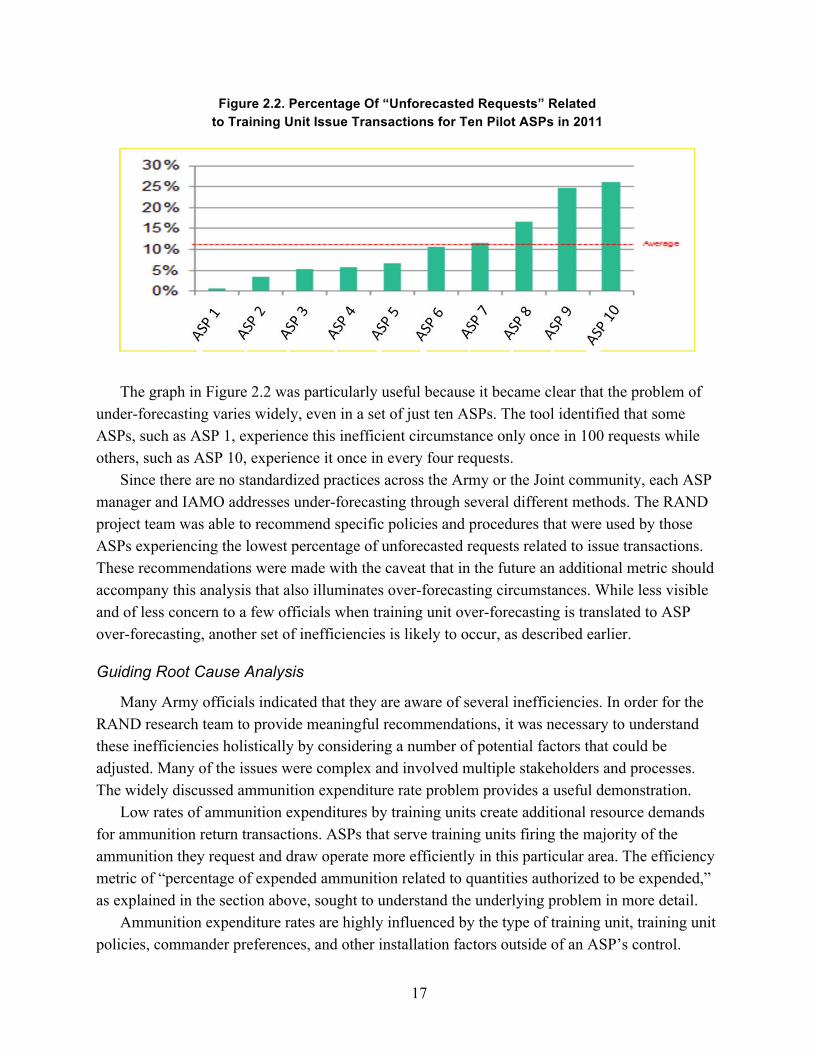
For example, one of the most consistent problems the project team encountered at ASPs was ammunition forecasting. Anecdotally, Army officials reported that inaccurate forecasting can create significant, unplanned workloads but the problem was addressed differently at all ten locations examined. ASP and IAMO personnel interviewed, particularly in locations with available storage space, were primarily concerned with under-forecasting as opposed to over-forecasting, since it could force last-minute requests and coordination with depots, unscheduled inspections, and increase the risk of not being able to support a training unit. Using the data sources described above, the RAND ASP Benchmarking Tool produced a graph (Figure 2.2) to illustrate where under-forecasting was happening most.
17
Figure 2.2. Percentage Of “Unforecasted Requests” Related to Training Unit Issue Transactions for Ten Pilot ASPs in 2011
The graph in Figure 2.2 was particularly useful because it became clear that the problem of under-forecasting varies widely, even in a set of just ten ASPs. The tool identified that some ASPs, such as ASP 1, experience this inefficient circumstance only once in 100 requests while others, such as ASP 10, experience it once in every four requests.
Since there are no standardized practices across the Army or the Joint community, each ASP manager and IAMO addresses under-forecasting through several different methods. The RAND project team was able to recommend specific policies and procedures that were used by those ASPs experiencing the lowest percentage of unforecasted requests related to issue transactions. These recommendations were made with the caveat that in the future an additional metric should accompany this analysis that also illuminates over-forecasting circumstances. While less visible and of less concern to a few officials when training unit over-forecasting is translated to ASP over-forecasting, another set of inefficiencies is likely to occur, as described earlier.
Guiding Root Cause Analysis
Many Army officials indicated that they are aware of several inefficiencies. In order for the RAND research team to provide meaningful recommendations, it was necessary to understand these inefficiencies holistically by considering a number of potential factors that could be adjusted. Many of the issues were complex and involved multiple stakeholders and processes. The widely discussed ammunition expenditure rate problem provides a useful demonstration.
Low rates of ammunition expenditures by training units create additional resource demands for ammunition return transactions. ASPs that serve training units firing the majority of the ammunition they request and draw operate more efficiently in this particular area. The efficiency metric of “percentage of expended ammunition related to quantities authorized to be expended,” as explained in the section above, sought to understand the underlying problem in more detail.
Ammunition expenditure rates are highly influenced by the type of training unit, training unit policies, commander preferences, and other installation factors outside of an ASP’s control.

18
However, interviews suggested that some communication plans and training programs established by ASPs and IAMOs to interact with training units could be responsible for efficiencies in this area. Another factor suggested that could affect expenditure rates was an ASP’s source of manpower (e.g., active duty military personnel, DA civilians, and/or contractors). Using the three different manpower structures observed, the RAND ASP Benchmarking Tool was able to create comparisons between these different manpower model bins of ASPs, as displayed in Figure 2.3.
Figure 2.3. Ammunition Expenditure Rates by ASP, Grouped into Manpower Bins
As Figure 2.3 demonstrates, within the ten ASPs evaluated, the differing use of manpower configurations does not appear to have a significant correlation with expenditure rates. In this situation the tool proved helpful in removing potential factors that explained the problem of low expenditure rates, which allowed the research team to focus on other factors like the training programs offered.
Demonstrating the Diversity of Characteristics and Performance Within the Army ASP Community
Given similar missions of sourcing ammunition to training units there is an expectation that ASPs should be operating in similar ways and to similar levels of performance. However, personnel working at an individual ASP may be limited in their observation of the wide-ranging practices within the community. The RAND ASP Benchmarking Tool compared the basic characteristics and metrics to gain a fuller appreciation for the diversity that exists within the ASP community, itself an area that became of interest in seeking efficiencies.
One of the efficiency metrics selected, for example, was the average number of annual transactions per ASP worker over the years 2009 through 2011. This metric provided a powerful demonstration of varied manpower use across the community. Displayed in Figure 2.4, it was useful for AMC leaders to recognize the variance among ASPs. Also note that without formal

19
standards it was impossible to discern whether an ASP that conducts 100 transactions per person per year was under-performing or whether another ASP conducting 700 transactions per person per year was over-performing.11 Only a relative comparison can be achieved if formal standards have not been established.
Figure 2.4. Average Number of Transactions Conducted per Person Annually at Different ASPs
The comparisons in Figure 2.5 demonstrate the overall variances discovered. However, given the limitations of this metric identified earlier, the recommendations to AMC leaders included assessing these ASPs within the context of characteristics that placed ASPs into similar bins, such as certain locations belonging to Forces Command (FORSCOM) versus Training and Doctrine Command (TRADOC), and that also take into account a variety of other metrics. The RAND ASP Benchmarking Tool proved capable of being customized to satisfy the need for that additional analysis as well.
11 Requests and issue transactions of ammunition as represented by counts of processed e581s. These counts represent an imprecise measure of ASP activity since a single e581 could contain an order for a few boxes of small arms ammunition, requiring a modest amount of ASP effort, while another e581 could comprise an order for several Department of Defense Identification Codes (DODICs) of large-caliber ammunition, requiring significant ASP resources to fill.
20
3. Case Study of the United States Marine Corps
In addition to survey responses, quantitative analysis using the RAND ASP Benchmarking Tool, and semi-structured interviews, RAND’s research was also complemented by a case study of training ammunition operations in the United States Marine Corps (USMC). This chapter reviews the USMC’s approach to managing training ammunition. Data for the case study were collected via policy analysis and interfacing with USMC ammunition stakeholders and a site visit to Camp Pendleton’s ammunition supply point.
U.S. Marine Corps Comparison
The U.S. Marine Corps is an amphibious service with land-based missions and a culture and structure centered on its infantry units. These units’ fundamental mission is to close with and destroy the enemy, thus making ammunition a vital requirement of this objective and those units’ respective training. Therefore, the life cycle management of ammunition is of great importance to the Marine Corps. The Army also uses many of the 300-plus munitions used by Marines, and both services operate within the same DoD environment that seeks efficiencies and is threatened by decreasing resources for accomplishing their respective missions. Once an overview of the Army supply chain for training ammunition was completed, it was determined that there may be value in a relative comparison to the Marine Corps’ supply chain for training ammunition as well.
The purpose of contrasting the two systems was to attempt to discover best practices for analogous processes, determine differences in DOTMLPF that could be further investigated, and to identify similar efforts that can be leveraged jointly in areas where it is not already done. This chapter provides a general overview of the type of comparison conducted and insights gained into the Marine Corps’ management of ammunition that helped inform findings during the analysis phase of the study.
Research into the Marine Corps’ approach to managing training ammunition began with an overview of their munitions lifecycle management in order to contrast it with the Army’s Munitions “Team of Teams.” Navy-Marine Corps Directive 3500.93, the training and readiness manual for ammunition specialties, was reviewed to identify specific standards of performance the Marine Corps has established. Various other Marine Corps Orders and the web sites of their training programs provided insights into other institutional policies. The Program Manager (PM) Ammunition within the Marine Corps Systems Command (MARCORSYSCOM) publishes quarterly newsletters that provided insights into the community of practice from practitioners and managers alike. Finally, RAND conducted semi-structured interviews at the ASP on Marine Corps Base Camp Pendleton in California to ask specific questions and observe the management practices at the retail level directly. The following chapter discusses overall findings and
21
recommendations in more detail; a few of the insights gained from the case study of USMC practices are provided here.
First, the most apparent difference in the Army’s and Marine Corps’ respective tasks of managing training ammunition concerns scale—the Marine Corps has far fewer sites and less ammunition to manage. This may help to explain the greater relative centralization of the Marine Corps’ management under PM Ammunition within MARCORSYSCOM. When compared with the multiple stakeholders involved in the Army’s “Team of Teams,” the Marine Corps may benefit from greater unity of command and centralized planning at the service level, which has occurred to some degree at JMC. Another service-level difference was in the organization of ammunition-related job specialties as well as the management of standards for personnel performance. The Marine Corps’ Training and Readiness (T&R) manual for these ammunition specialties provides a baseline for training and evaluating personnel that establishes the universal conditions, performance steps, standards, and materials that are required to accomplish any given individual or collective task.
One of the most obvious differences in the two services’ policies regarding training ammunition is the treatment of brass and residue following any unit’s training event. The Marine Corps appears to place much more emphasis on training and unit commander responsibilities as opposed to administrative actions; this emphasis can be seen in not requiring units that have drawn training ammunition to return to an ASP to be held accountable for packaging or expended brass. In fact, Marine Corps units will only return to an ASP following a training event if they have excess live ammunition that must be turned back over and reconciled with the ASP. As discussed in the following chapter, this helped identify a number of potentially significant areas in which the Army could gain efficiencies.
Three forms of communication within the Marine Corps community of ammunition managers were highlighted as something not shared by the Army to the same degree. The first was the PM Ammunition quarterly magazine called Ammunition Quarterly which has, over the last ten years, been published to share everything from best business practices and news about various ammunition units to calls for input from practitioners. With articles written by senior managers, ammunition officers, and ammunition technicians at all levels, this journal provides both technical and occupational information.
Of the automated information systems online, the Marine Ammunition Knowledge Enterprise (MAKE) appeared to be one of the more informative and flexible platforms for sharing applications and raw ammunition data. Considered to be the “Ammunition Information Superhighway,” the MAKE supports knowledge management through data mining with daily updates and 16 distinct decision support toolsets.
Finally, at the ASP-to-customer interaction level, Camp Pendleton has established a SharePoint website that not only hosts its Supporting Unit Guide but also contains an Electronic Daily Unit Report (EDUR). The EDUR provides commands with real-time status updates of units conducting ammunition draws, allows units to confirm ammunition draw information

22
before going to the ASP, and makes immediately accessible any discrepancy reports that have improved performance of both the ASP and customer units during the transaction periods.
An effort related to increased communications with customer units at Camp Pendleton was its approach to forecasting, which was regularly identified as a challenging but fundamental part of any ammunition management process. The “Operations Matrix,” employed by the Marines at this installation as a forecasting tool, was more advanced than most tools observed at Army installations and had proven its efficacy in recent years. A combination of process improvements had recently also enabled the Marines to begin testing a 60-day forecasting methodology, as opposed to the 90-day process typically applied.
Other retail-level insights from the Marine Corps review included Standard Operating Procedures (SOPs) developed by ammunition NCOs (E-4s and E-5s), read boards and guides inside every magazine, and redundant log book processes that improved accuracy. With regard to organization, Marine Corps ASPs have created specialized teams in some areas, such as an Inventory Accuracy Control (IAC) team that conducts weekly inventories of random DODICs or storage locations. At the Marine Corps ASP on the installation at Twentynine Palms, California, an integrated quality assurance team was employed by using fixed and mobile workstations that provided immediate access to data management tools. Organizational adjustments and initiatives driven by local leaders demonstrated that total man-hours could be reduced, common errors could be minimized, and the requirement to shut down ASP operations for 100-percent inventories could be removed altogether.
The findings and recommendations presented in the following chapter were all arrived at through a combination of inputs and insights from multiple sources and technique, of which the sister service comparison was only one. In order to demonstrate the usefulness of such comparisons and sharing of practices throughout the large community, those findings and recommendation topics that were at least partially credited to the analysis of Marine Corps practices are included in Table 3.1.

23
Table 3.1. Findings and Recommendation Topics Partially Influenced by Marine Corps Comparison

24
4. Findings, Recommendations, and Directions for Future Research
Findings and Recommendations
The RAND ASP Benchmarking Tool allowed for comparisons of individual ASP attributes using RAND-developed metrics. Results from the RAND survey and semi-structured interviews then provided the context for better understanding those ASP comparisons. The USMC case study yielded a number of useful insights for the Army’s management of its training ammunition enterprise.
In December 2012, a total of 16 discrete findings and recommendations were presented to AMC. Those 16 recommendations, their location within the supply chain, and the associated DOTMLPF areas can be found in Appendix A. For the purpose of this report, these suggestions have been condensed into a prioritized list of 11 recommendations having impacts that range from greatest to least in terms of upgrading the efficiency level of the ammunition community.
Condensed Recommendation List
Recommendation 1: Develop standardized metrics and critical information requirements for the ammunition community.
Overview: As evidenced by the study team’s need to create a benchmarking tool, the Army lacks a central set of metrics or critical information requirements that are uniform across the ammunition enterprise. This is exacerbated by a plethora of automation systems through which nonstandard metrics or key information must pass to various stakeholders. In order to better make decisions and ensure that ammunition practitioners are seeing a common picture and speaking the same language when they communicate, the Army needs to establish a centralized set of metrics and critical information requirements list. This is especially the case in light of the Army’s current drive to integrate ammunition management into a centralized enterprise resource planning (ERP) system.
Finding(s): As discussed earlier, there are numerous challenges to measuring ASP efficiencies. The absence of cost efficiency metrics, for example, has resulted in no demand for cost data to be captured, making a cost efficiency comparison difficult. Supply chain theory suggests that logistics strategies must choose tradeoffs between cost and service depending on the organization’s priorities. In order to conduct reliable assessments, it is necessary for AMC to clearly define what metrics of efficiency will be monitored and ensure that methods are in place

25
to collect appropriate data (e.g., operating budgets, troop-to-task standards, accurate inputs to STAMIS systems, etc.).
Suggestion(s): Once metrics are selected, AMC’s policies, budgets, priorities, and community guidance should drive the establishment of specific goals that can be measured by the selected metrics.
Efficiency Assessment(s): Achievement of specific efficiency goals can be monitored with tools such as the RAND ASP Benchmarking Tool and given context through regular communications with ASP personnel.
Recommendation 2: Provide guidance and support to improve unit-level forecasting.
Overview: Accurate forecasts are important to avoid the inefficiencies associated with shipping and distributing unneeded ammunition. Customer units need assistance to consistently and accurately forecast their training ammunition demands. While some installations have developed tools that automatically adjust unit forecasts, such tools are not widely used and are not standardized across the service.
Finding(s): ASP managers and IAMOs respond to challenges with varying degrees of success when dealing with the inability of customer units to consistently forecast their demands for training ammunition accurately. While some installations have developed tools that automatically adjust unit forecasts, this is not a widespread practice, and there is a need to both better help units adjust their forecasts for training ammunition as well as for ammunition supply points to identify chronic over- or under-forecasting. The ten ASPs visited received a total of 6,351 unforecasted requests in 2011. Filling unforecasted requests creates additional, unscheduled workloads for ASP personnel and increases the likeliness that a unit will not receive its requested training ammunition. This problem is further exacerbated by decreasing time between identifying a demand and the date required to draw ammunition.
Over-forecasting, not recorded in the Standard Army Management Information Systems (STAMIS) but also inefficient, is one of the primary causes of excess storage. Excess storage results in unnecessary workloads to accept, move, store, and provide accountability for ammunition that has no forecasted requirement. Countless man-hours and storage/shipping costs are expended on ammunition that later has to be moved to different ASPs or transferred back to a depot. All ASPs respond to this challenge differently, but some have developed tools (generally using Microsoft Excel) that use historical issue and receipt data, often combined with personal knowledge of installation regulations, to adjust unit ammunition forecasts. Reportedly, Camp Pendleton’s “Operations Matrix” has been so successful that the USMC is considering standardizing the practice across the service.
Suggestion(s): There is a need to review the tools created by the ASPs and/or the IAMOs to meet their needs. Such a review could have the potential for standardization, training, and distribution across the Army.

26
Efficiency Assessment(s): Monitor the unforecasted requests percentages metric with RAND ASP Benchmarking Tool and monitor ammunition excess through reports from ASP managers.
Recommendation 3: Provide training to unit personnel that draw ammunition and hold them accountable for procedural discrepancies.
Overview: Army ASP personnel highlighted significant increases in unscheduled workload due to high volumes of units being unprepared to receive the ammunition when they arrive to pick it up from the ASP. Some locations reported rates as high as 90 percent of unit pick-ups involved unprepared customers, while others reported problems with only 5 percent. Cross-leveling practices across the installations and/or centrally managing customer pick-up training, in addition to holding unit leaders accountable, will help reduce this workload producing dynamic.
Finding(s): Some ASPs report that up to 90 percent of customer units arrive with at least one discrepancy while others estimate problems with less than 5 percent of units. A potentially helpful technique observed at some Army ASPs and Camp Pendleton’s ASP is the use of a Supported Unit Guide (SUG) that is distributed to customer units and is credited with lower rates of discrepancies and less unscheduled and unreported workloads. Some Army ASPs have tried similar techniques in conjunction with installation-required qualifications, but practices vary greatly within the community. Examples of discrepancies that limit efficient operations include possessing insufficient signature cards, hazardous material violations, invalid or missing licenses, or failed vehicle inspections.
Suggestion(s): RAND suggests mandating the documentation and dissemination of information and training regarding standard procedures.
Efficiency Assessment(s): The current suite of metrics (which is not universal across the community) does not include measurements of the units’ preparedness to actually receive the ammunition. Additional reporting from ASP personnel regarding unit readiness can be added to the RAND ASP Benchmarking Tool. In addition, a tool similar to the USMC Electronic Daily Unit Report (eDUR) that tracks the time of each transaction process could be beneficial to future assessments.
Recommendation 4: Develop Standard Operating Procedures.
Overview: Many ASPs suffer from a lack of written SOPs that capture necessary day-to-day activities and describe essential tasks for ammunition technicians. With ASPs being varied by factors such as their customer bases, AMC could still develop a guidebook or set of standards by which ASPs could develop functional SOPs. Furthermore, it will also be necessary to insist that all ASPs have an SOP and to hold their leaders accountable when they are not in compliance.
Finding(s): Almost universally, written SOPs and training of subordinates were not present at ASPs and IAMOs—which are often challenged by regularly heavy workloads. As mentioned earlier in this report, site-specific nuances do exist, but some standardization across common

27
processes may be useful for the ASP enterprise as a whole. Some ASPs suffer from a lack of written SOPs that capture necessary day-to-day activities and describe essential tasks for ammunition technicians. In contrast, at Camp Pendleton junior Marine Corps ammunition technicians develop site-specific SOPs within service and installation guidelines in order to record best practices, solidify buy-in from technicians, reinforce safety, and assist with turnover. ASPs with well-established internal communications are likely to demonstrate greater efficiency metrics compared to other ASPs and are less likely to be negatively affected by transitioning personnel.
Suggestion(s): To mitigate efficiency loss due to the departure of critical civilian and military personnel, the Army should ensure processes are captured in written SOPs. Additionally, the creation of training programs that can be leveraged for the instruction of new personnel might prove beneficial.
Efficiencies could be realized and costs associated with position turn over mitigated by the creation of unit SOPs. Additionally, placing magazine read boards, field return guides, notices and transaction log books inside every magazine promotes compliance with orders and can improve accountability.
Efficiency Assessment(s): ASPs with well-established internal communications, including written SOPs, are likely to demonstrate greater efficiency metrics compared with other ASPs, regardless of how efficiency is measured, and they are less likely to be negatively affected by transitioning personnel.
Recommendation 5: Standardize the rules of allocation for personnel and equipment assigned to ASPs and IAMOs.
Overview: ASP managers lack the Tables of Distribution and Allowance (TDAs) needed to identify authorized personnel and equipment for each location. A lack of TDAs complicates manpower management and makes it difficult to develop Position Descriptions (PDs) for ammunition personnel. Furthermore, there is no standard list of equipment available, and some ASPs lack specific equipment needed to sustain future operations while others are concerned about future funding sources. The Army could standardize a list of authorized personnel and equipment for each site and authorize site-specific requirements on a case-by-case basis.
Finding(s): Many locations maintained accountable officers and Quality Assurance Specialists (Ammunition Surveillance) or QASAS under different Directorate of Logistics (DOL) sections and the ammunition-related sections are organized differently at each installation. The absence of a TDA adds challenges to managing manpower and solidifying PDs for ammunition personnel.
Some equipment (e.g. Automated Tactical Ammunition Classification System (ATACS)) can significantly reduce manpower hours; other equipment (e.g. radios) improves safety and operational control. Some ASPs lack specific equipment needed to sustain future operations; others are concerned about future funding sources for necessary equipment. By using input from

28
ASP personnel, the Department of the Army could standardize a list of authorized equipment for each site. However, if needed, site-specific equipment could still be authorized on a case-by-case basis. These standard documents would also establish a foundation for cost data in terms of manpower and equipment to be measured.
Suggestion(s): Additional standardization can be obtained by standardizing personnel and equipment TDAs for given categories of ASPs determined by demand data available.
Efficiency Assessment(s): The RAND ASP Benchmarking Tool can be used to help categorize ASPs. Optimizing metrics for ASPs with the fewest personnel and least amount of equipment could identify additional lessons learned and organizational structures from top performing ASPs.
Recommendation 6: Establish clearly defined position descriptions for ASP personnel and IAMOs.
Overview: Currently, there is no standard by which to assess which ASP personnel are over- or under-worked. This affects the ability to make overall ASP staffing recommendations. The Army is in need of clearly defined PDs for ASP personnel that include specific troop and time-to-task metrics for measuring workload and creating training plans; as well as for IAMOs. Efficiencies may be gained by describing PDs, command relationships, and the lines of communication between Installation Ammunition Managers and ASP personnel.
Finding(s): A potentially helpful technique observed at Camp Pendleton’s ASP is the practice of training and qualifying ammunition personnel for all required tasks with standardized task descriptions, conditions, standards, and remediation plans. As Installation Ammunition Management Officers have varied responsibilities and involvement in ammunition management, there is no standardized relationship established with ASP personnel, installation staff, or with the customer units.
Suggestion(s): The Army should clearly define PDs for ASP personnel that include specific troop and time-to-task metrics for measuring workload and creating training plans, and for personnel assigned to the IAMOs. By clearly delineating the PDs, command relationships and lines of communication between Installation Ammunition Managers and ASP personnel, efficiencies could be gained.
Efficiency Assessment(s): Efficiencies in this area could be tracked by conducting evaluations of ASP training and qualification programs to determine adherence to empirically developed troop and time-to-task standards.
Recommendation 7: Seek improved methods for employing active and reserve duty ammunition soldiers
Overview: Ammunition professionals comprise a low-density, highly skilled career field, and ASP managers use borrowed manpower, over-hires, overtime, and contractor personnel to fill gaps. In the short term, the Army may wish to consider training ASP managers to integrate

29
and manage a diverse and changing workforce. In some cases, it may be possible for ASP managers to obtain the use of local, active and reserve duty units to assist in surges of workload where appropriate. In the medium term, managers could conduct deliberate and detailed manpower analysis for the community in order to achieve efficiencies.
Finding(s): The integration of soldiers, Department of the Army civilians (DACs), and contractors is inconsistent and often stressed by soldier training requirements, contract concerns, and uncertainty about how to distribute workload. ASP managers use over-hires, overtime, and borrowed military manpower with varying levels of efficiency.
Suggestion(s): In the short term, RAND recommends providing training and supervision to ASP managers for integrating and managing a diverse and changing workforce. In some cases, it may be possible for ASP managers to obtain the use of local, active and reserve duty units to assist in surges of workload where appropriate.
Efficiency Assessment(s): Extend the RAND ASP Benchmarking Tool to all ASPs to monitor metrics as compared to both personnel type and total number of personnel. Gather and distribute best practices and lessons learned from higher-performing ASPs to lower-performing ASPs.
Recommendation 8: Address safety shortfalls.
Overview: The study revealed a number of procedures that are potentially hazardous for personnel manning ASP sites. Because these deficiencies relate directly to the safety of personnel, addressing them is of paramount importance. The Army should identify the specific safety challenges, provide the needed support to rectify the issues, and hold ASP managers and officers in charge (OICs) accountable to established safety procedures.
Finding(s): One notable example is that the Quantity Distance (QD) waiver processes were generally followed, but not by every ASP interviewed. Additionally, safety responsibilities were not uniformly designated between installation safety offices and ASP QASAS officers. Furthermore, some ASPs do not follow the “Two-man rule,” which mandates that two people be present during all magazine processes. ASPs that did not follow this rule generally cited lack of manpower as the main cause for not following this rule.
Suggestion(s): Because these deficiencies relate directly to the safety of personnel, addressing them is of paramount importance. As such, RAND recommended that AMC identify the specific safety challenges being addressed by the ASPs and provide the needed support to rectify the issues. To ensure future compliance, RAND recommended AMC supervise and hold ASP managers and OICs accountable to established safety procedures.
Efficiency Assessment(s): Although enforcing safety regulations will require investment and may not produce immediate operating efficiencies, the consequences of failing to do so could be extremely costly both in terms of personnel injury and lost productivity.
30
Recommendation 9: Improve knowledge sharing across the ammunition community.
Overview: Stakeholder discussions suggested that the Army ammunition community is in need of a more prolific knowledge sharing system. A regular publication or website could serve as a central point to share information on standardized tools and business applications.
Finding(s): The Marine Corps uses a quarterly publication to provide “the ammunition community with relevant and current information of both technical and broad Occupational Field nature.” This publication distributes best practices, senior guidance, community announcements, and more. The Marine Corps also uses its MAKE website, the “Ammunition Information Superhighway,” as a central point for standardized tools, business applications, and information through daily updates.
Suggestion(s): The Army should create an enterprise-level method to increase communications, provide access to useful tools, and promote esprit within the ammunition community. Joint service forums may also be worth considering to more broadly share lessons learned.
Efficiency Assessment(s): Metrics to monitor depend on the types of knowledge distributed in community forums. Using methods established to increase enterprise communications, stockpile managers should seek feedback from all levels within the community.
Recommendation 10: Investigate the potential for continuous inventory control to enhance inventory accountability.
Overview: The USMC’s Inventory Accuracy Control Team incrementally conducts continuous inventories in similar fashion to that set forth in Army regulations for classes of supplies other than ammunition. Conducting more-frequent inventories will bolster inventory accuracy and improve manpower utilization.
Finding(s): The investigations undertaken indicated that changing the inventory convention may improve customer support, reduce the need for inventory adjustment reports, and improve manpower utilization. The cross-service analysis identified a best practice, known as an “Inventory Accuracy Control Team,” which is utilized to conduct continuous inventory control. A potentially helpful technique observed at Camp Pendleton’s ASP is the use of a Physical Inventory Control Process, which includes weekly inventories of random DODICs or storage locations, obviating the need to shut down operations for wall-to-wall inventories while successfully maintaining accurate inventories. However, it is understood that these processes may not be ideal for all locations.
Suggestion(s): This process of incremental and continuous accountability is similar to methods used for other classes of supplies by many Army and Marine Corps units and could be tested within the ammunition community as well.
Efficiency Assessment(s): It may be relatively easy for this technique to be implemented across the ASP enterprise. However, before implementation is mandated throughout the enterprise, several pilot ASPs could be identified to conduct a test of these continuous inventory processes. If results are positive, system-wide inclusion should be considered.

31
Recommendation 11: Consider reducing the residue and reconciliation burden on the ASPs.
Overview: Army ASPs invest substantial amounts of time, equipment, manpower, training, and facilities for residue and reconciliation processes. The Army appears to be the only military service in the DoD conducting operations in this manner. Unlike the USMC, for example, whose units drive directly to a Defense Reutilization and Marketing Office (DRMO) to have residue recycled or thrown away, Army units return dunnage directly to the ASP, where it is sorted, weighed, and documented. The Army might consider reducing the residue burden on the ASPs.
Finding(s): According to Army ASP personnel, residue collection adds significantly to overall requirements. It appears that the U.S. Army is the only DoD service, and potentially the only military service in the world, that requires such reconciliation. U.S. Marine Corps ammunition supply points, on the other hand, do not collect brass or residue. When Army and Marine Corps units finish firing at a range, they have someone from the installation’s range control office inspect the area to make sure they have collected all their brass and trash, load their residue on their trucks, and depart the range. The difference between the two, however, is that the Marine Corps units drive directly to the Defense Reutilization and Marketing Office (DRMO) to have residue recycled or thrown away but the Army units take their dunnage back to the ASP, where it is sorted, weighed, and documented; and discrepancy reports are conducted, stored, and so on, until the ASP personnel mark, load, and transport the materials to a DRMO. In both cases, once the materials are at the DRMO, it is that office’s responsibility to recycle, transport, or throw away what it has received. The money from recycling goes to the installation.
Suggestion(s): RAND recommended that further research be done with regard to current residue and reconciliation practices. The potential effect on DRMO and training units’ manpower resources should be roughly neutral, since the training units provide the labor and transportation to collect and deliver residue whether it goes to the ASP or to the DRMO site, and the DRMO processes residue as one of its main functions. However, further investigations should seek to identify other potential impacts, risks, and benefits.
Efficiency Assessment(s): ASP personnel can report equipment, facilities, and manpower hours reduced if residue and reconciliation tasks were removed, order to measure the savings that would occur on an industrial scale with such a policy adjustment.
Some ASPs lack specific equipment needed to sustain future operations; others are concerned about future funding sources for necessary equipment. By using input from ASP personnel, the Department of the Army could standardize a list of authorized equipment for each site. However, if needed, site-specific equipment could still be authorized on a case-by-case basis.
Conclusions and Directions for Future Research Dynamic environmental factors, such as budgetary constraints or workforce changes, can
require efficient operations and demand timely, relevant performance assessments. As such,

32
stakeholders at all levels need the ability to make informed decisions. Data related to ASP operations are gathered and stored in at least 23 different information systems, thereby reducing efficiency and creating challenges for decisionmaking and comparative analysis across ASPs. Furthermore, some of the data gathered may not support decisionmaking at all, while other datawhich may be relevant are never captured.
This study sought to bridge the current analytic deficiency by creating a benchmarking tool, the RAND ASP Benchmarking Tool, as a prototype for a fully functional ASP management tool. Such a tool should support decisionmaking and track performance over time, in order to assess the benefits of any changes implemented. The creation of automated reports and charts for select metrics would greatly assist senior decisionmakers in any assessment and provide concrete, transparent evidence to assess and validate the performance of the training ammunition enterprise. As demonstrated in Chapter 2, such a tool is feasible, and can provide easy-to-use rule sets, data retrieval, and automated output displays. Last, any tool developed should be fully compatible with Army database systems and should be an enterprise solution for the training ammunition community. Otherwise, best practices cannot be adopted and a full picture of the performance of the ASPs will continue to prove elusive.
To this end, the RAND ASP Benchmarking Tool could assist with monitoring unforecasted requests percentages and could identify those ASPs with a performance that exceeds the standard for their size. Monitoring the ammunition excess reports from the ASP managers can also help to identify the ASPs whose processes are the most efficient and should be made available to other locations. Many of the recommendations proposed could be tracked by extending the RAND ASP Benchmarking Tool coverage to all ASPs. The effort required at each of the Army’s numerous ASPs to compile and enter the requested data would be well worth the investment of time to accomplish. Further, updated automation within information systems used for ammunition management may be designed to decrease or remove the need for any additional reporting requirements. Gathering and distributing best practices and lessons learned from higher-performing ASPs to lower-performing ASPs can help institutionalize exceptional manpower management and other policies. Inefficiencies may be created prior to the recording of metrics currently being tracked through the RAND ASP Benchmarking Tool; therefore, additional reporting from ASP personnel regarding unit readiness could be added to such a tool to provide a better holistic picture of unit performance. These are just some of the ways that this tool, or a newly developed one, could be beneficial to the Army ASP enterprise.
As the DoD draws down from its overseas contingency operations in Afghanistan, resources throughout the Army are also likely to decline. In such an era, finding efficiencies at all levels becomes an ever more important task. To this end, RAND was able to identify areas in which processes and management could be improved for forecasting, distributing, and managing training ammunition.
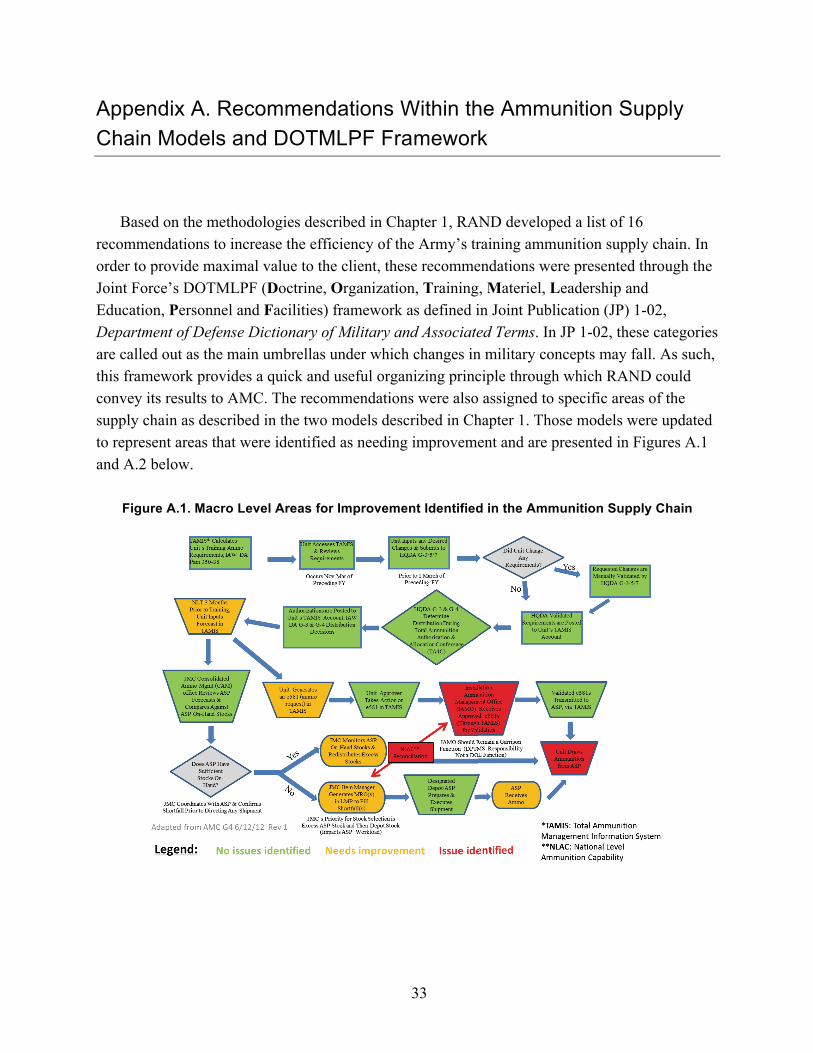
33
Appendix A. Recommendations Within the Ammunition Supply Chain Models and DOTMLPF Framework
Based on the methodologies described in Chapter 1, RAND developed a list of 16 recommendations to increase the efficiency of the Army’s training ammunition supply chain. In order to provide maximal value to the client, these recommendations were presented through the Joint Force’s DOTMLPF (Doctrine, Organization, Training, Materiel, Leadership and Education, Personnel and Facilities) framework as defined in Joint Publication (JP) 1-02, Department of Defense Dictionary of Military and Associated Terms. In JP 1-02, these categories are called out as the main umbrellas under which changes in military concepts may fall. As such, this framework provides a quick and useful organizing principle through which RAND could convey its results to AMC. The recommendations were also assigned to specific areas of the supply chain as described in the two models described in Chapter 1. Those models were updated to represent areas that were identified as needing improvement and are presented in Figures A.1 and A.2 below.
Figure A.1. Macro Level Areas for Improvement Identified in the Ammunition Supply Chain

34
Figure A.2. Areas for Improvement Within the RAND ASP SIPOC Model
Table A.1 below lays out all sixteen recommendations and the DOTMLPF bins under which they fall. The recommendations in this table are organized roughly by the primary resource(s) that the suggested actions were intended to affect most. For example, the first recommendation listed is related to the topic of ammunition forecasting. This recommendation is believed to have a primary impact on both transportation and manpower associated with related processes. Certainly, positive effects on these resources could lead to secondary and tertiary benefits related to other resources such as equipment, time, and munitions—all of which are intended to reduce overall costs while maintaining or improving service. However, the primary resource is identified for the purpose of organizing recommendations presented in this report.

35
Table A.1. Recommendations Produced to Increase Efficiencies in the Ammunition Supply Chain
Because the recommendations crossed various levels of the ammunition supply point enterprise, RAND used the previously created figures to describe at what points in the supply chain the recommendations fall. Figures A.3 and A.4 display where during the supply chain the various recommendations occur.12
12 Table A.1 provides a key to which the recommendation numbers in Figures A.3 and Figure A.4 may be cross-referenced.

36
Figure A.3. Recommendations Mapped to the Ammunition Supply Chain
Figure A.4. Recommendations Mapped to the ASP SIPOC Model

37
Appendix B. Design Structure and Data Fields of the RAND Ammunition Supply Point Benchmarking Tool
The RAND ASP Benchmarking Tool is structured as a ten-sheet, macro-enabled Microsoft Excel workbook. This section provides a brief description of what each sheet contains and how the data, calculations, and outputs are arranged. Note that the images of each data field are provided to better describe the structure of the Tool and contain randomized data in order to protect the sensitive information used in the efficiency study.
Sheet One. The first sheet, pictured in Figure B.1, contains a single button titled “Generate Performance Tables.” When clicked on, this button initiates the VBA macro code that applies all calculations to inputted data.
Figure B.1. Sheet One: Button to Initiate Tool Processes

38
Sheet Two. The second sheet, pictured in Figure B.2, contains directions on how users can add new ASPs and new data fields to the dataset as well as directions on how to run the Tool and generate performance tables.
Figure B.2. Sheet Two: Tool Use and Data Management Directions
Sheet Three. The third sheet, pictured in Figure B.3, contains a list of the sources from which each data field was obtained as well as a brief definition of the fields.
.
Figure B.3. Sheet Three: Data Sources and Definitions

39
Sheet Four. The fourth sheet, pictured in Figure B.4, contains the Tool’s input data. Rows represent each ASP included in the study, and columns represent the various data fields.
Figure B.4. Sheet Four: Input Data
Sheet Five. The fifth sheet, pictured in Figure B.5, identifies the proper bin into which each ASP falls for each data field. Microsoft Excel formulas were used to assign a value of “1” when an ASP belonged to a bin and “0” otherwise.
Figure B.5. Sheet Five: Bin Identification

40
Sheet Six. The sixth sheet, pictured in Figure B.6, contains several lists that constrain the input options for the “Region,” “Army/Sister Service,” and “Personnel” data fields. This prevents a user from entering values that would be problematic for the written VBA macro code.
Figure B.6. Sheet Six: Lists of Input Options for Certain Data Fields
Sheet Seven. The seventh sheet, pictured in Figure B.7, contains overall descriptive statistics for each data field of interest.
Figure B.7. Sheet Seven: System-Wide Descriptive Statistics

41
Sheet Eight. The eighth sheet, pictured in Figure B.8, is the first sheet generated by the VBA macro. It shows tables generated for each data field of interest, ranking each ASP in order of performance.
Figure B.8. Sheet Eight: Overall Performance Tables

42
Sheet Nine. The VBA macro-generated ninth sheet, shown in Figure B.9, breaks ASPs into tables of regions for each data field of interest, then orders them based on the assigned “low,” “medium,” or “high” bin rankings.
Figure B.9. Sheet Nine: Regional Performance Tables

43
Sheet Ten. The VBA macro-generated tenth and final sheet, shown in Figure B.10, breaks ASPs into tables by personnel type for each data field of interest, then orders them based on the assigned “low,” “medium,” or “high” bin rankings.
Figure B.10. Sheet Ten: Personnel Performance Tables

44
Appendix C. Identifying Efficiencies in the Supply Chain for Training Ammunition Case Study—Fort Hood
Fort Hood in Killeen, Texas, is one of the largest and most complex Army bases in the United States and the world, and offers rich and highly generalizable insights into the Army’s ammunition management processes. The following case study of Fort Hood also offers a host of innovative methods for tackling munitions management-related challenges and provides an example of the types of analysis conducted by RAND’s process of combining semi-structured interviews, survey responses, and outputs of the RAND ASP Benchmarking Tool.
Fort Hood Ammunition Management Description
Prior to conducting on-site data collection at Fort Hood on August 2, 2012, RAND analysts compiled information available about Department of Defense Activity Address Code (DODAAC) “West Fort Hood” through TAMIS and WARS. Using the available data, RAND analysts identified the following types of information about Fort Hood’s ASP operations:
• ammunition transaction activity • Ammunition DoD Identification Codes (DODICs) • current authorizations • expenditures • expenditure rates• ASP customer list.
In addition to developing this dataset for Fort Hood, RAND analysts also gathered similar information for nine other ASPs around the country. This complete dataset was used to develop a benchmarking tool. This tool allowed analysts to compare Fort Hood’s operations and those of other ASPs, as discussed in Chapter 2, with averages seen across multiple locations (see Table C.1). The averages presented in the left-hand column of the table below comprise data from the ten pilot ASPs (including Fort Hood) that completed RAND’s ASP survey and from which RAND conducted other on-site interviews.13 Averages from RAND’s benchmarking analysis are compared with Fort Hood values on the right.
13 RAND Ammunition Supply Point (ASP) Interview Protocol, 2012; information from TAMIS, 2012 and WARS, 2012.

45
Table C.1. Descriptive Statistics Across Selected ASPs
Measures Average a Fort Hood
Number of unforecasted requests, 2011 635.1 638 Number of issues, 2011 6,693.7 3,827 Percentage, 2011 unforecasted requests/issues 12% 17% Number of transactions, 2009–2011 average 12,244.6 9,152 Number of customers, 2012 197.4 156 Yearly expenditure rate, 2007–2012 average 45% 31.1% Estimated percent of capacity used, 2012 84% 70%
a Measure averages were calculated using a selected sample of Ammunition Supply Points (ASPs): Aberdeen Proving Ground (APG), Fort Benning, Fort Bragg, Fort Carson, Fort A.P. Hill, Fort Hood, Fort Irwin, Joint Base Lewis-McChord, Camp Pendleton, and Redstone Arsenal. Some data were unavailable or unreliable for each of the ASPs listed here. Thus, some averages and findings described below are compared to eight or nine ASPs instead of all ten.
SOURCE: RAND, using quantitative data gathered through TAMIS and WARS.
The statistics gathered for Fort Hood in particular are relatively on par with those seen at other installations, excluding perhaps the number of issues in 2011 and number of transactions from 2009–2011, where the values seen for Fort Hood are considerably lower than the average. Fort Hood ranked number 7 out of 914 in terms of the percentage of unforecasted requests divided by issues in 2011 at 17 percent, with 9 being the highest at 26 percent (Fort Carson) and 1 being the lowest at 1 percent (Camp Pendleton). Unforecasted requests can occur within TAMIS for a number of reasons, including under-forecasting by training units, changes in operational requirements that affect planning of training events, and the review of forecasts by ammunition managers at multiple levels.
Fort Hood had one of the lowest numbers of average transactions (9,152), 2 out of 915 from 2009 to 2011, with 9 being the highest at 24,091 (Fort Benning) and 1 being the lowest at 1,107 (Aberdeen Proving Ground). The number of transactions, however, is only a measure of how many times a unit draws or turns in ammunition. It does not measure how much ammunition is transferred, what types of ammunition are transferred, and whether a training unit was fully prepared at the time of transaction. Each of those factors could add additional workload not captured in the number of transactions alone.
Fort Hood ranked number 6 out of 10 in terms of the number of customers that it served in 2012 (156 customers), with number 10 (A.P. Hill) being the highest at 500, and number 1 (Redstone Arsenal) being the lowest at 12. The number of customer units can be calculated in different ways, either by the number of signature cards or by the registered TAMIS accounts linked to a certain DODAAC. Thus, this metric applies to units that are not necessarily resident 14 No data were available for Fort A.P. Hill for this metric (unforecasted requests/issues, 2011). 15 No data were available for Fort A.P. Hill for this metric (mean number of transactions, 2009–2011).

46
at Fort Hood but have drawn, or plan to draw, ammunition from its ASP. This figure does not account for the number of transactions each customer unit has requested. In other words, a unit that draws ammunition from the ASP only once is counted the same as a unit that draws ammunition weekly.
Fort Hood ranked 8 out of 10 in terms of the average yearly expenditure rate for the years 2007–2012 (31.1 percent), with number 10 (A.P. Hill) being the lowest at 29.9 percent and number 1 (Fort Benning) being the highest at 69.3 percent. Expenditure rate can be defined as “the quantities of munitions, by Department of Defense identification code (DODIC), that a unit or organization fires in support of operations, training, testing, or new equipment training (NET).”16 Last, Fort Hood ranked number 2 out of 817 in terms of the estimated percentage of storage capacity used in 2012 (70 percent), with number 8 (Fort Irwin) being the highest at 100 percent and number 1 (Joint Base Lewis-McChord) being the lowest at 61 percent.
In summary, none of the statistics derived for Fort Hood seemed to indicate that it was an extreme outlier in relation to the other posts/bases included within the benchmarking analysis and within the selected metrics analyzed. It is possible that a more comprehensive analysis, planned to be conducted by RAND, including more ASPs and more metrics, will provide further insights. In addition to comparisons across the community, the RAND ASP Benchmarking Tool is also capable of monitoring selected metrics over time for Fort Hood alone, which can be used to track progress and follow trends over time.
Also of note, but not included within Table C.1 above, are the statistics available for the types of personnel employed at each ASP, the number of magazines18 each installation ASP is responsible for managing, and the types of installations considered. Fort Hood employs military and civilian personnel to work at its ASP, whereas roughly half of the other installations RAND analyzed employ contractors in addition to military personnel and Department of the Army civilians.19 Another difference seen in the statistics available for Fort Hood is the raw number of magazines that Fort Hood’s ASP is responsible for managing. Compared to the nine other ASPs considered for the benchmarking study, Fort Hood has the largest number of magazines in total (66), although not all of them are serviceable.20 The other ASPs in the benchmarking sample are responsible for managing an average of 30 magazines. It is also likely important to note the variance in the types of installations included within the benchmarking analysis; Fort Hood is considered a Forces Command (FORSCOM) installation as opposed to a Training and Doctrine
16 Headquarters, Department of the Army, 2009. 17 No data were available for Camp Pendleton and Redstone Arsenal for this metric; estimated percentage of storage capacity was used (2012). 18 Ammunition Storage Locations.19 RAND ASP Interview Protocol, 2012. 20 RAND ASP On-site Interviews, 2012.

47
Command (TRADOC) installation like Fort Benning, for example. Initial analysis suggests that perhaps the types of units located on a given installation and thus the predictability of their mission sets may influence the operations of the owning ASP. In other words, the routine operations of training units with relatively predictable class sizes and schedules may influence management practices with regard to forecasting and ammunition expenditures in comparison to FORSCOM units, whose training needs may be more variable over time.
Fort Hood Practices and Ammunition Management Efficiencies In addition to analyzing the quantitative data available for Fort Hood’s ammunition
operations, RAND analysts administered a short, web-based survey to those involved with ammunition management operations on Fort Hood and also conducted an on-site information gathering session with key leaders responsible for the day-to-day operations at Fort Hood. The qualitative data gathered through these methods resulted in RAND analysts identifying a number of practices both common to, and unseen at, other ASPs. The practices identified at Fort Hood can be loosely binned into the categories of stock management efficiencies, education efficiencies, time management efficiencies, and equipment and facilities efficiencies.
Forecasting issues (under-forecasting or over-forecasting) are considered to be a common problem throughout the enterprise ammunition supply management system. Fort Hood has taken unique steps in an effort to manage its ammunition stock and mitigate forecasting inefficiencies. The processes identified at Fort Hood for tracking and re-ordering ammunition were conducted using fairly sophisticated, scientific tracking methods. As opposed to simply ordering the quantities of ammunition suggested by the National Level Ammunition Capability (NLAC) shortage list, the Installation Ammunition Manager (IAM) at Fort Hood used a host of other information, including historical records of ammunition expenditures, to calculate the appropriate quantities of additional stock needed. The IAM at Fort Hood considered the following factors when conducting his Supply Control Study (SCS) each month and also maintains knowledge of other important factors related to unit history, the post, and range statuses to calculate what he will actually order:
• NLAC shortage list. • Historical on-hand data for all ammunition, by DODIC, for the past 12 months.21 • Historical expenditure data for all ammunition, by DODIC, for the past 5 years (including
highlighted highs, lows, and averages of expenditures).22 • The tacit knowledge that unit forecasts are going to drop over the future 90-day period.
For example, the IAM had observed over time that any given unit’s 30-day forecast was 21 Installation Ammunition Manager (IAM), “50-tra-12-08,” 2012. 22 IAM, “Fort Hood ASP Expenditure Report FY 04 Thru FY 11, 2012.
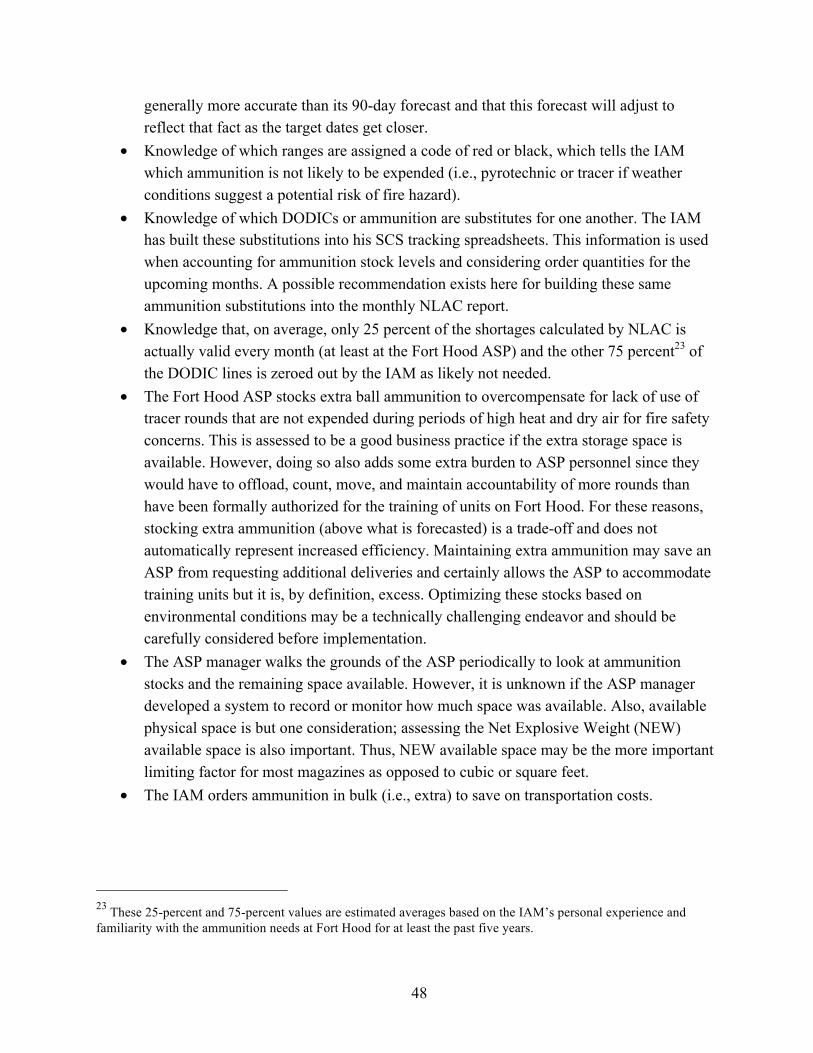
48
generally more accurate than its 90-day forecast and that this forecast will adjust to reflect that fact as the target dates get closer.
• Knowledge of which ranges are assigned a code of red or black, which tells the IAM which ammunition is not likely to be expended (i.e., pyrotechnic or tracer if weather conditions suggest a potential risk of fire hazard).
• Knowledge of which DODICs or ammunition are substitutes for one another. The IAM has built these substitutions into his SCS tracking spreadsheets. This information is used when accounting for ammunition stock levels and considering order quantities for the upcoming months. A possible recommendation exists here for building these same ammunition substitutions into the monthly NLAC report.
• Knowledge that, on average, only 25 percent of the shortages calculated by NLAC is actually valid every month (at least at the Fort Hood ASP) and the other 75 percent23 of the DODIC lines is zeroed out by the IAM as likely not needed.
• The Fort Hood ASP stocks extra ball ammunition to overcompensate for lack of use of tracer rounds that are not expended during periods of high heat and dry air for fire safety concerns. This is assessed to be a good business practice if the extra storage space is available. However, doing so also adds some extra burden to ASP personnel since they would have to offload, count, move, and maintain accountability of more rounds than have been formally authorized for the training of units on Fort Hood. For these reasons, stocking extra ammunition (above what is forecasted) is a trade-off and does not automatically represent increased efficiency. Maintaining extra ammunition may save an ASP from requesting additional deliveries and certainly allows the ASP to accommodate training units but it is, by definition, excess. Optimizing these stocks based on environmental conditions may be a technically challenging endeavor and should be carefully considered before implementation.
• The ASP manager walks the grounds of the ASP periodically to look at ammunition stocks and the remaining space available. However, it is unknown if the ASP manager developed a system to record or monitor how much space was available. Also, available physical space is but one consideration; assessing the Net Explosive Weight (NEW) available space is also important. Thus, NEW available space may be the more important limiting factor for most magazines as opposed to cubic or square feet.
• The IAM orders ammunition in bulk (i.e., extra) to save on transportation costs.
23 These 25-percent and 75-percent values are estimated averages based on the IAM’s personal experience and familiarity with the ammunition needs at Fort Hood for at least the past five years.

49
Forecasting There are two sides to a discussion of the forecasting efficiencies problem. Unforecasted
requests require the ASP to be able to get ammunition to units that didn’t request it, while over-forecasting creates excess and reconciliation later in the process. The ability of an ASP to accommodate unforecasted requests and absorb over-forecasting requests is directly related to its available storage capacity. Arguably, since Fort Hood has more magazines (and thus more cubic storage) than all other ASPs, it may worry less about excess and would be better able to accommodate any unforecasted requests. However, doing so might also create unnecessary work in accountability and storage procedures.
Overall, managing stock is a complex issue and the methods or best practices for each ASP will necessarily vary by ASP need and available resources. Fort Hood’s SCS activities are in line with best practices identified for scientific inventory management. For example, Fort Hood’s IAM uses an efficient order strategy through the use of a “fixed order quantity” method of managing stock:24
Order size = Target stock level – Current stock
where the target stock level is equal to the forecast demand of the next period, plus the forecast demand in lead time, plus the safety stock needed.25 In order to accurately calculate these values, one must keep historical records of expenditure rates, request records, forecast data, and on-hand data, a practice observed by RAND analysts at Fort Hood. Additionally, while this formula seems fairly intuitive, the practice of scientifically determining the target stock level appropriate for a given ASP was not seen at all locations visited. At approximately half of the ASPs visited, IAMs or ASP managers used Supply Control Study tracking tools that they had developed themselves. It does not appear as of this writing that these tools or best practices have been shared throughout the Army ammunition community.
Ammunition Handling Process
The second major category of efficiencies identified at Fort Hood comprised those related to soldier education about ammunition handling, issue, and turn-in operations at the Ammunition Supply Point (ASP) as well as at the Ammunition Residue Yard (ARY). Soldiers in customer units who are unprepared to receive ammunition necessarily create extra work for ASP personnel and slow down the receipt and turn-in of ammunition for all involved. This results in decreased efficiency. As seen in the data from the table above, Fort Hood has roughly 156 different customer units, about 3,827 transactions per year, and roughly around ten transactions per day on
24 Waters, 2001. 25 Waters, 2001.
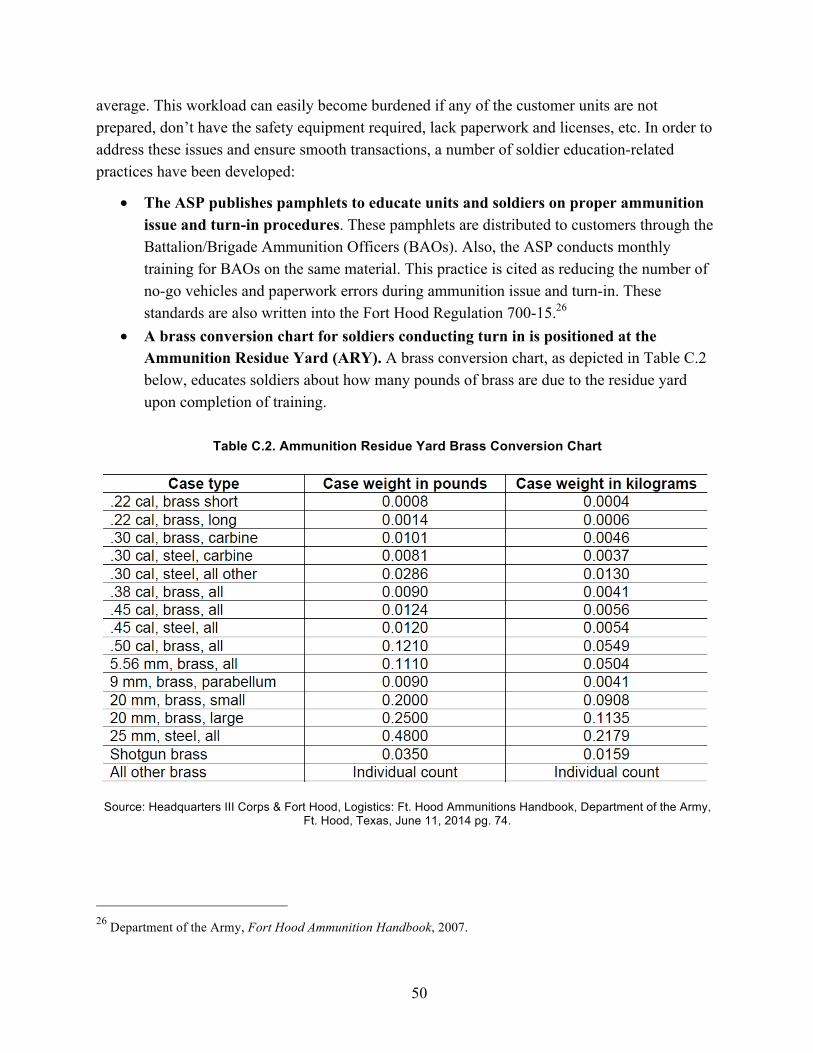
50
average. This workload can easily become burdened if any of the customer units are not prepared, don’t have the safety equipment required, lack paperwork and licenses, etc. In order to address these issues and ensure smooth transactions, a number of soldier education-related practices have been developed:
• The ASP publishes pamphlets to educate units and soldiers on proper ammunition issue and turn-in procedures. These pamphlets are distributed to customers through the Battalion/Brigade Ammunition Officers (BAOs). Also, the ASP conducts monthly training for BAOs on the same material. This practice is cited as reducing the number of no-go vehicles and paperwork errors during ammunition issue and turn-in. These standards are also written into the Fort Hood Regulation 700-15.26
• A brass conversion chart for soldiers conducting turn in is positioned at the Ammunition Residue Yard (ARY). A brass conversion chart, as depicted in Table C.2 below, educates soldiers about how many pounds of brass are due to the residue yard upon completion of training.
Table C.2. Ammunition Residue Yard Brass Conversion Chart
Source: Headquarters III Corps & Fort Hood, Logistics: Ft. Hood Ammunitions Handbook, Department of the Army,
Ft. Hood, Texas, June 11, 2014 pg. 74.
26 Department of the Army, Fort Hood Ammunition Handbook, 2007.
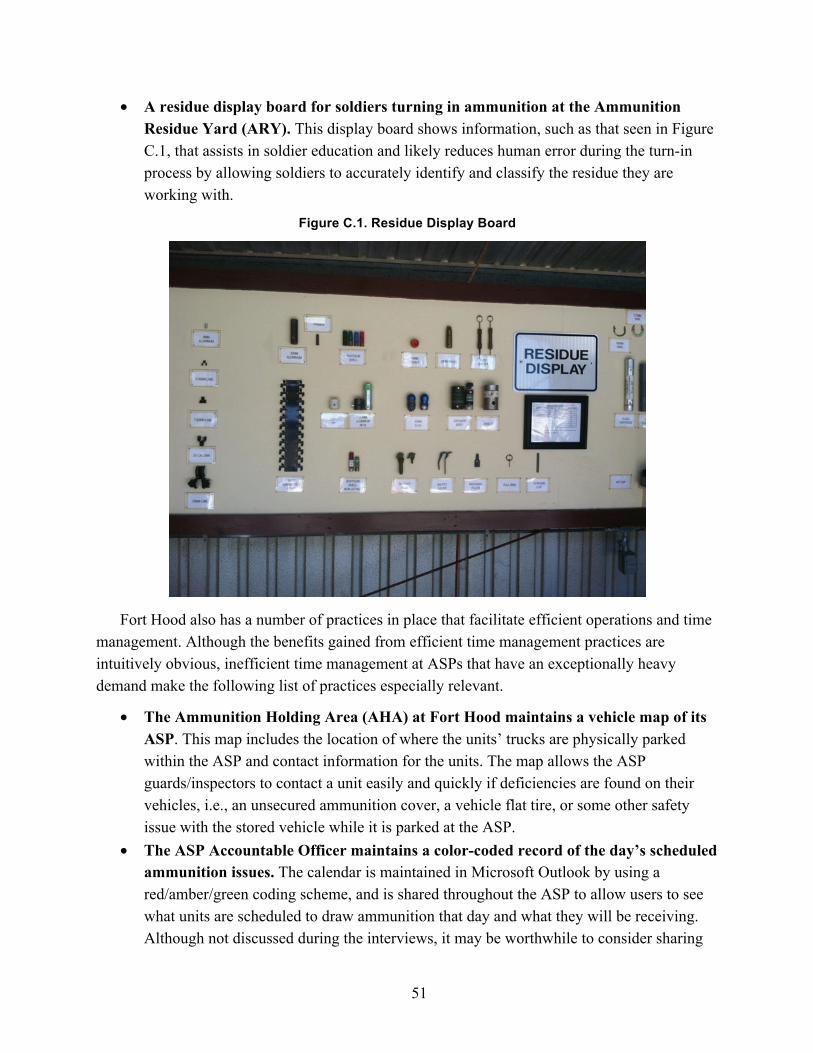
51
• A residue display board for soldiers turning in ammunition at the Ammunition Residue Yard (ARY). This display board shows information, such as that seen in Figure C.1, that assists in soldier education and likely reduces human error during the turn-in process by allowing soldiers to accurately identify and classify the residue they are working with.
Figure C.1. Residue Display Board
Fort Hood also has a number of practices in place that facilitate efficient operations and time
management. Although the benefits gained from efficient time management practices are intuitively obvious, inefficient time management at ASPs that have an exceptionally heavy demand make the following list of practices especially relevant.
• The Ammunition Holding Area (AHA) at Fort Hood maintains a vehicle map of its ASP. This map includes the location of where the units’ trucks are physically parked within the ASP and contact information for the units. The map allows the ASP guards/inspectors to contact a unit easily and quickly if deficiencies are found on their vehicles, i.e., an unsecured ammunition cover, a vehicle flat tire, or some other safety issue with the stored vehicle while it is parked at the ASP.
• The ASP Accountable Officer maintains a color-coded record of the day’s scheduled ammunition issues. The calendar is maintained in Microsoft Outlook by using a red/amber/green coding scheme, and is shared throughout the ASP to allow users to see what units are scheduled to draw ammunition that day and what they will be receiving. Although not discussed during the interviews, it may be worthwhile to consider sharing
52
this or a similar schedule with customer units as well. For example, other ASPs that RAND visited used a SharePoint site that is shared with customer units to help facilitate communication with customers and better prepare customer units prior to their arrival at the ASP. The site allows the customer to double check their documents, see any notifications, see what other units are currently drawing ammunition, etc. If the calendar is used only in the ASP, its purpose is internal operations management; if it is shared and directed outward, it would be aimed at communicating with customer units and managing overall customer interactions.
• The ASP has designated management time. Thursdays at the Fort Hood ASP are designated as “no turn-in/no issue” days because of the Sergeant’s time training requirements. This allows the ordnance company responsible for managing the ASP to “breathe,” conduct maintenance, conduct inventories, and engage in other activities necessary for the functioning of a military company. This can be seen as a best business practice for sustaining the ammunition company, but further research is needed to determine if this practice has any negative implications for supporting the training units.
• The ASP Accountable Officer conducts weekly informal inventories of ammunition stocks. These inventories are conducted in addition to the formal quarterly inventories required by regulation. Consistent inventory taking is cited as a best practice because the Accountable Officer is made aware of any inventory discrepancies and can address them before official reconciliation is required.
The contractors responsible for operations at Fort Hood’s Ammunition Residue Yard (ARY) had also developed a number of practices that can be categorized as equipment and facilities efficiencies. This group of contractors developed the following innovations with respect to its brass sorting and turn-in equipment:
• Steps and platform installed for brass deformer. This implementation (Figure C.2) saves manpower effort, given the heavy lifting angle created when emptying large containers of brass into the raised bin on Fort Hood’s deformer.

53
Figure C.2. Steps and Platform Installed for Brass Deformer
• Rolling bars under brass sorting table. This addition (Figures C.3 and C.4) helps containers roll down tracks so that soldiers do not have to stop and continually lift and move the cans. It decreases the time needed to sort ammunition and reduces overall manpower effort, since the cans can be roughly 70–80 pounds each. The appropriate height of the tables also prevents back strain.

54
Figure C.3. Table with Roller Bar Installation
Figure C.4. Table Without Roller Bar Installation
• Cover over brass sorting table grating. This addition (Figure C.5) prevents sand and debris from falling into the cans. It saves the time and effort of clearing sand and debris from ammunition cans. The figure also depicts a hard metal plate on the brass sorting
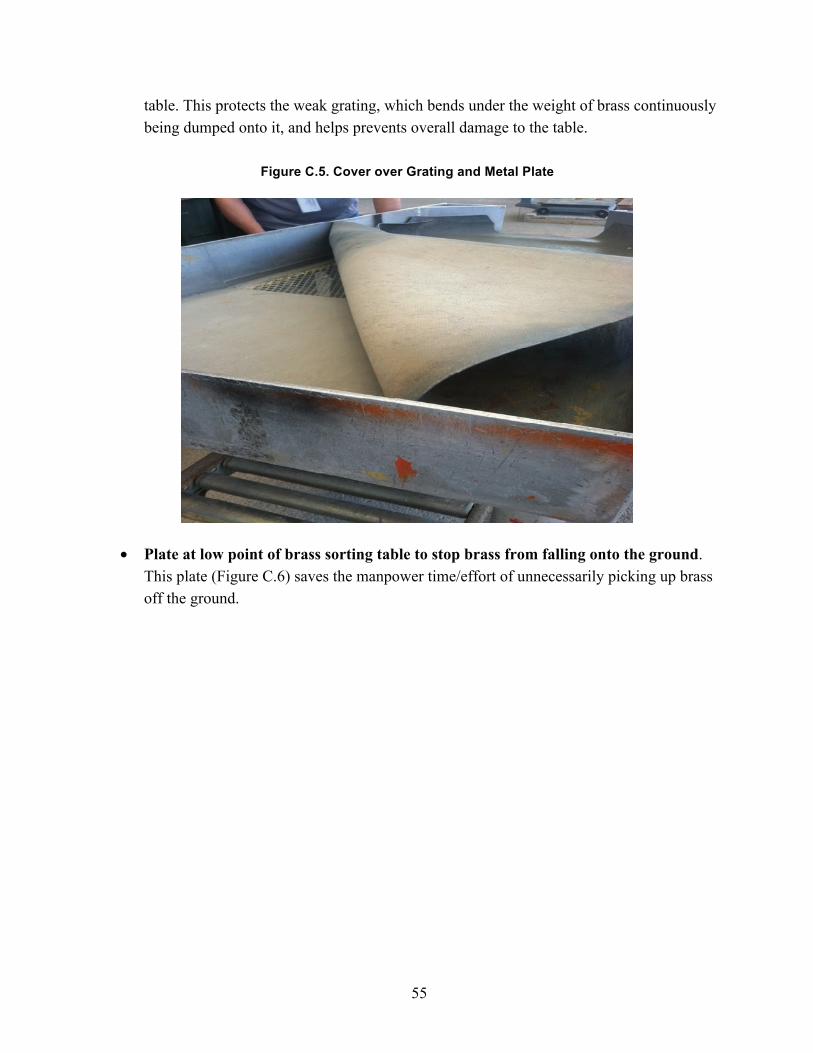
55
table. This protects the weak grating, which bends under the weight of brass continuously being dumped onto it, and helps prevents overall damage to the table.
Figure C.5. Cover over Grating and Metal Plate
• Plate at low point of brass sorting table to stop brass from falling onto the ground. This plate (Figure C.6) saves the manpower time/effort of unnecessarily picking up brass off the ground.

56
Figure C.6. Plate Cover
Although Fort Hood clearly displayed innovative approaches across a number of areas, it was not without its challenges. For instance, as of this writing, Fort Hood reportedly did not have suitable communications equipment for internal communications at the ASP. Soldiers were authorized to use their personal cell phones while out in the ASP for business only and communications back to the ASP Headquarters office, but only outside of certain distances of the actual magazines. The ASP Accountable Officer has requested Harris radios to be purchased to solve their communications problems. Reportedly, Higher Headquarters suggested that the 664th Ordnance Company responsible for post ASP operations use Single Channel Ground and Airborne Radio System (SINCGARS) radios on their Military Table of Organization and Equipment (MTOE) to support the installation ASP mission. This lack of designated communications equipment for post ASP use was perceived to be a significant operational constraint for the 664th Ordnance Company. In addition to a lack of specific equipment, some personnel interviewed also mentioned that they would like to see an Installation Management Command (IMCOM)–coordinated Installation Ammunition Manager forum for all Installation Ammunition Managers to gather, share best practices, and distribute lessons learned. Interviewees suggested that a professional forum would improve communications and networking across the ammunition community. Interested and motivated leaders in this community could follow the example of CompanyCommand.com or PlatoonLeader.org, two web-based professional forums created by company-grade officers to fill a need they had identified on their own.

57
Appendix D. RAND Ammunition Supply Point Survey
BACKGROUND: Thirty-six CONUS ASPs will become OPCON to Army Materiel Command (AMC) in October 2012. The RAND Corporation Arroyo Center, a non-profit, Federally Funded Research and Development Center, was asked to assist AMC in understanding the Army ASP supply chain.
PURPOSE OF THIS SURVEY: This survey is organized into four major sections with the
aim of identifying important characteristics of your respective ASP. An honest and complete assessment of your ASP’s inputs, outputs, DOTLMPF, and governance will assist RAND’s understanding of the ASP supply chain. Through this understanding, RAND will seek to capture best practices, identify efficiencies, and provide recommendations to AMC as to how best support ASP operations in the future.
CONSENT: Participation in this interview is strictly voluntary. Responses will be viewed by RAND researchers and AMC personnel in order to better understand ASP operations throughout the Army. No individual identifiers or secondary identifiers; e.g., a respondent’s name, rank, or billet will be used in any reports or be associated with survey responses. Interviewees were selected based on their in-depth knowledge of ASP operations. There is no requirement for you to provide your name at any time and no requirement to answer every question. If you agree to these terms, please continue to the survey. Thank you.
1. Location/Name of ASP: Part I: Inputs 2. What types of ammunition (e.g., small arms, medium caliber, artillery, pyrotechnics, etc.)
are the most challenging to process into your ASP and why? 3. How much of the above short ton types of ammunition are typically maintained in your
ASP? 4. Does your ASP possess the needed tools and/or equipment to perform work on these
inbound ammunition items? 5. What DODICs of ammunition entering your ASP require the most manpower hours and
why?

58
6. Are there any specific challenges associated with inbound ammunition transactions? 7. Where are your ASP ammunition stocks supplied from and how often? (e.g., specific
depots, vendors, other ASPs; daily, weekly, etc.) Part II: Outputs 8. What types of ammunition (e.g., small arms, medium caliber, artillery, pyrotechnics, etc.)
are the most challenging to process out of your ASP and why? 9. How much of the above short ton types of ammunition are typically maintained in your
ASP? 10. Does your ASP possess the needed tools and/or equipment to perform work on these
outbound ammunition items? 11. What DODICs of ammunition leaving your ASP require the most manpower hours? 12. Are there any specific challenges associated with outbound ammunition transactions? 13. How often does your ASP support ATPs? 14. How often does your ASP support AHAs? 15. Describe how your ASP supports ATPs, AHAs, and any other temporary ammunition
holding areas. 16. At what frequency and volume does your ASP conduct demil operations?
17. Who performs demil operations at your ASP (e.g., contractor, EOD, government civilians, etc.) and how many personnel are utilized to perform demil? Does your site utilize open burn, detonation, or both and what types of permits does the demil site have?
18. Please provide the frequency and description of outbound shipments not including
customer unit draws? (e.g., weekly lateral transfer to other ASPs, every two weeks transshipments, monthly disposals, etc.)

59
19. Does your ASP request disposition instruction from JMC in order to remove ammunition from ASP? If so, what factors drive the need for these requests? (e.g., ammunition remains in ASP a certain length of time, the need to create additional space, etc.)
20. Are commercial carriers or military vehicles used to transport ammunition to and from your ASP and the customer units supported off of your installation?
21. Approximately how many different units does your ASP support that are captured in
TAMIS? 22. Approximately how many different units does your ASP support that are NOT captured
in TAMIS? 23. What types of units does your ASP generally support? 24. Rate your relationship with most customer units.
Very Good Good Neutral Bad Very Bad
25. Describe the methods used to communicate with customer units (e.g. to make requests,
adjust requests, turn in ammo, etc.). 26. What types of additional ASP workload are created due to customer units that arrive to
your ASP with administrative or safety deficiencies? (e.g., unlicensed drivers, faulty equipment, lack of safety requirements, etc.) How much time is typically required to complete this additional workload each week?
27. What percent of customer unit interactions result in a prevention or delay of scheduled
ammunition draws due to customer unit administrative or safety deficiencies? What are the most common deficiencies among customer units? (e.g., unlicensed drivers, faulty equipment, lack of safety requirements, etc.)
28. What types of additional ASP workload are created due to customer units that arrive to
your ASP with administrative or safety deficiencies? How much time is typically required to complete this additional workload each week?

60
29. How can interactions with customer units be improved or made more efficient? 30. How far in advance of customer unit ammunition issue does your ASP review
ammunition request documentation? Part III: DOTLMPF 31. Please list the types and quantity of the ammunition storage containers you maintain at
your ASP (e.g., Earth Covered Magazines –5, Igloos – 3, Bunkers – 4, etc.) 32. What is the capacity of your ASP in Net Explosive Weight? What is the capacity of
your ASP in cubic footage? What percentage of your facility’s capacity is utilized on average? 33. How often are your facilities filled to their maximum capacity? When this happens for
how long are those facilities full? 34. What types of containers or facilities would you like to see added or removed from your
ASP? Why? 35. Does your ASP have an approved site plan? If not, what is preventing you from
obtaining one? 36. What are the names of, if any, tenant ammunition sites your ASP manages and how far
from your main ASP is each? If your ASP manages more than five tenant ammunition sites, please include at the end of the survey.
37. What DODICs of ammunition primarily drive storage issues and why? 38. How often do unscheduled requirements occur that create additional, unplanned
workload? (e.g., customer units arriving without prior coordination, support to inspection on training ranges, etc.) On average, how much time do these unscheduled activities take in a given week?
39. How many personnel are permanently assigned to work in your ASP? (A = Active Duty,
R = Reservist) 40. Does this manning match your Authorization Document (TDA, MTOE, etc.)? If not,
how much does it differ?

61
41. Does your ASP utilize other personnel not recognized in your Authorization Document (TDA, MTOE, etc.) to assist with managing the ASP? e.g., security/guard force, laborers, carpenters, etc.
42. How would you adjust your manning to operate your ASP most effectively given current demands? How did you determine the optimal manning plan?
43. How many total man years are expended per year to run your ASP? How do you
calculate manpower requirements for operations within your ASP? 44. What activities do your ASP personnel execute that are not captured in the Workload
Report accessible in SAAS? How much time would you estimate each of these activities account for in a typical work week?
45. Briefly describe the data systems used by your ASP. Part IV: Governance 46. How is accountability of ammunition within your ASP managed? 47. What spending lines are included on your monthly budget? 48. Briefly describe the major processes executed at your ASP. 49. What processes and tasks require the most manpower hours? Are some processes only
required infrequently? 50. What initiatives does your ASP have planned or are currently executing to bring your
ASP within QASAS compliance? Please include if these initiatives are funded and approximate costs for each.
51. Provide a brief description of any Certificates of Risk Acceptance (CORA) that your
ASP has and identify the length of time the CORA covers, if it requires a specific initiative to be approved and funded before it is no longer required, and whether that initiative has been funded. (e.g., One CORA for storing munitions beyond Net Explosive Weight limitations in a magazine – CORA valid from Sep 2011 to Sep 2012 – CORA no longer required upon construction of new magazine scheduled to be finished in Oct 2012 – magazine construction funded and in progress).

62
52. What standing policies and regulations currently affect ASP operations the most? 53. What processes, policies, or regulations must be sustained to support effective ASP
operations? 54. What processes, policies, or regulations should be added, removed, or adjusted to better
support effective ASP operations? Why? 55. Where can efficiencies be made in the current processes used at your ASP? What
support do you need to achieve these? 56. From where does your ASP receive the majority of its support and direction? 57. What type of support does your ASP require the most from external sources? (e.g.,
personnel, data, budget, facilities, equipment, tools, etc.) 58. Rate the relationship your ASP has with higher. None –Very Good – Good – Neutral – Bad – Very Bad 59. What would improve your relationship with higher? 60. What support from higher is important to sustain in order to maintain effective ASP
operations? 61. How could your ASP more efficiently communicate with higher? With adjacent units? 62. What could AMC do to most effectively support your ASP’s ability to provide timely
services to units utilizing training ammunition?
63. Please provide any other information that you feel would help in the understanding of ASP operations that was not included in any of the preceding questions.
On behalf of the RAND Corporation research team, thank you for your participation in this
survey.

63
References
“407th AFSB Operations Order (OPORD) 12-06-001 (DOL Command and Control Relationships and Task Organization),” Fort Hood, Texas, June 4, 2012. Not available to the general public.
“The Army Excellence in Explosives Safety Award,” received August 2, 2012.
Butler, Dwayne, Anthony Atler, Bonnie Magnuson, Lily Geyer, and Kenneth Girardini, “RAND Final Update Brief to Army Materiel Command leaders,” Huntsville, Alabama, December 2012.
Chenoweth, Mary, Dwayne Butler, Liisa Ecola, and Karin Kitchens, “Metrics for Army Operational Contract Support (OCS),” Briefing, Arroyo Center Military Logistics Program Review, RAND Corporation, April 2011.
Department of the Army, U.S. Army Garrison and Fort Hood, Fort Hood Ammunition Handbook, Fort Hood, Tex., FH REG 700-15, December 3, 2007. As of October 19, 2012:http://www.hood.army.mil/dhr/pubs/fhr700-15.pdf
Hancock, Kathleen L., “Hazardous Goods,” in A. M. Brewer, K. J. Button, and D. A. Hensher, eds., Handbook of Logistics and Supply Chain Management, Oxford, UK: Elsevier Science, Ltd., 2001.
Headquarters, Department of the Army, Total Army Munitions Requirements Process and Prioritization System, Washington, DC, Army Regulation 5-13, December 17, 2009.
———, G-3/5/7 Munitions Management Office, Total Ammunition Management Information System Version 2.1.0: User Manual, Washington, D.C., 2012.
———, US Army Munitions Reporting System, Washington, DC, Army Regulation 700-19, February 7, 2008.
———, G-3/7-TRA, Munitions Management Office, “Total Munitions Management Information System (TAMIS) Information Brief,” no date.
Headquarters III Corps & Fort Hood, Logistics: Ft. Hood Ammunitions Handbook, Department of the Army, Fort Hood, Texas, June 11, 2014.
“How to Write a Design Report,” University of Minnesota, Department of Mechanical Engineering, Engineering Writing Style Guide. Accessed June 2013 at: http://www.me.umn.edu/education/undergraduate/writing/How-to-write-a-Design-Report.pdf

64
Fort Hood Ammunition Supply Point (ASP), “DOL20110912-01–MOA Between 13th ESC and DOL,” September 22, 2011.
———, “Tasks of ASP,” Received from project sponsor on August 2, 2012.
———, “Things To Do For a Successful Ammunition Turn-In,” United States Army Ordnance Corps, Received from project sponsor on August 2, 2012.
———, “Tips for a Successful Ammunition Issue,” United States Army Ordnance Corps, Received from project sponsor on August 2, 2012.
Installation Ammunition Manager, “After Action Report: Centralized Ammunition Management (CAM) Test,” January 27, 2004.
———, “50-tra-12-08,” TRA On Hand 12-08, Excel Workbook, received August 2, 2012.
———, “70-hood-12-08-90 day,” Forecasting Report Prepared For: ASP-SHOD, ASP Fort Hood Excel Workbook, Prepared on August 1, 2012, received from project sponsor on August 2, 2012.
———, “80-scs-tra-12-08,” Supply Control Study by DODIC, ASP Excel Workbook, Received August 2, 2012.
———, “Fort Hood ASP Expenditure Report FY 04 Thru FY 11, As of 29 Nov 11,” All Years Expended, Excel Workbook, received from project sponsor on August 2, 2012.
———, “Monthly Supply Control Study Analysis,” FY08-FY12, ASP Excel Workbook, received August 2, 2012.
———, “OH FY12,” On-Hand Ammunition by DODIC, ASP Excel Workbook, received August 2, 2012.
Logistics Review and Technical Assistance Office, “Report of the HQDA Ammunition Logistics and Explosives Safety Review, Fort Hood, Texas,” U.S. Army Defense Ammunition Center, McAlester, Oklahoma, Department of the Army Ammunition Review and Technical Assistance Program, December 5–9, 2011. Not available to the general public.
“The Profession of Arms,” Army White Paper, December 8, 2010, on line. As of December 2, 2014: http://www.benning.army.mil/armor/content/PDF/Profession%20of%20Arms%20White%20Paper%208%20Dec%2010.pdf
RAND Ammunition Supply Point (ASP) Interview Protocol, Fort Hood Survey Responses, pp. 1–9, Completed July 2012.
RAND Arroyo Center Project Report, 1 October 2011–30 September 2012, Santa Monica, Calif.: RAND Corporation, PR-388-A, 2013, pp. 245–248.

65
RAND, “ASP Binning,” Excel Workbook, Created and received from project sponsor on September 2012.
RAND, Data Analysis for WARS DODAAC, “West Fort Hood Transactions, DODICs, Current Authorizations, Expenditures, Expenditure Rates, Customer List,” Compiled July 2012.
RAND, Fort Hood Site Visit Notes, Created August 2, 2012.
Waters, Donald, “Inventory Management,” in A. M. Brewer, K. J. Button, and D. A. Hensher, eds., Handbook of Logistics and Supply Chain Management, Oxford, UK: Elsevier Science, Ltd., 2001.