Embed Size (px)
Citation preview
Identifying diffraction effects in measured reflectances
Nicolas Holzschuch, Romain Pacanowski
To cite this version:
Nicolas Holzschuch, Romain Pacanowski. Identifying diffraction effects in measured re-flectances. Eurographics Workshop on Material Appearance Modeling, Jun 2015, Darmstadt,Germany. 2015. <hal-01170614>
HAL Id: hal-01170614
https://hal.inria.fr/hal-01170614
Submitted on 8 Jul 2015
HAL is a multi-disciplinary open accessarchive for the deposit and dissemination of sci-entific research documents, whether they are pub-lished or not. The documents may come fromteaching and research institutions in France orabroad, or from public or private research centers.
L’archive ouverte pluridisciplinaire HAL, estdestinee au depot et a la diffusion de documentsscientifiques de niveau recherche, publies ou non,emanant des etablissements d’enseignement et derecherche francais ou etrangers, des laboratoirespublics ou prives.
Eurographics Workshop on Material Appearance Modeling (2015), pp. 1–3H. Rushmeier and R. Klein (Editors)
Identifying diffraction effects in measured reflectances
N. Holzschuch1 and R. Pacanowski2
1Inria ; Univ. Grenoble Alpes, LJK ; CNRS, LJK2LP2N (CNRS) – Université de Bordeaux
AbstractThere are two different physical models connecting the micro-geometry of a surface and its physical reflectanceproperties (BRDF). The first, Cook-Torrance, assumes geometrical optics: light is reflected and masked by themicro-facets. In this model, the BRDF depends on the probability distribution of micro-facets normals. The second,Church-Takacs, assumes diffraction by the micro-geometry. In this model, the BRDF depends on the power spectraldistribution of the surface height. Measured reflectance have been fitted to either model but results are not entirelysatisfying. In this paper, we assume that both models are valid in BRDFs, but correspond to different areas inparametric space. We present a simple test to classify, locally, parts of the BRDF into the Cook-Torrance model orthe diffraction model. The separation makes it easier to fit models to measured BRDFs.
1. Introduction
The reflectance properties of amaterial are usually connectedto the micro-geometry of its surface. Several models can pre-dict the overall reflectance function (BRDF) from a physicaldescription of the properties of the surface.
The most commonly used in Computer Graphics is theCook-Torrance model [CT82]. Assuming that light interactswith the surface following optical geometry, it provides acompact model that depends only on the surface roughness.The main parameter is the probability distribution of micro-facet normals, D(θh ).
Another model [CT95] assumes that the surface micro-geometry diffracts the incoming light. It is widely used inthe optical engineering community and was recently in-troduced to the computer graphics community by Löw etal. [LKYU12].
Both models have been used to fit measured re-flectance [NDM05,BSH12,LKYU12]. These are not entirelysatisfying. The most numerically accurate fits required relax-ing at least one physical rule: Bagher et al. [BSH12] used adifferent distribution of micro-facets for each color channel;Löw et al. [LKYU12] removed thewavelength dependency intheir fits. The common solution of adding several reflectancelobes to improve the quality of the fit also has no physicalbasis: in multi-layered materials, the interactions betweenthe different layers is more complex than simply adding theirreflectances [JDJM14].
In this paper, we assume that both the Cook-Torrancemodel and the diffraction model are active, at the same time,in the way a material interacts with light. Looking at mea-sured reflectance, we want to test which of the two models ispredominant, and use this information for better fitting.
We present a simple test, based on partial derivatives ofthe measured reflectance function. This test identifies areasin parameter space where diffraction is likely to be the mainexplanation for the reflectance. Experimental results showthat diffraction effects correspond mostly to wide-angle re-flection. This knowledge can then be incorporated to fit para-metric models to measured BRDFs.
2. Previous work
2.1. Measured reflectances
Matusik et al. [MPBM03] measured and released reflectanceproperties for a large range ofmaterials.Weuse their databasein our tests. Ngan et al. [NDM05] have fitted parametricBRDF models to this measured data. They found the best fitsfor the He, Cook-Torrance and Lafortune models.
Ashikhmin and Premože [AP07] approximated measuredBRDFs using back-scattering: if input and output directionsare equal, the entire BRDF can be expressed as a function ofthe half-vector. By storing this function, they get a compactBRDF model, that fits measured data very well.
submitted to Eurographics Workshop on Material Appearance Modeling (2015)
2 N. Holzschuch & R. Pacanowski / Identifying diffraction effects in measured reflectances
2.2. Cook-Torrance model
The Cook-Torrance model [CT82] assumes that the micro-geometry of the surface ismade of planarmicro-facets. Thesemicro-facets reflect the incoming light, but also block incom-ing and outgoing light from grazing angles. The full BRDFmodel is expressed as a product of three functions:
ps (i, o) = ρsF (i, h)G(i, o)D(θh )
4(i · n)(o · n)(1)
D is the probability distribution for the orientation of micro-facet normals. F is the Fresnel reflection coefficient for eachmicro-facet, G is the masking and shadowing term, express-ing how much of the incoming and outgoing light is maskedby local geometry. It is computed from D by a double indef-inite integration [Smi67,WMLT07,Hei14].
D is themain parameter in the Cook-Torrancemodel. Earlywork used a gaussian distribution, which was not a good fitwithmeasured data. Trowbridge andReitz [TR75] andWalteret al. [WMLT07] introduced the TR/GGX distribution, pro-viding a better fit with measured data. Bagher et al. [BSH12]used a SGD distribution for an even better fit with measureddata. They found that using a different distribution for eachcolor channel improved the quality of the fit as well as theconvergence speed.
2.3. Diffraction model
The diffraction model is widely used in the optical engineer-ing community [CT95]. Incoming light is diffracted by themicro-geometry of the surface. The BRDF model has onemain parameter: Sz , the power spectral density of the surfaceheight fluctuations:
pw (i, o) = F (i, h)Sz ( f ) (2)
f encodes the wavelength dependency; it is equal to | |n ×(i + o) | |, divided by the wavelength λ. F is the Fresnel term,similar to the term used in equation 1.
Löw et al. [LKYU12] introduced the diffraction model tothe computer graphics community. They show that it pro-vides a good explanation for some behaviour of measuredBRDFs, and a good approximation for measured data. How-ever, they removed the explicit wavelength dependency of thediffraction effect in their model.
3. Identifying diffraction effects
3.1. Main hypothesis
Our main observation is that the Cook-Torrance model andthe diffraction model are not mutually exclusive. The samemicro-facet can both reflect incoming light and diffract it,along its edges. The BRDF of the material is then a sum ofboth models, along with a diffuse component:
p(i, o) =ρdπ+ ρs
F (i, h)G(i, o)D(θh )4(i · n)(o · n)
+ ρwSz ( f ) (3)
We made the assumption that Fresnel effects are associatedmainly to specular reflection, not diffraction.
The half-angle parametrization [Rus98], (θh, θd, φd ) is aconvenient parametrization for BRDFs. We can express f inthis parameterization: f = 2
λ sin θh cos θd , and use this toexpress the full BRDF model:
p(i, o) =ρdπ+ ρs
F (θd )GD(θh )4(i · n)(o · n)
+ ρwSz
(2λsin θh cos θd
)(4)
3.2. Derivatives-based test
Our goal is to identify areas in parameter spacewhere diffrac-tion effects are predominant. In these places, the BRDF isdetermined mainly by Sz ( f ):
p(i, o, n) ≈ρdπ+ ρwSz
(f)
(5)
In that case, the partial derivatives of theBRDF are connectedto the derivative of Sz :
∇p = ρwdSzd f∇ f (6)
For this equation to be true, we must have: det(∇p,∇ f ) = 0.This gives us a condition that must be verified if diffractioneffects are dominant:
det(∇p,∇ f ) =∂p∂θ
h
sin θh sin θd +∂p∂θ
d
cos θh cos θd = 0
(7)
4. Results
4.1. Numerical computations
We computed partial derivatives on measured data usingfinite differences. Derivatives computed using the raw dataare quite noisy and unsuitable for testing using Equation 7.We begin by averaging the data over φd to reduce the noise.We also store the variance over φd , and ignore areas withhigh variance, where the average is a poor representation ofthe data. We then compute our test function, det(∇p,∇ f ).
4.2. Mapping the results
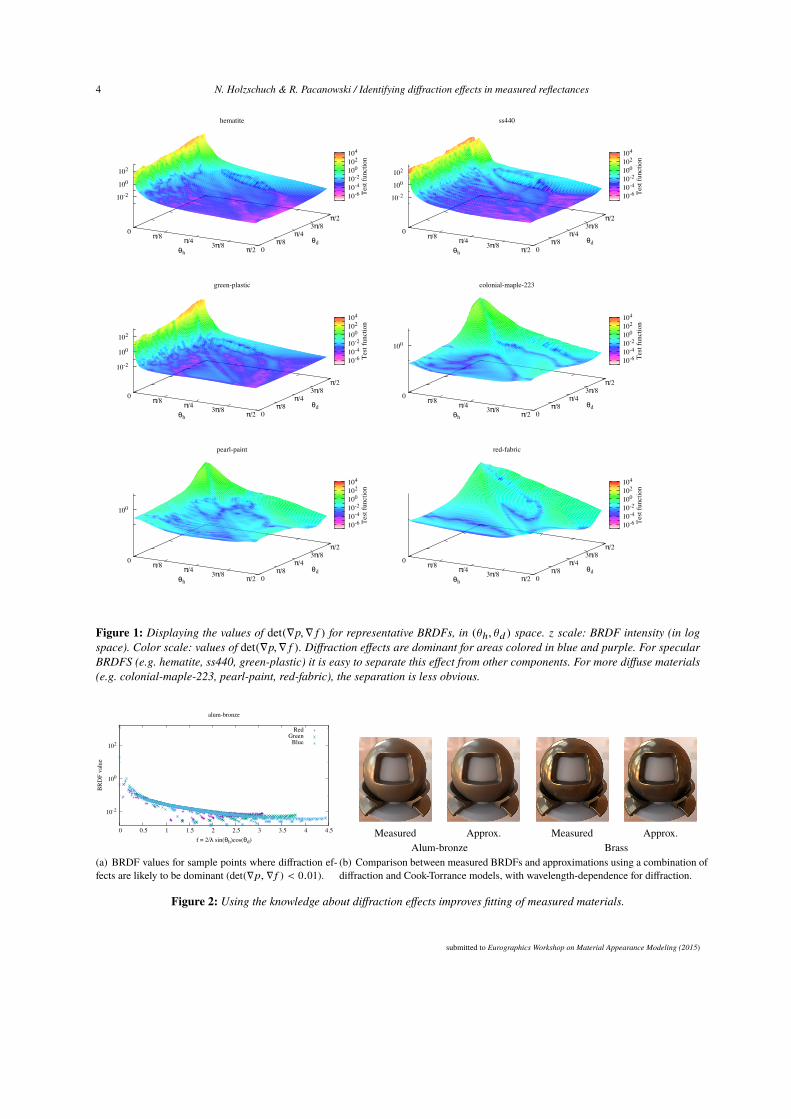
We have computed the value of det(∇p,∇ f ) for all BRDFsin the MERL database. Figure 1 displays the value ofdet(∇p,∇ f ) using a color ramp, along with the value ofthe BRDFs, for some representative materials. Diffractioneffects are dominant for areas in blue and purple. Severalthings appear clearly:
• The separation between diffraction effects and other causesis clearly visible for specular-type BRDFs, such as metalsand shiny plastics. Formore diffuse BRDFs, such aswoodsand plastics, the separation is less marked.
submitted to Eurographics Workshop on Material Appearance Modeling (2015)
N. Holzschuch & R. Pacanowski / Identifying diffraction effects in measured reflectances 3
• Diffraction effects, when present, correspond to wide-angle scattering, and lower values of the BRDF. Thesewide-angle scattering plays an important role in the visualaspect of the BRDF. It provides the color of the materialoutside of the specular peak.
• The specular peak, around θh = 0, does not appear tocorrespond to diffraction effects.
4.3. Wavelength dependency
The diffraction model predicts the BRDF dependency onwavelength: they should depend on f = 2
λ sin θh cos θd , upto a multiplicative constant. To validate this hypothesis, weplot BRDF values for sample points where det(∇p,∇ f ) isunder a certain threshold (0.01). Figure 2(a) shows theseBRDF values as a function of f for one material (alum-bronze). The behaviour appears to be as predicted by thetheory: curves for the three channels appear to be very similar,once their x-axis has been scaled by λ. For other BRDFs, thesuperposition is not as perfect: there is a vertical scaling,corresponding to the specular color, and vertical translationcorresponding to the diffuse color.
4.4. Possible interpretation
We present the following interpretation of our experimentalresults: the micro-geometry of the surface contributes to theBRDF through both reflection and diffraction. Reflection isexplained by the Cook-Torrance lobe, with a distribution ofnormals independent of wavelength. It is responsible mostlyfor the specular peak. Diffraction contains wavelength de-pendency. It is responsible for wide-angle scattering. The twoeffects co-exist, but can be separated using partial derivatives.
The fact that two different effects are present could explainprevious difficulties in fitting measured materials with a sin-gle model. It could also explain why previous research hadto use complicated distributions such as SGD or ABC.
Preliminary experiments using this hypothesis show thatfitting measured materials using a sum of diffraction andreflection models converges quickly and provides a goodapproximation (see Figure 2(b)).
4.5. Conclusions
Two different models describe the relationship between a sur-face micro-geometry and its overall appearance: one explainsBRDF behaviour by specular reflection on the micro-facets,the other by diffraction by the surface geometry.
We have designed a test to identify potential areas wherediffraction effects dominate. It appears that diffraction effectsare present in most measured materials; they explain materialbehaviour for wide-angle scattering, but not for the specularlobe. It seems that both reflection and diffraction effects arepresent in measured materials.
In future work, we want to extensively test this hypothesison a large set of measured materials. We also want to predictsurface geometry based on the BRDF: the Cook-Torrancelobe gives the average shape of the micro-geometry, but notits size. The diffraction lobe gives the spatial frequency ofthe micro-geometry. Combining the two could provide a fullmodel of the micro-geometry.
References[AP07] Ashikhmin M., Premože S.: Distribution-based BRDFs.
University of Utah, http://www.cs.utah.edu/~premoze/dbrdf/, 2007. 1
[BSH12] Bagher Mahdi M., Soler C., Holzschuch N.: Ac-curate fitting of measured reflectances using a Shifted Gammamicro-facet distribution. Computer Graphics Forum 31, 4(June 2012), 1509–1518. doi:10.1111/j.1467-8659.2012.03147.x. 1, 2
[CT82] Cook R. L., Torrance K. E.: A reflectance model forcomputer graphics. ACM Trans. Graph. 1, 1 (1982), 7–24. doi:10.1145/357290.357293. 1, 2
[CT95] Church E. L., Takacs P. Z.: Surface scattering. InHand-book of optics, Bass M., (Ed.). McGraw-Hill, 1995. 1, 2
[Hei14] Heitz E.: Understanding the Masking-Shadowing Func-tion in Microfacet-Based BRDFs. Journal of Computer Graph-ics Techniques 3, 2 (June 2014), 32–91. URL: https://hal.inria.fr/hal-01024289. 2
[JDJM14] Jakob W., D’Eon E., Jakob O., Marschner S.: Acomprehensive framework for rendering layered materials. ACMTransactions on Graphics (Proceedings of SIGGRAPH 2014) 33,4 (2014). 1
[LKYU12] Löw J., Kronander J., Ynnerman A., Unger J.: Brdfmodels for accurate and efficient rendering of glossy surfaces.ACM Trans. Graph. 31, 1 (Feb. 2012), 9:1–9:14. doi:10.1145/2077341.2077350. 1, 2
[MPBM03] Matusik W., Pfister H., Brand M., McMillan L.:A data-driven reflectance model. ACM Trans. Graph. 22, 3 (July2003), 759–769. doi:10.1145/882262.882343. 1
[NDM05] Ngan A., Durand F., Matusik W.: Experimental anal-ysis of BRDF models. In Eurographics Symposium on Rendering(2005), pp. 117–226. doi:10.2312/EGWR/EGSR05/117-126.1
[Rus98] Rusinkiewicz S.: A new change of variables for efficientbrdf representation. In Rendering Techniques ’98 (Proceedingsof Eurographics Rendering Workshop ’98) (1998), Drettakis G.,Max N., (Eds.), Springer Wien, pp. 11–22. 2
[Smi67] Smith B.: Geometrical shadowing of a random roughsurface. IEEE Transactions on Antennas and Propagation 15, 5(Sept. 1967), 668 –671. doi:10.1109/TAP.1967.1138991. 2
[TR75] Trowbridge T. S., Reitz K. P.: Average irregularity rep-resentation of a rough surface for ray reflection. J. Opt. Soc. Am.65, 5 (1975), 531–536. doi:10.1364/JOSA.65.000531. 2
[WMLT07] Walter B., Marschner S., Li H., Torrance K. E.:Microfacet models for refraction through rough surfaces. In Eu-rographics Symposium on Rendering (2007). doi:10.2312/EGWR/EGSR07/195-206. 2
submitted to Eurographics Workshop on Material Appearance Modeling (2015)
4 N. Holzschuch & R. Pacanowski / Identifying diffraction effects in measured reflectances
����
�������
��� ����
�������
���
����
���
���
��������
��
��
���������������������
�������������
����
�������
��� ����
�������
���
����
���
���
�����
��
��
���������������������
�������������
����
�������
��� ����
�������
���
����
���
���
�������������
��
��
���������������������
�������������
����
�������
��� ����
�������
���
���
������������������
��
��
���������������������
�������������
����
�������
��� ����
�������
���
���
�����������
��
��
���������������������
�������������
����
�������
��� ����
�������
���
����������
��
��
���������������������
�������������
Figure 1: Displaying the values of det(∇p,∇ f ) for representative BRDFs, in (θh, θd ) space. z scale: BRDF intensity (in logspace). Color scale: values of det(∇p,∇ f ). Diffraction effects are dominant for areas colored in blue and purple. For specularBRDFS (e.g. hematite, ss440, green-plastic) it is easy to separate this effect from other components. For more diffuse materials(e.g. colonial-maple-223, pearl-paint, red-fabric), the separation is less obvious.
����
���
���
�� ���� �� ���� �� ���� �� ���� �� ����
����
������
����������������������
�����������
������������
(a) BRDF values for sample points where diffraction ef-fects are likely to be dominant (det(∇p, ∇ f ) < 0.01).
Measured Approx. Measured Approx.Alum-bronze Brass
(b) Comparison between measured BRDFs and approximations using a combination ofdiffraction and Cook-Torrance models, with wavelength-dependence for diffraction.
Figure 2: Using the knowledge about diffraction effects improves fitting of measured materials.
submitted to Eurographics Workshop on Material Appearance Modeling (2015)


![Di raction Line Imaging€¦ · 26], and rainbow particle velocimetry [35].Unlike prior works, our method uses di raction to encode the spatial position of scene light sources. In](https://img.pdfslide.us/doc/110x75/606681c00478de56b87ec1cd/di-raction-line-imaging-26-and-rainbow-particle-velocimetry-35unlike-prior.jpg)