Embed Size (px)
Citation preview

Identifying Cost-Effective Interventions
Capturing and Analyzing Costs of Interventions

Summary of Presentation Why is Cost Analysis Important
What Should Cost Data Look Like
Capturing Costs
Analyzing Costs
Questions?
1
2
5
3
4

Summary of Presentation Why is Cost Analysis Important
What Should Cost Data Look Like
Capturing Costs
Analyzing Costs
Questions?
1
2
5
3
4

Three Key Applications
1. Identifying Good Investments
2. Opportunities for Savings
3. Informing Scale-up

1. Identifying Good Investments

Example: Primary School Investments in Northern Brazil
Which investment would you implement????
Invest in general package of “Hardware”
Impact on Portuguese score = 8.97
Cost per student = $16.06
Investment in writing materials
Impact on Portuguese score = 4.70
Cost per student = $1.76
Cost Effectiveness Ratio = $16.06/8.97 = $1.79 to raise score 1pt per child
Cost Effectiveness Ratio = $1.76/4.70 = $0.37 to raise score 1pt per child

Lessons
• Impact alone is incomplete
• Cost metrics help with “preference setting”
• Policy makers will ask: “IS THIS A GOOD DEAL??”

Types of Analysis• Cost-effectiveness Analysis (The Cost Per Outcome
Measure)Incremental Cost Effectiveness Ratio (CER) = C / E
ex. .17 sd change in test scores for $2.33 cost per pupil. -CER = $2.33 / .17 / 10 = $1.37 per .1 sd change per student
• Cost-Benefit Analysis (Total Benefits vs. Total Costs)
• Cost Utility Analysis (Cost Per Multiple Outcome Measures): Cost / Quality Adjusted Life Years (QALY)

2. Opportunities for Savings

Hypothetical Teacher Training Program What’s wrong here???
Cost Categories
Supplies
Equipment
Frontline Personnel
Management andOverheadContracted services
Cirriculum development

Take a look at the expendituresWhich expenditure line is off???

Real Example - Possum Control in New Zealand
• Cost Saving Solution: Use carrots (cheaper)
Problem: Bait contributing the largest proportion of cost.
• Cost Saving Solution: Use vans
Problem: Over-use of helicopters for sowing bait over small areas
• Cost Saving Solution: Get better contractors
Problem: Excessive Contactor costs. Some wasting 2 days on planning
Waste!!! Savings

3. Inform Scale-up

How Could this Parent Education Program Be Improved During Future Implementation?
Insights:
Ø Increase Scale àincreased program efficiency
ØCheap opportunities for quality improvements

Summary of Presentation Why is Cost Analysis Important
What Should Cost Data Look Like
Capturing Costs
Analyzing Costs
Questions?
1
2
5
3
4

Disaggregate! Disaggregate! Disaggregate!
A program’s budget and financial information must be disaggregated using the ingredients method if you want to gain insights from cost
analysis
You can also think of it as an investigation into the cost details of an intervention

What CAN’T we do with aggregate or only partially disaggregated data?
Show how costs evolve over time
Cost different activities within the same program?
Differentiate marginal costs from total program costs
Achieve accuracy and precision
Identify cost savings
Conduct sensitivity analysis or help scale program

Aggregate / Poorly Disaggregated Data
What is this data missing?

The Ingredients Method
An Investigation that uncovers, quantifies and values all resources and efforts
required to make an intervention happen
(counterfactual: what ingredients would still exist without the intervention vs. with
the intervention)

The Ingredients Method
Tag inputs with ingredients: Personnel, Equipment/ capital goods, supplies, admin and overhead, etc.
List All Inputs to the Program (obtain from budgets, papers, interviews, expenditure reports, grant docs)
Valuing ingredients: quantities and prices, nature of unit cost.
Timeline
Allocation Percentage (obtain from interviews with project team, or regular reporting on time and effort
data

Information Used for Disaggregated Costs
1. Log-frames (list of activities, outputs, outcomes)
2. Quantity and price data
3. Time and effort data
4. Budget and actuals data
5. Interviews with project staff
6. Observational data

Hypothetical: Through an interview with a project lead, you discover that a number of carsare being used by intervention staff. What data
do you need on this input??
Ø How many cars are used?
Ø Were the cars purchased? Contracted? Already owned?
Ø How much do the car’s cost to maintain and use? Fuel?
Ø How much of the car’s use is allocated to your project?
Ø What are they used for? Fixed or variable cost?
Ø Was the car used in for an impact evaluation?

Time and Effort Data

Summary of Presentation Why is Cost Analysis Important
What Should Cost Data Look Like
Capturing Costs
Analyzing Costs
Questions?
1
2
5
3
4
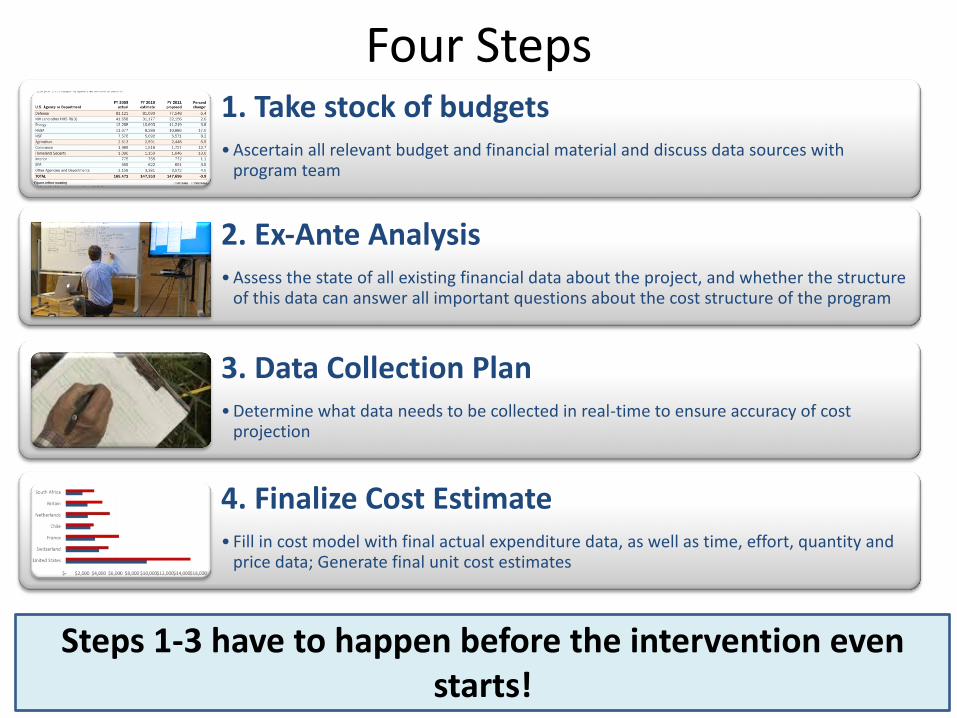
Four Steps 1. Take stock of budgets • Ascertain all relevant budget and financial material and discuss data sources with
program team
2. Ex-Ante Analysis • Assess the state of all existing financial data about the project, and whether the structure
of this data can answer all important questions about the cost structure of the program
3. Data Collection Plan • Determine what data needs to be collected in real-time to ensure accuracy of cost
projection
4. Finalize Cost Estimate • Fill in cost model with final actual expenditure data, as well as time, effort, quantity and
price data; Generate final unit cost estimates
Steps 1-3 have to happen before the intervention even starts!

1. Take Stock of Budgets

1. Get budget and logframe
2. Identify who to talk to about scope and use of each budget line
3. What activities = intervention
Getting Started

Some Questions to Ask the Project Team?
vs.Ø Which orgs are funding and implementing? .
Ø Evaluate program as a whole, or each component separately .
Ø What sources of data are available, and how are these sources organized and updated .
Ø Are there major funding sources or resources that do not need to be considered, such as construction costs .

2. Ex-Ante Analysis
Analytical investigation leading up to the ingredients method, and all conducted BEFORE the intervention

Why Ex-Ante? Ø Most costing done after close of interventions (retrospective / ex-
post analysis).
Ø Retrospective analysis is likely very inaccurate in many interventions. Recall bias + sources are hard to track down after intervention close.

What Are the Goals of Costing?
Let’s take a hypothetical ECD program with four components:
1. Pre-primary centers 2. School lunches program3. Parent education program 4. Technical assistance to MoE

Some Possible Goals Could Include: 1. Determine marginal cost effectiveness of adding school
lunches vs. parent education to existing ECD centers?
2. Compare cost-effectiveness of the full program with a private school initiative
3. Determine how cost-effective the program would be at scale.
4. Be able to project cost of implementing program in a different geographic location
5. Financial planning on a 3-10 year time horizon for the MoE.

Social Perspective?
Ø Social perspectives are usually adopted for economic evaluations (especially cost-benefit analyses) but may also be necessary in a cost-effectiveness study.
Ø “imputed,” and “averted” costs are included in social costs
Ø Do you include:
a) Costs to beneficiary / opportunity costs of time contributions
b) Volunteer time or in-kind donations
c) Negative or positive externalities, spillover effects
d) Institutional or organizational opportunity costs (resources that were diverted away from other funding sources as a result of the intervention)
e) Transfer payments?

Calculating Yearly Societal Costs Example: CBA Analysis – Private School Voucher Lottery Program in Colombia
YEARLY COSTS PER BENEFICIARY (+)
Ø Cost to beneficiary: +$52 extra school fees relative to non-lottery winner Ø Cost to beneficiary: +$41 reduced earnings due to extra time spent in
school (.71 cents X 1.2 fewer hrs working X 48 weeks per year = $41) Ø Cost to government: +$24 extra cost to government per beneficiary as
relative to accommodating pupil in public school (due to voucher)
YEARLY COST SAVINGS PER BENEFICIARY (-)
Ø Direct savings to beneficiary: -$74 per beneficiary is the average value of the vouchers received as compared with non-lottery winners
TOTAL YEARLY SOCIAL COST PER BENEFICIARY
Ø $52 (school fees) + $41 (reduced earnings) + $24 (gov. cost) – $74 (vouchers) = $43 per beneficiary per year in societal costs.

How does a program’s marginal cost change when scaled?
Curriculum development
Textbooks for students
Software license
Fixed
Variable
Fixed
Cash transfers to beneficiaries Variable
Construction of new schools Lumpy
Investments in municipal institutions Lumpy

What is the Scope of Analysis?
Be careful when there is significant variation in:
1. Service Delivery (different type or intensity of services provided)
2. Geographic analysis (i.e. program implemented differently across locations)
3. Administrative Analysis (different models for management)
Consider choosing between Activity Based costing andVariant (geographic/population) Based costing

3. Data Collection PlanA monthly or quarterly data collection plan may be
required based on what you discover in your ex-ante analysis
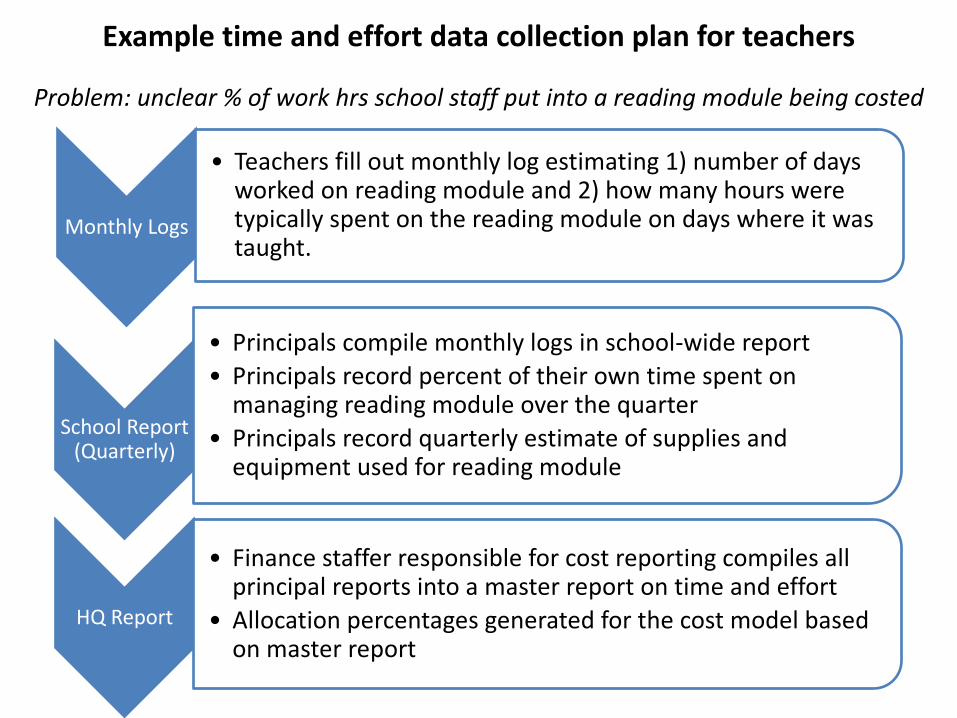
Example time and effort data collection plan for teachers
Problem: unclear % of work hrs school staff put into a reading module being costed
School Report (Quarterly)
• Principals compile monthly logs in school-wide report• Principals record percent of their own time spent on
managing reading module over the quarter • Principals record quarterly estimate of supplies and
equipment used for reading module
HQ Report
• Finance staffer responsible for cost reporting compiles all principal reports into a master report on time and effort
• Allocation percentages generated for the cost model based on master report
Monthly Logs
• Teachers fill out monthly log estimating 1) number of days worked on reading module and 2) how many hours were typically spent on the reading module on days where it was taught.

Regularly reporting data can allow cost experts, finance personnel, or research teams
to generate expenditure analyses in real-time!
This can help project teams realize savings and make mid-intervention adjustments.

4. Finalize Cost Estimate

Finalize Cost Estimate• Replicate the steps taken in the ex-ante analysis with
the finalized actual expenditure data.
• Determine total cost for each relevant Intervention or Variant you are costing.
• Develop a final model that analyzes costs and breaks them down into categories.
• PUBLISH findings of cost-effectiveness.
When a project closes, you should already be able to estimate cost!

Summary of Presentation Why is Cost Analysis Important
What Should Cost Data Look Like
Capturing Costs
Analyzing Costs
Questions?
1
2
5
3
4

Cost Sensitivities: Getting to a Transparent and Usable Analytical ModelØDiscount ratesØPrice fluctuations (or price differences across
locations)ØPilot and startup bias? ØChanging costs over time ØDoes the “margin” change when the program is
scaled ØCurrency– PPP exchange rates vs. nominal exchange rates
Is the model detailed enough?!

Sensitivity Analysis Example
Source: Dhaliwal, JPAL Presentation

References• Dhaliwal, JPAL Presentation• Horton, S., H. Alderman, and J. Rivera. 2008. “Hunger and Malnutrition.”
Copenhagen Consensus 2008 Challenge Paper. Copenhagen Consensus Center.• IRC Brief, “Cost Effectivnes Analysis: Improving Parenting Practices in Liberia and
Thailand” International Rescue Committee. • Iqbal Dhaliwal, Esther Duflo, Rachel Glennerster, Caitlin Tulloch, "Comparative
Cost-Effectiveness Analysis to Inform Policy in Developing Countries: A General Framework with Applications for Education”, JPAL, 2012.
• Joshua Angrist, Eric Bettinger, Erik Bloom, Elizabeth King, Michael Kremer, “Vouchers for Private Schooling in Colombia: Evidence from a Randomized Natural Experiment,” The American Economic Review, Vol. 92 No. 5.
• Levin, McEwan, “Cost Effectiveness Analysis: Methods and Applications (2nd
edition),” Sage Publications Inc., 2001. • McEwan, P. 2012. CEA of Education and Health in Developing Countries. Journal
of Development Effectiveness• B. Warburton and R. Cullen, “Cost-effectiveness of different Possum control
methods,” Wellington, N.Z.: Dept. of Conservation, 1995. 1 v. ; 30 cm. (Science for conservation, 1173–2946 ; 4.

Questions

www.worldbank.org/sief


![Problem 2.33 [Difficulty: 3]€¦ · Problem 2.33 [Difficulty: 3] Given: Velocity field Find: Equation for streamline through point (1.1); coordinates of particle at t = 5 s and t](https://img.pdfslide.us/doc/110x75/5f077e617e708231d41d4206/problem-233-difficulty-3-problem-233-difficulty-3-given-velocity-field.jpg)