Embed Size (px)
Citation preview
Noname manuscript No.(will be inserted by the editor)
Identifying and Understanding Header File Hotspots inC/C++ Build Processes
Shane McIntosh · Bram Adams · MeiyappanNagappan · Ahmed E. Hassan
Author pre-print copy. The final publication is available at Springer via:http://dx.doi.org/10.1007/s10515-015-0183-5
Abstract Software developers rely on a fast build system to incrementally compiletheir source code changes and produce modified deliverables for testing and deploy-ment. Header files, which tend to trigger slow rebuild processes, are most problematicif they also change frequently during the development process, and hence, need to berebuilt often. In this paper, we propose an approach that analyzes the build depen-dency graph (i.e., the data structure used to determine the minimal list of commandsthat must be executed when a source code file is modified), and the change historyof a software system to pinpoint header file hotspots — header files that change fre-quently and trigger long rebuild processes. Through a case study on the GLib, Post-greSQL, Qt, and Ruby systems, we show that our approach identifies header file hot-spots that, if improved, will provide greater improvement to the total future build costof a system than just focusing on the files that trigger the slowest rebuild processes,change the most frequently, or are used the most throughout the codebase. Further-more, regression models built using architectural and code properties of source files
Shane McIntoshDepartment of Electrical and Computer EngineeringMcGill University, Montreal, CanadaE-mail: [email protected]
Bram AdamsLab on Maintenance, Construction, and Intelligence of Software (MCIS)Polytechnique Montreal, Montreal, CanadaE-mail: [email protected]
Meiyappan NagappanDepartment of Software EngineeringRochester Institute of Technology, Rochester, USAE-mail: [email protected]
Ahmed E. HassanSoftware Analysis and Intelligence Lab (SAIL)Queen’s University, Kingston, CanadaE-mail: [email protected]
2 Shane McIntosh et al.
can explain 32%-57% of these hotspots, identifying subsystems that are particularlyhotspot-prone and would benefit the most from architectural refinement.
Keywords Build systems · Performance analysis ·Mining software repositories
1 Introduction
Build systems specify how source code, libraries, and data files are transformed intodeliverables, such as executables that are ready for deployment. Build tools [e.g.,make (Feldman, 1979)] orchestrate thousands of order-dependent commands, suchas those that compile and test source code, to ensure that deliverables are rebuilt cor-rectly. Such a build tool needs to be executed every time developers modify sourcecode, and want to test or deploy the new version of the system on their machine. Sim-ilarly, continuous integration and release engineering infrastructures on build serversrely on a fast build system to provide a quick feedback loop.
Since large software systems are made up of thousands of files that contain mil-lions of lines of code, executing a full build can be prohibitively expensive, oftentaking hours, if not days to complete. For example, builds of the Firefox web browserfor the Windows operating system take more than 2.5 hours on dedicated build ma-chines.1 Certification builds of a large IBM system take more than 24 hours to com-plete (Hassan and Zhang, 2006). In a recent survey of 250 C++ developers, more than60% of respondents report that build speeds are a significant issue.2 Indeed, while de-velopers wait for build tools to execute the set of commands necessary to synchronizesource code with deliverables, they are effectively idle (Humble and Farley, 2010).
To avoid incurring such a large build performance penalty for each build per-formed by a developer, build tools such as make (Feldman, 1979) provide incrementalbuilds, i.e., builds that calculate and execute the minimal set of commands necessaryto synchronize the built deliverables with any changes made to the source code. Hum-ble and Farley (2010) suggest that incrementally building and testing a change to thesource code should take no more than 1.5 minutes. Developers have even scrutinized5-minute long incremental build processes,3 calling the process “abysmally slow.”4
To assess build performance bottlenecks in the real world, we asked developersof the GLib and PostgreSQL systems to list the files that slowed them down themost when rebuilding them incrementally. While the reported bottlenecks were oftenheader files that many other files depended upon, and thus took took a long time torebuild, paradoxically, there were other header files that took a longer time to rebuild,but were not pointed out by the developers. Many of these slower header files werenot perceived to be build bottlenecks because they rarely changed over time (andhence, rarely needed to be rebuilt incrementally by the developers).
Hence, the frequency of change that a header file undergoes seems to influencehow developers perceive build performance issues, even though it has been largely
1http://tbpl.mozilla.org/2http://mathiasdm.com/2014/01/24/a-c-questionnaire-on-build-speed-the-results-are-in/3https://bugs.webkit.org/show_bug.cgi?id=329214https://bugs.webkit.org/show_bug.cgi?id=33556
Identifying and Understanding Header File Hotspots in C/C++ Build Processes 3
overlooked by existing build optimization approaches. Our prior finding that only10%-25% of the source files of large systems like Linux and Mozilla change in atypical month (McIntosh et al, 2011) suggests that traditional build profiling tech-niques may miss the header files that will really make a difference in the build timeduring day-to-day development. Instead, build optimization effort should be focusedon header file hotspots, i.e., header files that not only trigger slow rebuild processes,but also require frequent maintenance.
In this paper, we study header file hotspots in four open source systems, makingtwo main contributions:
1. We propose an approach to detect hotspots by analyzing the build dependencygraph and the change history of a system (Section 4). We evaluate our approachby simulating the build time improvement of header file hotspots for a developerby using historical data (Section 6). We find that optimization of the header filesidentified by the hotspot approach would lower the total future rebuild cost morethan optimization of the header files that trigger the slowest rebuild processes,change the most frequently, or are used the most throughout the codebase.
2. We study the characteristics of header file hotspots in the studied systems (Sec-tion 7). We find that logistic regression models can explain 32%-57% of the iden-tified header file hotspots using the architectural and code properties of headerfiles. Furthermore, our GLib and Qt models identify hotspot-prone subsystemsthat would benefit most from architectural refinement.
The remainder of the paper is organized as follows. Section 2 describes the incre-mental build process, while Section 3 describes how header file hotspots can impact adevelopment team in more detail. Section 4 presents the hotspot detection approach.Section 5 describes the setup of our case study of four open source systems. Section 6presents the results of our simulation experiment. Section 7 presents the results of ourstudy of the characteristics of header file hotspots. Section 8 discloses the threats tothe validity of our study. Section 9 surveys related work. Finally, Section 10 drawsour conclusions.
2 Incremental Builds
The build process for a software system is typically broken down into two mainphases (Adams et al, 2008). The first phase is configuration, where the build systemselects: (1) build tools (e.g., compilers and linkers), and (2) features to include in thebuild (e.g., Windows vs. Android front-end). The next phase is construction, whererelevant source code and data files are translated (compiled) into deliverables by or-chestrating several order-dependent commands. In addition, deliverables are certifiedby executing suites of automated tests, and finally bundled with product documenta-tion and data files for delivery to end users.
Developers who make source code changes would like to quickly produce mod-ified deliverables in order to test their changes. Hence, the cornerstone feature of abuild system is the incremental build, which can reduce the cost of a full build dra-matically. After performing a full build that produces initial copies of the necessary
4 Shane McIntosh et al.
deliverables, incremental builds only execute the commands necessary to update thedeliverables (“build targets”) impacted by source code changes.
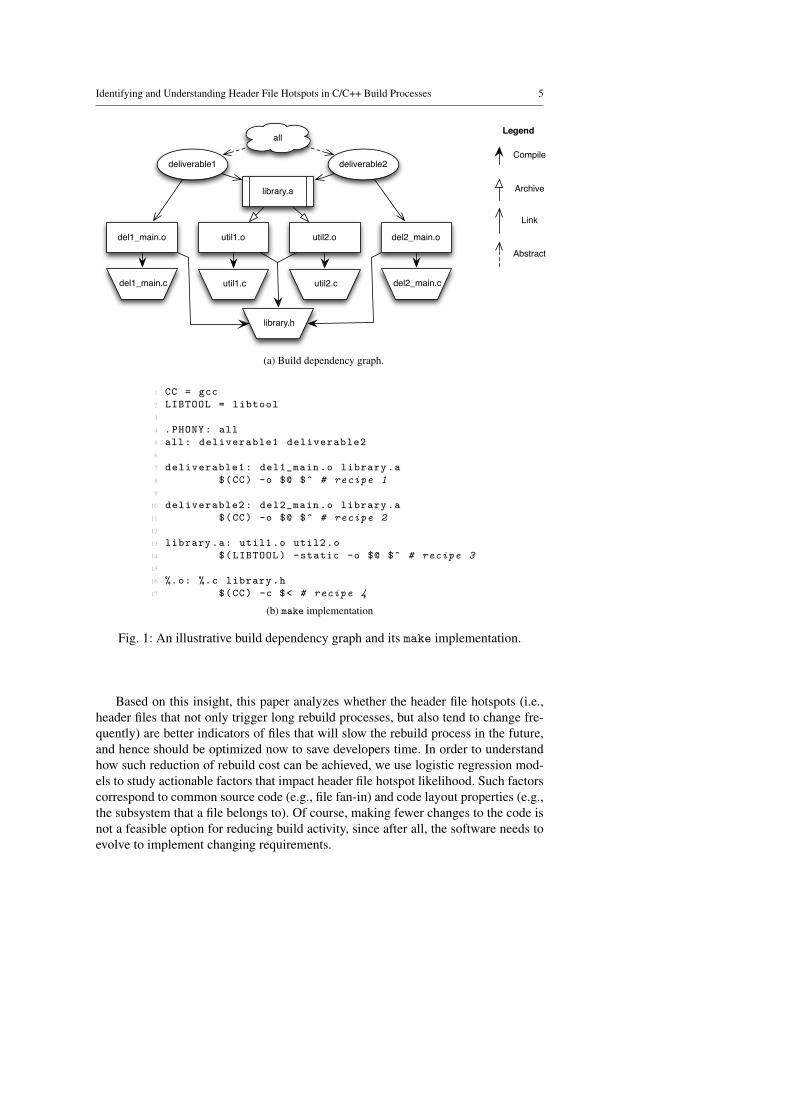
For example, consider the build dependency graph depicted in Figure 1a, whichrepresents the dependencies in the make specification of Figure 1b. The all nodein the graph is phony, i.e., a node used to group deliverables together into abstractbuild phases rather than to represent a file in the filesystem. The full build will ex-ecute four compilation commands (recipe 4) to produce build targets del1 main.o,util1.o, util2.o, and del2 main.o, as well as an archive command (recipe 3) toproduce library.a, and finally, two link commands (recipes 1 and 2) to producedeliverable1 and deliverable2. If del1 main.c is modified after a full buildhas been performed, an incremental build only needs to recompile del1 main.o andre-link deliverable1. As software systems (and build dependency graphs) grow,the minimizing behaviour of incremental builds saves developers time.
3 Header File Hotspots
Although incremental builds tend to save time, changes to header files often triggerslow rebuild processes (Lakos, 1996). For example, Figure 1a shows that changesto library.h will trigger the equivalent of a full build, since all four .c files ref-erence library.h, and will thus need to be recompiled when it changes. In turn,library.a will be re-archived and the two deliverables will be re-linked.
To better understand how developers are impacted by such build performancebottlenecks (e.g., header files that trigger slow rebuild processes), we asked the threemost active contributors to GLib and PostgreSQL (two long-lived and rapidly evolv-ing open source systems) to pick five files that they believe slow them down the mostwhen rebuilding. Surprisingly, the files that were reported as bottlenecks were notthe ones with the worst raw build performance. In fact, of the bottlenecks reportedby the three developers, the files with the worst performance appear 61st (GLib) and32nd (PostgreSQL) in the lists of files ordered by actual rebuild cost (i.e., the timetaken to incrementally build the system after a change to one of those files). Indeed,the respondents seemed to have most of their build performance issues with files thatwe measured to be relatively fast to rebuild. When asked why they did not select theslower files, one GLib developer responded: “because none of these [files] changeoften.”
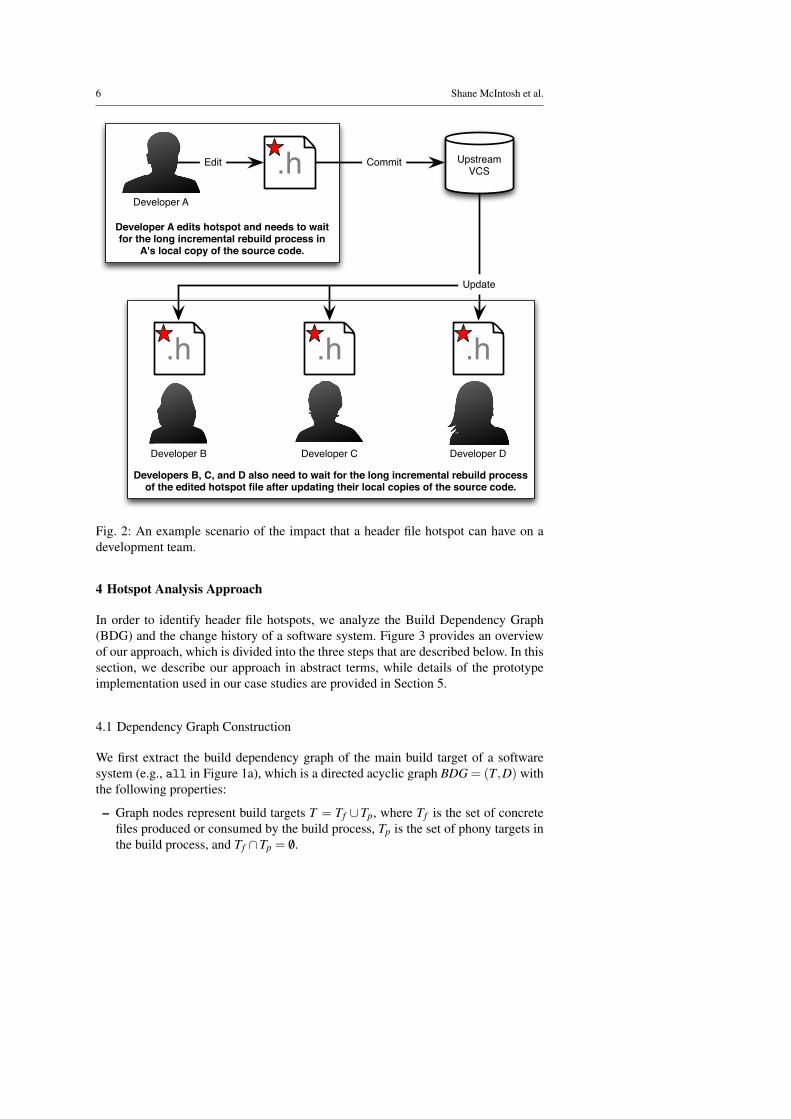
At first glance, this insight might seem counterintuitive. However, consider thescenario depicted in Figure 2 with a header file hotspot and a team of four develop-ers: A, B, C, and D. First, changing the hotspot file impacts the original developer.For example, if developer A modifies H, the change would trigger the slow rebuildprocess of H in A’s copy of the source code. After committing the hotspot change tothe version control system, the change to the hotspot impacts other team membersas well. When developers B, C, and D update their copies of the source code andreceive A’s change to H, it will also trigger the slow rebuild process of H on their ma-chines. If H tends to change often, the slow rebuilds on developers’ machines keepon repeating, accumulating a large incremental build cost over time.
Identifying and Understanding Header File Hotspots in C/C++ Build Processes 5
deliverable2
library.a
del2_main.o
del2_main.c
util1.o util2.o
util2.cutil1.c
Compile
Archive
Link
Legend
deliverable1
del1_main.o
del1_main.c
all
Abstract
library.h
(a) Build dependency graph.
1 CC = gcc
2 LIBTOOL = libtool
3
4 .PHONY: all
5 all: deliverable1 deliverable2
6
7 deliverable1: del1_main.o library.a
8 $(CC) -o $@ $^ # recipe 1
9
10 deliverable2: del2_main.o library.a
11 $(CC) -o $@ $^ # recipe 2
12
13 library.a: util1.o util2.o
14 $(LIBTOOL) -static -o $@ $^ # recipe 3
15
16 %.o: %.c library.h
17 $(CC) -c $< # recipe 4
(b) make implementation
Fig. 1: An illustrative build dependency graph and its make implementation.
Based on this insight, this paper analyzes whether the header file hotspots (i.e.,header files that not only trigger long rebuild processes, but also tend to change fre-quently) are better indicators of files that will slow the rebuild process in the future,and hence should be optimized now to save developers time. In order to understandhow such reduction of rebuild cost can be achieved, we use logistic regression mod-els to study actionable factors that impact header file hotspot likelihood. Such factorscorrespond to common source code (e.g., file fan-in) and code layout properties (e.g.,the subsystem that a file belongs to). Of course, making fewer changes to the code isnot a feasible option for reducing build activity, since after all, the software needs toevolve to implement changing requirements.
6 Shane McIntosh et al.
.h
Developer A edits hotspot and needs to wait for the long incremental rebuild process in
A's local copy of the source code.
Developer A
Developer B Developer C Developer D
Upstream VCS
Commit
.h .h .h
Update
Developers B, C, and D also need to wait for the long incremental rebuild process of the edited hotspot file after updating their local copies of the source code.
Edit
Fig. 2: An example scenario of the impact that a header file hotspot can have on adevelopment team.
4 Hotspot Analysis Approach
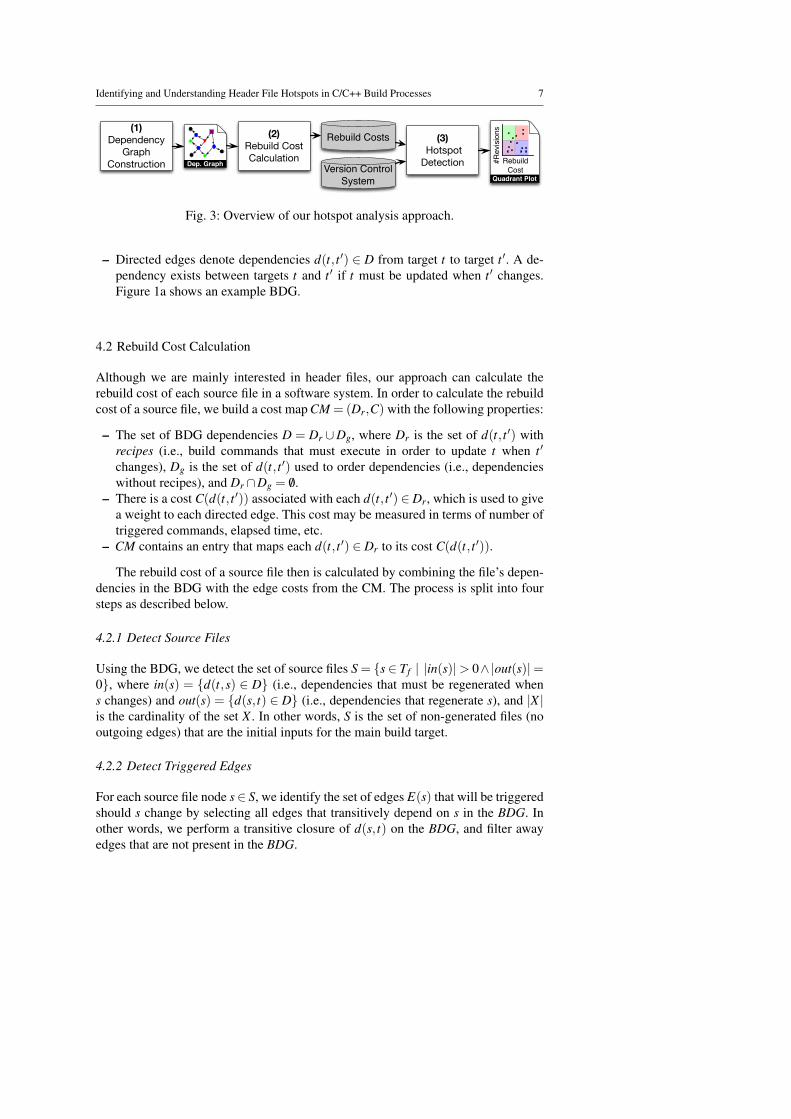
In order to identify header file hotspots, we analyze the Build Dependency Graph(BDG) and the change history of a software system. Figure 3 provides an overviewof our approach, which is divided into the three steps that are described below. In thissection, we describe our approach in abstract terms, while details of the prototypeimplementation used in our case studies are provided in Section 5.
4.1 Dependency Graph Construction
We first extract the build dependency graph of the main build target of a softwaresystem (e.g., all in Figure 1a), which is a directed acyclic graph BDG = (T,D) withthe following properties:
– Graph nodes represent build targets T = Tf ∪Tp, where Tf is the set of concretefiles produced or consumed by the build process, Tp is the set of phony targets inthe build process, and Tf ∩Tp = /0.
Identifying and Understanding Header File Hotspots in C/C++ Build Processes 7
Rebuild Costs(1)
Dependency Graph
Construction
(3) HotspotDetection
Quadrant Plot
RebuildCost
#Rev
isio
ns(2)Rebuild Cost CalculationDep. Graph Version Control
System
Fig. 3: Overview of our hotspot analysis approach.
– Directed edges denote dependencies d(t, t ′) ∈ D from target t to target t ′. A de-pendency exists between targets t and t ′ if t must be updated when t ′ changes.Figure 1a shows an example BDG.
4.2 Rebuild Cost Calculation
Although we are mainly interested in header files, our approach can calculate therebuild cost of each source file in a software system. In order to calculate the rebuildcost of a source file, we build a cost map CM = (Dr,C) with the following properties:
– The set of BDG dependencies D = Dr ∪Dg, where Dr is the set of d(t, t ′) withrecipes (i.e., build commands that must execute in order to update t when t ′
changes), Dg is the set of d(t, t ′) used to order dependencies (i.e., dependencieswithout recipes), and Dr ∩Dg = /0.
– There is a cost C(d(t, t ′)) associated with each d(t, t ′) ∈Dr, which is used to givea weight to each directed edge. This cost may be measured in terms of number oftriggered commands, elapsed time, etc.
– CM contains an entry that maps each d(t, t ′) ∈ Dr to its cost C(d(t, t ′)).
The rebuild cost of a source file then is calculated by combining the file’s depen-dencies in the BDG with the edge costs from the CM. The process is split into foursteps as described below.
4.2.1 Detect Source Files
Using the BDG, we detect the set of source files S = {s ∈ Tf | |in(s)|> 0∧|out(s)|=0}, where in(s) = {d(t,s) ∈ D} (i.e., dependencies that must be regenerated whens changes) and out(s) = {d(s, t) ∈ D} (i.e., dependencies that regenerate s), and |X |is the cardinality of the set X . In other words, S is the set of non-generated files (nooutgoing edges) that are the initial inputs for the main build target.
4.2.2 Detect Triggered Edges
For each source file node s∈ S, we identify the set of edges E(s) that will be triggeredshould s change by selecting all edges that transitively depend on s in the BDG. Inother words, we perform a transitive closure of d(s, t) on the BDG, and filter awayedges that are not present in the BDG.
8 Shane McIntosh et al.
4.2.3 Filter Duplicate Edges
Since the same recipe may be attached to multiple outgoing edges of a given buildtarget t, we count each such recipe only once by filtering out all but one of the cor-responding edges d(t, t ′) from E(s). We apply this filter to all dependencies d(t, t ′) ∈E(s) to obtain E ′(s).
For example, Figure 1a shows that when either util1.o or util2.o is updated,library.a must be re-archived. The make implementation in Figure 1b shows thatin such a case, the re-archiving of library.a only needs to be performed once. Inthis case, we would filter the edge between library.a and util2.o out of E(s) toobtain E ′(s).
4.2.4 Aggregate Cost of Triggered Edges
Finally, to calculate the rebuild cost of a source file s, we begin by looking up eachedge d(t, t ′)∈ E ′(s) in the CM. Any edge that appears in E ′(s), but does not appear inCM (e.g., d(t, t ′)∈Dg) is assumed to have no cost. The rebuild cost is then calculatedby summing up the costs of the edges in E ′(s) that were found in the CM.
4.3 Hotspot Detection
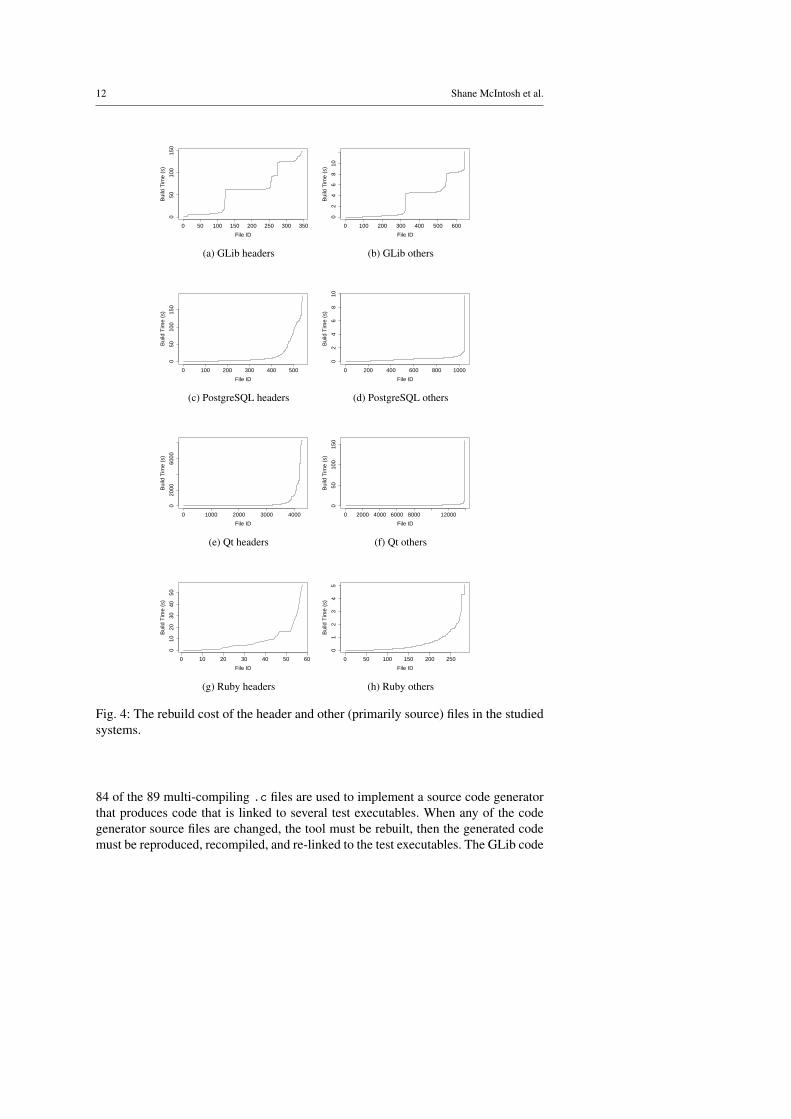
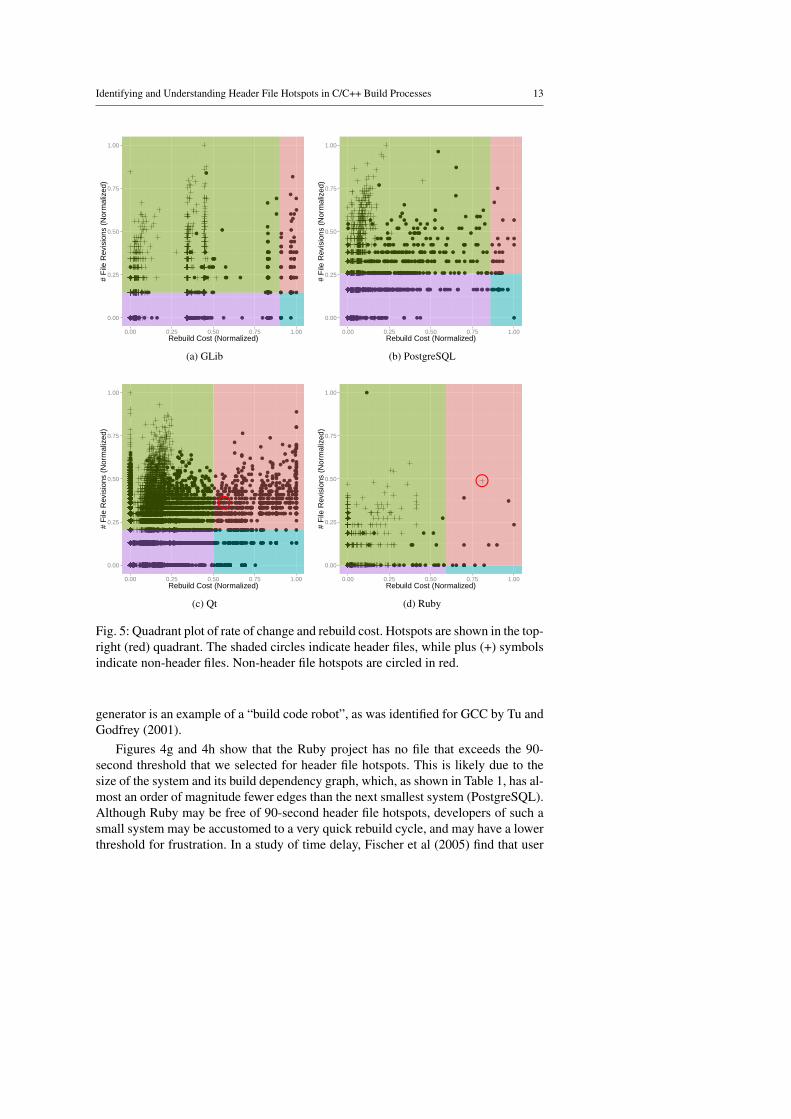
Software systems evolve through continual change in the source code, build system,and other artifacts. Changes to files are logged in a Version Control System (VCS),such as Git. To identify hotspots, we need to calculate the rate of change of eachsource file, i.e., the number of revisions of the file that are recorded in the VCS, thenplot this against the rebuild cost for each file. Similar to Khomh et al (2011), wedivide the plot into four quadrants:Inactive — Files that rarely change and that trigger quick rebuild processes. Opti-
mizing the build for these files is unnecessary.High churn — Files that frequently change, but trigger quick rebuild processes.
These files are low-yield build optimization candidates because although theyendure heavy maintenance, they do not cost much to rebuild.
Slow build — Files that rarely change, but trigger slow rebuild processes. These filesare low-yield build optimization candidates.
Hotspot — Files that frequently change and trigger slow rebuild processes. Thesefiles are high-yield build optimization candidates.The quadrant thresholds can be dynamically configured to suit the needs of the
development team. Initially, thresholds may be selected using intuition, however lateron, nonfunctional requirements could specify a maximum rebuild cost according to asystem’s common rate of file change.
5 Case Study Setup
We perform a case study on four open source systems in order to: (1) evaluate ourheader file hotspot detection approach, and (2) study the characteristics of real-world
Identifying and Understanding Header File Hotspots in C/C++ Build Processes 9
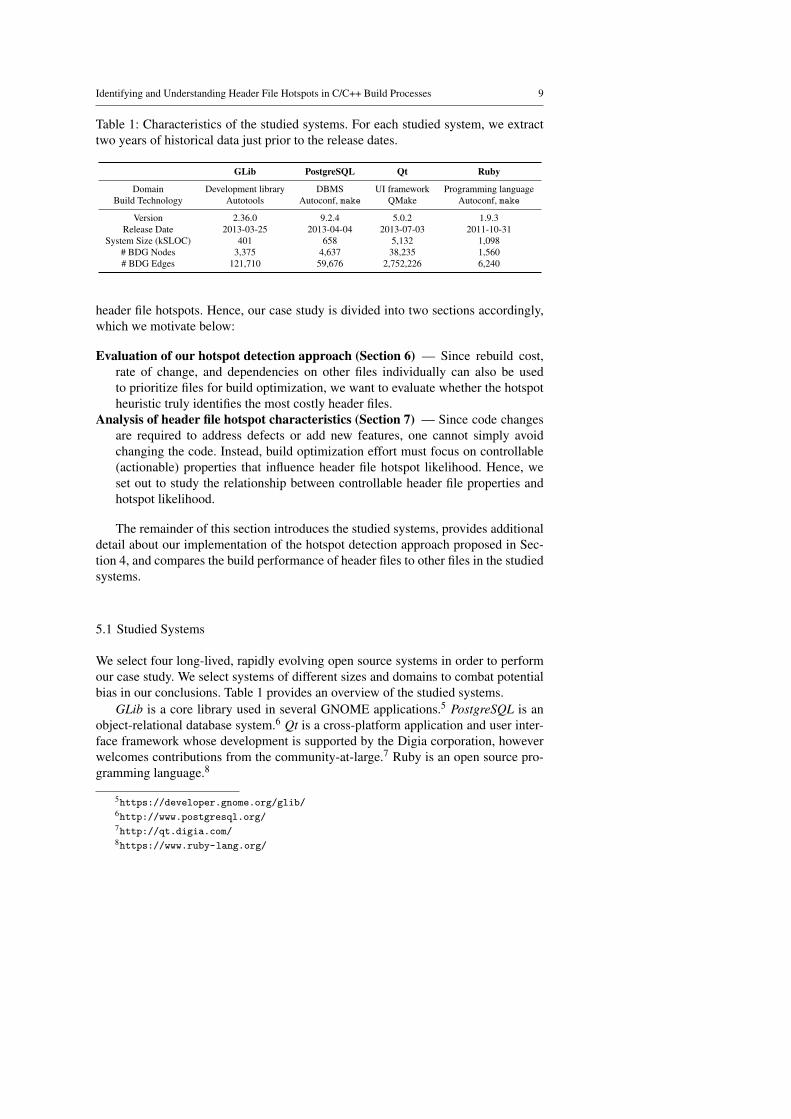
Table 1: Characteristics of the studied systems. For each studied system, we extracttwo years of historical data just prior to the release dates.
GLib PostgreSQL Qt Ruby
Domain Development library DBMS UI framework Programming languageBuild Technology Autotools Autoconf, make QMake Autoconf, make
Version 2.36.0 9.2.4 5.0.2 1.9.3Release Date 2013-03-25 2013-04-04 2013-07-03 2011-10-31
System Size (kSLOC) 401 658 5,132 1,098# BDG Nodes 3,375 4,637 38,235 1,560# BDG Edges 121,710 59,676 2,752,226 6,240
header file hotspots. Hence, our case study is divided into two sections accordingly,which we motivate below:
Evaluation of our hotspot detection approach (Section 6) — Since rebuild cost,rate of change, and dependencies on other files individually can also be usedto prioritize files for build optimization, we want to evaluate whether the hotspotheuristic truly identifies the most costly header files.
Analysis of header file hotspot characteristics (Section 7) — Since code changesare required to address defects or add new features, one cannot simply avoidchanging the code. Instead, build optimization effort must focus on controllable(actionable) properties that influence header file hotspot likelihood. Hence, weset out to study the relationship between controllable header file properties andhotspot likelihood.
The remainder of this section introduces the studied systems, provides additionaldetail about our implementation of the hotspot detection approach proposed in Sec-tion 4, and compares the build performance of header files to other files in the studiedsystems.
5.1 Studied Systems
We select four long-lived, rapidly evolving open source systems in order to performour case study. We select systems of different sizes and domains to combat potentialbias in our conclusions. Table 1 provides an overview of the studied systems.
GLib is a core library used in several GNOME applications.5 PostgreSQL is anobject-relational database system.6 Qt is a cross-platform application and user inter-face framework whose development is supported by the Digia corporation, howeverwelcomes contributions from the community-at-large.7 Ruby is an open source pro-gramming language.8
5https://developer.gnome.org/glib/6http://www.postgresql.org/7http://qt.digia.com/8https://www.ruby-lang.org/
10 Shane McIntosh et al.
The studied systems use different build technologies (e.g., GNU Autotools andQMake). However, each studied build technology eventually generates make speci-fications from higher level build specifications. The choice of studying make-basedbuild systems is not a coincidence, since such build systems are the de facto standardfor C/C++-based software projects (McIntosh et al, 2015), which are the projects thattypically use header files.
5.2 Implementation Details
5.2.1 Dependency Graph Construction and Rebuild Cost Calculation
We first perform a full build of each studied system on the Linux x64 platform withGNU make tracing enabled to generate the necessary trace logs. Such a trace logcarefully records all of the decisions made by the build tool (e.g., is input file X newerthan output file Y?). The generated trace is then fed to the MAKAO tool (Adamset al, 2007), which parses it to produce the BDG and CM. Finally, we implementedthe four steps of Section 4.2 in a script and applied it to the BDG and CM to calculatethe rebuild cost of each source code file s ∈ S.
5.2.2 Edge Weight Metric
To give the edge weighing function C(d(t, t ′)) a meaningful concrete value, we useelapsed time, i.e., the time spent executing build recipes. For this, we measure thetime consumed by each recipe during a full build by instrumenting the shell spawnedby the build tool for each recipe’s execution. Since varying load on our experimentalmachines may influence the elapsed time measurements, we repeated the full buildprocess (from scratch) ten times and select the median elapsed time for each recipe.
After ten repetitions, we find that the standard deviation of the elapsed time forany given command does not exceed 0.5 seconds and the median standard deviationamong the ten repetitions does not exceed 0.02 seconds. Thus, the variability in theelapsed time consumed by a recipe will not substantially skew our results.
5.2.3 Quadrant Threshold Selection
For the purposes of our case study, we use 90 seconds as the threshold for rebuildcost, since Humble and Farley suggest this as an upper-bound on the time spent onan incremental build (Humble and Farley, 2010). For the rate of change threshold,we select the median number of revisions across all files of a system. Furthermore,to reduce the impact that outliers have on the quadrant plots, we apply the logarithmon both rebuild cost and rate of change values. We normalize rebuild cost and rateof change by dividing each logarithmic value by the maximum so that the quadrantplots of different systems can be compared.
Identifying and Understanding Header File Hotspots in C/C++ Build Processes 11
5.3 Preliminary Analysis of Header File Build Performance
Prior to performing our case studies, we first perform a preliminary analysis to eval-uate whether header files are truly the source of the most problematic build hotspotsin the studied systems. Indeed, while prior work has focused on header file opti-mization (Dayani-Fard et al, 2005; Yu et al, 2003, 2005), it is unclear whether theyare truly the largest source of build hotspots. Since header files represent interfaces(which ought to be more stable over time), they may not necessarily change as fre-quently as regular source code files. It is conceivable that core implementation filesthat change often and generate a substantial amount of link-time build activity mayalso be hotspots that are worthy of optimization effort (Lakos, 1996).
5.3.1 Approach
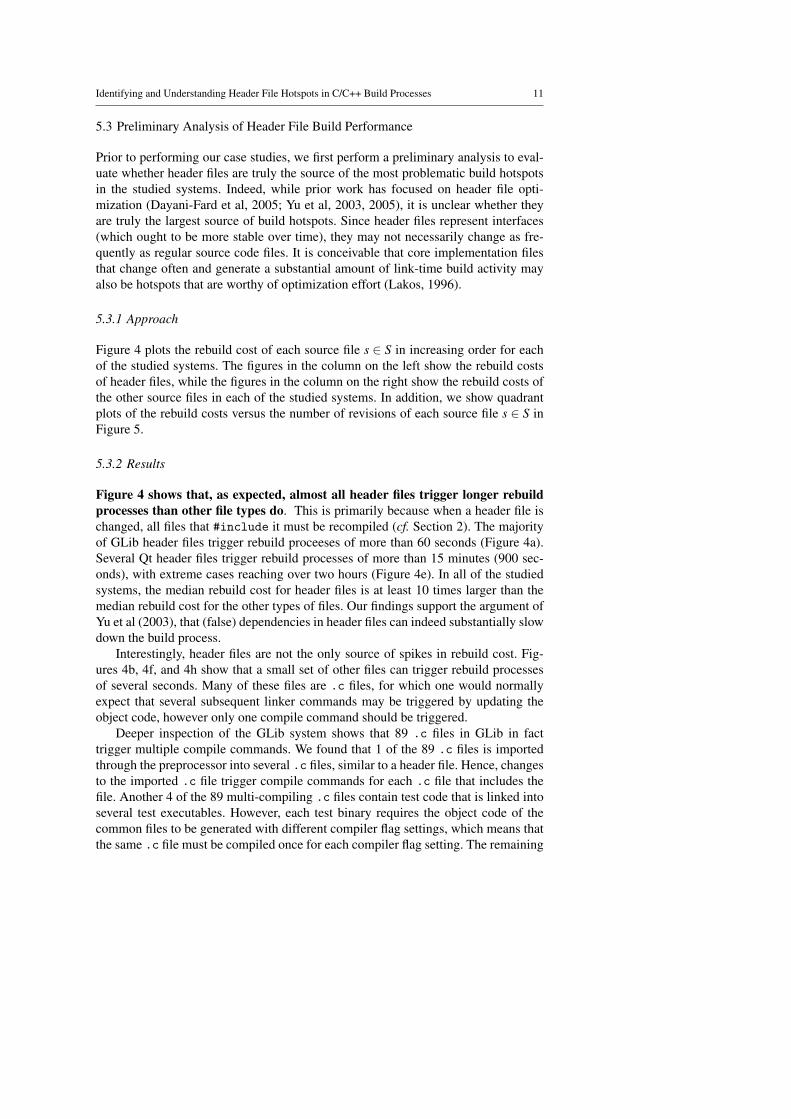
Figure 4 plots the rebuild cost of each source file s ∈ S in increasing order for eachof the studied systems. The figures in the column on the left show the rebuild costsof header files, while the figures in the column on the right show the rebuild costs ofthe other source files in each of the studied systems. In addition, we show quadrantplots of the rebuild costs versus the number of revisions of each source file s ∈ S inFigure 5.
5.3.2 Results
Figure 4 shows that, as expected, almost all header files trigger longer rebuildprocesses than other file types do. This is primarily because when a header file ischanged, all files that #include it must be recompiled (cf. Section 2). The majorityof GLib header files trigger rebuild proceeses of more than 60 seconds (Figure 4a).Several Qt header files trigger rebuild processes of more than 15 minutes (900 sec-onds), with extreme cases reaching over two hours (Figure 4e). In all of the studiedsystems, the median rebuild cost for header files is at least 10 times larger than themedian rebuild cost for the other types of files. Our findings support the argument ofYu et al (2003), that (false) dependencies in header files can indeed substantially slowdown the build process.
Interestingly, header files are not the only source of spikes in rebuild cost. Fig-ures 4b, 4f, and 4h show that a small set of other files can trigger rebuild processesof several seconds. Many of these files are .c files, for which one would normallyexpect that several subsequent linker commands may be triggered by updating theobject code, however only one compile command should be triggered.
Deeper inspection of the GLib system shows that 89 .c files in GLib in facttrigger multiple compile commands. We found that 1 of the 89 .c files is importedthrough the preprocessor into several .c files, similar to a header file. Hence, changesto the imported .c file trigger compile commands for each .c file that includes thefile. Another 4 of the 89 multi-compiling .c files contain test code that is linked intoseveral test executables. However, each test binary requires the object code of thecommon files to be generated with different compiler flag settings, which means thatthe same .c file must be compiled once for each compiler flag setting. The remaining
12 Shane McIntosh et al.
0 50 100 150 200 250 300 350
050
100
150
File ID
Bui
ld T
ime
(s)
(a) GLib headers
0 100 200 300 400 500 600
02
46
810
File ID
Bui
ld T
ime
(s)
(b) GLib others
0 100 200 300 400 500
050
100
150
File ID
Bui
ld T
ime
(s)
(c) PostgreSQL headers
0 200 400 600 800 1000
02
46
810
File ID
Bui
ld T
ime
(s)
(d) PostgreSQL others
0 1000 2000 3000 4000
020
0060
00
File ID
Bui
ld T
ime
(s)
(e) Qt headers
0 2000 4000 6000 8000 12000
050
100
150
File ID
Bui
ld T
ime
(s)
(f) Qt others
0 10 20 30 40 50 60
010
2030
4050
File ID
Bui
ld T
ime
(s)
(g) Ruby headers
0 50 100 150 200 250
01
23
45
File ID
Bui
ld T
ime
(s)
(h) Ruby others
Fig. 4: The rebuild cost of the header and other (primarily source) files in the studiedsystems.
84 of the 89 multi-compiling .c files are used to implement a source code generatorthat produces code that is linked to several test executables. When any of the codegenerator source files are changed, the tool must be rebuilt, then the generated codemust be reproduced, recompiled, and re-linked to the test executables. The GLib code
Identifying and Understanding Header File Hotspots in C/C++ Build Processes 13
●● ●●●●●●●●●
●
●●
●
●
●
●
●
● ●●●●●●● ●● ●●●●
●
●●
●
●
●
●●●●
●●●
●
●
●
●●
●
●
●●
●
●●
●
●●
●
●
●●●
●
●
●●● ●●
●
● ●● ●●●
●
●●●●●●●●●
●●
●
●
●
●
● ●
● ●
●
●
●
●●●●
●
● ●●
●
●
●
●
●
●
●
●
●● ●●●
●
●●●
●
●
●
●
●●
●
●●
●
●
●
●●
●
● ●
●
●
●
●
●
●
●
●
●
●●
●
●●●●
●
●● ●● ●●●● ●
●
●●
●
●● ●
●
●
●
●
●●
●
●
●●
●
● ●●●●
●
●
●
●●● ●
●
●
●
●
●●●●● ●●●●●●●●●●●●●●●●●●
●
●●●
●
●●
●●●●●●● ●●●●● ●●●
●
●
●
●
●
●
●
●
●
●
●
●
●
●
●●
●
●
●
●●
●●
●
●●
●
●
●
●
●
●
●
●
●● ●
●
●
●
●
●
●
●
●
●
●
●
●
●
●
●
●
●
●
●
●●●●●
●●●●
●●
● ●
●
●
●
●
●●●
●
●
●
●
●
●●
●
●
●
●
●
●
●
●
●
●
●
●●
● ●
●
●
●●
●
●
●
●
●
●
●
●●
●●
●
●
● ● ●
●
●
●
●
●
●
●
●
●
●
●
●
●
●●
●
●●
●
● ●
●
●
●
●●0.00
0.25
0.50
0.75
1.00
0.00 0.25 0.50 0.75 1.00Rebuild Cost (Normalized)
# F
ile R
evis
ions
(N
orm
aliz
ed)
(a) GLib
●●
●
●
●
● ●●●
●
●
●
●● ●
●
●
●
●● ●
●
●● ●●
●
●●● ●
●
●
●●
●
●
●
●●●●●●●●
●
●
●●
●
●
●
●
●
●
●
●
●
● ●
●
●
● ●● ●
●
●
●
●
●
●
●
●
●
●
●
●
●
●
●
●
●
●
●
●
●
●
●
●
●
●
●
●
● ●●
●
●
●
●
● ●
●
●
●
●
●
● ●●
●
●
●
●
●
●
●
●
●
●
●
●
●
●
●
●
● ●
●
●
●
●
●
●
●
●●
●
● ●
●
●
● ●
●
● ●
●
● ●
●
●●●
●
●●
●● ●
●
●
●
●
● ●
●
●
●
●
●
●
● ●●
●
● ●
●
●● ●
●
●
●
●
●
●●
●
●
●
●
●
●
●
●
●
●
●
●
●
●●
● ●
●
●
●
●
●
●
●
●
●
●
●
●
●
●
●
●●●●●●●●●●
●
●
● ●
●●●●●●●●●●●● ●●●●● ●●
●
●
●
●
●●
●
●● ● ●
●
●
●●
●
●
●
●
●
● ●●●
● ●
●
●
●
●
●
●
●
●
●
●
●
●
●
●
●
● ●
●
●
● ●
●
●● ●●●
●
●
● ●
●
●
●
●
●
●●
● ● ●●
●
●
●
●
●
●
●
● ●
●
●●●
●
●
●
●
●
●● ●
●
●
●
●
●
●●●●●●●●●●●●●●●●●●●
●
●●●●●●●●
●
●
● ●
●●
●●
●
●
●●
●●
●
●
●
●
● ●●
●
●● ● ●
● ●
●
●
●●●●●●●●●●●●●●●●●●●●●●●●●●●●●●●●●
●
●
●
●
●●
●
●●
●
●●
● ● ●●●●
●
●
●
●
●●●
●
●
●
●
●
●
●
●
●
●
●
●
●
●
●
●
●●
●
●
●
●
●
●
●
●
●●
●
●
●
●
●
●
●
●
●
●
●
●
●●●
●
● ● ●
●
●
●
●●
●
●●
●
●
●
● ●
●●
●
●
●
●
●
●
●
●
●
●
●
● ●
●
●
●
●●
●
●
●
●
●
●
●
●
●
● ●
●
●
●
● ● ● ● ●● ●
●
● ●●
●
● ●●●●●
● ●
●
●
●●●
● ●
●
●
●
●●
●●
●
●
●●●●●
●
●
●●●●●●
●●
●
●
●
●●0.00
0.25
0.50
0.75
1.00
0.00 0.25 0.50 0.75 1.00Rebuild Cost (Normalized)
# F
ile R
evis
ions
(N
orm
aliz
ed)
(b) PostgreSQL
●●●●●●●●●●●
●
●
●
●
●
●●
●
●
●
●●
●●
●
●
●
●
●
● ●
● ●
●
●●●●● ●●
● ●
●●
●
●
●
●
●
●
●
●
●●
●
● ●●
●
●
●●● ●●●
●
●● ●
●
● ●● ●● ● ●
●
● ●
●●
● ●●● ●● ●●●
●
●●● ●●
●
● ●
●
●●● ● ●●●●●●●
● ●
● ●● ● ●
●
●●
●
●●●●
●
●●●
●
●●●● ●● ●●● ●● ●●
●●●●● ●● ●●● ●● ●● ●● ●●● ●● ●●●●●●●●●● ●●●●●●●●●●●●●●●●● ●● ●●●●●●●●● ●● ● ●●●●●●●●●●●● ● ● ●●● ●●● ●●●● ●●●● ●●●● ●●●●● ●●●●● ●●●●● ● ●● ● ●●● ● ● ●●● ● ●●● ●●●●● ● ●●●●●●● ●●●● ●●●●● ● ●●●●● ● ●● ●●● ● ●
● ●●●●● ●●● ● ● ●●●●●● ● ●● ●●●● ●●●●●● ● ●●●
●●●●● ●● ●●●●●●●●●● ●● ●●● ●● ●●● ●●●● ● ●●●●●● ●●
●
● ●● ●●● ●● ●●●● ●●●● ●●●●● ●
●
●
● ●
●
●●●●●●●
●●
●
●
●
●
●
●
●
●
●
●
●●
●●
●●
●
●
●●●●●●●●●●●
●
●
●
●
●●●●●
●
●●
●
●●●●●●●●●●
●
●
●
●
●
●
●
●●
●●●
●
●
●
●
●
●
●
●
●
●
●
●
●
●
●●
●
●
●
●
●●●●●●●
●
●●
●●
●●●●●●●●●●●●●●●●●●●●●●●●●●●●●●●●●●●●●●●●●●●●●●●●●●●●●●●●●●●●●●●●●●●●●●●●●●●●●●●●●●●●●●●●●●●●●●●●●●●●●●●●●●●●●●●●●●● ●●●●●●●●●●●●●●●●●●●●●●●●●●●●●●●●●●●●●●●●●●●●●●●●●●●●●●●●●●●●●●●●●●●●●●●●●●●●●●●●●●●●●●●●●●●●●●●●●●●●●●●●●●●●●●●●●●●●●●●●●●●●●●●●●●●●●●●●●●●●●●●●●●
●
●●●●●●●●●●●●●●●●●●●●●●●●●●●●●●●●●●●●●●●●●●●●●●●●●●●●●●●●●●●●●●●●●●●●●●●●● ● ●●
●
● ●●
●
●● ●●● ●●
●
●
●●●
●●●●●●●●●●●●●●●●●●●●●●●●●●●●●●●●●●●●●●
●● ●● ●
●
● ●●●●●
●
●
●●
●●
●
●●
●
●●●●● ●
●
●
●
●●●●●●●●●●●●●●●●●●●●●●●●
●
●●●●
●
●●
●
●
●
●
● ●
●
● ●●●
●
●
●
●
●
●
●
●
●
●●● ●
●
●
●
●
●
●
●
●
●
●
●●
●
●
●
●
●
●●
●
●
●
●
●
●●
●
●●
●
●●
●
●
●
●
●
●
●
●
●
●●●
●●●●●●
●
●
●
●
●
●●
●
●
●
●
●
●
●
●
●
●
●
●●●
●●
●
●
●
●
●
●
●
●
●
●
● ●
● ●
●
●
●
●●
●
●● ●
●
●
●
●
●
●
●
●
●
●
●
● ● ●
● ●
●
●
●
●
●
●
●
●
●
●
●
●
●
●
●
●
●
●
●●●
●
●
●
●●
●
●
●
●
●
●
●
●
●
●
●
●
●
●
●
●
●
●
●
●
●
●
● ●
●
●
●
●
●
●
●
●
●
●
●
●
●
●
●
●
●
●
●
●
●
●
●
●
●
●
●
●
●
●
●
●
●
●
●
●
●
●
●
●
●
●
●
●
●
●
●
●
●
●
●
●
●
●●
●
●●
●
●
●
●
●
●
●
●
●●
●
●●● ●
●
● ●
●
●
●●
●
●●
●
●●
●
●
●
●
●
●
●
●
●
●
●●
●
●
●
●
●●
●
●●
●●
●
●
●
●
●
●
●
●
●
●●
●
●
●
●
●
●
●
●
●
●●
●
● ●●
●
●
●
●
●
●
●
●
●●
●
●
●
●
●
●
●
●
●●
●
●
●
●
●
●
●
●
●
●●
●
●●
●
●
●●
●
●
●
●
●
●
●●
●●●
●
●
●
●
●●
●
●
●
●
●
●
●●●●●●●
●
●●●●●●●●●●
●
●●●●
●
● ●
●
●
●
●
●
●
●
●
●
●●
●
●
●
● ●
●●
●
●
●
● ●
●
●●●●
● ●
●
●
●
●
●
●
●
●●
●
●
●
●
●●
●
●●
●
●
●
●
●
●
●
●●
●
●
●
●
●
●
●
●
● ●●
●
●
●
●
●
●
●●
●
●●
●
●●
●
● ●
●
●
●
●
●
●
●
●
● ●●●
●
●
●
●
●●●
●●
●●
●
●
●
●
●
●●
●●
●
●
●
●
●
●
●
●
●
●
●●
●
●
●
●
●
●
●
●
●
●
●● ●
●
●
●
●
●
●
●
●
●
●
●
●
●
●
●
●
●
●
●
●
●
●
●
●
● ●
●
●
●
●
●
● ●●●
●
●
●
●
●
●●
● ●
●
● ●
●
●
●
●
●
●
●
●
●
●
●
●
●
●
●
●
●
●
●
●
●
●
●
●
●
●
●
●● ●
●
●
● ●●
●
●
●
●
●
●
●
●
●●●
●
●
●●
● ●
●●●●
●
●●
●
●
●
●
●
●
●
●
●●
●
●
●
●
●
●
●
●●
●
●
●
●
●
●
●
●●
●
●
●
●
●
●
●
●
●
●
●
●
●●●
●
●
●●
●
●
●
●
●
●
●
●
●
●
●
●
●
●
●
●
●
●●
● ●
●
●
●●●
●
●● ●
●
●
●
●
●●
●
●
●
●●
●
●●
●
●
●
● ●
●
●
●
●
●
●
●
●
●
●
●
●
●
●
●
●
●
●
●
●
●
●
●
●
●●●● ● ● ●
●
●
●●
●
●
●
●
●
●
●●
● ●
●
● ● ●●● ●
●●
●●●
●●
●
●
●
●
●
●
●●
●
●●
●
●
●
●
●
●
●
●●
●
●
●
●
●
●●
●
●
●
●
●
●
●
●
●
●
●
●
●
●
●
●
●
●
●
●
●
●●●
●
●
●
●●
●
●●
●
●●
●
●
●
●●●
●
●
●
●
●●●
●
●
●
●
●
●
●●●●
●
●●
●●●
●●●
●
●●
●●
●
●
●
●
●●
●
●●
●
●
●
●
●
●●
●
●
●
●
●
●
●
●
●●
●
●
●
●
●
●
●
●
●
●
●
●
●
●
●
●
●
●●
●●
●
●
●
●
●
●
●
●●
●
●
●
●
●
●
●
●
●
●
●
●
●
●
●
●
●
●
●
●
●
●
●
●
●
●
●
●
●
●
●●●
●
●
●
●
●
●
●
●●
●
●
●
●●●●
●
● ●●
●
●
● ●
●
●
●
●
●
●
●●
●
●
●
●
●
●
●
●
● ●●
●
●
●
●
●
●
●
●●
●
●
●
●
●
●●
●
●
●●
●
●● ●●
●
●
●
●
●
●
●
●
● ●
●
●●
●
●
●
●
●
●
●
●
●●
●
●
●
●
●
●
●
●
●
●
●
●
●
●●
●
●● ●
●●● ●●●●●●● ●
●
●● ●● ●● ●
●
●
●●●● ●●
●
●
●●● ●
●
●
●
●
●
●
●
●
●
●
●
●
●
●●
●
●
● ●
●
●●
●●●
●
●●●●●●●●●●
●
●●
●
● ●●
●
●
●●
●
●
●
●
● ●
●
●
●
● ●
●●
●
●● ●●
●
●
●
●●
●
●
● ●●
●
●
●
●●
●
●
●
●
●
●
●
●
●
●
●
●
●
●
●
●
●
●●
●
●
●
●
●
●
● ●●●
●
● ●
●
●
●
●
●
●
●
●
●
●
●●
●●
●
●
●
●
●
●●
●●
●
●
●
●
●●● ●
●
●
●
●
●
● ●
●
●
●
●
●
●
●
●
●
●
●
●
●
●
●
●
●
●
●
●
●● ●
●
● ●
●
●
●
●
●
●
●●
●
●
●
●
●
●
●
●
●
●
●●
●
●
●
●●
●
●
●●
●
●
●
●●
●
●
●
●
●
●●
●
●●
●
●
●
●
●
●
●
●
●●
●
●
●
●
●
●●
●
●
●
●
●
● ●
●●
●
●
●
●
●
●●
●
●
●
●
●
●●●●
●●
●
●
●
●
● ●
●
●
●●
●
●
●
●
●
●
●
● ●● ●
● ●●●
●
●●
●
●
● ●●
●
●
●
●
●
●● ●
●
●
●
●● ●●
●●
●
●●●●●
●
●
●●●●● ●●
●
●
●●
●
●
●
●●●●
●
●●
●● ●●●
●●
●●● ●
●
●
●
●
●●
●●●●
●
●● ●●●●● ●●
●
●
●
● ●
●
●
●●●●●●●●●●●●●●●●●
●●
●
●
●●●●●●
●
●●●
●
●●●●●●
●
●●●●●●●●●●●●●●●
●
●
●
●●●
●
●●●●●●●
●
●●●●
●
●
●●
●●
●
●●
●●
●●●
●
●
●
●●●●●
●●
●
●
●●●●
●
●●●●
●●
●
●●
●●●
●
●
●●
●●●
●
●
●
●
●
●
●
●
●
●
●
●
●
●●
●●●●●●●●●●●●●●●●●●●●●●●●●●●●●●●
●
●●●
●
●●
●
●
●
●
●
●
●
●
●
●
●●●
●●●
●
●●
●●
●
●●●●
●●●●●●●●
●
●
●●
●●●●
●
●
●
●
●
●
●
●
●
●●
●●
●
●
●●●●●●●
● ● ●●● ●● ●● ●●● ●● ●●●●●● ●●●● ●●
●●●●●●●●●●● ● ● ●●●●
●
●
●
●●
●
●●●
●
● ●● ●●●
●
●●●
●●
●●
●
●
●
●●● ●● ●●● ●
●
●
●
●
●●●
●
●
●
●
●
●
●
●
●
●
●
●
● ●●●
●
●
●
●
●
●
●
●
●
●
●●
●●● ●● ●
● ●
●
● ●●
●
●
●
●●
●●
●
●●●●●●
● ●
●
●●
●
●
●
●
●
●
●
●
●
●
●
●
●
●
●
●
●
●
●
●
●
●
●
●
●
● ●
●
●
●
●
●
●
●
●
●
●
●
●
●
●
●
●
●
●
●
●
●
●
●
●
●
●
●
●
●
●
●
●
●
●
●
●
●
●
●
●
●
●
●
●
●
●
●
●
●
●●
●
●
●
● ●
●
● ●
●
●
●●
●
●● ●●●
●
●
●
● ●
●
●
●
●
●
●
●
●●
●
●
●
●
●
● ●● ●
●
●●
●
●
●
●
●
●
●
●
●
●
●
●
●
●●
● ●●
●
●
●
●
●
●
●
●
● ●
●
●
●●
●
●
●
●
●
● ●
●
●
●
●
●
●
●●
●
●
●
●
●
●●
●
●
●●
●
●
●
●
●
●
●
●
●
●●
●
●
●
●
●
●●
●
●
●
●
●
●
●
●
●
●
●
●●
●
●
●
●
●
● ●
●
●
●
●●
●
●
●
●
●
●
●
●
●●
●
●●
●
●●
●
●
●
●
●
● ●
●●
● ●
●
●●●
●
●
●●
●
●
●
●
●
●
●● ●●
●
●
●
●●
●
●
●
● ●
●● ●
●
●
●
●
●
●
●
●
●●
●
●
●
●
●
●
●
●
●
●
●
●
●
●
●
●
●
●● ●
●
●
●
●
●●
●● ●
●
●●●
●●●●●●●●●●
●
●
●
●●●●●●●●●
●●
●●●●●●●●●●●●●●●●
●
●●●●●●●●●●●●●
●●●
●
●
●●
●●
●
● ●● ●● ●●●● ●●● ●●●●● ● ●● ● ●● ●●● ●●● ●●●● ●● ●●●
●
●●●●
●
●
●
●
●
●●
●
●
●
●●●●
●
● ●●
●
●
●
●
●●
●
●
●
●
●
●
●
●
●
●
●
●
●
●
●
● ●●
●●
●
●
●● ●
● ●
●
●
●●
●●
●
●
●
●●●
●
●●
●● ●
●
●
●
●
●●
●
●
●
●
●●
●
●
●
● ●
●
●
●
●
●
●
●●
●
●
●
●
● ●
●
●
● ●
●
●
●
●
●●
● ●
●
●
●
●
●
●
●●
●
●●
●
●●
●●
●●
●●
●
●
●●
●
●
●
●
●
●
●
●●
● ●
●
● ●
●
●
●
● ●●●
●
●
●
●
●
●●
●
●
● ●● ●
●●
●
●
●●
●
●
●
●
●
●
●●
●●
●●●
●●
● ●
●
●
●●
●●
●●
●
●
●●
●
●
●
●●
●
●
● ●●
●
●
●
●●
● ●
●
●
● ●
●
●
● ●●
●●●
●
●
● ● ●●● ●● ●●●●●● ●●● ●● ●●●●●●●●●●●●●●●●●●●●●●●●●●●●●●●● ● ●●●●●● ●●● ● ●●●● ●● ● ●●● ●●●●●● ● ●●●●● ●●●
●
●
●●
●
●
●●
●
●
●
●
●
●
●
●
●
●
●
●
●
●●
●
●
●
●
●
●
●
●
●
●
●
●
● ●
●
●
●
●
●
● ●
●
●●
●
●●●
●
●
●
●● ●
●
●
●
●
●
●
●
●
●
●
● ●●●
●●
●●
●
●
●●●
●
●
●
●
● ●
●
●
●
●
●●
●
●
●
● ●●
●
● ●
●
●
●
●
●
●
●●
●
●
●
●●
●
●
●●
●
●
●
●
●
●
●
●
●
●
●
●
●
●
●
● ●
● ●
●
●
●
●
●
●
●
●
● ●
●
●
●
●
●
●
●
●●
●
●
●
●
●
●●
●●
●
●
●
●
●
●
●● ●
●
●
●
●
●
●
●
●
●
●
●
●
●●●●●●
●
●
●
●●
●
●●●●●●●●●●●●●●●●●
●
●●
●●
●
●
●
●
●
●
●●●●●
●
●●
●
●●●●●●
●●
●
●
●●
●●
●●●●●●●
●
●
●
●
●
●
●
●
●
●●
●
●
●
●●
●
●
●
●
●
●
●
●
●
●
● ●
●
●
●
●
●
●
●
●
●
●●●
●
●●●
●●
●
●
●
●
●●●
●●●●
●●
●
●
●
●
●
●●
●
●
●
●
●
●
●
●
●
●
●●
●
●●
●
●
●
●
●●
●
●
●
●
●●
●
●
●
●●
●●
●
●
●
● ●
●
● ●●
●
●
●
● ●
●●● ●●●● ●●●●●●●●
●●
●
●●●● ●● ●
●
● ●
● ● ●●●●
●●
●
● ●
●
●
●
●
● ●
●
●●
●
●
●
●
● ●● ●
●
● ●●●●
●
●● ●● ●● ●
●
●
●●● ●● ●
●
● ● ●● ●
●
●● ●●
●
●
●
● ●
●
●
●●
●
●
●●● ●●●●●●●●
●
●● ●
●
●
●
● ●● ●●
●
●
●
●●
●
●
●●
●
●
●
●
●
●●●
● ●
● ●
●
●●
●
● ●●
●
●
●●
●●
●
●
●● ●
●
●●
●
●
● ●
●
●
● ●
●●●
●
●● ●● ●● ●
●
● ●
●
●● ●
●●●●●
●
● ●
●
●
●●●
● ●● ●
●● ●
●● ●
● ●
●●
●
●
●
●●●●●
● ●●
●
●
●●● ● ●
●
●
●
●
●●
●
● ●●
● ●
●
●●
●
●
●
● ●●
●
●
●
●
●
●
●
●
●
●●
●
●
● ● ●● ●●●●●
●
●●● ● ●
●●●● ●● ● ●●●●●● ●● ● ●●● ●● ● ●●●●●●● ●●● ●●●●● ●●●●● ●●●●●●● ●●● ●●●● ●● ●● ●● ●● ●●● ● ●● ● ●●● ●● ●●● ●●● ●●● ●● ●●●●● ●● ●●● ●●● ●●● ●●● ●● ●●●● ●● ●●● ● ●● ●● ●● ● ●● ●● ● ●● ●●● ●● ●●
●●
● ●●● ●●● ●
●
●●●●●●● ● ● ●● ●● ●● ●● ●● ●● ●●●●●● ●●●● ●● ●● ●●● ●● ●
●
●●●●● ●●● ● ●●●● ● ●● ●● ●● ● ●● ● ●●●● ●● ●●●● ●●●
●●
●
●●● ●●● ●● ●●●●●●● ●
●
●●●● ●● ●
●
● ●
●
● ●●
●●
●●●●●
●
●●● ●●●
●
●● ●●●●●●● ● ●●●●
● ●
●
●●
●
●
●
●
●
●
●
●
●
●
●
●
●
●
●
●
●
●● ●●●● ●
●
● ●●●● ●●
● ●
●●●● ●●●● ●●● ● ● ●●● ●●● ●●● ●●● ●●● ●●● ● ●● ●●● ●●● ●●●● ●● ●●●●● ●● ●●● ●●● ●●●● ●● ●●●●● ●●
●
● ●● ● ●● ●●● ●●●
●
●
●
●
●● ●●● ●● ●●● ●● ●● ●●● ●●
●
●
●
●
●
●
●
●
●
●
● ●
●
●
●
●●●● ●
● ●●●●
●
●
●
●●
●
●●
●
●●
●●●●
●●
● ●●●●●●● ●●●●●●●● ●●●●●●●●●●
●
● ●●●●● ●●●● ●●● ● ●●●● ● ●●●● ●● ●●●●●●● ●●●●● ● ●●● ●●●● ●● ●●●●●●●●●●●●●● ● ● ●●● ●●●●●
●
●●●●● ●● ●●● ● ●● ●● ●●● ●● ●●●●●●●
●●
●●
●
●●●
● ●
●●●● ●
●
●
●
●
● ●
●●● ●●●● ●● ● ●●
●
●
●
●●●● ●● ●● ●●● ●●● ●
●
●
●
●
●●
●
●
●
●
●
●
●
●●● ●●●
●●
●●● ●●●●●●●●●● ●●
●
●
●●
●●
●
●●●
●● ●●
● ●
●
●●● ●
●
● ●
●●
●
●
●
●
●
● ● ●●●
● ●
●
●●● ●●
● ●● ●●
●● ●
●●
●
●
●●
●
●
●
●●●●●
●
● ●●
●
●● ●
●
●●
●●
●●●●
●●●
●
●
●
● ●
●●●●
●●●
●●
●●
● ●
●●●
●
●
●●
●
●
●
●
● ●●
● ●
● ●
●●●●●
●
●
●●
●●
●●
●
●
●●
●●●● ●
●
●●
●
●
●
●
● ●● ●
●
●
●
●
●●
●
●● ●
●
●
●
●● ● ●
● ●
●
●
●
●
●
●
●
●
●● ● ●
●●
● ●●
●●
●
●● ●● ●
●
●●
●
●
●
●
● ●●●
●
●
●
●
● ●●
●
●
●● ●
●
●
●
●●
●
●
●
● ●●●
●
●
●
●
●●
●●
●
●
●●
●
● ●
●
●●
●
●
●
●
●
● ●
●● ●●● ●●●●
●●
●● ●
●
● ●●●
●
●
●
●
●
●●
●
●●●
●
●
●
●●
●●
●
●
●●●●●●●●●●
●
●
●●
● ●●●●
●
●
●
●
●
●●●
● ●●
●
●
●●
●
●
●
●●●●
●●●●●●●●●●●●●●●●●●●●●●●●●●●●●●●●●●●●●●●●●●●●●
●●
●●
●
●
●●
●
●●●●●●
●
●●
●
●●●●
●
●●
●
●
●
●
●
●
●●
●●
●
●
●●●
●
●
●
●
●●
●
●
●
●
●
●●
●
●
●
●
●
●
●
●
●
●
●
●
●
●
●●●
●
●
●
●
●
●
●
●
●
●
●
●
●
●
●
●
●
●
●
●
●
●
●
●
●
●
●
●●
●●
●
●
●
●
●
●
●●
●
●
●
●
●
●
●●●
●
●●
●●
●
●
●
●
●●
●
●
●
●
●
●
●
●
●
●
●
●
●
●●●
●
●●
●
●●
●
●
●
●●
●
●●●●●●●●
●
●
●●
●
●
●
●●●●
●
●
●
●
●
●
●●
●
●
●
●
●
●
●
●
●
●
●
●
●
●
●
●
●
●
●
●
●
●●
●
●
●
●
●●●
●
●
●
●
●●
●
●●●●●●●●●●●
●
●●●●●●●●●
●
●
●
●
●
●
●
●●
●
●●
●
●
●
●
●
●
●
●
●
●
●
●
●
●
●
●
●
●
●
●
●
●
●
●●●
●
●
●
●
●●
●
●
●
●
●●
●
●
●●
●
●
●
●
●
●
●
●●
●●
●
●
●
●
●
●●●
●●
●●
●
●
●
●
●
●
●
●●●
●●
●
●
●
●
●●●
●
●
●●
●
●
●
●●●
●
●
●
●
●
●
●
●
●
●
●
●●
●●
●
●
●
●
●
●
●
●●
●
●
●
●●
●●
●
●
●
●
●●
●
●
●●
●●●
●
●
●●●●●
●
●
●
●
●
●
●
●●
●
●
●
●
●
●
●●
●
●
●●
●
●
●●
●
●●
●
●●
●
●
●
●
●
●
●
●
●
●
●
●●
●
●
●
●
●
●●●
●●●
●
●
●●
●●●
●
●
●
●●
●
●●
●
●●
●
●
●●
●●
●●●
●
●
●●●●
●
●
●
●●●
●
●●
●
●
●●●
●
●●
●●
●
●
●
●
●●
●
●
●●
●
●
●
●
●
●
●
●●
●
●●
●●●
●
●●
●●
●●●●
●
●
●●
●●
●●●●●●
●
●
●●●●●●●
●
●
●●
●
●
●
●
●●●●●●●
●
●
●
●
●
●
●●●
●
●
●
●
●
●
●
●
●
●
●
●
●
●
●●●
●
●●
●
●●
●●
●
●
●
●
●
●●
●●●
●●●●●●●●●●●●●●●●●●●●●●●●●●●●●●●●●●●●●●
●
●●●●●●●●●●●●●●●●●
●
●●
●
●
●
●
●
●
●●●
●
●
●
●
●
●●
●
●
●
●●●
●
●●●●●●●●●●●●●●
●
●●●●●●●●●
●
●
●
●
●●●●
●
●●●●●
●●
●
●
●●●
●●
●
●
●
●
●
●
●
●
●
●●
●
●
●
●
●●●●●●●●●●
●
●●●
●
●●●●
●
●
●
●
●
●
●●●●
●
●
●●
●
●
●●
●
●
●
●
●
●●●●●●●●●
●
●●●●●●●
●
●●●●●●●●
●
●●●●●
●
●●●●
●
●●●
●
●
●
●●●●●●●●●●●●
●●
●
●●●●●
●●
●
●
●●
●
●
●
●●●●
●
●
●
●●
●
●
●
●
●●●●
●
●●●●●●●●●
●
●●●●●●●
●
●
●●
●
●
●●
●
●●●●
●
●●
●
●
●
●
●
●
●
●
●
●●●●
●
●
●●
●
●
●●
●●
●
●●
●
●
●
●
●
●
●
●●
●
●●
●
●●
●
●
●
●
●●●
●
●
●
●
●
●
●
●
●
●
●
●●
●●
●
●
●
●
●
●●
●●
●
●●
●
●●●●
●
●●
●
●
●●
●●●
●
●
●●●●
●
●
●●
●
●●
●
●
●
●
●
●●●
●
●
●●
●
●
●
●
●
●
●
●
●
●
●
●
●
●
●
●
●
●
●
●
●
●
●
●
●
●
●
●
●
●
●
●
●
●
●
●
●
●
●
●●
●●●
●
●●●
●
●
●
●
●●●
●
●
●
●
●
●
●●●
●
●
●
●
●●
●
●
●
●
●
●
●
●
●
●
●
●
●●
●
●●
●
●
●
●●
●
●
●
●
●
●
●●
●●
●
●
●
●
●
●
●
●●
●
●●
●
●
●
●
●
●
●
●
●●●●
●●
●
●
●●
●
●
●
●
●
●
●
●
●
●
●
●
●
●
●
●
●
●
●
●●
●
●
●
●
●
●
●
●●●
●
●
●
●
●
●
●●
●
●●●●
●
●●
●
●●●
●
●
●●●●
●
●
●
●
●
●
●●
●
●
●
●
●
●
●●●
●
●
●
●●
●●●
●●
●
●
●●
●
●
●
●●
●●
●
●●
●
●
●
●
●
●
●
●
●
●●
●
●
●●
●
●●●
●
●
●
●●
●
●
●
●
●●●
●
●
●
●
●
●
●
●
●●
●●
●
●
●
●
●
●
●●●
●
●
●●
●
●
●●●●
●
●
●●●
●
●●
●●
●●
●
●
●
●
●●
●●●
●
●
●
●●●●
●
●●●●●●
●
●
●
●
●
●●
●
●
●
●
●●
●
●
●
●●
●
●
●●●
●
●
●
●
●●●●●●
●
●●●●●
●
●●●●●●●●●●●●●●●●●●●●●●●●●●
●
●●●●●●
●
●●
●
●●●●
●
●●●●●●●●●●●●●●●●●
●
●
●●
●
●●●
●●
●●
●
●
●
●
●●●●●
●
●
●
●
●
●
●
●●●●
●
●●●●
●
●●●
●
●
●
●
●
●
●
●
●
●●
●
●
●●
●
●●
●
●
●
●
●●●
●
●
●●●
●●
●
●
●
●
●
●
●
●●
●
●
●
●
●
●
●
●
●
●
●●
●
●
●
●
●
●
●
●
●
●
●
●
●●
●
●
●
●
●
●
●
●
●
●
●
●
●
●
●
●
●
●
●
●
●
●●
●
●●
●
●
●●
●
●
●
●●
●
●
●
●
●
●
●
●
●●
●
●
●
●
●
●
●
●
●
●
●
●
●●
●
●
●
●
●●●
●
●●
●
●●●●
●
●
●
●
●
●
●●●
●
●
●
●
●●●
●●
●
●
●
●
●●●●
●●
●
●
●
●
●
●
●
●
●
●
●●●●●
●
●●
●●
●
●●●
●
●
●
●
●
●
●
●●
●●●
●
●●
●
●
●●
●●
●
●
●
●●
●
●●
●
●
●●●
●
●●●●●●
●●●●●
●●
●●
●
●
●
●●
●
●
●
●
●
●●
●
●
●
●
●●
●●
●
●
●
●
●
●
●
●
●
●●●
●
●
●
●●
●
●
●
●
●
●
●
●
●
●●
●
●
●
●●
●
●
●
●
●
●●
●●
●●
●●
●
●
●
●
●
●
●
●
●●
●
●
●
●●●
●●
●
●
●
●
●
●
●
●
●
●
●
●●
●●
●
●
●
●
●
●
●
●
●
●
●
●●
●
●
●
●
●
●
●
●
●●●
●
●
●
●
●
●
●●●
●
●
●
●
●
●
●
●
●
●●
●●●●
●
●●●
●
●
●
●
●●
●
●
●
●●
●
●●
●
●
●
●
●
●
●
●●●●●●●
●
●●
●●●●
●
●
●
●●●●●
●
●●●●●●●
●
●
●
●
●●●●
●
●
●
●
●
●●●
●●
●
●●
●
●
●●●●
●
●
●
●
●●
●
●
●
●
●
●
●
●
●
●
●
●
●
●
●
●●
●
●
●
●
●
●
●
●●
●
●
●
●●
●●●●●●●●●
●
●
●
●●
●
●●
●
●
●
●●●
●
●
●●●
●●
●●●
●
●
●●
●●●●●●●●
●
●
●
●●
●
●
●
●
●●
●●
●
●
●●●●●●●●
●
●
●
●
●
●
●
●
●●●
●
●
●
●●●
●
●
●
●
●●
●
●●
●
●
●
●
●
●
●●
●
●
●●
●
●
●
●
●
●
●
●
●
●●●
●●
●
●
●●
●
●
●●●●●
●
●●●●
●
●
●
●●●●
●
●
●
●●●●●●●●●●●●●●●
●
●
●●
●●●●
●
●●
●
●
●
●
●
●
●
●
●
●
●
●●●
●●
●
●
●
●
●
●
●●
●●●
●●
●
●
●
●
●
●●
●
●
●
●●●
●
●
●
●
●
●
●
●
●
●
●
●●
●
●
●
●
●●
●
●
●
●●
●
●
●●
●
●
●
●
●
●
●●
●●
●
●
●
●
●
●
●●
●●●●●
●
●●●●
●
●
●
●
●
●
●
●
●
●
●
●●●
●
●
●
●
●●●●●●
●
●
●
●●●
●
●
●
●
●
●
●
●
●
●●
●
●
●
●
●
●
●●●
●
●
●●●●
●
●
●●●●
●
●
●
●
●
●
●●●
●
●
●
●●
●
●
●
●
●●
●●●●
●
●
●
●
●
●
●
●
●
●
●
●
●●●
●
●
●
●
●
●
●
●
●
●
●●
●
●
●
●
●
●
●●
●
●
●●●●
●
●
●
●
●
●
●
●
●●●●●
●
●
●
●
●
●
●
●
●
●●
●
●
●
●●
●
●
●
●
●●
●●●
●●
●
●
●
●●
●
●
●
●●
●
●●●●
●
●
●
●
●●
●
●
●
●●
●●●
●
●
●
●
●
●
●
●
●
●
●
●
●●●
●●
●
●
●
●
●
●
●
●
●
●
●
●
●
●
●●
●
●
●
●●●
●
●
●
●●
●●
●
●
●●●
●
●●
●
●
●
●●
●
●
●
●●
●
●
●
●●
●
●
●
●
●
●●
●
●
●●●●●
●
●
●
●●●●●●
●
●
●
●
●
●
●
●
●
●
●●
●
●
●
●
●
●
●
●
●●●
●
●
●
●
●
●
●
●●●●
●
●
●
●
●●●
●
●
●●
●
●●
●●
●
●
●
●●
●
●
●
●
●
●
●
●
●
●
●●
●
●
●
●
●
●
●●●
●
●
●
●
●
●
●
●●●
●
●●●●●●●●●
●●
●
●
●
●
●
●
●
●
●
●
●
●
●
●
●
●
●
●
●
●
●
●
●
●
●
●
●
●
●
●
●
●
●
●
●
●●●●
●
●
●
●
●
●
●
●●●●●
●●
●
●
●
●
●
●
●
●
●
●
●
●
●●●
●●
●
●
●
●
●●●●●●●●●●
●
●
●
●●
●
●
●
●
●
●
●
●
●
●
●●
●
●
●
●
●
●
●
●●●●●
●●
●
●
●
●
●
●
●●●●
●
●
●
●
●
●
●
●●
●
●●●
●
●●●
●
●●
●●
●●
●
●●●●●●●●
●
●
●●
●●●●●
●●
●
●
●
●●●●
●
●●●●●●●
●●●
●
●
●
●
●
●
●●
●
●
●●●
●
●
●
●
●
●●●●
●
●
●●●
●
●●●●●●●
●
●●
●
●●●●
●
●●●
●
●
●●
●
●
●
●
●
●●
●
●
●●
●●●
●
●
●
●
●●
●
●●
●
●●
●●
●
●
●
●
●
●
●●
●●●
●
●
●
●●●●●●●
●
●
●
●
●
●
●
●
●●
●
●●●●
●●●●
●
●
●
●
●
●●
●●●●
●
●
●
●●
●
●
●●●●●●●
●●
●●
●●●
●
●●
●
●
●
●
●
●
●●●●●
●
●
●●●
●●
●●●●●●●●●
●
●
●
●
●
●
●
●●●●
●
●●●●
●
●
●●
●●●●
●
●
●●
●●
●
●
●
●
●
●
●●●
●
●
●
●●
●
●●
●
●
●
●
●
●
●●●●●●●
●
●
●
●
●
●
●
●
●
●
●
●
●
●●
●
●●●●
●
●
●
●●
●
●
●
●●●
●
●
●
●
●●
●
●
●●
●
●
●
●●●
●
●●
●
●
●●
●●
●
●
●
●
●●
●
●●●
●
●●●●●●
●●
●●
●
●
●
●●
●
●
●
●
●
●
●
●
●
●●
●
●●●
●
●●●
●
●
●
●
●
●●
●●●
●●
●●●●●●
●
●
●
●●●
●
●
●
●
●
●
●●●
●
●●
●
●
●●●●●●●●●●
●●●
●
●
●●●●●●●
●
●●●
●
●
●
●
●●●●●
●
●
●●●●
●●●●
●
●
●●
●
●●●●●●●
●
●
●●●●●
●
●
●
●
●●●●●
●
●
●
●
●
●
●
●
●
●
●
●
●
●
●●
●
●●
●
●
●●
●●
●●
●
●
●
●
●
●
●●
●
●●
●
●
●
●
●
●
●
●
●●
●●●●
●
●
●
●●
●
●
●
●●
●
●
●
●
●
●
●
●
●
●
●
●●
●
●
●
●
●
●
●
●●
●
●
●
●●●●●
●
●
●
●
●
●
●
●
●
●
●
●
●
●●
●
●
●
●
●
●
●
●●
●
●●
●
●
●
●●
●
●
●
●
●
●●
●
●
●
●
●
●
●●●●●●
●
●
●●
●
●
●●●
●
●
●
●
●●
●●
●
●
●●
●
●
●●●
●●
●●●
●
●
●
●
●●
●
●●
●
●
●
●
●
●●
●
●
●
●
●
●
●
●
●
●●●●●
●
●●●
●●
●
●●
●
●
●
●
●
●
●
●
●●
●
●
●
●●●●
●
●
●
●●
●
●●●
●
●
●●
●
●
●
●●
●●
●●
●
●
●
●
●●●
●
●
●
●
●
●●●●
●●
●
●●
●
●
●
●
●
●●
●
●●
●
●●
●
●●
●
●
●●
●
●
●
●
●
●●
●●●●●●
●
●●●●●●●●●●●●
●
●
●
●
●
●
●
●●
●
●
●●
●
●
●
●
●
●
●
●
●●●
●
●●
●
●
●
●
●●●●●
●
●
●
●
●
●
●
●
●
●
●
●
●
●●
●
●
●
●●●
●
●●
●
●
●
●
●
●
●
●
●
●
●
●●
●
●●
●●●
●
●
●
●
●
●●●
●
●●
●
●●●●●●●●●●●●
●
●●
●
●
●
●
●
●
●
●
●
●●
●
●
●
●
●
●
●
●
●●
●
●
●
●
●
●
●●
●
●
●
●●
●●●●
●
●●
●
●
●
●●
●
●
●
●
●●
●
●
●
●
●●
●●
●
●
●
●
●
●
●●
●●
●
●●
●
●
●
●
●●
●
●
●
●
●
●
●
●
●
●●●
●
●●
●
●●●●●●●●●●●●●●●●●●●
●
●●●
●
●
●●
●●
●●●●●
●
●
●●
●●
●
●
●●
●
●●
●●
●
●
●
●●
●
●
●
●
●
●
●●
●●
●
●
●
●
●
●
●
●
●●●
●
●●
●
●●
●
●
●●
●
●●
●
●
●
●
●●
●
●
●●
●●
●
●
●
●
●
●
●
●●
●
●●●●●
●●
●
●●●●●●●●●●●●●●
●
●●
●
●
●●
●●●
●●
●
●●●●
●
●
●●●
●
●
●●●●●●
●●
●●●●
●
●
●●●●●●●
●
●●●
●
●●
●●
●
●
●●
●
●
●●
●
●●
●
●●●
●
●
●●
●●●
●
●●●●
●
●●
●
●
●●
●
●
●●
●
●
●
●
●●
●
●●●●●
●
●
●
●●●
●
●
●
●
●●
●
●●●●●●●●
●
●
●●●●●●●●●
●
●●●
●●
●
●
●
●●
●
●
●
●
●
●
●
●●
●
●
●
●
●
●●
●
●
●
●
●●●
●●●
●
●
●●●●
●
●●●●
●
●●
●
●
●
●
●●●
●●
●●
●
●
●
●
●
●
●
●●
●●
●●●
●
●
●
●
●
●
●
●●●
●
●
●
●
●
●
●
●
●●
●
●●●●
●
●●●
●
●
●●
●
●
●
●
●●
●
●
●
●
●
●
●●
●
●●
●
●●●●
●
●
●
●
●
●
●
●●
●
●
●
●●●
●
●
●
●
●●●
●
●
●
●
●
●
●●
●
●●
●●
●
●
●
●
●●
●
●
●
●●
●●
●
●
●
●
●●
●
●
●●
●
●
●
●
●
●
●
●●●
●
●
●
●
●●
●
●
●
●
●
●
●
●
●●
●
●
●●
●
●●
●
●
●
●
●●
●
●
●
●
●
●
●
●
●
●●
●●
●
●
●
●
●
●
●●
●
●●●
●
●●●
●
●
●
●●
●
●
●●
●●
●
●
●
●
●
●
●
●
●
●●
●
●●
●
●
●
●
●●●
●●
●
●
●●
●
●
●●
●
●
●
●
●
●
●
●●
●
●
●
●●
●
●●
●
●
●●
●●
●●●
●
●
●
●
●●
●●
●
●
●
●●
●
●●
●
●
●
●●●●●●●●
●●●
●●
●
●●
●
●●●●●●●●●●●●
●●
●●●●
●●
●●●●●●●●●●
●●
●
●●●●●●●●●●●●●●
●
●●●●●●●●●●●●●●●●●●●●●●●●
●
●●●●●●●●
●
●
●
●●●●
●
●●●●●●●●●●●●●●
●
●●●●●●●●●●●
●
●●
●
●●●●●
●
●●●●●●●●●●●●●●●●●●●●●●●●●●
●
●
●●
●●●
●
●●
●
●
●
●●●
●
●●●
●
●
●
●
●
●●●●●●●●●
●
●●
●
●●●●
●
●●●●●●●
●
●●●●●●
●
●●
●
●●●
●
●
●
●●●●
●
●●●
●
●
●●●●●
●
●
●
●●●
●
●●●
●●
●●●●●●●
●
●
●
●
●
●●
●
●●●
●●
●●
●
●●
●●●
●
●
●
●
●
●
●
●
●
●
●
●
●
●
●
●
●●
●
●
●
●
●●●
●
●●●●
●
●
●
●
●
●
●●●●●●●●●●●●●●●●●●●●
●●●●●
●●
●●●●●●●●●●●●●●●●●●●
●
●
●
●
●
●
●
●●
●
●
●
●●●●●●●
●
●●
●
●●●●●●●●●●●●●●●●●●●
●
●●
●●
●●●
●
●●●●●●●●●
●
●
●
●●
●
●
●
●●●●●●●
●●
●
●●●
●
●
●
●●●●
●
●●●●●●●
●
●
●
●●
●●●
●
●●
●
●
●●
●
●●
●
●
●
●
●●
●
●
●
●
●
●
●
●
●
●
●
●
●●●●●●●●●●●●●●●●●●●
●
●●●
●
●●
●
●
●
●●
●
●●●●
●●●
●●
●
●●●
●
●
●
●●
●●
●●
●●●
●●●●●
●●
●
●
●
●
●●●
●
●●
●
●●
●
●
●
●
●●
●
●●
●●●
●
●●
●
●●
●●
●
●
●
●
●●
●●
●
●
●●●●●
●
●
●
●
●●●●
●
●
●
●●
●
●●
●
●
●
●
●●●●●●
●
●
●●●●●●
●●
●
●●
●
●
●
●●
●
●
●●
●
●
●●●
●
●
●
●
●
●
●●
●
●
●●
●
●●●●●●●●
●●
●●●●●●●
●
●●
●
●●
●
●●●●●
●
●●●●●●●
●
●
●
●●●●●●●●●●●●
●
●
●●
●●●
●
●●
●
●
●
●
●
●
●
●
●
●
●
●●
●●●●●
●
●●●
●●
●
●●
●●●●
●●●●●●
●●
●
●
●●●
●●
●●●●●●
●●●●
●
●
●
●●
●
●
●●●●●●
●
●●●●●●●●●●●
●
●
●
●
●
●
●
●
●●●●●
●
●
●
●
●
●
●
●
●
●
●●
●
●●●●●●●
●
●
●●
●●●
●
●●
●●●●●●●●●●
●
●●●●●●●●●●●●●
●
●●
●
●●●●●●
●●
●
●
●
●
●●
●
●
●●
●
●
●●
●●
●
●●
●
●
●●
●
●
●
●
●
●
●
●●●●●
●
●●
●
●
●
●
●
●
●
●
●
●●
●●
●
●
●
●●
●●●
●●
●
●●
●
●
●●●●
●
●
●●
●
●
●
●
●●●●●●●●●●●●●●●●●●●●
●●●●
●
●●
●●●
●
●
●●●
●
●
●●
●
●
●●
●
●●●
●●
●●
●
●
●●
●
●
●
●
●
●
●
●
●
●
●
●
●●
●
●
●
●
●
●●
●
●
●
●
●
●●
●
●
●
●
●
●
●●●
●
●
●
●
●
●
●●
●
●
●●●●●●●●
●●
●●●●
●
●
●
●
●
●
●●
●
●●
●
●
●
●
●
●
●
●●●●
●
●●●
●
●
●●
●●●●
●
●
●●
●
●●
●
●●●●●
●
●
●
●
●
●
●●●
●
●
●
●●●
●
●●
●
●
●●
●●●●●●●●●●●●
●●
●
●
●●
●●●
●
●
●
●●
●●
●
●
●
●●●●
●●
●●
●●
●●●●
●
●
●
●●●
●
●
●
●
●
●
●●●●●●●
●●
●
●
●
●
●●
●
●
●●●
●
●
●●
●
●●
●●
●
●
●
●
●
●
●
●
●
●
●
●
●
●●
●
●
●
●●●
●
●
●
●
●
●
●
●
●●
●●
●
●
●
●●
●
●●●
●
●
●
●
●
●●
●●
●
●
●●
●
●
●
●
●
●●
●
●
●
●●●●●●●●
●
●●●
●
●●
●
●
●●
●●
●
●
●
●●●●
●
●●●●●●
●
●
●
●●
●
●
●
●●
●●●●
●●
●
●
●
●●
●
●
●
●
●
●●●●●
●●●●
●
●●
●●●●●●●●●●●
●●
●●
●●●
●
●
●●●
●
●●●●●●●●●●●
●
●
●
●
●
●●●
●
●●●●●
●
●●
●
●●●●●●
●
●
●
●●
●
●
●
●
●
●
●
●●●
●
●
●
●
●
●
●
●●
●
●●●
●
●
●●
●
●
●
●●●
●
●●
●●
●●
●
●
●
●●●
●
●●
●
●
●●
●●
●●●
●
●●
●
●
●●●●●●
●
●
●●●●●●
●
●
●●
●
●●
●
●
●●●
●●
●
●
●●●●
●●●●●●●●●●●●●●●●●
●
●
●
●
●●
●
●
●
●●
●
●
●
●
●
●
●
●
●●●●●●●●●
●
●●●●●
●
●●●●
●
●●●●●●●●
●
●●●●
●
●●●
●
●
●
●
●●
●
●
●●
●
●●●●●●●●●●●●●●●
●
●●
●
●●●●●●●
●
●●●●●
●
●●
●●
●
●
●
●●
●
●
●●●●
●
●
●
●
●●
●
●●●
●
●●
●●●
●
●
●
●
●●●●●●●●●
●
●
●
●
●●
●
●●●
●
●
●●
●●●●
●
●
●
●
●
●●
●●●●
●
●●●
●
● ●●
●●● ●
●
●
●
●
●
●
●
●
●
●●
●●
●
●
● ●
●
●
●●
●
●
●●●
●●
●
● ●●
●
● ●● ●● ●
● ●●
●
●
●
●
●
●●● ●●●● ●● ● ●●● ●●●
●
●●●●●● ● ● ●●● ●● ●●● ● ● ●● ●● ●● ●●●●● ●
●
●
●● ●● ●● ●●● ●●●● ●●
●
●●●
●
●
● ●●
●
●
● ●●●●● ●● ●●
●
●
●
●
●●● ●●● ●●●●●● ●● ●●●●●●● ● ●● ●● ●●● ●●●●●● ●
●
●● ●●●● ●● ●●●● ●●
●
●●● ●●●● ●●● ●●● ●●
●
●
● ● ●● ●
●
●
●●●● ●● ●●●
●
● ●●●
●
●● ●● ●●●●●●●●●●●●●●● ●●● ●●●●● ●●● ●
●
●●●● ● ●●● ●
●
●
●
●
●● ●
●
●
●
●● ● ● ●●●●●●● ●●● ●●●●● ●● ●●●● ●●●●● ●● ● ● ●
●
● ●
●
●
● ●●
●
●
●● ●●●● ● ●●●● ●● ●● ●
●
● ●●
●
●
●
●
●● ●●
●
●
● ●
●
●●
●
●
●
●● ●● ●●
●● ●●
●●
●
●
●
●● ●●
●
●●●● ● ●●●● ●●
●
●● ●
●● ●
●
●●
●
●● ● ●●● ●● ● ●● ● ●
●
●●●●●●●●●● ●● ●●●
0.00
0.25
0.50
0.75
1.00
0.00 0.25 0.50 0.75 1.00Rebuild Cost (Normalized)
# F
ile R
evis
ions
(N
orm
aliz
ed)
h
(c) Qt
●
● ●●●●●●●● ●●
●
●●●●●●●●●●
●
●
●
●
●
●●
●●●●●●●●●●●●●●●●●●●●●●
●
●●●●●● ● ●
●
●●●● ● ●●●●●●
●
●
●
●
●
●● ●
●
●● ●●●
●
●
●
●
● ●●
●
●● ●● ●● ● ●●
●
●
●● ●●0.00
0.25
0.50
0.75
1.00
0.00 0.25 0.50 0.75 1.00Rebuild Cost (Normalized)
# F
ile R
evis
ions
(N
orm
aliz
ed)
h
(d) Ruby
Fig. 5: Quadrant plot of rate of change and rebuild cost. Hotspots are shown in the top-right (red) quadrant. The shaded circles indicate header files, while plus (+) symbolsindicate non-header files. Non-header file hotspots are circled in red.
generator is an example of a “build code robot”, as was identified for GCC by Tu andGodfrey (2001).
Figures 4g and 4h show that the Ruby project has no file that exceeds the 90-second threshold that we selected for header file hotspots. This is likely due to thesize of the system and its build dependency graph, which, as shown in Table 1, has al-most an order of magnitude fewer edges than the next smallest system (PostgreSQL).Although Ruby may be free of 90-second header file hotspots, developers of such asmall system may be accustomed to a very quick rebuild cycle, and may have a lowerthreshold for frustration. In a study of time delay, Fischer et al (2005) find that user
14 Shane McIntosh et al.
satisfaction degrades linearly as delay increases from 0-10 seconds. We, therefore,set the threshold for Ruby hotspots to 10 seconds for the remainder of the paper.Non-header files do not generate enough build activity to be of concern for hot-spot detection. Figure 5 shows the source files that land in each of the four quad-rants. Header files are plotted using shaded circles, while other files are plotted usingplus (+) signs. Files that land on quadrant borders are conservatively mapped to thelower quadrant.
The quadrant plots in Figure 5 show that only two non-header files appear in thehotspot quadrant. The first is a Bison grammar file parse.y in the Ruby system.Changing the grammar file causes both parse.c and parse.h to be regenerated,which in turn triggers several recompilations. The second non-header file hotspotis a Qt file qtdeclarative/tests/auto/shared/util.cpp, which contains thetesting utility code that causes several test binaries to be re-linked. Although eachchange to the test utility implementation triggers a rebuild process of 159 seconds,Figure 4e shows that there are several Qt header files that, when they change, triggerrebuild processes that take hours.
Although some implementation files take a long time to rebuild, the median re-build cost for header files is at least ten times larger than the median rebuild costfor the other types of files. For this reason, while our hotspot detection approachis generic enough to be applied to any source file, the remainder of this paperfocuses on header file hotspots.
6 Case Study 1: Evaluation of the Hotspot Detection Approach
While our quadrant plots can identify header file hotspots, it is not clear whetherbuild optimization effort that is focused on such hotspots would yield a substantiallylarger reduction in future build cost than other hotspot detection approaches. In thissection, we discuss a case study that we have performed in order to evaluate ourhotspot heuristic.
6.1 Approach
In order to evaluate our hotspot heuristic, we compare its decrease in future rebuildcost when prioritizing files for build optimization to the decrease in future rebuildcost when using heuristics based on the following:
Individual rebuild cost — Header files that trigger slow rebuild processes are likelyto be costly.
Rate of change — Header files that are changing frequently are likely to be costly.File fan-in — Prior header file optimization approaches focus on header files that
have the highest file fan-in (Yu et al, 2003, 2005), i.e., number of modules that usethe functionality defined or declared in the header. These approaches implicitlyassume that header files with the highest file fan-in trigger the most build activity.
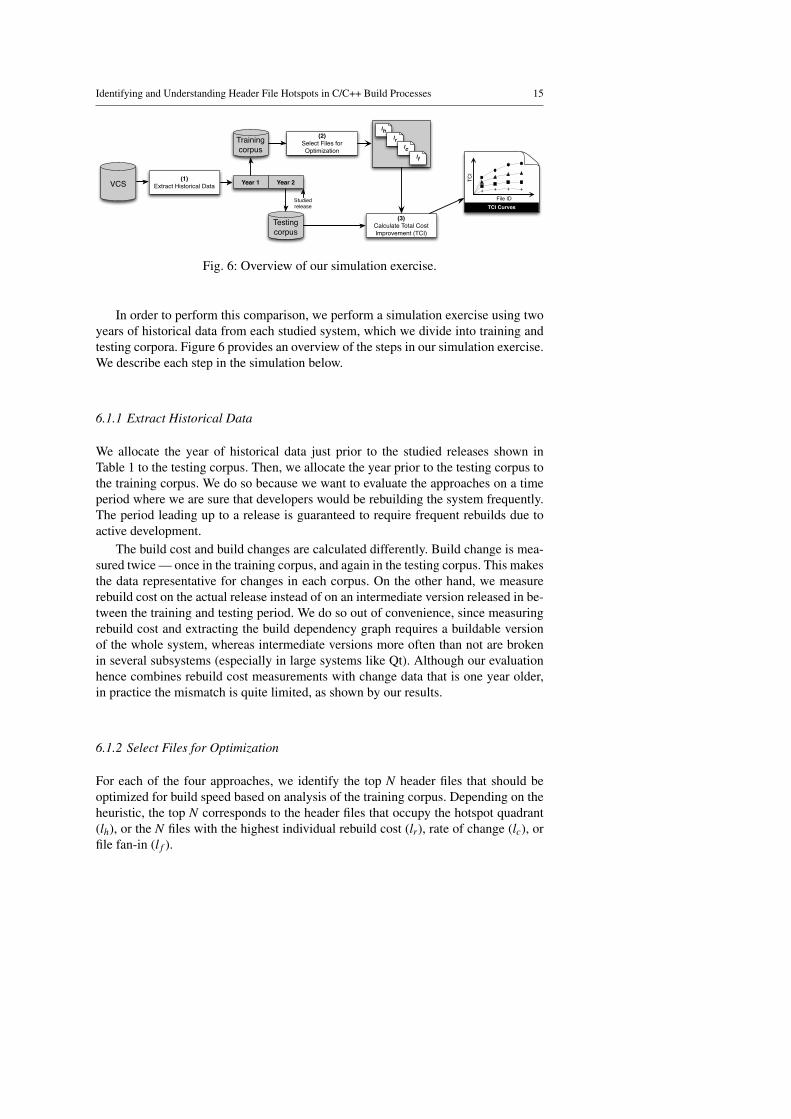
Identifying and Understanding Header File Hotspots in C/C++ Build Processes 15
VCS
Trainingcorpus
Testingcorpus
(2)Select Files for Optimization
(3)Calculate Total Cost Improvement (TCI)
lhlr
lclf
TCI CurvesFile ID
TCI
+ + + +
(1)Extract Historical Data Year 1 Year 2
Studied release
Fig. 6: Overview of our simulation exercise.
In order to perform this comparison, we perform a simulation exercise using twoyears of historical data from each studied system, which we divide into training andtesting corpora. Figure 6 provides an overview of the steps in our simulation exercise.We describe each step in the simulation below.
6.1.1 Extract Historical Data
We allocate the year of historical data just prior to the studied releases shown inTable 1 to the testing corpus. Then, we allocate the year prior to the testing corpus tothe training corpus. We do so because we want to evaluate the approaches on a timeperiod where we are sure that developers would be rebuilding the system frequently.The period leading up to a release is guaranteed to require frequent rebuilds due toactive development.
The build cost and build changes are calculated differently. Build change is mea-sured twice — once in the training corpus, and again in the testing corpus. This makesthe data representative for changes in each corpus. On the other hand, we measurerebuild cost on the actual release instead of on an intermediate version released in be-tween the training and testing period. We do so out of convenience, since measuringrebuild cost and extracting the build dependency graph requires a buildable versionof the whole system, whereas intermediate versions more often than not are brokenin several subsystems (especially in large systems like Qt). Although our evaluationhence combines rebuild cost measurements with change data that is one year older,in practice the mismatch is quite limited, as shown by our results.
6.1.2 Select Files for Optimization
For each of the four approaches, we identify the top N header files that should beoptimized for build speed based on analysis of the training corpus. Depending on theheuristic, the top N corresponds to the header files that occupy the hotspot quadrant(lh), or the N files with the highest individual rebuild cost (lr), rate of change (lc), orfile fan-in (l f ).
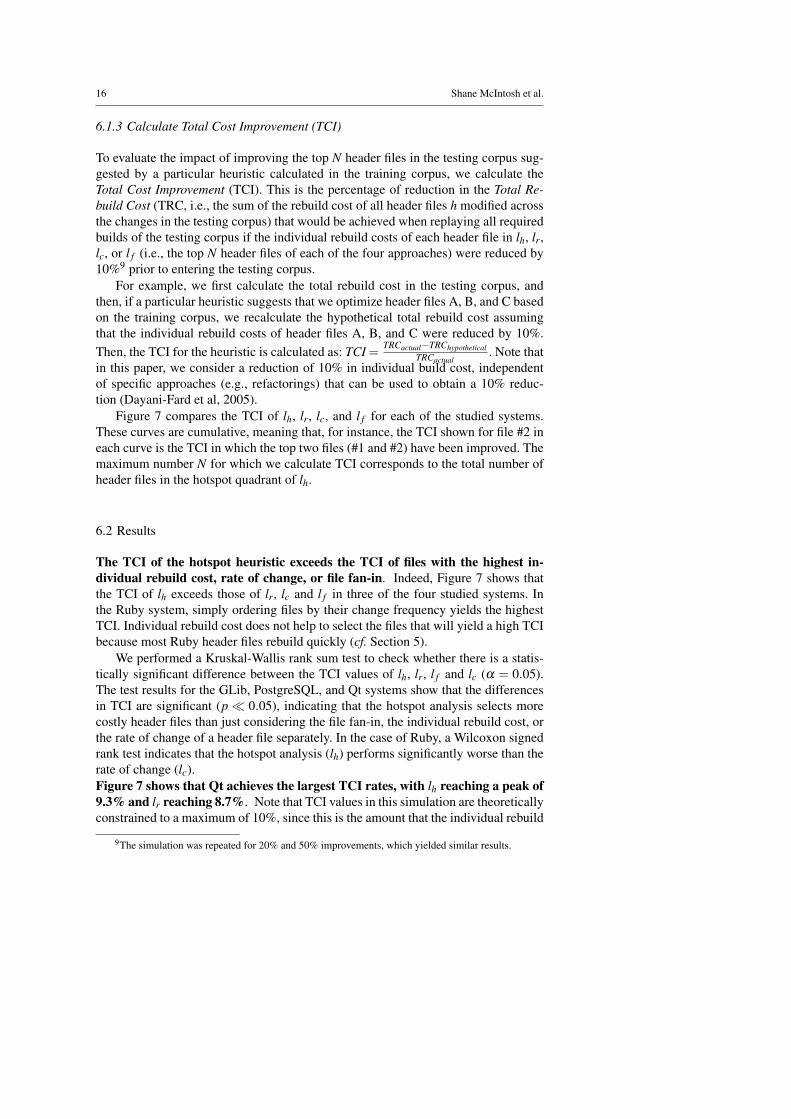
16 Shane McIntosh et al.
6.1.3 Calculate Total Cost Improvement (TCI)
To evaluate the impact of improving the top N header files in the testing corpus sug-gested by a particular heuristic calculated in the training corpus, we calculate theTotal Cost Improvement (TCI). This is the percentage of reduction in the Total Re-build Cost (TRC, i.e., the sum of the rebuild cost of all header files h modified acrossthe changes in the testing corpus) that would be achieved when replaying all requiredbuilds of the testing corpus if the individual rebuild costs of each header file in lh, lr,lc, or l f (i.e., the top N header files of each of the four approaches) were reduced by10%9 prior to entering the testing corpus.
For example, we first calculate the total rebuild cost in the testing corpus, andthen, if a particular heuristic suggests that we optimize header files A, B, and C basedon the training corpus, we recalculate the hypothetical total rebuild cost assumingthat the individual rebuild costs of header files A, B, and C were reduced by 10%.Then, the TCI for the heuristic is calculated as: TCI = TRCactual−TRChypothetical
TRCactual. Note that
in this paper, we consider a reduction of 10% in individual build cost, independentof specific approaches (e.g., refactorings) that can be used to obtain a 10% reduc-tion (Dayani-Fard et al, 2005).
Figure 7 compares the TCI of lh, lr, lc, and l f for each of the studied systems.These curves are cumulative, meaning that, for instance, the TCI shown for file #2 ineach curve is the TCI in which the top two files (#1 and #2) have been improved. Themaximum number N for which we calculate TCI corresponds to the total number ofheader files in the hotspot quadrant of lh.
6.2 Results
The TCI of the hotspot heuristic exceeds the TCI of files with the highest in-dividual rebuild cost, rate of change, or file fan-in. Indeed, Figure 7 shows thatthe TCI of lh exceeds those of lr, lc and l f in three of the four studied systems. Inthe Ruby system, simply ordering files by their change frequency yields the highestTCI. Individual rebuild cost does not help to select the files that will yield a high TCIbecause most Ruby header files rebuild quickly (cf. Section 5).
We performed a Kruskal-Wallis rank sum test to check whether there is a statis-tically significant difference between the TCI values of lh, lr, l f and lc (α = 0.05).The test results for the GLib, PostgreSQL, and Qt systems show that the differencesin TCI are significant (p� 0.05), indicating that the hotspot analysis selects morecostly header files than just considering the file fan-in, the individual rebuild cost, orthe rate of change of a header file separately. In the case of Ruby, a Wilcoxon signedrank test indicates that the hotspot analysis (lh) performs significantly worse than therate of change (lc).Figure 7 shows that Qt achieves the largest TCI rates, with lh reaching a peak of9.3% and lr reaching 8.7%. Note that TCI values in this simulation are theoreticallyconstrained to a maximum of 10%, since this is the amount that the individual rebuild
9The simulation was repeated for 20% and 50% improvements, which yielded similar results.
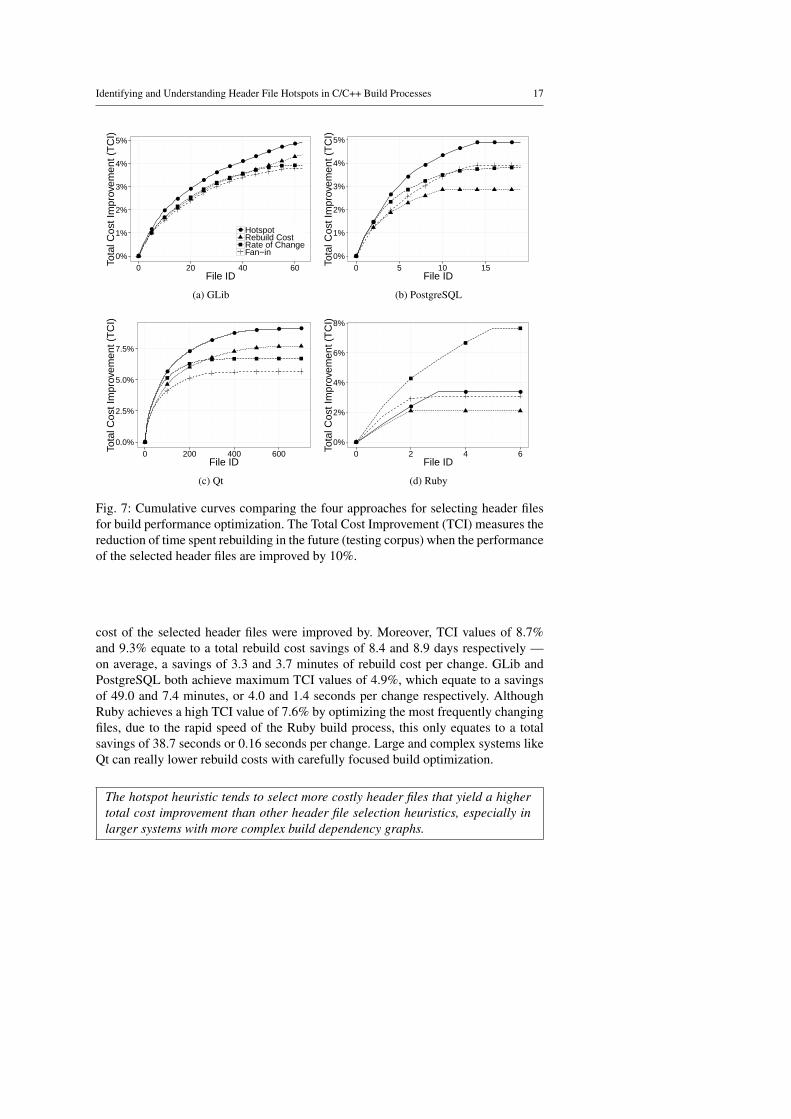
Identifying and Understanding Header File Hotspots in C/C++ Build Processes 17
●
●
●
●
●
●
●
●●
●●
●●
0%
1%
2%
3%
4%
5%
0 20 40 60File ID
Tota
l Cos
t Im
prov
emen
t (T
CI)
● HotspotRebuild CostRate of ChangeFan−in
(a) GLib
●
●
●
●
●
●
●● ● ●
0%
1%
2%
3%
4%
5%
0 5 10 15File ID
Tota
l Cos
t Im
prov
emen
t (T
CI)
(b) PostgreSQL
●
●
●
●
●● ● ●
0.0%
2.5%
5.0%
7.5%
0 200 400 600File ID
Tota
l Cos
t Im
prov
emen
t (T
CI)
(c) Qt
●
●
● ●
0%
2%
4%
6%
8%
0 2 4 6File ID
Tota
l Cos
t Im
prov
emen
t (T
CI)
(d) Ruby
Fig. 7: Cumulative curves comparing the four approaches for selecting header filesfor build performance optimization. The Total Cost Improvement (TCI) measures thereduction of time spent rebuilding in the future (testing corpus) when the performanceof the selected header files are improved by 10%.
cost of the selected header files were improved by. Moreover, TCI values of 8.7%and 9.3% equate to a total rebuild cost savings of 8.4 and 8.9 days respectively —on average, a savings of 3.3 and 3.7 minutes of rebuild cost per change. GLib andPostgreSQL both achieve maximum TCI values of 4.9%, which equate to a savingsof 49.0 and 7.4 minutes, or 4.0 and 1.4 seconds per change respectively. AlthoughRuby achieves a high TCI value of 7.6% by optimizing the most frequently changingfiles, due to the rapid speed of the Ruby build process, this only equates to a totalsavings of 38.7 seconds or 0.16 seconds per change. Large and complex systems likeQt can really lower rebuild costs with carefully focused build optimization.
The hotspot heuristic tends to select more costly header files that yield a highertotal cost improvement than other header file selection heuristics, especially inlarger systems with more complex build dependency graphs.
18 Shane McIntosh et al.
6.3 Discussion
It is important to note that TCI is an under-approximation for the true total rebuildcost for two reasons. First, TCI assumes that each change will only be rebuilt once,when in reality, a build will run several times by the developer making the change,and by the other developers of the system (cf. Section 2). Since the number of timesa build was executed for a particular change is typically not recorded, we assume theminimum case (i.e., just once). Second, TCI assumes that rebuild cost improvementsto header files are independent, i.e., by improving the rebuild cost of a header fileA, we do not improve the rebuild cost of another header file B in our simulation. Inreality, due to overlapping dependencies, this assumption likely will not hold. In bothcases, our reported TCI values correspond to a lower bound of the actual TCI — theactual cost savings will be higher in practice.
7 Case Study 2: Hotspot Characteristic Analysis
To help practitioners avoid creating header file hotspots or find opportunities forrefactoring, we analyze whether header file properties could give concrete indicationsof hotspot likelihood. To do so, we build logistic regression models and measure theeffect that each property has on hotspot likelihood.
When selecting explanatory variables for our models, we discarded change fre-quency, since it is not an actionable factor, i.e., changes that fix defects and add fea-tures cannot be avoided. Instead, build optimization effort must focus on reducing therebuild cost of a header file by either: (1) shrinking the set of triggered edges E ′(s), or(2) reducing the complexity of the header file itself (to reduce its individual compila-tion time). The latter suggests that header file size and complexity metrics should beadded to our models, while the former suggests that we should consider code layout(i.e., architecture) as well.
7.1 Approach
We build logistic regression models to check for a relationship between header fileproperties and hotspot likelihood. A logistic regression model will predict a binaryoutcome variable (whether or not a header file appears in the hotspot quadrant ofFigure 5) based on the values of a given set of explanatory variables.
Table 2 lists the code content and layout properties that we considered, and pro-vides our rationale for selecting them. Each metric is measured using the releasedversions of the studied systems presented in Table 1. Code layout metrics are derivedfrom the pathname of each source file. Directory and file fan-in are calculated basedon code dependency information extracted using the Understand static code analysistool.10 Source lines of code are counted using the SLOCCount tool.11 Number of
10http://www.scitools.com/index.php11http://www.dwheeler.com/sloccount/
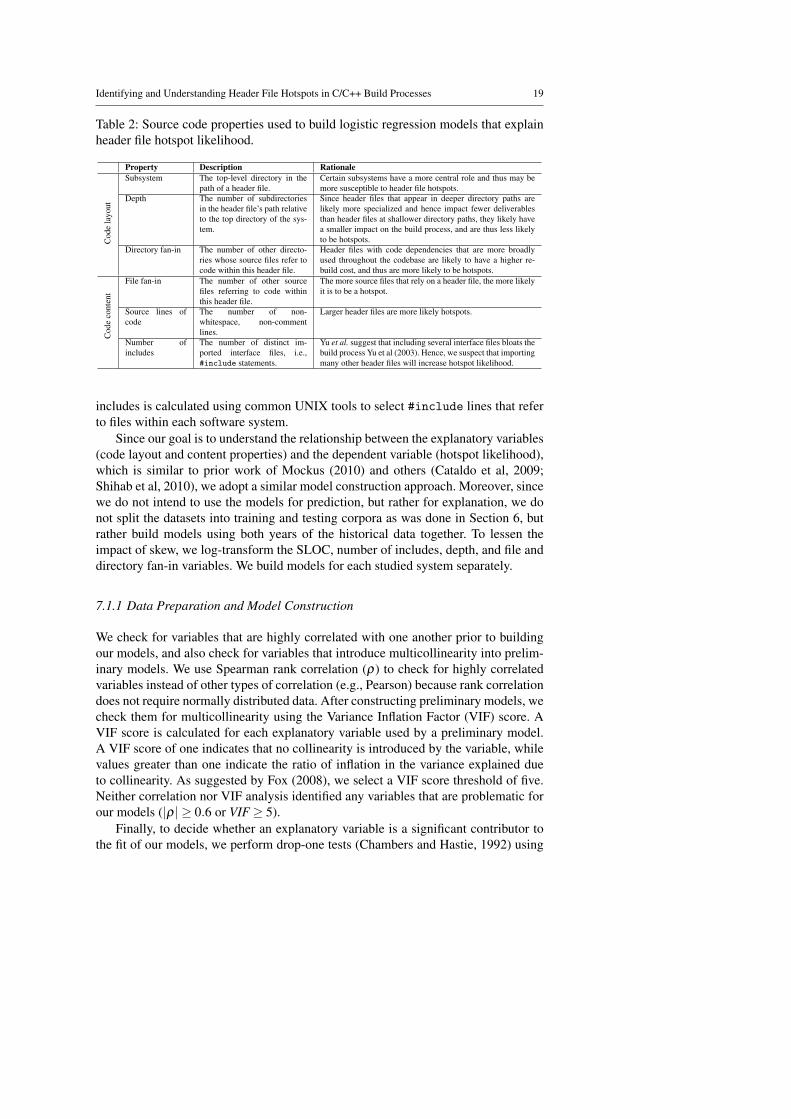
Identifying and Understanding Header File Hotspots in C/C++ Build Processes 19
Table 2: Source code properties used to build logistic regression models that explainheader file hotspot likelihood.
Property Description Rationale
Cod
ela
yout
Subsystem The top-level directory in thepath of a header file.
Certain subsystems have a more central role and thus may bemore susceptible to header file hotspots.
Depth The number of subdirectoriesin the header file’s path relativeto the top directory of the sys-tem.
Since header files that appear in deeper directory paths arelikely more specialized and hence impact fewer deliverablesthan header files at shallower directory paths, they likely havea smaller impact on the build process, and are thus less likelyto be hotspots.
Directory fan-in The number of other directo-ries whose source files refer tocode within this header file.
Header files with code dependencies that are more broadlyused throughout the codebase are likely to have a higher re-build cost, and thus are more likely to be hotspots.
Cod
eco
nten
t
File fan-in The number of other sourcefiles referring to code withinthis header file.
The more source files that rely on a header file, the more likelyit is to be a hotspot.
Source lines ofcode
The number of non-whitespace, non-commentlines.
Larger header files are more likely hotspots.
Number ofincludes
The number of distinct im-ported interface files, i.e.,#include statements.
Yu et al. suggest that including several interface files bloats thebuild process Yu et al (2003). Hence, we suspect that importingmany other header files will increase hotspot likelihood.
includes is calculated using common UNIX tools to select #include lines that referto files within each software system.
Since our goal is to understand the relationship between the explanatory variables(code layout and content properties) and the dependent variable (hotspot likelihood),which is similar to prior work of Mockus (2010) and others (Cataldo et al, 2009;Shihab et al, 2010), we adopt a similar model construction approach. Moreover, sincewe do not intend to use the models for prediction, but rather for explanation, we donot split the datasets into training and testing corpora as was done in Section 6, butrather build models using both years of the historical data together. To lessen theimpact of skew, we log-transform the SLOC, number of includes, depth, and file anddirectory fan-in variables. We build models for each studied system separately.
7.1.1 Data Preparation and Model Construction
We check for variables that are highly correlated with one another prior to buildingour models, and also check for variables that introduce multicollinearity into prelim-inary models. We use Spearman rank correlation (ρ) to check for highly correlatedvariables instead of other types of correlation (e.g., Pearson) because rank correlationdoes not require normally distributed data. After constructing preliminary models, wecheck them for multicollinearity using the Variance Inflation Factor (VIF) score. AVIF score is calculated for each explanatory variable used by a preliminary model.A VIF score of one indicates that no collinearity is introduced by the variable, whilevalues greater than one indicate the ratio of inflation in the variance explained dueto collinearity. As suggested by Fox (2008), we select a VIF score threshold of five.Neither correlation nor VIF analysis identified any variables that are problematic forour models (|ρ| ≥ 0.6 or VIF≥ 5).
Finally, to decide whether an explanatory variable is a significant contributor tothe fit of our models, we perform drop-one tests (Chambers and Hastie, 1992) using
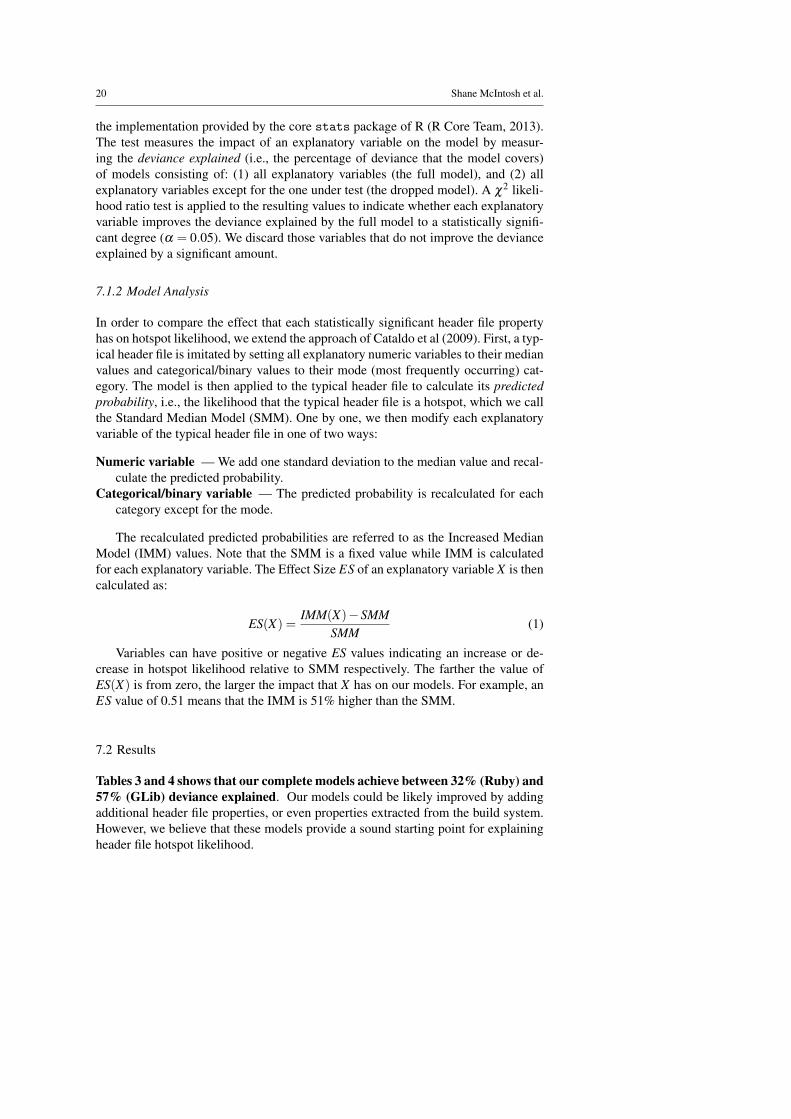
20 Shane McIntosh et al.
the implementation provided by the core stats package of R (R Core Team, 2013).The test measures the impact of an explanatory variable on the model by measur-ing the deviance explained (i.e., the percentage of deviance that the model covers)of models consisting of: (1) all explanatory variables (the full model), and (2) allexplanatory variables except for the one under test (the dropped model). A χ2 likeli-hood ratio test is applied to the resulting values to indicate whether each explanatoryvariable improves the deviance explained by the full model to a statistically signifi-cant degree (α = 0.05). We discard those variables that do not improve the devianceexplained by a significant amount.
7.1.2 Model Analysis
In order to compare the effect that each statistically significant header file propertyhas on hotspot likelihood, we extend the approach of Cataldo et al (2009). First, a typ-ical header file is imitated by setting all explanatory numeric variables to their medianvalues and categorical/binary values to their mode (most frequently occurring) cat-egory. The model is then applied to the typical header file to calculate its predictedprobability, i.e., the likelihood that the typical header file is a hotspot, which we callthe Standard Median Model (SMM). One by one, we then modify each explanatoryvariable of the typical header file in one of two ways:
Numeric variable — We add one standard deviation to the median value and recal-culate the predicted probability.
Categorical/binary variable — The predicted probability is recalculated for eachcategory except for the mode.
The recalculated predicted probabilities are referred to as the Increased MedianModel (IMM) values. Note that the SMM is a fixed value while IMM is calculatedfor each explanatory variable. The Effect Size ES of an explanatory variable X is thencalculated as:
ES(X) =IMM(X)−SMM
SMM(1)
Variables can have positive or negative ES values indicating an increase or de-crease in hotspot likelihood relative to SMM respectively. The farther the value ofES(X) is from zero, the larger the impact that X has on our models. For example, anES value of 0.51 means that the IMM is 51% higher than the SMM.
7.2 Results
Tables 3 and 4 shows that our complete models achieve between 32% (Ruby) and57% (GLib) deviance explained. Our models could be likely improved by addingadditional header file properties, or even properties extracted from the build system.However, we believe that these models provide a sound starting point for explainingheader file hotspot likelihood.
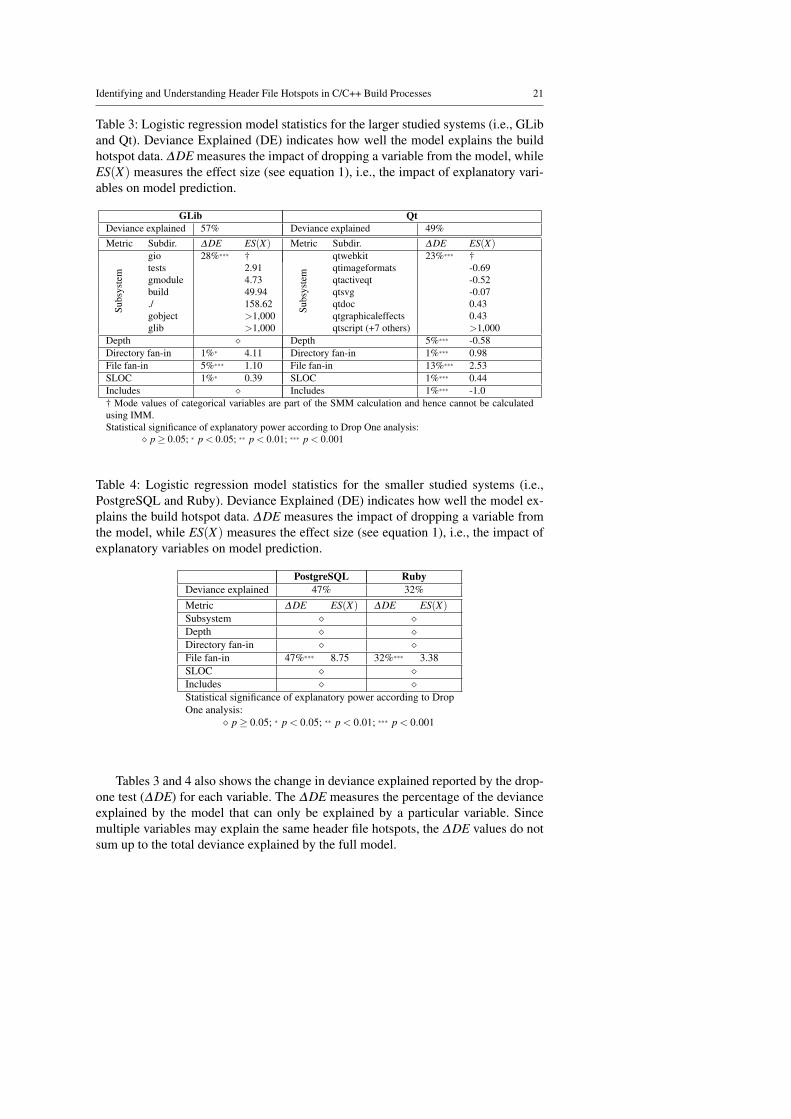
Identifying and Understanding Header File Hotspots in C/C++ Build Processes 21
Table 3: Logistic regression model statistics for the larger studied systems (i.e., GLiband Qt). Deviance Explained (DE) indicates how well the model explains the buildhotspot data. ∆DE measures the impact of dropping a variable from the model, whileES(X) measures the effect size (see equation 1), i.e., the impact of explanatory vari-ables on model prediction.
GLib QtDeviance explained 57% Deviance explained 49%Metric Subdir. ∆DE ES(X) Metric Subdir. ∆DE ES(X)
Subs
yste
m
gio 28%∗∗∗ †
Subs
yste
m
qtwebkit 23%∗∗∗ †tests 2.91 qtimageformats -0.69gmodule 4.73 qtactiveqt -0.52build 49.94 qtsvg -0.07./ 158.62 qtdoc 0.43gobject >1,000 qtgraphicaleffects 0.43glib >1,000 qtscript (+7 others) >1,000
Depth � Depth 5%∗∗∗ -0.58Directory fan-in 1%∗ 4.11 Directory fan-in 1%∗∗∗ 0.98File fan-in 5%∗∗∗ 1.10 File fan-in 13%∗∗∗ 2.53SLOC 1%∗ 0.39 SLOC 1%∗∗∗ 0.44Includes � Includes 1%∗∗∗ -1.0† Mode values of categorical variables are part of the SMM calculation and hence cannot be calculatedusing IMM.Statistical significance of explanatory power according to Drop One analysis:
� p≥ 0.05; ∗ p < 0.05; ∗∗ p < 0.01; ∗∗∗ p < 0.001
Table 4: Logistic regression model statistics for the smaller studied systems (i.e.,PostgreSQL and Ruby). Deviance Explained (DE) indicates how well the model ex-plains the build hotspot data. ∆DE measures the impact of dropping a variable fromthe model, while ES(X) measures the effect size (see equation 1), i.e., the impact ofexplanatory variables on model prediction.
PostgreSQL RubyDeviance explained 47% 32%Metric ∆DE ES(X) ∆DE ES(X)Subsystem � �Depth � �Directory fan-in � �File fan-in 47%∗∗∗ 8.75 32%∗∗∗ 3.38SLOC � �Includes � �Statistical significance of explanatory power according to DropOne analysis:
� p≥ 0.05; ∗ p < 0.05; ∗∗ p < 0.01; ∗∗∗ p < 0.001
Tables 3 and 4 also shows the change in deviance explained reported by the drop-one test (∆DE) for each variable. The ∆DE measures the percentage of the devianceexplained by the model that can only be explained by a particular variable. Sincemultiple variables may explain the same header file hotspots, the ∆DE values do notsum up to the total deviance explained by the full model.
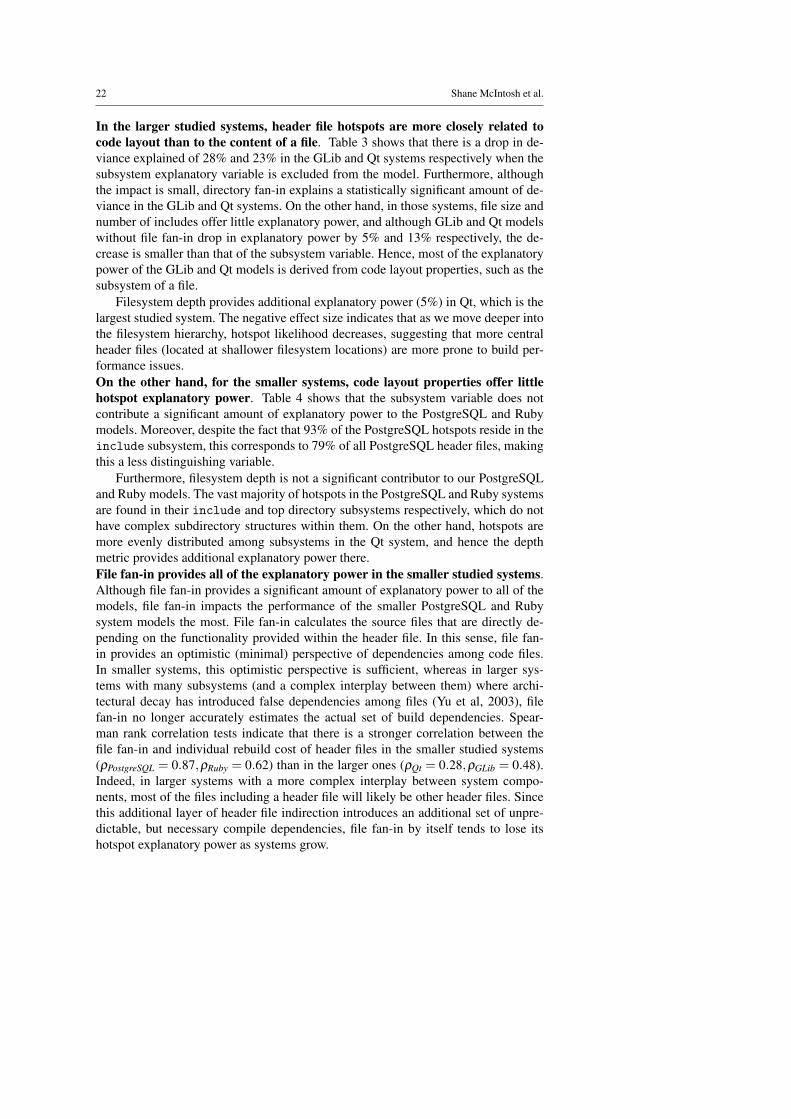
22 Shane McIntosh et al.
In the larger studied systems, header file hotspots are more closely related tocode layout than to the content of a file. Table 3 shows that there is a drop in de-viance explained of 28% and 23% in the GLib and Qt systems respectively when thesubsystem explanatory variable is excluded from the model. Furthermore, althoughthe impact is small, directory fan-in explains a statistically significant amount of de-viance in the GLib and Qt systems. On the other hand, in those systems, file size andnumber of includes offer little explanatory power, and although GLib and Qt modelswithout file fan-in drop in explanatory power by 5% and 13% respectively, the de-crease is smaller than that of the subsystem variable. Hence, most of the explanatorypower of the GLib and Qt models is derived from code layout properties, such as thesubsystem of a file.
Filesystem depth provides additional explanatory power (5%) in Qt, which is thelargest studied system. The negative effect size indicates that as we move deeper intothe filesystem hierarchy, hotspot likelihood decreases, suggesting that more centralheader files (located at shallower filesystem locations) are more prone to build per-formance issues.On the other hand, for the smaller systems, code layout properties offer littlehotspot explanatory power. Table 4 shows that the subsystem variable does notcontribute a significant amount of explanatory power to the PostgreSQL and Rubymodels. Moreover, despite the fact that 93% of the PostgreSQL hotspots reside in theinclude subsystem, this corresponds to 79% of all PostgreSQL header files, makingthis a less distinguishing variable.
Furthermore, filesystem depth is not a significant contributor to our PostgreSQLand Ruby models. The vast majority of hotspots in the PostgreSQL and Ruby systemsare found in their include and top directory subsystems respectively, which do nothave complex subdirectory structures within them. On the other hand, hotspots aremore evenly distributed among subsystems in the Qt system, and hence the depthmetric provides additional explanatory power there.File fan-in provides all of the explanatory power in the smaller studied systems.Although file fan-in provides a significant amount of explanatory power to all of themodels, file fan-in impacts the performance of the smaller PostgreSQL and Rubysystem models the most. File fan-in calculates the source files that are directly de-pending on the functionality provided within the header file. In this sense, file fan-in provides an optimistic (minimal) perspective of dependencies among code files.In smaller systems, this optimistic perspective is sufficient, whereas in larger sys-tems with many subsystems (and a complex interplay between them) where archi-tectural decay has introduced false dependencies among files (Yu et al, 2003), filefan-in no longer accurately estimates the actual set of build dependencies. Spear-man rank correlation tests indicate that there is a stronger correlation between thefile fan-in and individual rebuild cost of header files in the smaller studied systems(ρPostgreSQL = 0.87,ρRuby = 0.62) than in the larger ones (ρQt = 0.28,ρGLib = 0.48).Indeed, in larger systems with a more complex interplay between system compo-nents, most of the files including a header file will likely be other header files. Sincethis additional layer of header file indirection introduces an additional set of unpre-dictable, but necessary compile dependencies, file fan-in by itself tends to lose itshotspot explanatory power as systems grow.
Identifying and Understanding Header File Hotspots in C/C++ Build Processes 23
Yet, even in the smaller PostgreSQL and Ruby systems where file fan-in providesall of the explanatory power, it does not provide a highly accurate estimate of hotspotlikelihood. The reason for this discrepancy is twofold. First, while file fan-in providesan optimistic estimate of the compile commands that would be required should theheader file change, it can offer little information about the link commands that wouldbe required. For example, two header files with an identical amount of file fan-in maytrigger very different amounts of link activity, which would greatly impact the rebuildcost of the header files. Second, being a metric that is calculated based at the codelevel, file fan-in cannot estimate how frequently a header file will change.
Our models explain 32%-57% of identified hotspots. Architectural properties of-fer much of the explanatory power in the larger systems, suggesting that as sys-tems grow, header file hotspots have more to do with code layout than with codecontent properties like file fan-in.
7.3 Discussion
The explanatory power of the code layout metrics indicates that there are areas of thelarger studied systems that are especially susceptible to header file hotspots (Table 3).Although our regression models seem to suggest that one should simply redistributeheader files from subsystems with high hotspot likelihood to the subsystems withlower hotspot likelihood, such a course of action is impractical. Instead, our resultsshould be interpreted as pinpointing the problematic subsystems that would benefitmost from architectural refinement, such as a focused refactoring impetus. For exam-ple, one could identify the three most hotspot-prone subsystems, and split them intomultiple components, or apply the build refactorings of Yu et al (2003, 2005) or Mor-genthaler et al (2012). Moreover, the impact that code metrics have on our regressionmodels suggests that optimization of the header files in the hotspot-prone subsystemswill yield better results if the focus of such optimization is on the reduction of filefan-in, rather than of header file size or the number of includes.
8 Limitations and Threats to Validity
In this section, we discuss the limitations and the threats to the validity of our study.
8.1 Limitations
Our approach focuses on the detection and prioritization of header file hotspots, butdoes not suggest automatic hotspot refactorings. In this respect, our approach is sim-ilar to defect prediction, which is used to focus quality assurance effort on the mostdefect-prone modules. Furthermore, automatically proposing fixes for hotspots re-quires domain-specific expertise. For example, an automatically generated build de-pendency graph refactoring may fix hotspots in theory, but in practice may require an
24 Shane McIntosh et al.
infeasibly complex restructuring of the system, reducing other desirable properties ofa software system like understandability and maintainability. Further work is neededto find a balance between these forces.
An experienced developer may have an intuition about which header files arehotspots, but such a view would be coloured by his or her individual perspective.Moreover, our hotspot detection approach provides automated support to ground de-velopers’ intuition with data and through routine (re)application of our approach, adevelopment team can monitor improvement or deterioration of hotspots over time.
8.2 Construct Validity
Since build systems evolve (Adams et al, 2008; McIntosh et al, 2012), the BDG itselfwill change as a software system ages, which may cause the rebuild cost of each file tofluctuate. For the sake of simplicity, our simulation experiment in Section 6 projects aconstant build cost for each change. Nonetheless, our technique is lightweight enoughto recalculate rebuild costs after each change to the build system.
8.3 Internal Validity
Since one can only execute a build system for a concrete configuration, we onlystudy a single configuration for each studied system. Unfortunately, once a targetconfiguration is selected, areas of the code that are not related to the selected softwarefeatures will not be exercised by the build process. For example, since we focus on theLinux environment, Windows-specific code will be omitted during the build process.A static analysis of build specifications, such as that of Tamrawi et al (2012) couldbe used to derive BDGs (and could easily be plugged into our approach), howeverappropriate edge weights need to be defined and calculated for them.
The header file hotspot heuristic assumes that header files that have a high rebuildcost only become build performance problems when they change frequently. Poorbuild performance in infrequently changing header files still poses a lingering threatto build performance. However, the approach allows practitioners to configure thehotspot quadrant thresholds to match their build performance requirements.
8.4 External Validity
We focus our case study on four open source systems, which threatens the gener-alizability of our case study results. However, we studied a variety of systems withdifferent sizes and domain to combat potential bias.
The build systems of the studied systems rely on make specifications, which maybias our case study results towards such technologies. However, our approach is ag-nostic of the underlying build system, operating on a build dependency graph, whichcan be extracted from any build system. Furthermore, our study focuses on headerfile hotspots, which are a property of C/C++ systems for which make-based buildsystems are the de facto standard (McIntosh et al, 2015).
Identifying and Understanding Header File Hotspots in C/C++ Build Processes 25
The thresholds that we selected for the quadrant plots threaten the reliabilityof our case study results. Use of different thresholds will produce different quad-rants, and thus, different header file hotspots. However, we believe that our selectedelapsed time thresholds are representative, since the values were derived from the lit-erature (Fischer et al, 2005; Humble and Farley, 2010). Moreover, we use the medianfor the rate of change threshold — a metric that is resilient to outliers.
9 Related Work
Developers rely on the maintainability, correctness, and speed of the build system.We discuss the related work with respect to these dimensions below.
9.1 Maintainability
Prior work shows that keeping the build system in sync with the source code gen-erates substantial project maintenance overhead. Kumfert and Epperly (2002) andHochstein and Jiao (2011) find that there is a “hidden overhead” associated withmaintaining build systems. In our prior work, we show that build systems tend toco-evolve with source code from release to release (Adams et al, 2008; McIntoshet al, 2012). We have also shown that build system evolution imposes a non-trivialoverhead on software development (McIntosh et al, 2011), e.g., up to 27% of sourcecode changes require accompanying build changes. In this work, we study build per-formance, which is another tangible form of build system overhead on software de-velopment.
9.2 Correctness
Neglecting build maintenance when it is necessary can generate lingering inconsis-tencies in the build process. Nadi et al (2013) find that Linux kernel variability anoma-lies, i.e., inconsistencies between source code, configuration, and build specificationsare rarely caused by trivial, typo-related issues, but more often caused by incom-plete changes, e.g., changes to configuration files that are not properly reflected inthe source code. Furthermore, these variability anomalies tend to linger for six Linuxreleases before getting fixed. Neitsch et al (2012) find that abstractions and conceptstend to leak between source code and build system. Complementing their work, wefind that architectural decay lowers the explanatory power that code properties pro-vide to models built to explain hotspot likelihood.
Prior research has proposed several tools to assist developers in maintaining cor-rectness in the build system. Adams et al (2007) develop the MAKAO tool to vi-sualize and reason about build dependencies. Tamrawi et al (2012) propose a tech-nique for visualizing and verifying build dependencies using symbolic dependencygraphs. Al-Kofahi et al (2012) extract the semantics of build specification changesusing MkDiff. Nadi and Holt (2011, 2012) develop a technique for reporting anoma-lies between source code and build system as likely defects in Linux. We propose an
26 Shane McIntosh et al.
automatable approach that establishes the basis for a tool capable of detecting headerfile hotspots.
When the build system fails, it causes build breakage, which can slow devel-opment progress. Hassan and Zhang (2006) use decision trees to predict whether abuild will pass a lengthy (occasionally day-long) build certification process. Wolfet al (2009) use social network analysis to show that team communication can pre-dict broken builds. Kwan et al (2011) show that socio-technical congruence, i.e., theagreement between technical dependencies and social alignment of a software teamcan also predict broken builds. Van der Storm (2008) uses a backtracking algorithmto prevent continuous integration builds from impacting developers. Similar to our re-build cost metric, van der Storm (2007) defines a build penalty metric to measure thecost of interface changes in component-based software systems. While these studiesfocus on troublesome broken builds that cost developers time, our approach narrowsbuild optimization focus to frequently changing header files that trigger slow rebuildprocesses.
9.3 Speed
Prior work also examines how build processes can be accelerated. Adams et al (1994)achieve up to 80% improvement in build performance through intelligent recompi-lation algorithms and elimination of unused environment symbols. Yu et al improveboth incremental and full build speed by automatically removing unnecessary depen-dencies between files (Yu et al, 2005) and redundant code from C header files (Yuet al, 2003). Dayani-Fard et al (2005) semi-automatically propose architectural refac-torings that will improve build performance. Our work complements the prior studiesby narrowing optimization focus to the most costly header file hotspots that can betargeted individually, rather than all at once.
Recent work has also explored the applicability of refactoring techniques to buildspecifications themselves. For example, Vakilian et al (2015) devise a technique todetect and refactor underutilized targets, i.e., build targets that are only partially usedby the targets that depend upon them. Underutilized targets may trigger updates tothose targets that depend upon them, even if those updates are not strictly neces-sary. By dividing underutilized targets into smaller, independent ones, Vakilian et al(2015) are able to improve build perofrmance. We believe that our approach is com-plementary to the approach of Vakilian et al (2015) in two ways: (1) our techniqueincludes the change frequency dimension, which could be used to reduce the scopeof the target refactoring to those targets that really make a difference in day-to-daydevelopment, and (2) applying the notion of decomposing underutilized targets tohotspot files may be an interesting way to address build hotspots. Furthermore, whilethe approach of Vakilian et al (2015) focuses on refactoring build specifications, ourtechnique focuses on files, components, and subsystems that would benefit from buildoptimization effort.
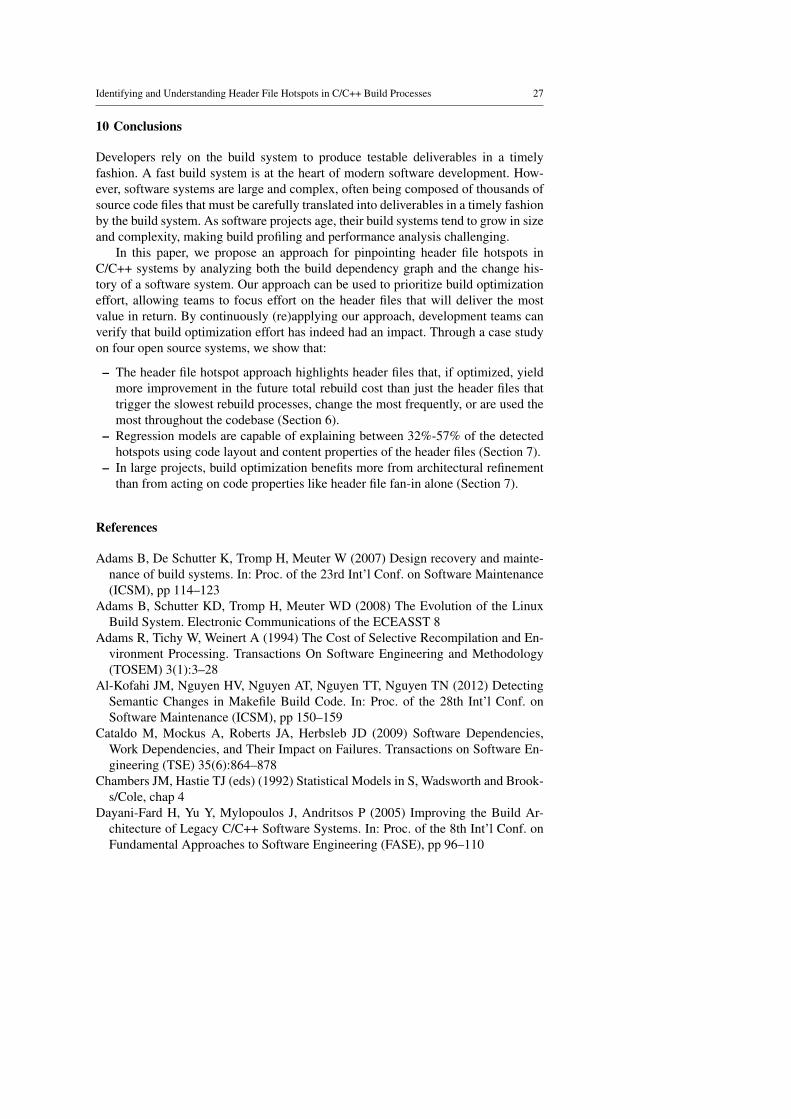
Identifying and Understanding Header File Hotspots in C/C++ Build Processes 27
10 Conclusions
Developers rely on the build system to produce testable deliverables in a timelyfashion. A fast build system is at the heart of modern software development. How-ever, software systems are large and complex, often being composed of thousands ofsource code files that must be carefully translated into deliverables in a timely fashionby the build system. As software projects age, their build systems tend to grow in sizeand complexity, making build profiling and performance analysis challenging.
In this paper, we propose an approach for pinpointing header file hotspots inC/C++ systems by analyzing both the build dependency graph and the change his-tory of a software system. Our approach can be used to prioritize build optimizationeffort, allowing teams to focus effort on the header files that will deliver the mostvalue in return. By continuously (re)applying our approach, development teams canverify that build optimization effort has indeed had an impact. Through a case studyon four open source systems, we show that:
– The header file hotspot approach highlights header files that, if optimized, yieldmore improvement in the future total rebuild cost than just the header files thattrigger the slowest rebuild processes, change the most frequently, or are used themost throughout the codebase (Section 6).
– Regression models are capable of explaining between 32%-57% of the detectedhotspots using code layout and content properties of the header files (Section 7).
– In large projects, build optimization benefits more from architectural refinementthan from acting on code properties like header file fan-in alone (Section 7).
References
Adams B, De Schutter K, Tromp H, Meuter W (2007) Design recovery and mainte-nance of build systems. In: Proc. of the 23rd Int’l Conf. on Software Maintenance(ICSM), pp 114–123
Adams B, Schutter KD, Tromp H, Meuter WD (2008) The Evolution of the LinuxBuild System. Electronic Communications of the ECEASST 8
Adams R, Tichy W, Weinert A (1994) The Cost of Selective Recompilation and En-vironment Processing. Transactions On Software Engineering and Methodology(TOSEM) 3(1):3–28
Al-Kofahi JM, Nguyen HV, Nguyen AT, Nguyen TT, Nguyen TN (2012) DetectingSemantic Changes in Makefile Build Code. In: Proc. of the 28th Int’l Conf. onSoftware Maintenance (ICSM), pp 150–159
Cataldo M, Mockus A, Roberts JA, Herbsleb JD (2009) Software Dependencies,Work Dependencies, and Their Impact on Failures. Transactions on Software En-gineering (TSE) 35(6):864–878
Chambers JM, Hastie TJ (eds) (1992) Statistical Models in S, Wadsworth and Brook-s/Cole, chap 4
Dayani-Fard H, Yu Y, Mylopoulos J, Andritsos P (2005) Improving the Build Ar-chitecture of Legacy C/C++ Software Systems. In: Proc. of the 8th Int’l Conf. onFundamental Approaches to Software Engineering (FASE), pp 96–110
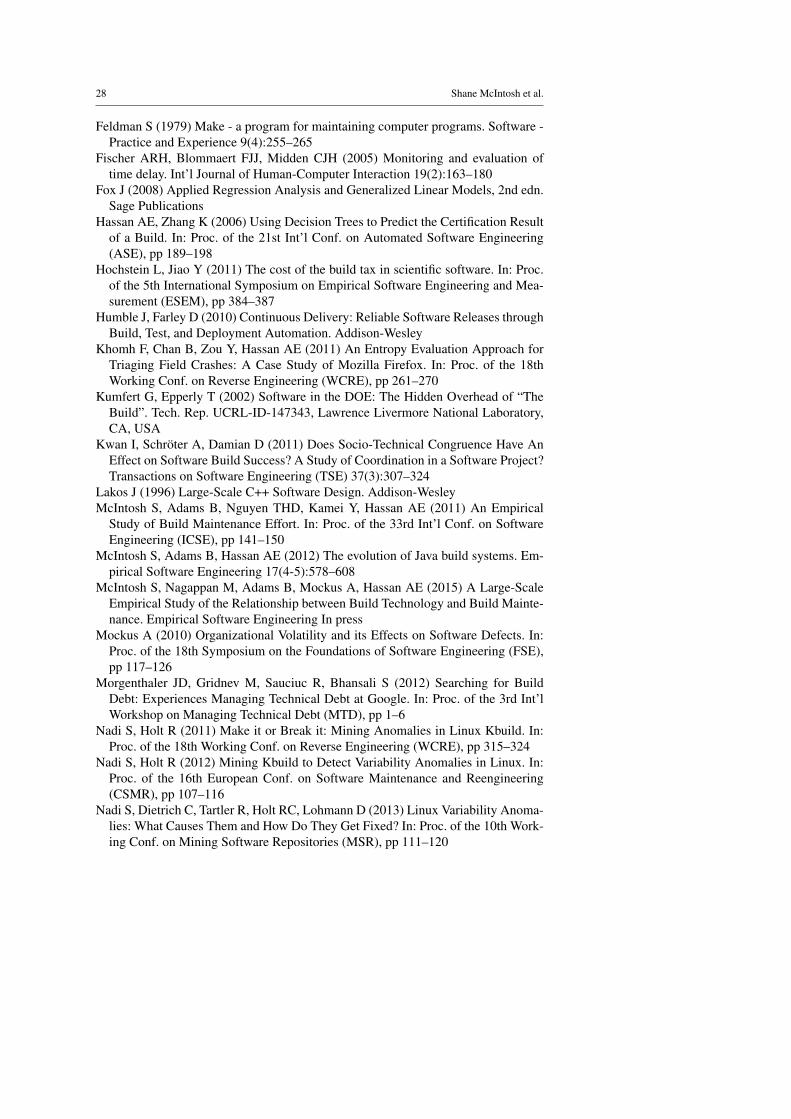
28 Shane McIntosh et al.
Feldman S (1979) Make - a program for maintaining computer programs. Software -Practice and Experience 9(4):255–265
Fischer ARH, Blommaert FJJ, Midden CJH (2005) Monitoring and evaluation oftime delay. Int’l Journal of Human-Computer Interaction 19(2):163–180
Fox J (2008) Applied Regression Analysis and Generalized Linear Models, 2nd edn.Sage Publications
Hassan AE, Zhang K (2006) Using Decision Trees to Predict the Certification Resultof a Build. In: Proc. of the 21st Int’l Conf. on Automated Software Engineering(ASE), pp 189–198
Hochstein L, Jiao Y (2011) The cost of the build tax in scientific software. In: Proc.of the 5th International Symposium on Empirical Software Engineering and Mea-surement (ESEM), pp 384–387
Humble J, Farley D (2010) Continuous Delivery: Reliable Software Releases throughBuild, Test, and Deployment Automation. Addison-Wesley
Khomh F, Chan B, Zou Y, Hassan AE (2011) An Entropy Evaluation Approach forTriaging Field Crashes: A Case Study of Mozilla Firefox. In: Proc. of the 18thWorking Conf. on Reverse Engineering (WCRE), pp 261–270
Kumfert G, Epperly T (2002) Software in the DOE: The Hidden Overhead of “TheBuild”. Tech. Rep. UCRL-ID-147343, Lawrence Livermore National Laboratory,CA, USA
Kwan I, Schroter A, Damian D (2011) Does Socio-Technical Congruence Have AnEffect on Software Build Success? A Study of Coordination in a Software Project?Transactions on Software Engineering (TSE) 37(3):307–324
Lakos J (1996) Large-Scale C++ Software Design. Addison-WesleyMcIntosh S, Adams B, Nguyen THD, Kamei Y, Hassan AE (2011) An Empirical
Study of Build Maintenance Effort. In: Proc. of the 33rd Int’l Conf. on SoftwareEngineering (ICSE), pp 141–150
McIntosh S, Adams B, Hassan AE (2012) The evolution of Java build systems. Em-pirical Software Engineering 17(4-5):578–608
McIntosh S, Nagappan M, Adams B, Mockus A, Hassan AE (2015) A Large-ScaleEmpirical Study of the Relationship between Build Technology and Build Mainte-nance. Empirical Software Engineering In press
Mockus A (2010) Organizational Volatility and its Effects on Software Defects. In:Proc. of the 18th Symposium on the Foundations of Software Engineering (FSE),pp 117–126
Morgenthaler JD, Gridnev M, Sauciuc R, Bhansali S (2012) Searching for BuildDebt: Experiences Managing Technical Debt at Google. In: Proc. of the 3rd Int’lWorkshop on Managing Technical Debt (MTD), pp 1–6
Nadi S, Holt R (2011) Make it or Break it: Mining Anomalies in Linux Kbuild. In:Proc. of the 18th Working Conf. on Reverse Engineering (WCRE), pp 315–324
Nadi S, Holt R (2012) Mining Kbuild to Detect Variability Anomalies in Linux. In:Proc. of the 16th European Conf. on Software Maintenance and Reengineering(CSMR), pp 107–116
Nadi S, Dietrich C, Tartler R, Holt RC, Lohmann D (2013) Linux Variability Anoma-lies: What Causes Them and How Do They Get Fixed? In: Proc. of the 10th Work-ing Conf. on Mining Software Repositories (MSR), pp 111–120
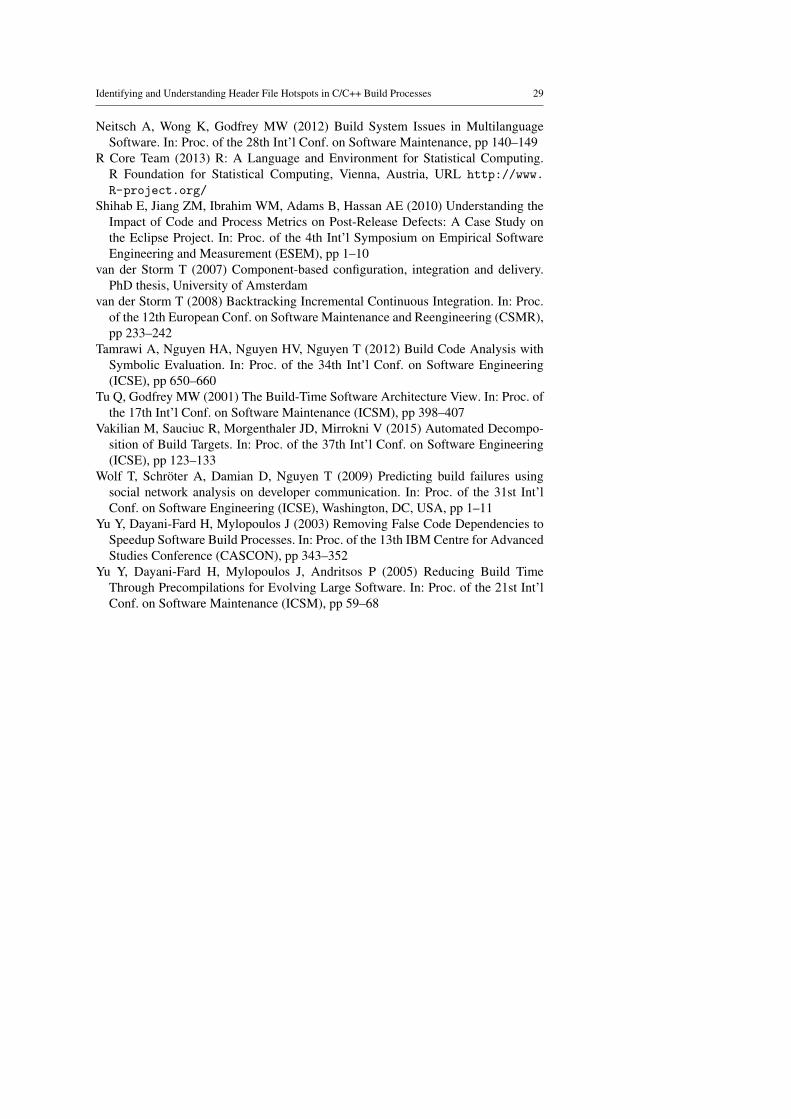
Identifying and Understanding Header File Hotspots in C/C++ Build Processes 29
Neitsch A, Wong K, Godfrey MW (2012) Build System Issues in MultilanguageSoftware. In: Proc. of the 28th Int’l Conf. on Software Maintenance, pp 140–149
R Core Team (2013) R: A Language and Environment for Statistical Computing.R Foundation for Statistical Computing, Vienna, Austria, URL http://www.
R-project.org/
Shihab E, Jiang ZM, Ibrahim WM, Adams B, Hassan AE (2010) Understanding theImpact of Code and Process Metrics on Post-Release Defects: A Case Study onthe Eclipse Project. In: Proc. of the 4th Int’l Symposium on Empirical SoftwareEngineering and Measurement (ESEM), pp 1–10
van der Storm T (2007) Component-based configuration, integration and delivery.PhD thesis, University of Amsterdam
van der Storm T (2008) Backtracking Incremental Continuous Integration. In: Proc.of the 12th European Conf. on Software Maintenance and Reengineering (CSMR),pp 233–242
Tamrawi A, Nguyen HA, Nguyen HV, Nguyen T (2012) Build Code Analysis withSymbolic Evaluation. In: Proc. of the 34th Int’l Conf. on Software Engineering(ICSE), pp 650–660
Tu Q, Godfrey MW (2001) The Build-Time Software Architecture View. In: Proc. ofthe 17th Int’l Conf. on Software Maintenance (ICSM), pp 398–407
Vakilian M, Sauciuc R, Morgenthaler JD, Mirrokni V (2015) Automated Decompo-sition of Build Targets. In: Proc. of the 37th Int’l Conf. on Software Engineering(ICSE), pp 123–133
Wolf T, Schroter A, Damian D, Nguyen T (2009) Predicting build failures usingsocial network analysis on developer communication. In: Proc. of the 31st Int’lConf. on Software Engineering (ICSE), Washington, DC, USA, pp 1–11
Yu Y, Dayani-Fard H, Mylopoulos J (2003) Removing False Code Dependencies toSpeedup Software Build Processes. In: Proc. of the 13th IBM Centre for AdvancedStudies Conference (CASCON), pp 343–352
Yu Y, Dayani-Fard H, Mylopoulos J, Andritsos P (2005) Reducing Build TimeThrough Precompilations for Evolving Large Software. In: Proc. of the 21st Int’lConf. on Software Maintenance (ICSM), pp 59–68