Embed Size (px)
Citation preview

The findings and conclusions in this report are those of the author(s) and do not necessarily represent the views of the National Institute for Occupational Safety and Health.
Kyla Retzer, MPHNational Institute for Occupational Safety and Health
Identifying and Preventing Oil and Gas Fatalities in Wyoming and US
Cheyenne, WY 2017Wyoming Workforce Safety Summit

• Part of the Centers for Disease Control & Prevention (CDC)
• Research-focused
• Created an Oil and Gas Sector Program in 2007 (Epi/Surveillance, Exposure Assessment, Engineering Controls, Communications)
National Institute for Occupational Safety & Health (NIOSH)

The Oil and Gas Industry

The Oil and Gas Industry
32% of total workers
15% of total workers
53% of total workers
Source: BLS/CFOI and BLS/QCEW. All rates calculated per 100,000 workers.

The Oil and Gas Industry
32% of total workersFatality Rate=22.9 per 100,000 workers
15% of total workersFatality Rate=4.1
Source: BLS/CFOI and BLS/QCEW. All rates calculated per 100,000 workers.
53% of total workersFatality Rate=4.2

The Oil and Gas Industry
32% of total workersFatality Rate=22.9Per 100,000 workers
15% of total workersFatality Rate=4.1
53% of total workersFatality Rate=4.2
Source: BLS/CFOI and BLS/QCEW. All rates calculated per 100,000 workers.

85
98 98
125 122
120
68
107
112
142
112
144
89
0
25
50
75
100
125
150
0.0
5.0
10.0
15.0
20.0
25.0
30.0
35.0
Num
ber o
f Dea
ths
Deat
hs p
er 1
00,0
00 w
orke
rs
Fatalities
Number and Rate of Fatal Work InjuriesU.S. Oil & Gas Extraction Industry, 2003–2015
Note: Fatality counts from BLS Census of Fatal Occupational Injuries. Worker Estimates from BLS Quarterly Census of Employment and Wages (2013). Rate per 100,000 workers per year. Includes NAICS 211, 213111, 213112. *Data for 2014 are preliminary.
N=1,422
85
98 98
125 122
120
68
107
112
142
112
144
89
0
25
50
75
100
125
150
0.0
5.0
10.0
15.0
20.0
25.0
30.0
35.0
Num
ber o
f Dea
ths
Deat
hs p
er 1
00,0
00 w
orke
rs
Fatalities Rate
Number and Rate of Fatal Work InjuriesU.S. Oil & Gas Extraction Industry, 2003–2015
Note: Fatality counts from BLS Census of Fatal Occupational Injuries. Worker Estimates from BLS Quarterly Census of Employment and Wages (2013). Rate per 100,000 workers per year. Includes NAICS 211, 213111, 213112. *Data for 2014 are preliminary.
N=1,422

Operators
Drilling Contractors
Well Servicing CompaniesOil and Gas
Extraction Industry
The U.S. Oil and Gas Extraction Industry
June 8, 2015
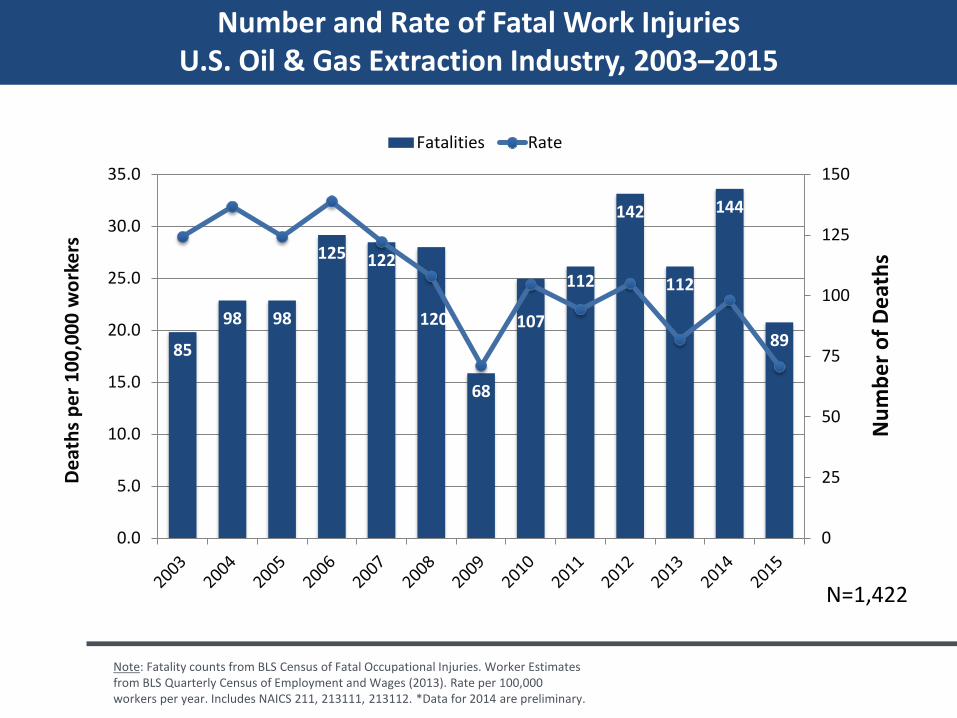
Fatality Rates per 100,000 workers by Company TypeU.S. Oil & Gas Extraction Industry, 2003–2013
Company type (NAICS code) Number % Fatality
RateOperators (211) 196 16.5% 11.6
Drilling Contractors (213111)
378 31.8% 44.6
Well-servicing companies 615 51.7% 27.9
TOTAL 1,189 25.0
Mason et. al, 2015. MMWR.

Fatality Rates per 100,000 workers by Company TypeU.S. Oil & Gas Extraction Industry, 2003–2013
Company type (NAICS code) Number % Fatality
RateOperators (211) 196 16.5% 11.6
Drilling Contractors (213111)
378 31.8% 44.6 (4X)
Well-servicing companies 615 51.7% 27.9
TOTAL 1,189 25.0
Mason et. al, 2015. MMWR.

Fatality Rates per 100,000 workers by Company TypeU.S. Oil & Gas Extraction Industry, 2003–2013
Company type (NAICS code) Number % Fatality
RateOperators (211) 196 16.5% 11.6
Drilling Contractors (213111)
378 31.8% 44.6
Well-servicing companies(213112)
615 51.7% 27.9(2.4X)
TOTAL 1,189 25.0
Mason et. al, 2015. MMWR.

0
10
20
30
40
50
60
70
2003 2004 2005 2006 2007 2008 2009 2010 2011 2012 2013
Fata
lity
Rate
per
100
,000
Trends in Fatality Rate by Company Type
Well Servicing CompaniesOil and Gas Operators Drilling Contractors
Stat ist i ca l ly S ign i f icant
58%
Fata
litie
s
Not Statistically Significant
27%
Fata
litie
s
Stat ist i ca l l y S i gn i f icant
33%
Fata
litie
s
Fata
litie
s

Vulnerable workers in the U.S. Oil & Gas Extraction Industry, 2003–2014
• Contractor/subcontractor employees1
• Employees of small sized establishments (<20 workers), esp. small drilling contractors2
• Hispanic worker fatality rates 20% higher• Lone workers (i.e. oilfield truckers)• Workers new to the industry (53% of fatalities)
1Mason et. al, 2015, 2Retzer, Hill, 2011
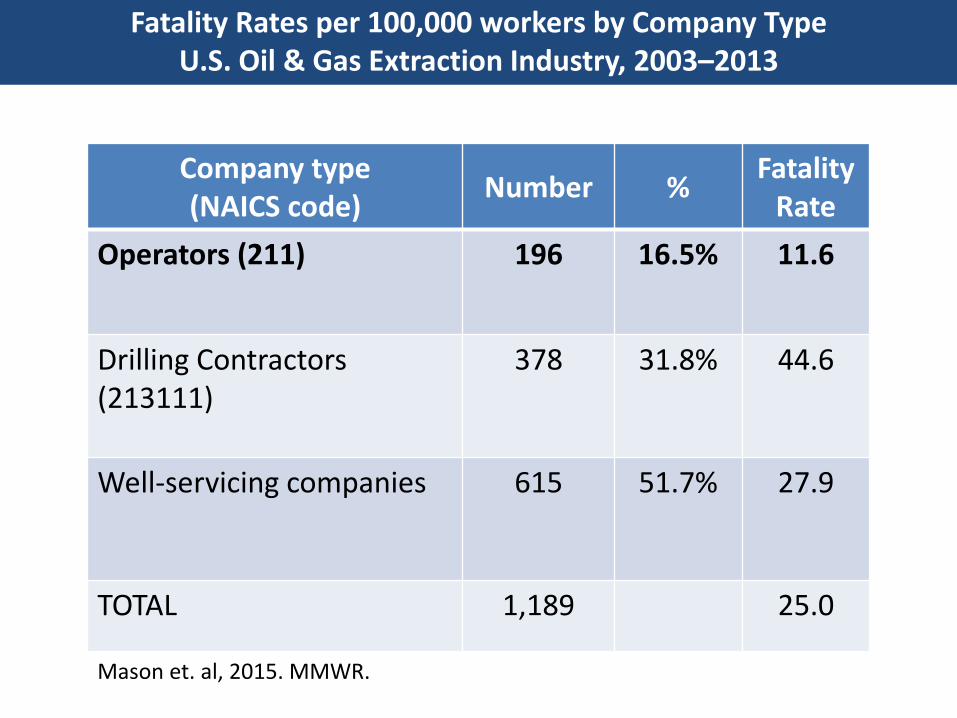
Most Frequent Fatal EventsU.S. Oil & Gas Extraction Industry, 2003–2015

Most Frequent Fatal EventsWyoming Oil & Gas Extraction Industry, 2012–2015
Data Source: Wyoming Department of Workforce Services

TRANSPORTATION INCIDENTS

Description DeathsPickup truck 145 (49%)
Freight Hauling and Utility Truck• Semi, tractor-trailer, tanker truck (74 deaths)
95 (32%)
Off-road/Industrial Vehicle • Forklift (8 deaths)
13 (4%)
Passenger Vehicle (i.e. car, van) 11 (4%)
Airplane 6 (2%)
Other/Unknown 27 (5%)
Total 297*
18
Vehicle Type of Transportation Incidents, 2011-2015 Oil and Gas Extraction Industry (NAICS 211, 213111, 213112)
* Note that total here is larger than in transportation incident slide. This is because vehicles are the source of injury in deaths other than transportation incidents. For example, a worker struck by a powered vehicle not meant for transport (i.e. forklift) is considered a “struck-by” death, rather than a transportation incident.
Data Source: BLS CFOI

10
-
72
20
54
29
0% 10% 20% 30% 40% 50% 60% 70% 80% 90% 100%
Driver
Vehicle Passenger
NA/ Other/Uknown Seat belt in use No restraint used
*Data were generated with restricted access to the CFOI Research file.“Other/Unknown” vehicle occupant position category not shown here.
Seating position and restraint use of fatally injured vehicle occupants, oil and gas industry, 2011-2014
Data Source: BLS and NHTSA

Restraint use by vehicle type in vehicles with fatally injured occupant(s), 2011-2014
*Data were generated with restricted access to the CFOI Research file.
38
25
16
10
7
39
25
11
8
0 10 20 30 40 50 60 70 80 90
Pickup trucks
Large trucks, semi-trucks
Medium trucks
Vans
Other light utility trucks
Passenger cars
NA/Unknown Restraint used Restraint Not in use
Data Source: BLS and NHTSA

New Resource for Seatbelt Use in the Oil and Gas Industry
• http://www.iogp.org/buckleup/#tools

Manner of collision in fatal crashes in the Oil and Gas sector, 2011-2014
0 20 40 60 80 100
Front to Rear
Front to Front
Angle
Not a collision with motor vehicle in transport
*Data were generated with restricted access to the CFOI Research file.

0
2
4
6
8
10
12
14
16
18
Fatal crash frequency by time of day, 2011-2014
*Data were generated with restricted access to the CFOI Research file.Data Source: BLS and NHTSA

• 3 workers killed, 4 hospitalized
• No skid marks at scene
• None of the workers were wearing their seatbelt
Fatigue-Related Crash

Personal Factors Affecting fatigue
• Long commutes to start shift• Desire to be at home with family until last minute• Sleep is low priority
Source: NORA Oil and Gas Motor Vehicle Workgroup Discussion on Driver Fatigue

Operational Demands in the Oilfield
• Critical path nature • Calling crews out early • If you won’t do it,
somebody else will• Company man is a
consultant• Paid by the mile/load
• Disconnect between corporate policy and practice
• No good place to rest• Conflicts with priorities
of operators/dispatchers
Source: NORA Oil and Gas Motor Vehicle Workgroup Discussion on Driver Fatigue

1. Time of day/circadian rhythms 2. Time awake 3. Sleep debt (cumulative) 4. Sleep disorders5. Other considerations: environment,
monotonous tasks, medical history+/medications
(Williamson, 2007)
Factors Increasing Fatigue-Related Risks

Alertness over a 24 hour period

Dawson & Reid, 1997; Williamson & Feyer, 2000; Falleti et al. 2003; Arendt et al. 2005; Howard et al., 2007; Yegneswaran & Shapiro, 2007; Elmenhorst et al., 2009)
Fatigue Is Like Intoxication
17 Hours
Awake
=24 Hours
Awake
.05%BAC=
170 LBS maleover 2 hrs.
.10%BAC
170 LBS maleover 2 hrs.
http://www.dot.wisconsin.gov/safety/motorist/drunkdriving/calculator.htm

Sleep disorders

Cumulative Sleep Debt

• DO NOT recognize declines in own poor performance
• NO EVIDENCE that experience, motivation, professionalism help
(Arendt et al., 2005; Van Dongen 2009) et al., 2003)
Critical Misconceptions About Ability to OvercomePoor Performance Due to Sleep Loss

Educate All Drivers about Sleep and Warning Signs
• Need at least 7-9 hours of continuous sleep per day
Warning Signs: • Yawning or blinking frequently• Difficulty remembering the past
few miles driven• Missing your exit• Drifting from your lane/hitting
rumble stripWhat to do:• Pull over to rest or change
drivers
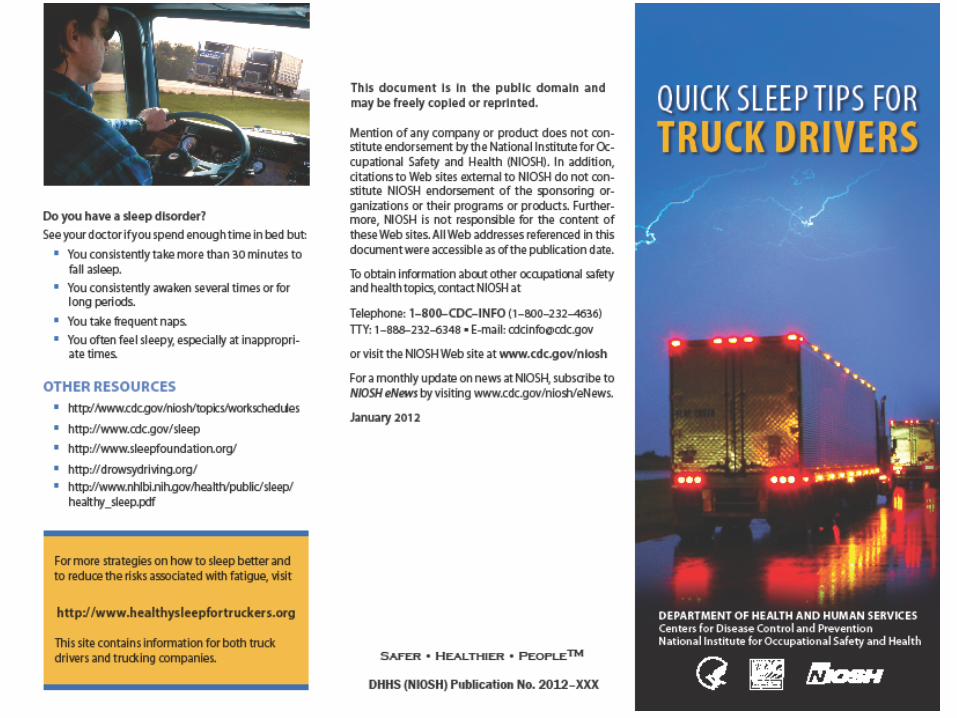


Alert Light Duty Drivers to Sleep Disorders
Approximately 90 different sleep disorders; affects 70 million Americans
See doctor if you:• Take more than 30 minutes
to fall asleep• Wake several time during
sleep or for long periods• Take frequent naps• Often feel sleepy, especially
at inappropriate times

Encourage workers to “Stop the Job” instead of
driving fatigued
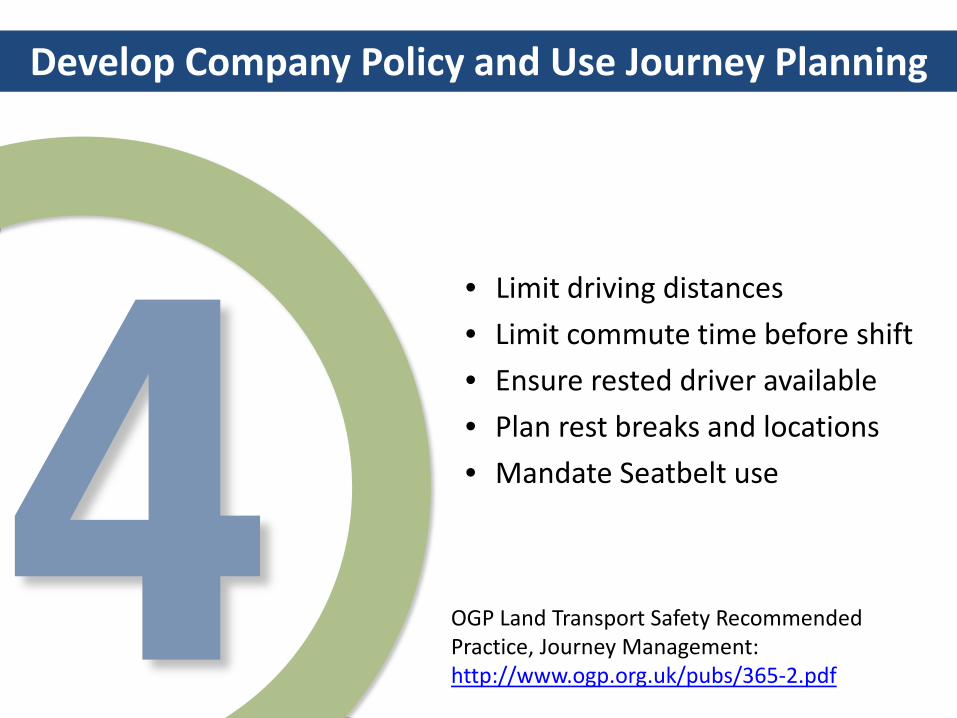
• Limit driving distances• Limit commute time before shift• Ensure rested driver available• Plan rest breaks and locations• Mandate Seatbelt use
Develop Company Policy and Use Journey Planning
OGP Land Transport Safety Recommended Practice, Journey Management: http://www.ogp.org.uk/pubs/365-2.pdf

Be a Good Example: How are You Doing?

`
Records Data
Date and Time Speed Acceleration/Deceleration Seat Belt Use
`
Measures Performance
Measures driver performance against a predetermined set of parameters
`
Changes Behavior
Has shown to be effective in realizing immediate and positive effect on driver behavior
Motor Vehicle Crash Rates1
50–90%
1 Gale et. al, 2012, Mora et. al, 2010, Velasquez, et. al, 2010, Matusalen, et. al, 2006, Ballard et. al, 2004, Jutten et. al, 2002, Cocianni & Taviansky, 1998); 2 Twilhaar, 2000; 3 Lopez, 2006, Twiilar, 2000.
Miles Driven3
8-20% Speeding2
60%
In-Vehicle Monitoring Systems (IVMS)

Description DeathsStruck by object/equipment• powered vehicle, non-transport (17 deaths)• falling object or equipment (52 deaths)• discharged or flying object (4 deaths)• swinging object (8 deaths)
99 (82%)
Caught in equipment or machinery 7 (6%)Caught in collapsing structure/machinery 4 (3%)Other/Unknown 11 (9%)Total 121
41
Contact Injuries, 2011-2015Oil and Gas Extraction Industry (NAICS 211, 213111, 213112)
Note: The OIICS system was updated for data year 2011, so comparisons of years before/after 2011 should be interpreted with caution. 1Category includes data during 2003-2010. 2Category includes data during 2011-2015 only.


Description Deaths
Contact with electric current• Direct exposure to electricity (n=8)
17 (36%)
Exposure to other harmful substances• Inhalation of substance (i.e. Hydrogen sulfide,
hydrocarbon gases/vapors, carbon monoxide) (n=6)
• Drug or alcohol overdose (n=7)
24 (51%)
Other/unknown 6 (13%)
Total 47
43
Exposure to Harmful Substances and Environments, 2011-2015Oil and Gas Extraction Industry (NAICS 211, 213111, 213112)

Digital Story: Tank Gauging VideoTO BE RELEASED July/August 2017
https://vimeo.com/212148379

The Fatalities in Oil and Gas Database (FOG)A database specific to the oil and gas extractionindustry.
https://www.cdc.gov/niosh/topics/fog/
FOG
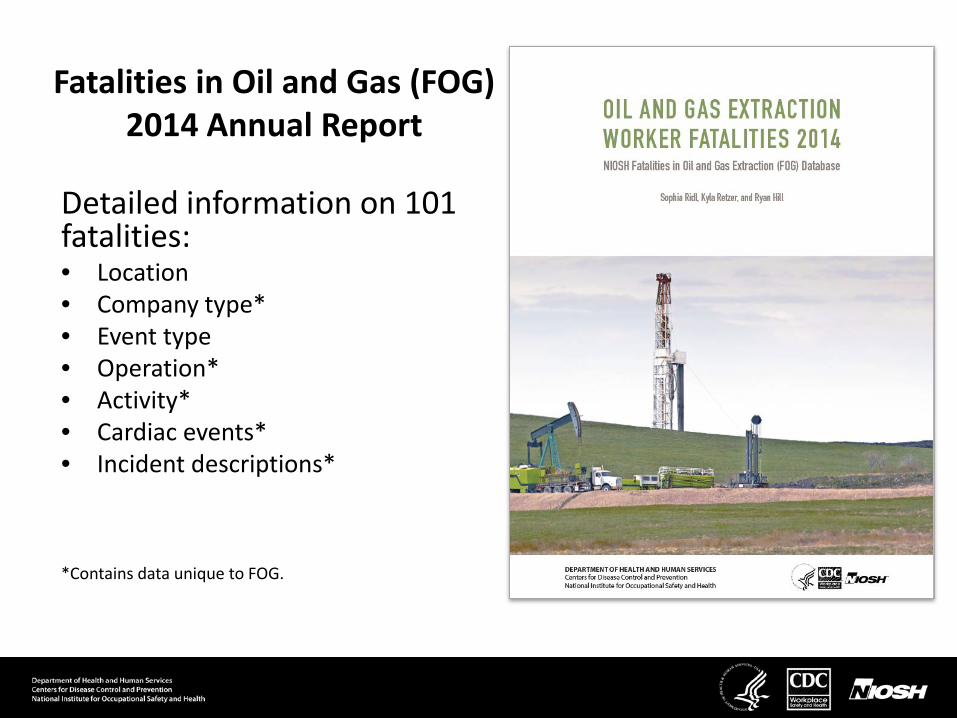
Fatalities in Oil and Gas (FOG) 2014 Annual Report
Detailed information on 101 fatalities:• Location• Company type*• Event type• Operation*• Activity*• Cardiac events*• Incident descriptions*
*Contains data unique to FOG.

Take Pride in Your Job:Fall Protection
Move It!: Rig Move Safety
RigCheck: Rig Safety Checklists
http://www.cdc.gov/niosh/programs/oilgas/ 48
Safety products

Concluding thoughts
• Focus on transportation: seatbelts, fatigue and journey management.
• Focus on contact injuries: dropped objects.• Increase worker knowledge regarding hydrocarbon
gases and vapors by sharing tank gauging video with workforce.
• Collaborate/participate in local health and safety networks. Use/share resources.
Contact Info
Contact Info:
Kyla Retzer, MPHEpidemiologistNIOSH, Western States [email protected] , 303-236-5934
http://www.cdc.gov/niosh/programs/oilgas/