Embed Size (px)
Citation preview

0
Identify and Mitigate
Bacterial Sources at Public Beaches Using Microbial Source Tracking
A final report to the New Hampshire Department of Environmental Services
Submitted by
Dr. Stephen H. Jones
Jackson Estuarine Laboratory/Center for Maine Biology Department of Natural Resources
University of New Hampshire Durham, New Hampshire 03824
Sara Summer and Jody Connor
New Hampshire Department of Environmental Services Concord, NH 03301
February 2004
This project was funded by the U.S. Environmental Protection Agency under the Beaches Environmental Assessment and Coastal Health (BEACH) Act grant. Assistance
Agreement number CU98160001-2.
This report was funded in part by a grant from the Office of State Planning, New Hampshire Estuaries Project, as authorized by the U.S. Environmental Protection Agency
pursuant to Section 320 of the Clean Water Act.

1
Acknowledgements
The authors expresses his gratitude to the following individuals who assisted with the collection of water samples and preparation and review of this report: Thank you to Alicia Carlson, Kristin Conte, and Kate Anthony (NHDES) for their efforts collecting water samples from June through August of 2003. Thank you to Natalie Landry (NHDES) for utilizing her organizational and managerial skills to coordinate this effort, as well as her extensive knowledge of the sampling area environments. Special thank you to Tamara Bryant and Bethany O’Hara (UNH JEL) for assistance in coordinating sampling efforts and sample processing at the Jackson Estuarine Laboratory. Thank you to Andrew Cornwell (NHDES) for generating a site map of the sampling areas. Thank you to Jen Drociak (NH Coastal Program) for providing background information on the site locations. Thank you to Jody Connor and Alicia Carlson (NHDES) for reviewing and editing this report. Finally, much appreciation is extended to the Environmental Protection Agency for funding the development of a new technique to identify bacteria sources to public beaches.

2
Table of Contents Acknowledgements............................................................................................................. 1 Table of Contents................................................................................................................ 2 List of Tables ...................................................................................................................... 2 List of Figures ..................................................................................................................... 2 Introduction......................................................................................................................... 3 Project Setting..................................................................................................................... 3 Project Goals and Objectives.............................................................................................. 5 Methods .............................................................................................................................. 5
Sample Timing and Locations ........................................................................................ 5 Laboratory and Analytical Methods ............................................................................... 6
Detection and Identification of Fecal Coliforms and E. coli .................................. 6 Sample Processing .................................................................................................. 6 Band Pattern Identification ..................................................................................... 7
Source Species Database ................................................................................................ 7 Data Analysis .......................................................................................................... 8
Results and Discussion ....................................................................................................... 9 Storm Event Sampling .................................................................................................... 9
Bacteria Concentrations During Storm Events ............................................................... 9 Source Species Identification........................................................................................ 10
Types of Identified Source Species ............................................................................. 13 Conclusions....................................................................................................................... 15 References......................................................................................................................... 17
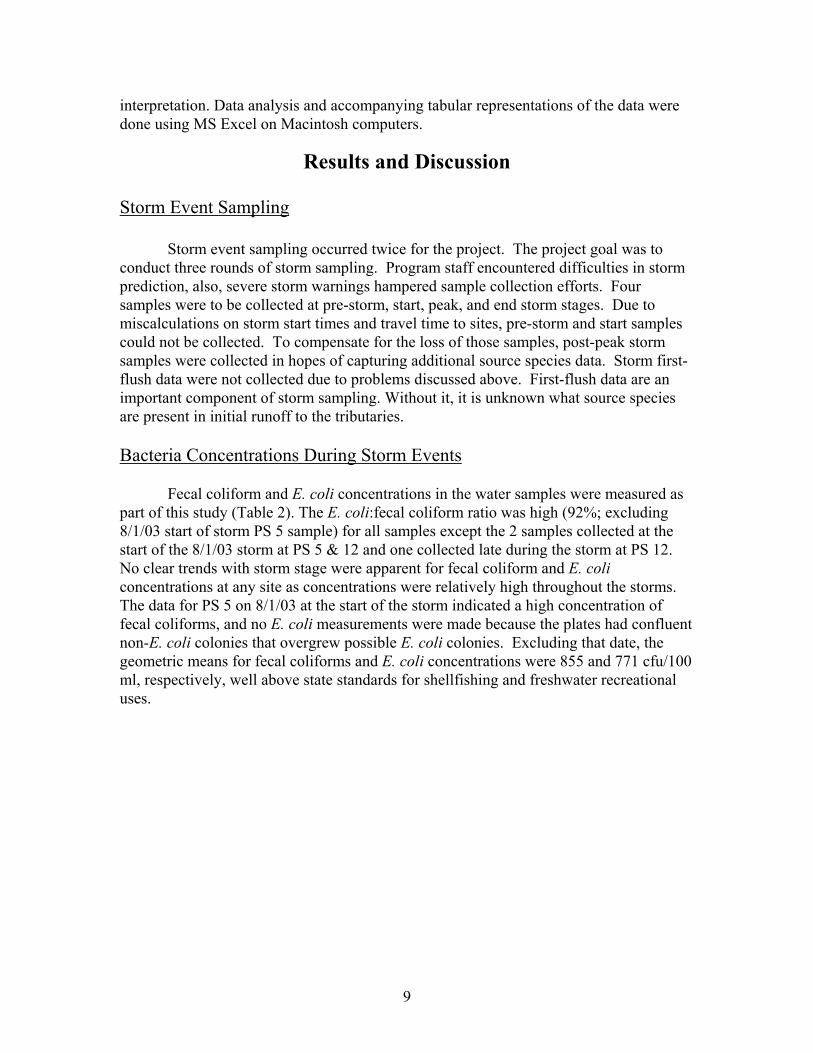
List of Tables Table 1. Source species database for New Hampshire sources. ......................................... 7 Table 2. Concentrations (cfu/100 ml) of fecal coliforms (FC) and Escherichia coli in
water samples from 3 sites along the Atlantic coast, NH: 2003.. ............................ 10 Table 3. Source species identified for E. coli isolated from water samples during storm
events from 3 sites along the Atlantic coast, NH: 2003........................................... 11
List of Figures Figure 1. Atlantic Coast Pollution Sources and Associated Beaches ................................. 4 Figure 2. Atlantic Coast Source Species per Site ............................................................. 14 Figure 3. Dominant Source Species per Site .................................................................... 15

3
Introduction
The U.S. Environmental Protection Agency (EPA) developed the Beaches Environmental and Coastal Health (BEACH) Act to better protect public health at coastal beaches in the US. The New Hampshire Department of Environmental Services (DES) Beach Program received support from EPA to enhance coastal monitoring to include 6 new beaches, adding to the nine previously monitored.
NH’s coastal beaches have historically met state water quality standards for primary contact recreation. Monitoring programs have provided data from weekly sampling to ensure public safety. A sanitary survey of the Atlantic Coast area was conducted by the DES Shellfish Program in 1999 (Nash and Chapman, 2000). This study identified both actual and potential bacterial pollution sources located in Rye, North Hampton, and Hampton, in close proximity and thus potential threats to several coastal beaches.
The microbial source tracking (MST) technique, ribotyping, can be used to indicate the sources of fecal pollution in the wetlands and streams flowing into the public beaches and surrounding waters. This report summarizes the MST results for three sites identified as actual pollution sources to NH marine beaches and relates results to a previous NHDES study encompassing the same sites. These results will be used to reduce and eliminate bacterial sources to the public beaches.
Project Setting
This project involved the investigation into three actual pollution sources to the Atlantic Coast. The pollution sources are PS 5, Parson’s Creek, Rye; PS 11, Chapel Brook, Rye; and PS 12, Little River, North Hampton. All three sites discharge in the vicinity of coastal public beaches. Parson’s Creek discharges to Pirates Cove Beach, Chapel Brook discharges to Bass Beach, and Little River discharges to North Hampton State Beach (Figure 1). Parson’s Creek is a 150 acre saltmarsh located in Rye along the western edge of Rt. 1A. The area surrounding the marsh is residential and commercial. Wildlife native to the area are: deer, muskrat, otter, mallards, shorebirds, egrets, heron, swans, and songbirds. From 1997-1999, a saltmarsh restoration project to remove tidal restrictions and control invasive species occurred. The project replaced three culverts and restored tidal flushing to the area. Final discharge of the saltmarsh is the southern end of Pirates Cove Beach where a culvert was replaced increasing flow to the beach during periods of low tide. Chapel Brook is part of the 10.2 acre Bass Beach/Philbrick’s Pond saltmarsh located along the Rye/North Hampton border. The area surrounding the marsh is mainly residential. Not much is known about wildlife common to the area. Final discharge of the saltmarsh is just south of Bass Beach. A marsh restoration project is scheduled to occur in 2003/2004 to remove tidal restrictions. When this occurs the flow to the south end of Bass Beach will increase significantly during periods of low tide.

4
Little River is a 193 acre saltmarsh located in North Hampton between Little
Boar’s Head and North Shore Rd. in Hampton. The area surrounding the marsh is mainly residential. Wildlife native to the area are: deer, muskrat, otter, mallards, shorebirds, egrets, heron, swans, and songbirds. In 2000, a saltmarsh restoration project to remove tidal restrictions occurred. The project removed an existing 48 inch culvert and replaced it with two 6X12 foot box culverts. The new culvert discharges to the northern end of North Hampton State Beach where flow has significantly increased during periods of low tide.
Figure 1. Atlantic Coast Pollution Sources and Associated Beaches

5
Project Goals and Objectives
The goal of this project was to investigate actual and potential bacterial sources in the Atlantic Coast (NH) watershed, as identified by Nash and Chapman (2000). This study focused on wet weather sampling and is an extension of a previous MST project at the same sites that focused on dry weather sampling. Specific objectives were to:
1. Collect rain event samples from three sampling locations that were identified as
pollution sources along the Atlantic Coast beaches of New Hampshire. 2. Sample each site during wet-weather events during late summer.
3. Utilize the results of the ribotyping to identify sources of bacteria to New
Hampshire’s coastal public beaches.
4. Provide the DES Watershed Assistance Section, Shellfish Program, New Hampshire Estuaries Project (NHEP), and the EPA with the findings of the microbial source tracking project.
Methods Sample Timing and Locations
The Beach Program conducted wet weather sampling at three sites previously identified as actual pollution sources. These sites were: PS 5, PS 11, and PS 12. PS 5 (Parson’s Creek), 11 (Chapel Brook), and 12 (Little River) are actual, direct pollution sources (Nash and Chapman 2000). The pollution sources listed above discharge directly to three coastal beaches. Parson’s Creek discharges to the south end of Pirates Cove Beach, Chapel Brook discharges to the south end of Bass Beach, and Little River discharges to the north end of North Hampton State Beach.
Each site was sampled during storm flows twice during the summer of 2003. A
minimum of 0.25 inches of rainfall triggered sample collections. There was 0.86 inches of rainfall recorded at the Portsmouth weather station on the two sample dates, August 1 and September 16, 2003. Also, Seabrook station recorded 1.16 inches of rainfall on August 1st and 0.83 on September 16, 2003. Sampling was targeted for the start, peak storm, post-peak storm, late storm and the end of storm events. Storm start samples, 5-10 minutes after start of storm, provided initial runoff data. Sampling at the peak, or first flush, provided enhanced watershed runoff data. Post-peak sampling provided data on lingering sources. End of storm sampling provided comparative data and indicate how persistent the sources were. The samples were transported to the UNH Jackson Estuarine Laboratory for bacterial indicator and ribotyping analyses. Laboratory and Analytical Methods

6
Detection and Identification of Fecal Coliforms and E. coli
The laboratory procedures for the detection and identification of fecal coliform and E. coli are in Appendix C along with the procedures for purification/verification of E. coli isolates obtained using the mTEC method.
Appropriate volumes of water samples were filtered to give at least 20 colonies on
agar plates, where possible. The membrane filters were rolled onto mTEC agar in Petri dishes. Plates were inverted and incubated at 44.5±0.2 °C for 24 hours (USEPA, 1986). Fecal coliforms were enumerated by counting the yellow colonies after the incubation period, and E. coli was enumerated by counting the yellow colonies on the plate following incubation of the filter on urea substrate (Jones and Bryant, 2002; Rippey et al., 1987).
Following urease testing, each plate was inspected and the plate giving countable
(20-60) colonies was used for selection of individual E. coli strains for analysis. For some samples, fewer than 20 colonies were present on the smallest dilution analyzed, so the plate with the most numerous colonies was used. The E. coli isolates were subject to a battery of biochemical tests to confirm their identity as E. coli. The procedures used for isolating and identifying E. coli strains for this study were according to standard lab protocols (Jones, 2002a; Jones and Bryant, 2002). The confirmed E. coli isolates were then processed for determining ribopatterns. Some ribopatterns determined using the RiboPrinter® were not typical of E. coli and were identified by the RiboPrinter® as other species. These isolates were then subject to further tests using the API 20e identification system. Those found to be E. coli were retained in the database while isolates giving negative results were removed. Sample Processing The procedures used for ribotyping E. coli isolates for this study have been used previously (Jones and Landry, 2003; Jones, 2002b) and are based to a large extent on those of Parveen et al. (1999). E. coli isolates were stored in cryovials at -80°C and re-cultured onto trypticase soya agar (TSA). Some of the stored isolates could not be re-cultured. Cultures on TSA were incubated overnight at room temperature (~20°C). Some of the resulting culture was transferred to duplicate cryovials containing fresh glycerol/DMSO cryo-protectant media for long-term storage at -80°C.
A RiboPrinter® was used to process E. coli culture for ribotype determinations. After preparation of the samples, the automated process involved lysing cells and cutting the released DNA into fragments via the restriction enzyme EcoR1. These fragments were separated by size through gel electrophoresis and then transferred to a membrane, where they were hybridized with a DNA probe and mixed with a chemiluminescent agent. The DNA probe targeted 5S, 16S and 23S ribosomal RNA genes. A digitizing camera captured the light emission as image data, from which the system extracted a RiboPrint® pattern. This pattern could be compared to others in the RiboPrinter® database for characterization and identification based on densiometry data, although our

7
approach has conformed to other ribotyping studies in using banding patterns as the basis for comparing patterns. Band Pattern Identification
The images were transferred from the RiboPrinter® into GelComparII (Applied-Maths) analytical software. The bands in lanes containing the standard were labeled and entered into the memory for optimization of gel pattern images. The densiometry data were processed for band identification. The ribopattern data for each separate water sample isolate were then selected for identification of source species. Source Species Database
The analysis of the project water sample isolates for identification of source species was based initially on a New Hampshire Atlantic coast source species database and then a NH State source species database (Table 1).
Table 1. Source species database for New Hampshire sources.
The average rate of correct classification (ARCC) for the two source species databases was ~70% when all isolate patterns were included and lower when clones were excluded. The 358 Coastal and 774 State patterns included some that had identical patterns for multiple species. This is considered to reflect ‘transient’ (Samadpour, 2002) ‘garden-variety’ strains of E. coli that can either exist temporarily in non-source species or are
Source # of isolates Source # of isolatesspecies Coastal State species Coastal State
DOMESTIC ANIMALS HUMANSalpaca 3 septage 6 16
buffalo 5 wastewater 42 107chicken 3 3 humans 82
cow 56 PETSgoat 4 cat 7 21
horse 28 dog 19 37sheep 2 BIRDS
WILD ANIMALS cormorant 12 12coyote 4 29 duck 14 16
deer 49 93 geese 30 39mouse 12 gull 24 28
muskrat 12 2 pigeon 5otter 14 14 robin 4
rabbit 27 27 sparrow 3raccoon 67 84 starling 3red fox 23 27 wild turkey 7skunk 5 5 Total 358

8
adapted to multiple species. These were included to allow for identification of patterns as being from “mixed” source species. The databases also included multiple isolate patterns from the same species that were identical but not from the same samples. Data Analysis
All data were analyzed with GelComparII software on a Dell computer, where the source species database was also stored. Hard copies of ribotype patterns and similarity coefficients for the unknown and its most closely related source species were printed for interpretation. Interpretation and accompanying graphical representations of the data were done using MS Excel on Macintosh computers.
Optimization was set at 1.56% and band position tolerance was set at 1.00%.
Both of these parameters were used to adjust the ability to differentiate between bands for the degree of accuracy desired, and also to compensate for possible misalignment of homologous bands caused by technical problems. Tolerance and optimization settings can be used to off set the similarity coefficient used but a balance is required between stringency of data analysis parameters and the fraction of isolates that can be identified. The use of a QA E. coli strain (ATCC #51739) in the analysis for this study and comparison to past analyses of this strain gave 100% matching of resulting ribopatterns using 1.5% optimization and 1.0% band tolerance. Use of lower, more stringent band tolerances gave calculated similarities of <100%, suggesting differences in banding patterns that are a function of the method, not the isolate. Thus, the 1.5/1.0% settings were best for allowing comparisons between actual banding pattern differences.
Similarity indices were determined using Dice’s coincidence index (Dice, 1945)
and the distance among clusters calculated using cluster analysis. The source species profile with the best similarity coefficient was accepted as an indication of the possible source species for the water sample isolate. For this study, the predetermined threshold similarity index that was considered to be a minimum value for identifying source species was 90%.
If the value calculated for a water isolate was below the threshold similarity
index, the water sample isolate was considered to be of unknown origin. Most of the results of the identifications reported are less than completely accurate (0% tolerance and 100% similarity). Nonetheless, useful information has hopefully been gained to help guide management decisions and resource allocation for pollution source identification and elimination.
Cluster analyses were performed to determine the relationships among isolates
from the same source species and the same sites, as well as banding patterns that were identical for different isolates. The cluster analyses were based on the un-weighted pair group method by arithmetic averaging (UPGMA) or the neighbor joining algorithms. The last step in data analysis was visual inspection of the band matching results. Hard copies of ribotype patterns and similarity coefficients for the unknown and most closely related source species were printed for verification of statistical analyses and further
9
interpretation. Data analysis and accompanying tabular representations of the data were done using MS Excel on Macintosh computers.
Results and Discussion Storm Event Sampling Storm event sampling occurred twice for the project. The project goal was to conduct three rounds of storm sampling. Program staff encountered difficulties in storm prediction, also, severe storm warnings hampered sample collection efforts. Four samples were to be collected at pre-storm, start, peak, and end storm stages. Due to miscalculations on storm start times and travel time to sites, pre-storm and start samples could not be collected. To compensate for the loss of those samples, post-peak storm samples were collected in hopes of capturing additional source species data. Storm first-flush data were not collected due to problems discussed above. First-flush data are an important component of storm sampling. Without it, it is unknown what source species are present in initial runoff to the tributaries. Bacteria Concentrations During Storm Events Fecal coliform and E. coli concentrations in the water samples were measured as part of this study (Table 2). The E. coli:fecal coliform ratio was high (92%; excluding 8/1/03 start of storm PS 5 sample) for all samples except the 2 samples collected at the start of the 8/1/03 storm at PS 5 & 12 and one collected late during the storm at PS 12. No clear trends with storm stage were apparent for fecal coliform and E. coli concentrations at any site as concentrations were relatively high throughout the storms. The data for PS 5 on 8/1/03 at the start of the storm indicated a high concentration of fecal coliforms, and no E. coli measurements were made because the plates had confluent non-E. coli colonies that overgrew possible E. coli colonies. Excluding that date, the geometric means for fecal coliforms and E. coli concentrations were 855 and 771 cfu/100 ml, respectively, well above state standards for shellfishing and freshwater recreational uses.
10
Table 2. Concentrations (cfu/100 ml) of fecal coliforms (FC) and Escherichia coli in
water samples from 3 sites along the Atlantic coast, NH: 2003.
Site Date Storm Stage
# of Isolates FC E. coli EC/FC Ratio
0 2300 ND 0
8 140 80 0.57 8/1/03
Peak
Post Peak
End 7 330 318 0.96
11 620 600 0.97
PS 5
9/16/03 Post Peak
End 10 500 500 1.00
10 1090 1080 0.99
7 1510 1410 0.93 8/1/03
Peak
Post Peak
End 7 1410 1380 0.98 PS 11
9/16/03 Post Peak 15 370 370 1.00
10 1740 1040 0.6
4 2210 2190 0.99 8/1/03
Peak
Seep
End 2 1280 1240 0.97
12 1480 1410 0.95
PS 12
9/16/03 Post Peak
End 15 1460 1430 0.98
Geometric Mean 855 771 Ave. = 0.92
Source Species Identification
There were 118 isolates from water samples collected at the 3 sites that were analyzed using the RiboPrinter®, but eight of these yielded results confirmed by biochemical tests that suggested they were a species other than E. coli. Source species were identified for the remaining 110 isolates. Banding patterns for water sample and source species isolates were considered to be the same if there was 90% or greater similarity with reference isolates. Initial analysis resulted in 44 source species identifications, or 40% of the 100 isolates, using only the Atlantic coast database. However, analyses using the NH State database that included all of the Coastal isolate patterns but also had more species and overall patterns, resulted in more source species identifications. All results presented below are for analyses where the NH State database was used to improve the results found with the Coastal database.
Overall, sources for 62, or 56% of the 110 isolates were identified (Table 3). Use
of lower threshold similarity indexes of 80% and 85% did not substantially increase the number of identified isolates, yielding 64% and 58% identifications, respectively. Using higher thresholds of 95% and 100% drastically reduced identifications to 41% and 27%, respectively. Thus, the results from using a threshold of 90% as used in previous studies (Jones, 2004; Jones and Landry, 2004) provided a good balance between accuracy and isolate identification

11
Table 3. Source species identified for E. coli isolated from water samples during storm events from 3 sites along the Atlantic coast, NH: 2003.
Source Species Site Sample
Date Storm Stage
Total Isolates Alpaca Cow Coyot
e Deer Dog Fox Goose Gull Horse Human Otter Raccoon Sparrow Identified Isolates
Peak 0 Post Peak 8 1 1 1 1 1 5
End 6 1 1 1 3 8/1/03
Total 14 0 1 0 2 0 1 0 0 1 2 0 1 0 8 Post Peak 11 1 1 1 2 1 6
End 10 2 2 3 7 Date Total 21 0 1 0 3 0 2 0 0 0 4 0 2 1 13
PS 5
9/16/03
Site Total 35 0 2 0 5 0 3 0 0 1 6 0 3 1 21
Peak 10 1 2 2 5 Post Peak 7 1 2 3
End 6 1 1 8/1/03
Date Total 23 0 1 0 0 0 0 3 0 0 5 0 0 0 9
Post Peak 14 2 1 1 2 1 4 11
PS 11
9/16/03 Site
Total 37 0 1 2 2 0 0 4 0 0 7 1 4 0 20
Peak 5 1 1 2 Seep 4 1 1 1 3 End 2 0 8/1/03 Date Total 11 0 0 1 0 0 0 0 1 1 2 0 0 0 5
Post Peak 12 1 7 8
End 15 1 2 1 2 2 8 Date Total 27 1 0 0 0 1 2 0 0 0 1 9 2 0 16
PS 12
9/16/03
Site Total 38 1 0 1 0 1 2 0 1 1 3 9 2 0 21
OVERALL TOTALS 110 1 3 3 6 1 5 4 1 2 16 10 9 1 62

12
There were 15, or 14% of the isolates that matched database patterns at <90%
similarities and were also considered to be from unknown sources. These “unknown” source isolates may be from a source species that was not included in the database, or from an included species that lacked enough diversity of ribopatterns to provide an identification of adequate accuracy.
There were also 33 (30%) isolates with ribopatterns matching database patterns
shared by multiple species. These were categorized as “mixed” source species, considered successful identifications but included in the “unknown” category. There are several reasons this may occur. Some E. coli strains may be adaptable to multiple types of environments and be common strains in numerous different source species. Alternatively, some strains found in fecal material from different source species may be transient strains that are only there for a relatively short period of time. The mechanism of introduction could be ingestion and digestion of prey organisms, exposure to the feces of other species at landfills or sewage treatment facilities, or even coexistence of multiple species in the same area, like pets and humans or wild animals with overlapping habitats. The profile of species for some of the “mixed species” isolates included only wild animal species, suggesting one or more of the above mechanisms as a possible explanation. In the end, the existence of different strains with the same profile can also imply that ribotyping with a single restriction enzyme may give inadequate detail to differentiate all strains. One alternative strategy is the use of a second restriction enzyme in the digestion of E. coli DNA that cuts the chromosomal DNA at different sites. The additional information that is provided by using two profiles for each E. coli isolate has greatly reduced this problem and made ribotyping more useful (Jenkins et al., 2003; Hartel et al., 2002; Samadpour, 2002), although it is a more expensive overall procedure.
Overall, there were 13 different source species identified. The most commonly
identified source species was humans (16 isolates), followed by otters (10) raccoons (9), deer (6), foxes (5), geese (4), coyotes and cows (3), and horses (2), with single isolates identified as coming from dogs, seagulls, sparrows and alpacas.
The number of isolates analyzed for each site was virtually the same (35-38
isolates), and the percentage of isolates for which source species were successfully identified ranged only from 54% for PS 11 to 55% and 60% for PS 12 and PS 5, respectively (Table 3). The number of different species identified as sources at each site was 7 for PS 5 and 11 and 9 at PS 12. Cow, deer, fox, horse, human, raccoon and sparrow isolates were identified at PS 5. Cow, deer, human and raccoon isolates were also identified at PS 11, as were coyote, goose and otter isolates. Isolates from all but cows, geese, deer and sparrows were identified at PS 12. Thus, humans and raccoons were the only source species identified at all 3 sites. Dog, goose, seagull, sparrow and alpaca isolates were only identified in one of the 3 sites. There was only one isolate identified as coming from each of these species except for geese, for which there were 4 isolates identified at PS 11.

13
Human isolates were more prevalent at PS 5 (17%) and PS 11 (19%) compared to PS 12 (5%), where otters were the most prevalent (24%) source species. Geese were only identified as source species at PS 11 and made up 11% of the total site isolates. Deer were most prevalent (14%) at PS 5, while raccoon isolates occurred relatively uniformly at the 3 sites. In a previous study by Jones and Landry (2004), E. coli isolates were also ribotyped from PS 5, 11 and 12 samples collected during mostly dry weather in 2001-02. In that study, otters were also most prevalent at PS 12 and geese at PS 11. Human isolates were much more prevalent at PS 5 (44%) and PS 12 (16%), and less prevalent at PS 11 (6%). Deer, raccoon and fox isolates were less prevalent in the previous study, but rabbit isolates were identified, in contrast to the present study where they were not identified. Types of Identified Source Species Any management actions taken in response to the results of this study would hinge on what types of source species were deemed significant sources of pollution. Because of this, a useful approach for analyzing results is to group source species into types that would trigger different management actions. The different types include humans, pets, domestic animals/livestock, wild animals and birds (Table 1). Overall, wild animals were the most prevalent (30%) source species type, followed by humans (15%), birds and domestic animals (5%) and pets (1%) (Figure 2). This profile of wild animals and humans as the most prevalent source species and pets, birds and domestic animals being of lower significance has been observed in other MST studies conducted in NH, including the previous study along the Atlantic coast. Compared to the present study, Jones and Landry (2004) found a higher prevalence of human (24%), no domestic animals but similar levels of wild animal and bird isolates amongst the 59 isolates they collected from the same Atlantic coast sites.

14
Figure 2. Atlantic Coast Source Species Per Site
17%
9%
31%
3%
40%
0%
19%
3%
22%
11%
46%
0%
8%
3%5%
37%
3%
45%
0
0.1
0.2
0.3
0.4
0.5
0.6
Human
s
Domes
tic Anim
als
Wild Anim
als Birds
Unkno
wnPets
Human
s
Domes
tic Anim
als
Wild Anim
als Birds
Unkno
wnPets
Human
s Pets
Domes
tic Anim
als
Wild Anim
als Birds
Unkno
wn
Source Species
Perc
ent
Dom
inance
PS 5 Parson's Creek PS 11 Chapel Brook PS 12 Little River
The big difference between the two Atlantic coast MST studies is that samples
were collected during wet weather in this study and largely during dry weather for the previous study. As a result of this difference in weather conditions during sampling, the E. coli concentrations were much lower (geometric mean = 63 cfu/100 ml) than observed during the present study, where the geometric mean was 771 cfu/100 ml. Thus, the differences observed for types of source species contributing as pollution sources in the two studies probably resulted from the different weather conditions.
The types of source species identified at each site had potentially important
differences, even though wild animal isolates were the most prevalent type at all 3 sites (Figure 3). Human isolates were the second most prevalent type at all 3 sites, although they were almost as prevalent (19%) as wild animals (22%) at PS 11 and they were much less prevalent (8%) at PS 12 compared to wild animals (37%). Domestic animal isolates followed human isolates in prevalence at PS 5 while bird isolates followed human

15
isolates in prevalence at PS 11. One pet isolate was present only at PS 12.
Figure 3. Dominant Source Species per Site
17%
31%
19%22%
8%
37%
0
0.1
0.2
0.3
0.4
0.5
Humans Wild Animals Humans Wild Animals Humans Wild AnimalsSource Species
Perc
ent
Dom
inance
PS 11 Chapel Brook
PS 12 Little River
PS 5 Parson's Creek
These results suggest that the most prevalent types of source species are relatively
similar at the 3 sites and thus management strategies would also be similar at the different sites. Another analytical strategy is to regard human, pet and domestic animal isolates as derived from human-related sources, while birds and wild animals probably originate solely from non-human related sources. In this regard, non-human related sources still outnumber human-related sources at all 3 sites, especially at PS 12 (Table 4). Even still, human-related source species constituted ~40% of all identified sources, suggesting that they are an important type of pollution source. The reduction or elimination of human sources could provide a significant level of improvement in water quality to these sites and to the coastal beaches that receive the pollutant load.
Conclusions
The most prevalent types of sources, wild animals and humans, were consistently present at each site. The wild animals included six species, including raccoons that were identified as source species at all 3 sites, as were humans. There were differences between sites for less prevalent source species types. This was most striking at PS 11, the only site where bird species were more prevalent than domestic animals because of the higher prevalence of geese, the low incidence of cow isolates and the absence of other domestic animal isolates.

16
The results from the present study conducted during wet weather had the same types of most prevalent source species types, wild animals and humans, but differed in some wild animal species sources for the same sites studied in 2001-02 during dry weather (Jones and Landry, 2004). There was a greater prevalence of raccoons, deer and foxes, and fewer otters and rabbits in this study. The wet weather apparently caused E. coli concentrations in the sampled surface waters to be higher relative to the previous dry weather samples. Because of this, the sources identified during wet weather in this study may be more important in terms of bacterial and pathogen loading to the downstream beach areas. The results also indicate a potential impact from saltmarsh restorations on beach areas. Two sites, PS 5 and PS 12, were subject to saltmarsh restoration projects involving the removal of tidal restrictions. The removals are designed to increase tidal flow to and from saltmarsh areas, increase habitat, and restore acres of saltmarsh. The removal of tidal restrictions may have a negative impact where tidal discharge is located on or near a beach area. The increased flow rate could increase the likelihood of bacteria transport to beaches. Habitat restoration can lure additional wildlife to the area resulting in increased saltmarsh bacteria loads and wildlife source species. A recommendation to conduct a water quality study involving pre and post restoration conditions, source species, and impacts will be made for future saltmarsh restoration projects.

17
References
Dice, L.R. 1945. Measures of the amount of ecologic association between species. Ecology 26:297–302.
Hartel, P.G., J.D. Summner, J.L. Hill, J.V. Collins, J.A. Entry, and W.I. Segars. 2002. Geographic variability of Escherichia coli ribotypes from animals in Idaho and Georgia. J. Environ. Qual. 31:1273–1278. Jenkins, M.B., P. G. Hartel, T. J. Olexa, and J. A. Stuedemann. 2003. Putative Temporal Variability of Escherichia coli Ribotypes from Yearling Steers. J. Environ. Qual. 32: 305-309. Jones, S.H. 2004. Application of Ribotyping for Tracking Bacterial Pollution Sources in the Merriland River, Branch Brook and Little River (MBLR) Watershed. Final report. CICEET, University of New Hampshire, Durham, NH. Jones, S.H. 2002a. QA Plan for the Jackson Estuarine Laboratory Microbiology Lab. USEPA approved: 2002.
Jones, S. H. 2002b. Application of Ribotyping for Tracking Bacterial Pollution Sources in New Hampshire’s Shellfish Waters. A final report to the New Hampshire Coastal Program/Office of State Planning, Portsmouth, NH.
Jones, S.H. and T. Bryant. 2002. Standard procedure for detection of total coliforms, fecal coliforms, Escherichia coli and enterococci from environmental samples. Jackson Estuarine Laboratory, University of New Hampshire, Durham, NH.
Jones, S.H. and N. Landry. 2004. Tracking Bacterial Pollution Sources in Little Harbor and the New Hampshire Atlantic Coast Tributaries. Final report. New Hampshire Department of Environmental Services, Concord, New Hampshire.
Jones, S.H. and N. Landry. 2003. Tracking Bacterial Pollution Sources in Hampton Harbor. Final report. New Hampshire Estuaries Project, Portsmouth, NH. Nash, W.C. and Andrew Chapman. 2000. Sanitary Survey Report For the Atlantic Coast, Gulf Of Maine, New Hampshire. Report Prepared for the New Hampshire Shellfish Program. NHDES, Concord, New Hampshire.
Parveen, S., K.M. Portier, K. Robinson, L. Edmiston and M.L. Tamplin. 1999. Discriminant analysis of ribotype profiles of Escherichia coli for differentiating human and nonhuman sources of fecal pollution. Appl. Environ. Microbiol. 65: 3142-3147.
Rippey, S.R., W.N. Adams and W.D. Watkins. 1987. Enumeration of fecal coliforms and E. coli in marine and estuarine waters: an alternative to the APHA-MPN approach. J. Wat. Pollut. Cont. Fed. 59: 795-798.
Samadpour, M. 2002. Microbial source tracking: Principles and practice, p. 5-10, In: Microbiological Source Tracking Workshop-Abstracts. February 5, 2002. Irvine, CA. NWRI Abstract Report NWRI-02-01. National Water Research Institute, Fountain Valley, CA.
U.S. Environmental Protection Agency (USEPA). 1986. Test methods for Escherichia coli and enterococci by the membrane filtration procedure. EPA 600/4-85/076. EPA, Environmental Monitoring and Support Laboratory, Cincinnati, OH.

![The Ballpark Of the Palm Beaches Stadium West Palm Beach ...€¦ · THE BALLPARK OF THE PALM BEACHES West Palm Beach, Florida, USA [Stadium] Developer/Owner HW Spring Training Complex,](https://img.pdfslide.us/doc/110x75/5f902ee46bb6aa007f19a47e/the-ballpark-of-the-palm-beaches-stadium-west-palm-beach-the-ballpark-of-the.jpg)