Embed Size (px)
Citation preview

Identification of unknown organic compounds based on
comparison of electron ionization mass spectra
Andrey S. Samokhin
Igor A. Revelsky
Chemistry Department
Lomonosov Moscow State University

Identification of unknown organic compounds
2
Nuclear
magnetic
resonance
(NMR)
spectroscopy
Infrared
(IR)
spectroscopy
Ultraviolet
(UV)
spectroscopy
Mass spectrometry
(MS)
Electrospray ionization
Atmospheric pressure
chemical ionization
Atmospheric pressure
photoionization
Electron ionization (EI)
Chemical ionization
High-performance liquid
chromatography/mass spectrometry
(HPLC/MS)
Gas chromatography/mass spectrometry
(GC/MS)

• Formation of a large number of fragment ions
• High (interlaboratory) reproducibility of mass spectra (in
comparison with other ionization techniques)
Features of electron ionization mass spectrometry (70 eV)
3
Electron ionization mass spectral databases- NIST'11 (213000 compounds)
- Wiley 9th (592000 compounds)
M + e– → M+• + 2e–
Electron ionization ion sourceFilament (cathod)
Anode
Ion lenses

Identification based on search against mass spectral database (Library search)
4
50 80 1100
50
10055
7083
97 112
50 90 1300
50
100
51 64 77 102
128
…
Similarity index
Experimental mass spectrum of
unknown compound

Result of library search
5
• Result of library search is the list of possible candidates (―Hit
table‖). Possible candidates are ranked by Similarity index
• ―Hit table‖ obtained using MS Search 2.0 software:
# Lib. Match R.Match Prob. Name
1 M 855 855 27.4 Nonanoic acid, methylester
2 M 849 849 21.6 Undecanoic acid, methylester
3 M 845 845 18.2 Decanoic acid, methylester
4 M 838 838 14.0 Tridecanoic acid, methylester
5 M 819 819 6.77 Dodecanoic acid, methylester
Correct compound does not occupy the first position in the
“hit table” in approximately 25% of cases[1]
[1] Stein S.E., Scott D.R., J. Am. Soc. Mass Spectrom., 1994, vol. 5, p. 859–866.

Differences between experimental and library mass spectra of testosterone
6
(Spec. Edit) sample19#1289-1293 RT: 23,46-23,51 AV: 5 SB: 29 23,24-23,38 , 23,69-23,84
50 80 110 140 170 200 230 260 2900
50
100
5579
91 109
124
133
147
165 185
203228
246
270
288
(Spec. Edit) testosterone (Thevis' book)
50 80 110 140 170 200 230 260 2900
50
100
55
67
7991
105
124
133
147
159187
203
228
246
273
288
(Text File) testosterone (Sigma)
50 80 110 140 170 200 230 260 2900
50
100
55
79
91
105
124
133
147
159 187
203
228
246
273
288
(Text File) Testosterone (NIST)
50 80 110 140 170 200 230 260 2900
50
100
55677991
105
124
133
147
165185
203228
246
273
288(a)
(b)
(c)
(d)
(a) – NIST mass spectral database (http://webbook.nist.gov/)
(b) – mass spectra registered by us using quadrupole instrument ―DSQ‖ (Thermo)
(c) – Thevis M. Mass Spectrometry in Sports Drug Testing, Wiley, 2010. 360 p.
(d) – Sigma-Aldrich, Product Information, Testosterone (T 5411).

Dissimilarity of registration conditions
7
• Technique used for introducing sample into a mass
spectrometero direct inlet
o combination with gas chromatograph
• Temperature of ion source
• Type of mass analyzero quadrupole
o time-of-fligth
o ion trap
o magnetic sector
• Method of instrument calibration

Prediction of electron ionizationmass spectra
8
Electron ionization mass spectra cannot be fully predicted
by experts and simulated using any software:
• Theory of molecular ion fragmentation gives only general
information about set of ions
• Software (e.g. Mass Frontier, ACD Labs, MOLGEN) can be
used to predict only the set of m/z values corresponding to
possible fragment ions (intensities of mass spectral peaks
cannot be predicted)
Therefore identification of unknown compounds (by means
of electron ionization mass spectrometry) should be based
on comparison with experimental mass spectra

Reliable identification by means of electron ionization mass spectrometry
9
For the most reliable identification by means of electron
ionization mass spectrometry the full mass spectra of
unknown compound and possible candidate should be
registered under identical experimental conditions and
compared
The main problem is how to compare full mass spectra,
which may contain hundreds of peaks

Possible approaches for mass spectra comparison
10
• Visual comparison
• Application of mathematical algorithms used in library search
programs
• Comparison of intensities of individual mass spectral peaks

(Text File) sub N7 Ion Trap (average) (min_I=5) v.0.2.
60 80 100 120 1400
50
10057
71
8597 111 126
(Text File) sub N9 Ion Trap (average) (min_I=5) v.0.2.
60 80 100 120 1400
50
10057
71
8597 110 126
Visual comparison
11
• Visual comparison is very subjective
• Mass spectra similarity cannot be estimated quantitatively
n-Dodecane(MW = 170)
n-Tridecane(MW = 184)
Do these mass spectra correspond to the same
compound?

960 980 10000,00
0,15
0,30
0,45
Similarity index
Application of mathematical algorithms used in library search programs
12
Samokhin A.S., Revelsky I.A., Revelsky A.I. Book of Abstracts. Fourth All-RussianConference "Fundamental issues of mass spectrometry and its analyticalapplication―. October 10–14, 2010, Zvenigorod, Russia. P. 58–59.
Test set of model compounds
GC/MSanalysis
Creation ofin-house mass spectral library(by averaging n
replicate spectra)
n replicate
experiments
Search againstin-house
mass spectral library
k replicate
experiments
Distribution of values of the
similarity indexes(corresponding to
correct identification)
Calculating the parameters of the
distributionMean = 977StD = 9.2

Application of mathematical algorithms used in library search programs
13
Samokhin A.S., Revelsky I.A., Revelsky A.I. Book of Abstracts. Fourth All-RussianConference "Fundamental issues of mass spectrometry and its analyticalapplication―. October 10–14, 2010, Zvenigorod, Russia. P. 58–59.
960 980 10000,00
0,15
0,30
0,45
Similarity index
Normaldistribution
960 980 10000,00
0,15
0,30
0,45
Similarity index
95%
Normaldistribution Critical value of
Similarity index = quantile95%
(corresponding to reliable
identification)
Mass spectra correspond to the same compound, if
similarity index between these spectra is more than critical
value (equaled to quantile95%)

Application of mathematical algorithms used in library search programs
14
• Magnitudes of critical values calculated for different
instruments are not equal
The main limitation is that the magnitude of critical value
depends on registration conditions
• The experiments (including registration of hundreds of
spectra) should be repeated every time, when conditions are
changedo ion source contamination
o method of instrument calibration
o etc.
Samokhin A.S., Revelsky I.A., Revelsky A.I. Book of Abstracts. Fourth All-RussianConference "Fundamental issues of mass spectrometry and its analyticalapplication―. October 10–14, 2010, Zvenigorod, Russia. P. 58–59.

Comparison of intensities of individual mass spectral peaks
15
[1] Commission Decision 2002/657/EC, Off. J. Eur. Commun., 12 August. 2002[2] Guidance for industry: mass spectrometry for confirmation of the identity of animaldrug residues: final guidance. FDA, Washington, DC; 2003.[3] WADA Technical Document—TD2010IDCR, 2011.
• only several (usually 3) mass spectral peaks are considered
• width of tolerance window is quite large
Tolerance windows for relative intensities of mass spectral
peaks[1–3]
Intensity[3]
(normalized to the base peak)Width of window[3]
>50% ±10%relative
20–50% ±15%relative
10–20% ±20%relative
≤10% ±50%relative

Distinguishing electron ionization mass spectra of isomers by PCA
16
• Hejazi et. al have used PCA to distinguish geometrical
isomers of α-linolenic acid methyl ester[1]
• We have shown possibility of distinguishing between
o-xylene, m-xylene and p-xylene[2]
-5 -3 -1 1 3
-2
2
PC1
PC2
o-Xylene
m-Xylenep-Xylene
[1] Hejazi L., Ebrahimi D., Guilhaus M., Hibbert D.B., J. Am. Soc. Mass Spectrom.,2009, vol. 20, p. 1272–1280.[2] Samokhin A., Revelsky I., Eur. J. Mass Spectrom. 2011, vol. 17, p. 477–480.

Goal
17
The goal of this work was to develop simple approach
(based on using principal component analysis) for reliable
comparison of mass spectra registered under identical
experimental conditions

Scheme of analysis
18
n1 replicate mass spectra of unknown
compound
n2 replicate mass spectra of possible
candidate
Intensities of mass spectral peaks were normalized to the total ion current:
%100absolut
/
absolut/relative
/
i
izm
jzm
jzmI
II
m/z values
mass s
pectr
a
Principal component
analysis

What can we expect?
19
Unknown compound
ispossible
candidate
Unknown compound
is notpossible
candidate
Principal component
analysis
1. There is only one groupof objects on the scoreplot
2. All PCs contain onlynoise
1. There are two groups ofobjects on the score plot
2. PC1 should separateobjects corresponding todifferent groups
PC1
PC1
Score plot
PC1
PC1
Score plot
Therefore we can useonly PC1 to comparemass spectra

The first principal component
20
PC1 = p1∙I1 + p2∙I2 + … + pn∙In
It is believed, thatintensities of massspectral peaks havenormal distribution
PC1 has normaldistribution as well
Student's t-test canbe used tocompare groups ofobjects
Therefore we transform multidimensional analytical signal
to the one-dimensional one

Scheme of analysis
21
n1 replicate mass spectra of unknown
compound
n2 replicate mass spectra of possible
candidate
m/z values
mass s
pectr
a
Principal component
analysis
PC1
Mean1
StD1
Mean2
StD2
Student’s t-test:
21
2121
StD
MeanMeanξ
nn
nn
If ξ ≤ t (P, f = n1 + n2 – 2),unknown compound is possible candidate
If ξ > t (P, f = n1 + n2 – 2),unknown compound is not possible candidate

(Text File) sub N7 Ion Trap (average) (min_I=5) v.0.2.
60 80 100 120 1400
50
10057
71
8597 111 126
n-Dodecane
(Text File) sub N9 Ion Trap (average) (min_I=5) v.0.2.
60 80 100 120 1400
50
10057
71
8597 110 126
n-Tridecane
Example #1(discrimination of hydrocarbons)
22
Mass spectra corresponded to 1 ng of respective analyte23 mass spectral peaks were taken into account
-2 -1 0 1 2
-2
-1
0
1
2
PC1
PC2
n-Dodecanen-Tridecane
Mean = –1.73StD = 0.17
Mean = 1.73StD = 0.44
ξ = 12.7
P t (P, 4)
0.95 2.8
0.99 4.6
0.999 8.6
Mass spectra correspond to the different compounds

Example #2(discrimination of β-HCH and δ-HCH)
23
(Text File) b-HCH
60 90 120 150 180 210 240 2700
50
10050
61
77
85
96
111
146
181
219
254
β-hexachlorocyclohexane
(Text File) d-HCH
60 90 120 150 180 210 240 2700
50
10050
61
77
85
96
111
146
181
219
254
δ-hexachlorocyclohexane
-1 0 1
-1
0
1
PC1
PC2
-HCH-HCH
Mean = –1.15StD = 0.08
Mean = 1.15StD = 0.18
Mass spectra corresponded to 0.5 ng of respective analyte45 mass spectral peaks were taken into account
ξ = 20.5
P t (P, 4)
0.95 2.8
0.99 4.6
0.999 8.6
Mass spectra correspond to the different compounds

tR
I
Example #3(identification of “unknown” compound)
GC/MS analysis
Extraction of pure mass spectrum
(Text File) 2,4-X, 0.1ng (Av.: 1,3,6)
50 60 70 80 90 100 110 120 1300
50
100
5165
77
91
94
107
122
m/z
24
Library search against mass
spectral database
# Name Similarity index
1 2,3-xylenol 8962 2,5-xylenol 8883 2,6-xylenol 8754 2,4-xylenol 8705 3,4-xylenol 859
RI ~ 1155 iu
―Unknown‖ sample
Name RI [1], iu
2,6-xylenol 11152,4-xylenol 11502,5-xylenol 11523,5-xylenol 11702,3-xylenol 11803,4-xylenol 1196
[1] Mjos S., Meier S., Boitsov S, J. Chromatogr. A 2003, vol. 1123, p. 98–105.

Example #3(identification of “unknown” compound)
25
GC/MS analysis
GC/MS analysis
“Unknown” compound
Possible candidate
(2,5-xylenol;C = 0.1 ng uL–1)
Retention times
tR(―unknown‖) = 261.70 sec
tR(2,5-xylenol) = 261.85 sec
∆tR = 0.15 sec∆tR = 0.06%
(Text File) 2,4-X, 0.1ng (Av.: 1,3,6)
60 80 100 1200
50
100
5165
77
91
107
122
―Unknown‖
(Text File) 2,5-X, 0.2ng
60 80 100 1200
50
100
5165
77
91
107
122
2,5-xylenol
Mass spectra

Example #3(identification of “unknown” compound)
26
(Text File) 2,4-X, 0.1ng (Av.: 1,3,6)
60 80 100 1200
50
100
5165
77
91
107
122
―Unknown‖
(Text File) 2,5-X, 0.2ng
60 80 100 1200
50
100
5165
77
91
107
122
2,5-xylenol
Intensities of chromatographic peaks (of ―unknown‖ compound and2,5-xylenol) were approximately equal26 mass spectral peaks were taken into account
-2 -1 0 1 2
-2
-1
0
1
2
PC1
PC2
"Unknown"2,5-xylenol
Mean = –1.58StD = 0.04
Mean = 1.58StD = 0.18
ξ = 29.8
P t (P, 4)
0.95 2.8
0.99 4.6
0.999 8.6
Mass spectra correspond to the different compounds

tR
I
Example #3(identification of “unknown” compound)
GC/MS analysis
27
RI ~ 1155 iu
―Unknown‖ sample
Name RI [1], iu
2,6-xylenol 11152,4-xylenol 11502,5-xylenol 11523,5-xylenol 11702,3-xylenol 11803,4-xylenol 1196
[1] Mjos S., Meier S., Boitsov S, J. Chromatogr. A 2003, vol. 1123, p. 98–105.
Example #3(identification of “unknown” compound)
28
(Text File) 2,4-X, 0.1ng (Av.: 1,3,6)
60 80 100 1200
50
100
5165
77
91
107
122
―Unknown‖
(Text File) 2,4-X, 0.1ng (Av.: 2,4,5)
60 80 100 1200
50
100
5165
77
91
107
122
2,4-xylenol
Intensities of chromatographic peaks (of ―unknown‖ compound and2,4-xylenol) were approximately equal26 mass spectral peaks were taken into account
-1 0 1
-1
0
1
PC1
PC2
2,4-xylenol"Unknown"Mean = –0.08
StD = 0.30Mean = 0.08StD = 0.34
ξ = 0.62
P t (P, 4)
0.95 2.8
0.99 4.6
0.999 8.6
Mass spectra correspond to the same compound
Example #3(identification of “unknown” compound)
29
(Text File) 2,4-X, 0.1ng (Av.: 1,3,6)
60 80 100 1200
50
100
5165
77
91
107
122
―Unknown‖
(Text File) 2,4-X, 0.5ng
60 80 100 1200
50
100
5165
7791
107
122
2,4-xylenol
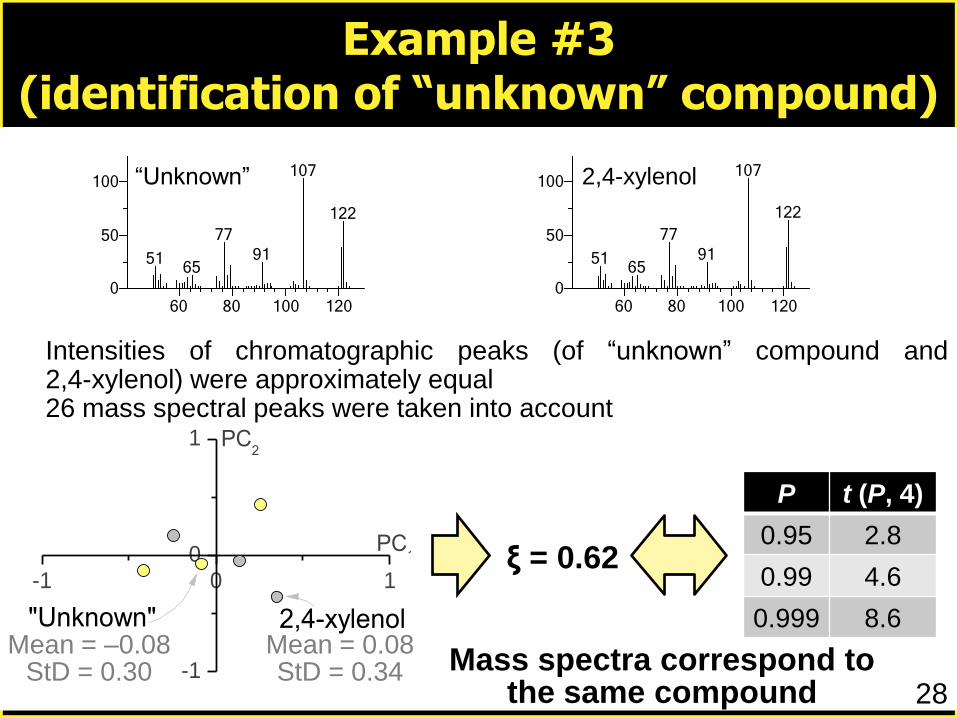
Intensity of chromatographic peak corresponding to 2,4-xylenol was at 5times more than intensity of peak corresponding to ―unknown‖ compound26 mass spectral peaks were taken into account
-1,0 -0,5 0,0 0,5 1,0
-1,0
-0,5
0,0
0,5
1,0
PC1
PC2
"Unknown"2,4-xylenolMean = –0.47
StD = 0.07Mean = 0.47StD = 0.32
ξ = 5.0
P t (P, 4)
0.95 2.8
0.99 4.6
0.999 8.6

Conclusions
30
• We have developed simple approach (based on usingprincipal component analysis) for reliable comparison of fullelectron ionization mass spectra
o Mass spectra should be registered under identicalexperimental conditions
o Mass spectra should correspond approximately the sameamounts of analytes
o Both unknown compound and possible candidate should beanalyzed at least three times
• Applicability of developed approach was shown in a numberof examples
• Dependence of electron ionization mass spectra on amountof substance was shown
Acknowledgement
31
• We are grateful to Leco company for providing us with a
time-of-flight mass spectrometer coupled with a gas
chromatograph for our research
• We are grateful to Dr. A.V. Garmash for discussion of
presented results


![Identification of Unknown Compounds [Compatibility Mode]](https://img.pdfslide.us/doc/110x75/577cc51c1a28aba7119b579b/identification-of-unknown-compounds-compatibility-mode.jpg)