Embed Size (px)
Citation preview
MOL 58024
1
Identification of Survival Genes in Human Glioblastoma Cells Using siRNA Screening
Nikhil G. Thaker
Fang Zhang
Peter R. McDonald
Tong Ying Shun
Michael D. Lewen
Ian F. Pollack
John S. Lazo
Doris Duke Clinical Research Fellowship (N.G.T), Department of Neurological Surgery (N.G.T
and I.F.P), Department of Pharmacology and Chemical Biology and Drug Discovery Institute
(N.G.T., F.Z.,P.R.M, T.Y.S., M.D.L, and J.S.L), University of Pittsburgh, Pittsburgh,
Pennsylvania 15260
Molecular Pharmacology Fast Forward. Published on September 28, 2009 as doi:10.1124/mol.109.058024
Copyright 2009 by the American Society for Pharmacology and Experimental Therapeutics.
This article has not been copyedited and formatted. The final version may differ from this version.Molecular Pharmacology Fast Forward. Published on September 25, 2009 as DOI: 10.1124/mol.109.058024
at ASPE
T Journals on January 2, 2019
molpharm
.aspetjournals.orgD
ownloaded from

MOL 58024
2
Running title: Survival Genes in Glioblastoma
Corresponding author:
John S. Lazo, Department of Pharmacology and Chemical Biology, Biomedical Science Tower
3, 3501 Fifth Avenue, University of Pittsburgh, Pittsburgh, PA 15260; Telephone: 412-648-
9200; Fax: 412-648-9009; Email: [email protected]
Text pages: 20
Number of tables: 1
Number of figures: 6
Number of references: 36
Number of words:
Abstract: 228
Introduction: 447
Discussion: 1,624
Abbreviations:
siRNA, short interfering RNA; PSMB4, proteasome subunit beta 4; NF- B, nuclear factor
kappa-light-chain-enhancer of activated B cells; GBM, glioblastoma multiforme; MAD, Median
of the Absolute Deviation; IPA, Ingenuity Pathways Analysis
This article has not been copyedited and formatted. The final version may differ from this version.Molecular Pharmacology Fast Forward. Published on September 25, 2009 as DOI: 10.1124/mol.109.058024
at ASPE
T Journals on January 2, 2019
molpharm
.aspetjournals.orgD
ownloaded from
MOL 58024
3
ABSTRACT
Target identification and validation remain difficult steps in the drug discovery process,
and uncovering the core genes and pathways that are fundamental for cancer cell survival may
facilitate this process. Therefore, we implemented a short interfering RNA (siRNA) screen with
16,560 siRNAs targeting 5,520 unique druggable human genes aimed at identifying these
survival genes in the T98G glioma cell line because glioblastoma represents a challenging form
of cancer for chemotherapy. We analyzed cell viability at 96 hr after siRNA transfection with
two orthogonal statistical methods and identified 55 survival genes that encoded proteases,
kinases, and transferases. Interestingly, 22% (12/55) of the survival genes were constituents of
the 20S and 26S proteasome subunits. An expression survey of a panel of glioma cell lines
demonstrated expression of the proteasome component PSMB4, and the validity of the
proteasome complex as a target for survival inhibition was confirmed in a series of glioma and
non-glioma cell lines by pharmacological inhibition and RNA interference. Biological networks
were built with the other survival genes using a protein-protein interaction network, which
identified clusters of cellular processes, including protein ubiquitination, purine and pyrimidine
metabolism, nucleotide excision repair, and NF- B signaling. The results of this study should
broaden our understanding of the core genes and pathways that regulate cell survival, and we
highlight the potential significance of proteasome inhibition, through either small molecule
inhibition or RNA interference.
This article has not been copyedited and formatted. The final version may differ from this version.Molecular Pharmacology Fast Forward. Published on September 25, 2009 as DOI: 10.1124/mol.109.058024
at ASPE
T Journals on January 2, 2019
molpharm
.aspetjournals.orgD
ownloaded from
MOL 58024
4
High-throughput analysis of gene function has deepened our appreciation of the
molecular underpinnings associated with particular biological processes in cancer and holds
promise for the identification of novel cancer drug targets (Ramadan et al., 2007). target
identification and validation remain difficult steps in the drug discovery process (Ramadan et al.,
2007; Rich and Bigner, 2004). Therefore, uncovering the core genes and pathways that are
fundamental for cell survival may facilitate this process.
An unbiased approach to explore these essential targets exploits the use of short
interfering RNA (siRNA). In cells, siRNA can silence essentially any gene product in the
genome through sequence specific mRNA transcript degradation (Sachse and Echeverri, 2004),
and large-scale siRNA screening is made possible by siRNA libraries and automated liquid
handlers (Berns et al., 2004; Iorns et al., 2007). This genomic tool offers simultaneous and
systematic genome-wide interrogation of the loss-of-function phenotypes associated with protein
suppression without requiring a priori knowledge of gene functions or cellular pathways.
Glioblastoma multiforme (GBM) is an excellent cell-based model for identifying these
essential genes. GBM is a high-grade brain malignancy arising from astrocytes (Iorns et al.,
2007), and despite aggressive surgical approaches, optimized radiation therapy regimens, and the
application of cytotoxic chemotherapies, the median survival of patients with GBM from time of
diagnosis is approximately 12 months, which has not changed in decades (Mischel and
Cloughesy, 2003). Annotation of these essential genes in this glioma cell-based system should
facilitate the drug discovery process by rapidly identifying novel targets (Short et al., 1999;
Stein, 1979; Weller et al., 1998).
We implemented a siRNA screen utilizing a “druggable” genome library of 16,560
siRNAs targeting 5,520 unique human genes to identify the genes and pathways essential for
This article has not been copyedited and formatted. The final version may differ from this version.Molecular Pharmacology Fast Forward. Published on September 25, 2009 as DOI: 10.1124/mol.109.058024
at ASPE
T Journals on January 2, 2019
molpharm
.aspetjournals.orgD
ownloaded from
MOL 58024
5
GBM cell survival in the T98G glioma cell line. We employed a druggable genome siRNA
library, which comprises siRNAs targeting gene products that are potential drug targets or are
disease modifying, such as ion channels, transporters, receptors and protein kinases, to facilitate
the target identification process (Hopkins and Groom, 2002; Overington et al., 2006; Russ and
Lampel, 2005). We also developed two rigorous, orthogonal statistical analysis algorithms that
combined reproducibility with magnitude of effect to finalize the hit list. To our knowledge, this
is the first study utilizing a systematic, unbiased siRNA-based screen on glioma cells, and the
results of this study should broaden our understanding of the core genes and pathways that are
essential for glioma cell survival and possibly other cell types. Indeed, we identified the
proteasome as a highly represented essential complex in our glioma cell model, and we highlight
the potential significance of proteasome inhibition, both by small molecule inhibition and
therapeutic RNA interference, in glioma and other cell types.
MATERIALS AND METHODS
Reagents
DharmaFECT 2 transfection reagent and the siGENOME Non-Targeting siRNA #1 were
purchased from Dharmacon (Lafayette, CO). CellTiter-Blue Cell Viability Assay was from
Promega (Madison, WI). The Silencer Druggable Genome siRNA Library (Version 1.1) and 5x
siRNA resuspension buffer were from Ambion (Austin, TX). Tissue culture-treated 384-well
microtiter plates were from Greiner Bio-One (GmbH, Frickenhausen, Germany). OptiMEM,
McCoy’s 5A Medium (modified), DMEM, EMEM, PBS, and Hoechst 33342 were from
Invitrogen (Carlsbad, CA). ECL Western blotting substrate was from Pierce Biotechnology
(Rockford, IL). The well-characterized proteasome subunit -type 4 (PSMB4) mouse
This article has not been copyedited and formatted. The final version may differ from this version.Molecular Pharmacology Fast Forward. Published on September 25, 2009 as DOI: 10.1124/mol.109.058024
at ASPE
T Journals on January 2, 2019
molpharm
.aspetjournals.orgD
ownloaded from
MOL 58024
6
monoclonal antibody (ab55628) was from Abcam (Cambridge, UK) (Catlow et al., 2007).
Proteasome subunit beta 1 mouse monoclonal antibody (sc-58409), proteasome subunit beta 2
mouse monoclonal antibody (sc-58410), and proteasome subunit beta 5 goat polyclonal antibody
(sc-55009) were from Santa Cruz Biotechnology (Santa Cruz, CA). Anti- -tubulin antibody
(CLT9003) was from Cedarlane Laboratories (Burlington, Ontario, Canada) and anti-PARP
(9542) was from Cell Signaling Technology (Beverly, MA). All other reagents were from
Sigma-Aldrich (St. Louis, MO) unless otherwise noted.
Cell culture and treatments
The cell lines U87, T98G, U373, A172, and A549 were obtained from the American
Type Culture Collection (ATCC, Manassas, VA). LN-Z308 and LN-Z428 were generously
provided by Dr. Nicolas de Tribolet (Lausanne, Switzerland). Human astrocytes (HAs) and
human umbilical vein endothelial cells (HUVECs) were obtained from ScienCell Research
Laboratories (San Diego, CA). T98G, U87, and U373 cells were maintained in EMEM
supplemented with Earle's basic salt solution, nonessential amino acids, sodium pyruvate, 1% L-
glutamine, 100 U/mL penicillin/streptomycin (Invitrogen) and 10% fetal bovine serum (Cellgro,
Manassas, VA). A172, LN-Z428, and LN-Z308 were maintained in -minimal essential medium
supplemented with L-glutamine. HAs were grown in Astrocyte Growth Medium and HUVECs
in Endothelial Cell Medium (ScienCell Research Laboratories).
MG-132 (Calbiochem, La Jolla, CA) was dissolved into dimethyl sulfoxide (DMSO) and
medium (final DMSO concentration 0.5%) for cell treatment and added 24 hr after cell plating.
Cells were incubated in a humidified incubator at 37ºC with 5% CO2.
This article has not been copyedited and formatted. The final version may differ from this version.Molecular Pharmacology Fast Forward. Published on September 25, 2009 as DOI: 10.1124/mol.109.058024
at ASPE
T Journals on January 2, 2019
molpharm
.aspetjournals.orgD
ownloaded from
MOL 58024
7
A Zoom MV automated microplate dispenser (Titertek, Huntsville, AL) was used to
dispense the cells, transfection reagent, and OptiMEM. V-Prep high-speed automated precision
microplate pipetting station (Velocity 11, Menlo Park, CA) was used to make the siRNA-
OptiMEM-DharmaFECT2 complexes, replace medium and add CellTiter-Blue. For 384-well
experiments, fluorescence readout for cell viability from the CellTiter-Blue viability assay was
measured with a SpectraMax M5 multi-detection microplate reader and absorbance
spectrophotometer (Molecular Devices, Sunnyvale, CA), equipped with a Molecular Devices
StakMax robotic plate handler, was used to read cell viability. Abgene SEAL-IT 100 automated
microplate sealer was used to reseal siRNA library plates. Cellomics ArrayScan II HCS system
(Thermo Scientific, Pittsburgh, PA) was used for cell counting and screening validation studies.
Lysate preparation and Western blotting
Western blotting was conducted as previously described (Tomko and Lazo, 2008).
Briefly, 6-well plates containing T98G, U87, U373, LN-Z308, LN-Z428, and A172 were placed
on ice, washed with ice-cold PBS, collected by scraping into a modified
radioimmunoprecipitation buffer (Bansal and Lazo, 2007), and incubated on ice for 30 min with
frequent vortexing. Lysates were cleared by centrifugation at 13,000 x g for 18-20 min. Relative
protein concentrations of each sample were determined using the Bio-Rad protein assay kit
(BioRad). Equivalent protein amounts (30 µg) from cell lysates were resolved on 12% and 16%
SDS-polyacrylamide gels and transferred to nitrocellulose membranes. Membranes were probed
with anti- -tubulin, anti-PSMB4, anti-PSMB1, anti-PSMB2, anti-PSMB5 or poly (ADP-ribose)
polymerase (PARP) antibodies. -tubulin was used as a loading control. Positive antibody
reactions were visualized using peroxidase-conjugated secondary antibodies (Jackson
This article has not been copyedited and formatted. The final version may differ from this version.Molecular Pharmacology Fast Forward. Published on September 25, 2009 as DOI: 10.1124/mol.109.058024
at ASPE
T Journals on January 2, 2019
molpharm
.aspetjournals.orgD
ownloaded from
MOL 58024
8
ImmunoResearch, West Grove, PA) and chemiluminescence by ECL Western Blotting Substrate
(Pierce) according to manufacturer's instructions, and membranes were then exposed to
FujiFILM LAS-3000.
siRNA sequences
The 5,520 druggable targets of the Silencer Druggable Genome siRNA Library
comprised three unique siRNA duplexes targeting each gene. The sequences for siRNA duplexes
targeting PSMB4 (Ambion) were: duplex A sense GCUAUAGUCCUAGAGCUAUtt and
antisense AUAGCUCUAGGACUAUAGCtg; duplex B sense
GCUAUUCAUUCAUGGCUGAtt and antisense UCAGCCAUGAAUGAAUAGCtc; duplex C
sense GAUGGACACAGCUAUAGUCtt and antisense GACUAUAGCUGUGUCCAUCtc. The
sequence for the siGENOME Non-Targeting siRNA #1 (negative control) was
UAGCGACUAAACACAUCAA. Sequences for the siRNAs targeting PSMA3, DDX39, and
RAN are published in Supplementary Table S9.
siRNA transient transfection
T98G cells were wet-reverse transfected with the siRNA library at a final concentration
of 20 nM/target in a one-gene, one-well format. This concentration of siRNA was selected to
generate the maximum transfection efficiency based on optimization studies using fluorescent
siRNA and loss of sentinel protein, namely lamin A/C. For each siRNA target, 1.56 µL of 833.3
nM siRNA was combined with 0.06 µL DharmaFECT2 transfection reagent and 12.38 µL of
OptiMEM. Fifty-one µL/450 cells of T98G cell suspension was then added directly onto the
siRNA complexes. siRNA complexes were prepared with DharmaFECT2 transfection reagent in
This article has not been copyedited and formatted. The final version may differ from this version.Molecular Pharmacology Fast Forward. Published on September 25, 2009 as DOI: 10.1124/mol.109.058024
at ASPE
T Journals on January 2, 2019
molpharm
.aspetjournals.orgD
ownloaded from
MOL 58024
9
pools of three unique siRNA duplexes per well, one gene per well across sixteen 384 well siRNA
library plates. siRNA complexes were prepared at 50 nM per well, and the addition of cell
suspension (20-25 min after complex preparation) to the complexes brought the final siRNA
concentration to 20 nM per well. Five hr later, medium containing siRNA complexes was
removed and replaced with fresh complete medium. Cells were incubated for 96 hr to allow for
gene silencing in a humidified incubator at 37ºC with 5% CO2 with a medium change after 48 hr
before measuring cell viability with the CellTiter-Blue viability assay and the ArrayScan II.
Reverse transcription polymerase chain reaction (RT-PCR)
T98G cells transfected with scramble siRNA or PSMB4 siRNA were washed with PBS once and
the total RNA isolated and purified using RNeasy® Mini Kit following the manufacturer’s
instructions (Qiagen, Valencia, CA). The SuperScriptTM III One-Step RT-PCR System with
Platinum® Taq DNA Polymerase (Invitrogen, Carlsbad, CA) was used for cDNA synthesis and
PCR amplification. Total RNA (100 ng) was reverse-transcribed to cDNA and the synthesized
cDNA was amplified using MycyclerTM thermal cycler (Bio-Rad, Hercules, CA) in 25 l
reaction mixture containing SuperScriptTM III RT/Platinum® Taq mix, 2x reaction mix (a buffer
containing 0.4 mM of each of dNTP, 3.2 mM MgSO4), and 0.2 M of sense and anti-sense
primers. The sequences of the primers were: PSMB4 forward 5’ –
CCTCAGTCCTCGGCGTTAAG- 3’, reverse 5’ -GCATGGTACTGTTGTTGACTCG- 3’;
PSMB5 forward 5’ –GTGAAGGGAACCGGATTTCAG -3’, reverse 5’ –
CTCGACGGGCCAGATCATAG- 3’; PSMB2 forward 5’ –TACCTCATCGGTATCCAAG- 3’,
reverse 5’ –ATATCCATAGTCACC- 3’; actin forward 5’ -AAGAGAGGCATCCTCACCCT-
3’, reverse 5’ –TACATGGCTGGGGTGTTGAA- 3’. Cycling conditions were: cDNA synthesis
This article has not been copyedited and formatted. The final version may differ from this version.Molecular Pharmacology Fast Forward. Published on September 25, 2009 as DOI: 10.1124/mol.109.058024
at ASPE
T Journals on January 2, 2019
molpharm
.aspetjournals.orgD
ownloaded from
MOL 58024
10
50oC for 30 min (1 cycle), denaturation at 95oC for 5 min (1 cycle), PCR amplification of 95oC
for 1 min, 60oC (for PSMB4 and PSMB5) or 52oC (for PSMB2 and actin) for 1 min, and 72oC
for 1 min (25 cycles), final extension at 72oC for 7 min (1 cycle). The PCR products were
confirmed using 2% agrose gel stained with ethidium bromide.
Data analysis
The siRNA screen was performed 8 times over 8 separate weeks. Relative fluorescence
units from each targeted siRNA well were normalized to in-plate controls that had received a
scrambled siRNA sequence (negative control), which then permitted plate to plate comparisons
of cell viability. To analyze the screening data, we derived an objective statistical analysis
method using two orthogonal statistical methods:
In the first method, cell viabilities for each screen were sorted in ascending order, and
the top 2.5 percentile or 138 genes (i.e. genes that when inhibited caused greatest survival
inhibition) for each of the 8 screens were binned. Genes present in at least 5 of 8 bins were
considered for further analysis.
In the second method, outlier values were detected and removed prior to further analysis.
An outlier was defined as an observation that was distant from other data and may be generated
by unexpected system errors (Hawkins, 1980). We employed this rigorous methodology because
outliers shift the mean and variance calculated from the observations so that the widely-used Z-
scores and other mean-variance-based outlier detection methods are not suitable to detect the
“true” outliers (Iglewicz and Hoaglin, 1993). The Median of the Absolute Deviation (MAD)
method, which is resistant to outliers in the samples, has been implemented to detect the outliers
of the gene viability replicates. The method is described herein:
This article has not been copyedited and formatted. The final version may differ from this version.Molecular Pharmacology Fast Forward. Published on September 25, 2009 as DOI: 10.1124/mol.109.058024
at ASPE
T Journals on January 2, 2019
molpharm
.aspetjournals.orgD
ownloaded from
MOL 58024
11
(1) Estimate the MAD of each gene viability replicates, defined as
iiji XXMedianMAD ~
Xij was the viability on the ith gene and jth screen, and iX~ was the median of the 8 viability
replicates of the ith gene from the eight survival gene screens.
(2) Calculate the MAD-score of each gene viability sample on the ith gene and jth screen, defined
as:
i
iijij MAD
XXscoreMAD
)~(6745.0
(3) The gene viability sample was marked as outlier when the absolute value of its MAD-score
was greater than 3.5. Genes selected by both the binning method and MAD method were chosen
as screening hits. Two-tailed t-tests were used to compare suppression of cell viability from
unpooled and pooled siRNA sequences to scrambled siRNA sequences (negative control).
Pathway and network analysis
Pathway and functional network analyses were performed with Ingenuity Pathways
Analysis (IPA, Ingenuity Systems). The gene list consisting of RefSeq accession numbers was
uploaded to this web-based application and used for generating biological networks. Fisher’s
exact test was used with = 0.05 to calculate the statistical probability for the correct functional
assignment of the survival genes.
RESULTS
Druggable genome-wide siRNA screen
This article has not been copyedited and formatted. The final version may differ from this version.Molecular Pharmacology Fast Forward. Published on September 25, 2009 as DOI: 10.1124/mol.109.058024
at ASPE
T Journals on January 2, 2019
molpharm
.aspetjournals.orgD
ownloaded from
MOL 58024
12
We performed a druggable genome-wide siRNA screen to identify the genes essential for
glioma cell survival. This screen was performed in eight replicates over eight separate weeks,
and cell viability values were normalized to in-plate controls. We designed the assay to ensure
maximal siRNA transfection, which resulted in some transfection-associated cytotoxicity and a
median cell viability of 79% for all 5,520 genes. Fifty-eight genes (Supplementary Table S1) and
138 genes (Supplementary Table S2) were identified as reproducibly essential genes for glioma
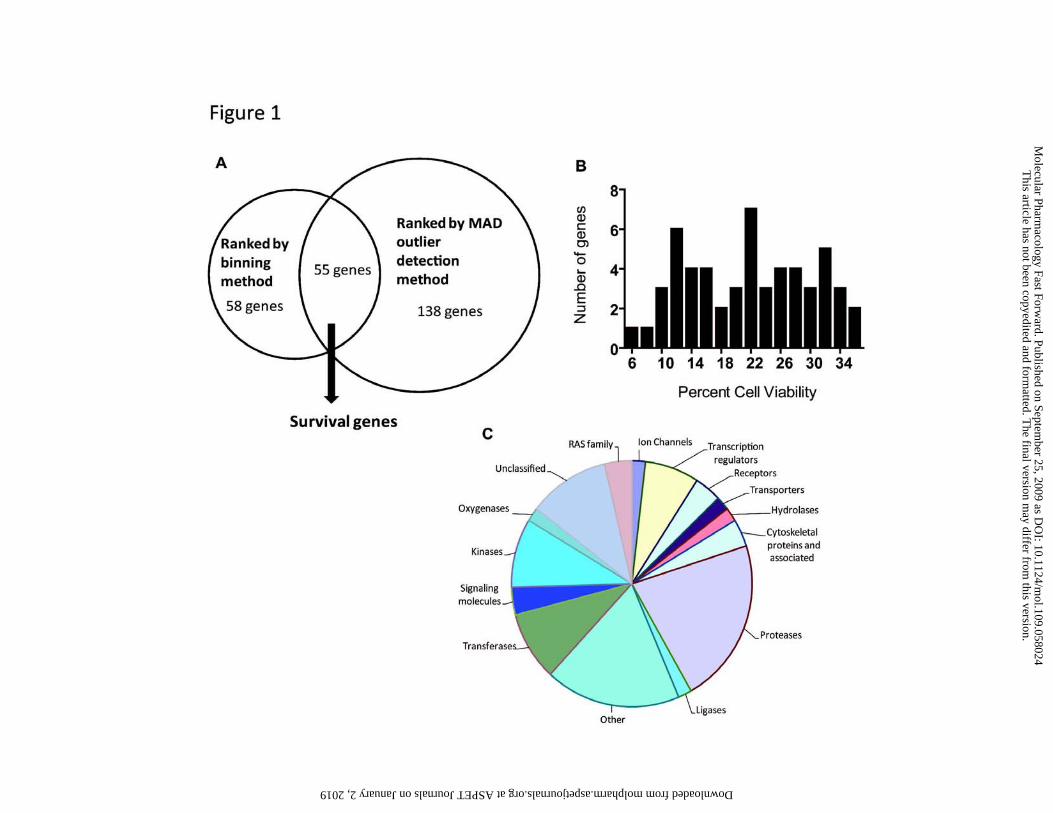
cell viability using the binning and MAD methods, respectively (Figure 1A). Of the total 44,160
targeting siRNA reactions, the MAD method classified 1,189 (2.7%) values as outliers. A
composite set of 55 genes, defined as “survival genes”, were present in both the binned and
MAD gene lists (Table 1, Figure 1A), with TNFRSF10B, DPYSL4, and AGA being selected by
only the binning method (Supplementary Table S3). Histogram analysis for this set of survival
genes revealed a cell viability distribution between 6% and 35%, which was defined as
significant toxicity (Fig. 1B). For a more detailed listing of our survival genes, MAD method
results, and binning method results, refer to the Supplementary Tables S4, S5, and S6,
respectively.
Survival genes
The set of 55 survival genes was classified by shared molecular and biological
functionality (Table 1) (Mi et al., 2007). This classification scheme revealed enriched protein
classes among the survival genes, including proteases, kinases, and transferases (Figure 1C).
Interestingly, 12 of 55 survival genes (22%) were components of the 20S and 26S proteasome
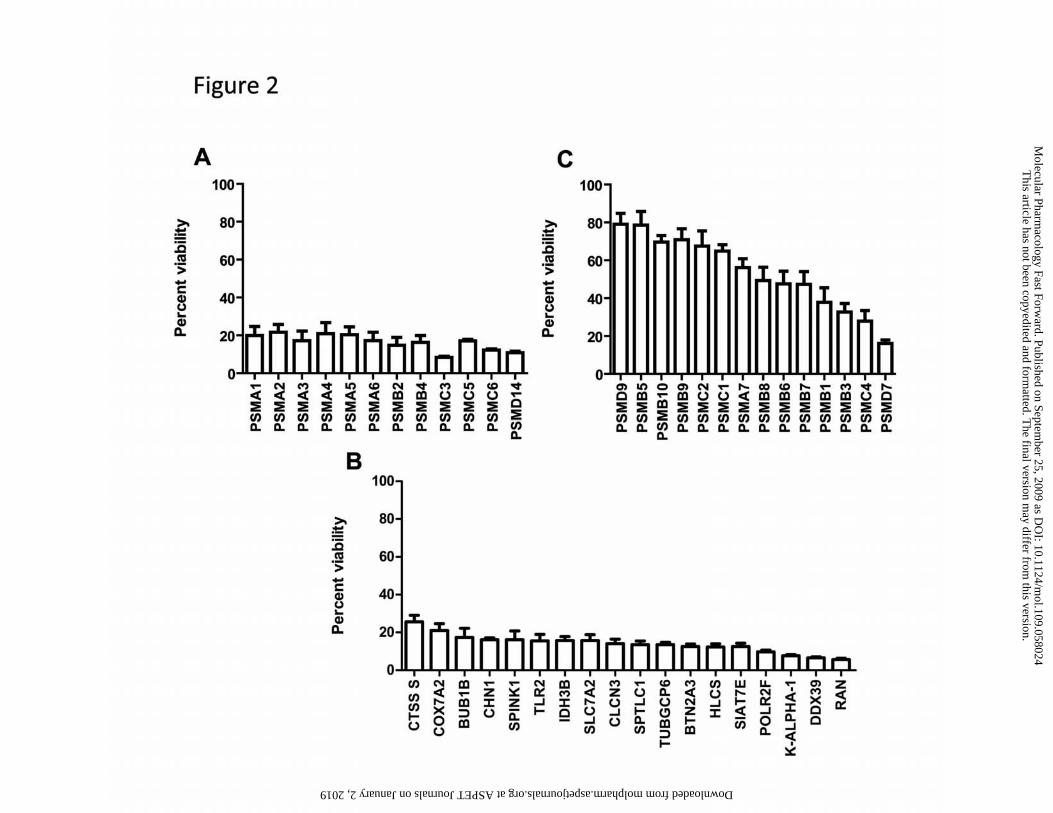
complexes. These 12 proteasome components and several other survival genes were re-assayed
using the pooled targeting siRNAs (Figures 2A, 2B). Among the most growth inhibitory siRNAs
This article has not been copyedited and formatted. The final version may differ from this version.Molecular Pharmacology Fast Forward. Published on September 25, 2009 as DOI: 10.1124/mol.109.058024
at ASPE
T Journals on January 2, 2019
molpharm
.aspetjournals.orgD
ownloaded from
MOL 58024
13
were RAN (93.3%), DDX39 (92.9%), K-ALPHA-1 (91.9%), PSMC3 (91.2%), PSMD14
(88.2%), and PSMB2 (85.2%). The druggable genome used in our study contained siRNAs
targeting 26 proteasome components, and because of the high representation of proteasome
components in the survival gene list (12 of 55 genes), we re-assayed siRNAs targeting the 14
remaining non-survival gene proteasome components (Fig. 2C). Only PSMB3, PSMC4, and
PSMD7 siRNA induced >60% decrease in cell viability.
To further provide clinical significance to our list of 55 candidate survival genes, we
focused our efforts on survival genes that were reportedly overexpressed in primary or secondary
GBM tissue samples from the Oncomine cancer profiling gene database or previous reports
(Parsons et al., 2008) and that were known or potential targets of small molecule inhibitors. Of
interest were a number of proteasome components and other genes overexpressed in GBM
(Supplementary Table S7). These included 10 of 12 survival gene proteasome components as
well as targets that have been previously implicated in gliomagenesis, cell proliferation, and
cancer invasion, including AKT3, and CLCN3.
Validation of survival genes
We validated the survival genes by re-assaying several candidate siRNAs using the
unpooled siRNA sequences. Our validation criteria demanded that at least two of three unpooled
siRNA sequences suppressed cell viability. The survival genes PSMA3, PSMB4, PSMD14,
PSMC3, RAN, and DDX39 were chosen for this validation (Supplementary Table S7). PSMA3,
PSMD14, PSMC3, and RAN revalidated with all three individual sequences; PSMB4 revalidated
with two sequences; DDX39 revalidated with only one sequence, suggesting a possible off-target
effect (Supplementary Fig. S2).
This article has not been copyedited and formatted. The final version may differ from this version.Molecular Pharmacology Fast Forward. Published on September 25, 2009 as DOI: 10.1124/mol.109.058024
at ASPE
T Journals on January 2, 2019
molpharm
.aspetjournals.orgD
ownloaded from
MOL 58024
14
Suppression of cell viability by PSMB4 silencing
PSMB4 was chosen for further validation, because of its role as a proteasome component,
the potential clinical interest of proteasome inhibitors, and its reported overexpression in GBM.
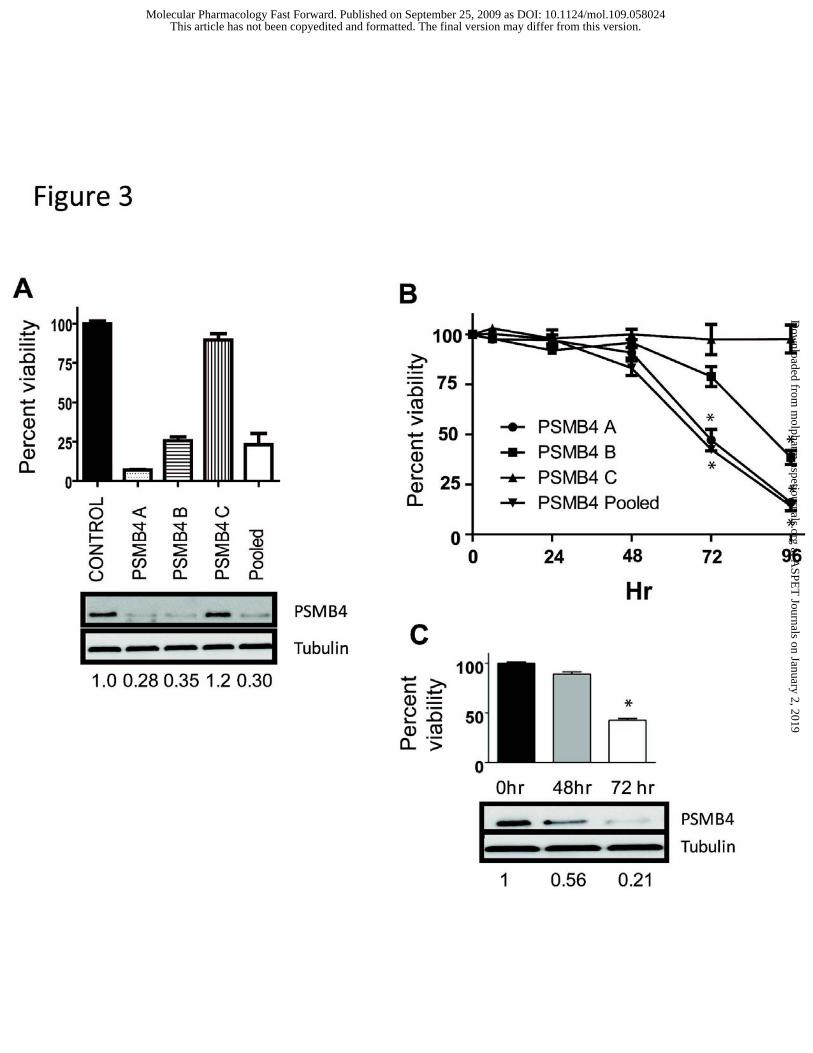
To further validate the on-target mechanism of the PSMB4 siRNA, we demonstrated that
transfection with unpooled sequences A, B, and pooled but not C induced protein knockdown
(Fig. 3A). This result was consistent with cell viability data for sequences A (p < 0.0001), B (p =
0.0002), C (p = 0.87), and pooled (p < 0.0001), where sequences A, B, and pooled resulted in
significant suppression of cell viability while sequence C did not. Furthermore, cell viability was
measured at 24 hr time-points over a 96 hr period to determine the effect of siRNA transfection
of the pooled and unpooled sequences (Fig. 3B). Protein knockdown was also observed at 48 and
72 hr (Fig. 3C) and appeared to occur before induction of significant cell death.
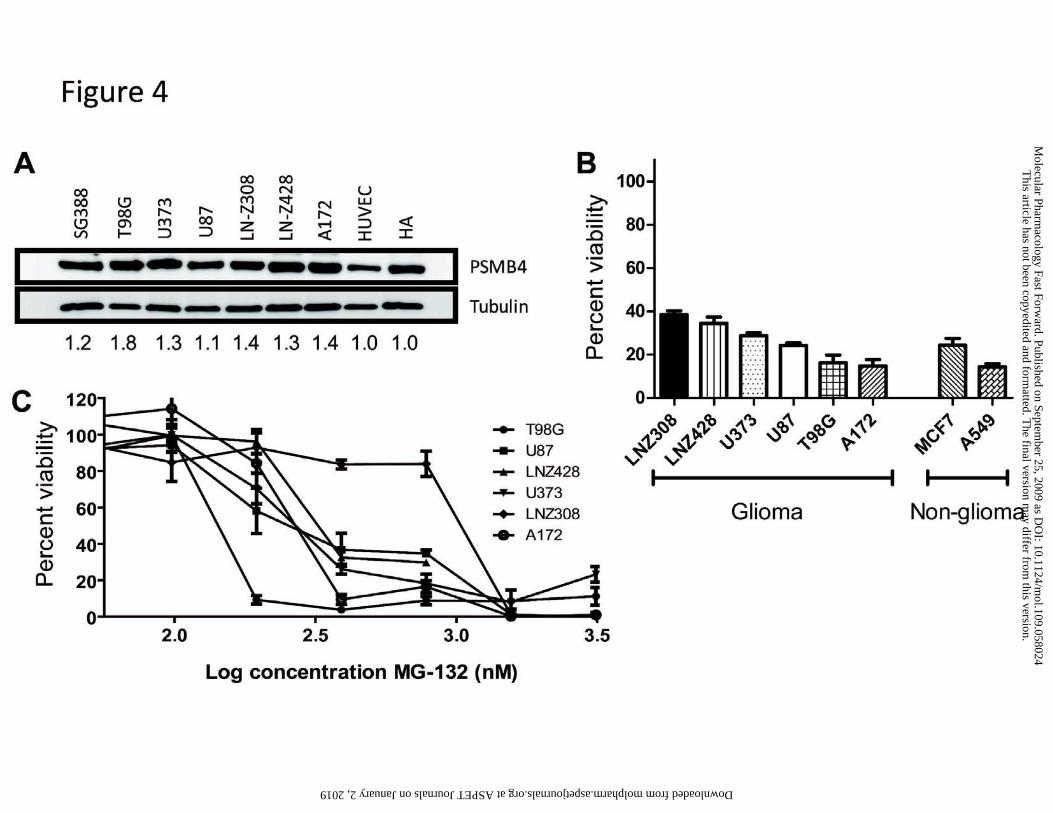
We assessed the expression of PSMB4 in a panel of glioma cell lines versus HUVEC and
HA control cell lines (Fig. 4A). The glioma cell lines SG388, which was a low passage
institutionally derived glioma cell line, T98G, U373, U87, LN-Z308, LN-Z428, and A172 on
average expressed increased levels of PSMB4 when compared to HUVEC and HA cells. It was
notable that T98G cells had almost two-fold more PSMB4 than either HUVEC or HA cells.
We also measured PSMB1, PSMB2 and PSMB5 protein levels in all nine cell lines
(Supplemental Figure 2). PSMB1 was not markedly elevated in any tumor line compared to
HUVEC. Only LN-Z428 cells had elevated PSMB2 and PSMB5 compared to HUVEC and
astrocytes. Therefore, PSMB4 appeared to have a somewhat different expression profile
compared to these other proteasomal subunits.
This article has not been copyedited and formatted. The final version may differ from this version.Molecular Pharmacology Fast Forward. Published on September 25, 2009 as DOI: 10.1124/mol.109.058024
at ASPE
T Journals on January 2, 2019
molpharm
.aspetjournals.orgD
ownloaded from
MOL 58024
15
We next assessed the generality of this cytotoxic effect in a series of glioma and non-
glioma cell lines (Fig. 4B). Of these eight cell lines, LN-Z308 (38.4%) and LN-Z428 (34.5%)
were most resistant to cell death with this siRNA, while A549 (14.3%) and A172 (14.7%) were
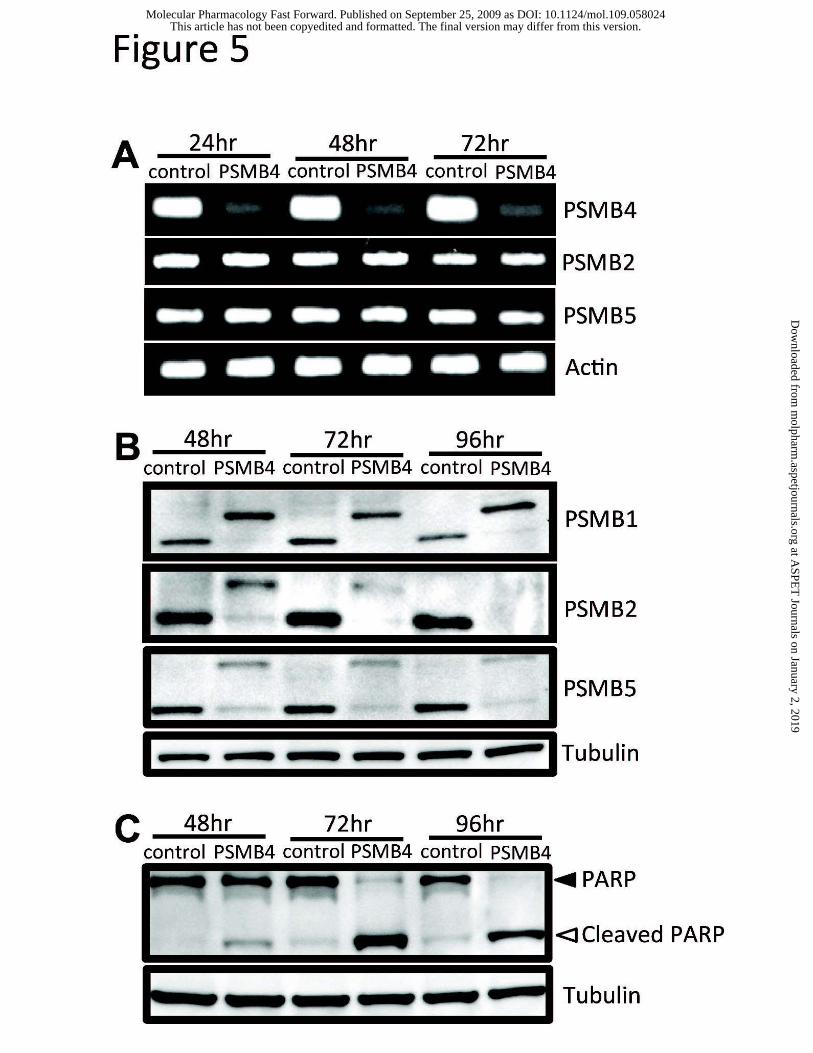
most sensitive at 96 hr. We next examined the mRNA levels of PSMB4 and two other
subunits, PSMB2 and PSMB5, in cells after PSMB4 siRNA to assess the specificity of the
siRNA depletion. As anticipated we found PSMB4 mRNA was markedly decreased 48, 72 and
96 hr after transfection with PSMB4 siRNA (Fig. 5A). We observed no decrease in PSMB2 or
PSMB5 mRNA levels. Interestingly, PSMB1, PSMB2, and PSMB5 protein levels decreased in
T98G cells 48, 72 and 96 hr after transfection with PSMB4 siRNA and a new higher molecular
mass band appeared for each subunit (Fig 5B). These bands migrate as the previously
published precursor forms (Hirano et al., 2008; Nandi et al., 1997). We also probed whether or
not PSMB4 siRNA induce an apoptotic-like process using (PARP) cleavage. As indicated in the
Figure 5C, PARP was clearly cleaved at 72 and 96 hr with some PARP cleavage at 48 hr.
Proteasome inhibitor sensitization
We used the prototypic proteasome inhibitor MG-132 to pharmacologically evaluate the
essential functionality of the proteasome in glioma cells. The glioma cell lines were treated with
increasing concentrations of the compound for 48 hr, and cell viability was calculated as a
percentage of cells treated with vehicle (0.5% DMSO). All cell lines were sensitive to MG-132
in the nanomolar range, and the 50% inhibitory concentrations (IC50) ranged from 140 – 973 nM
(Fig. 4C). It is interesting that LNZ-308 cells were rather resistant to both MG-132 and PSMB4
siRNA growth inhibition, while T98G cells seemed more sensitive to both MG-132 and PSMB4
siRNA.
This article has not been copyedited and formatted. The final version may differ from this version.Molecular Pharmacology Fast Forward. Published on September 25, 2009 as DOI: 10.1124/mol.109.058024
at ASPE
T Journals on January 2, 2019
molpharm
.aspetjournals.orgD
ownloaded from
MOL 58024
16
Protein-protein interaction networks
We analyzed our survival gene data with a knowledge-based protein-protein interaction
network to identify critical biological networks and processes. This analysis revealed the most
enriched cellular functions, which were: dermatological disease, infectious disease, embryonic
development, cellular compromise, cell-to-cell signaling and interaction, cellular function and
maintenance, inflammatory response, nervous system development, cell morphology,
gastrointestinal disease, and cancer, and are ordered according to statistical significance
(Supplementary Table S9). Twenty of the survival genes were classified as genes previously
implicated in cancer, including the survival genes AKT3 and CLCN3.
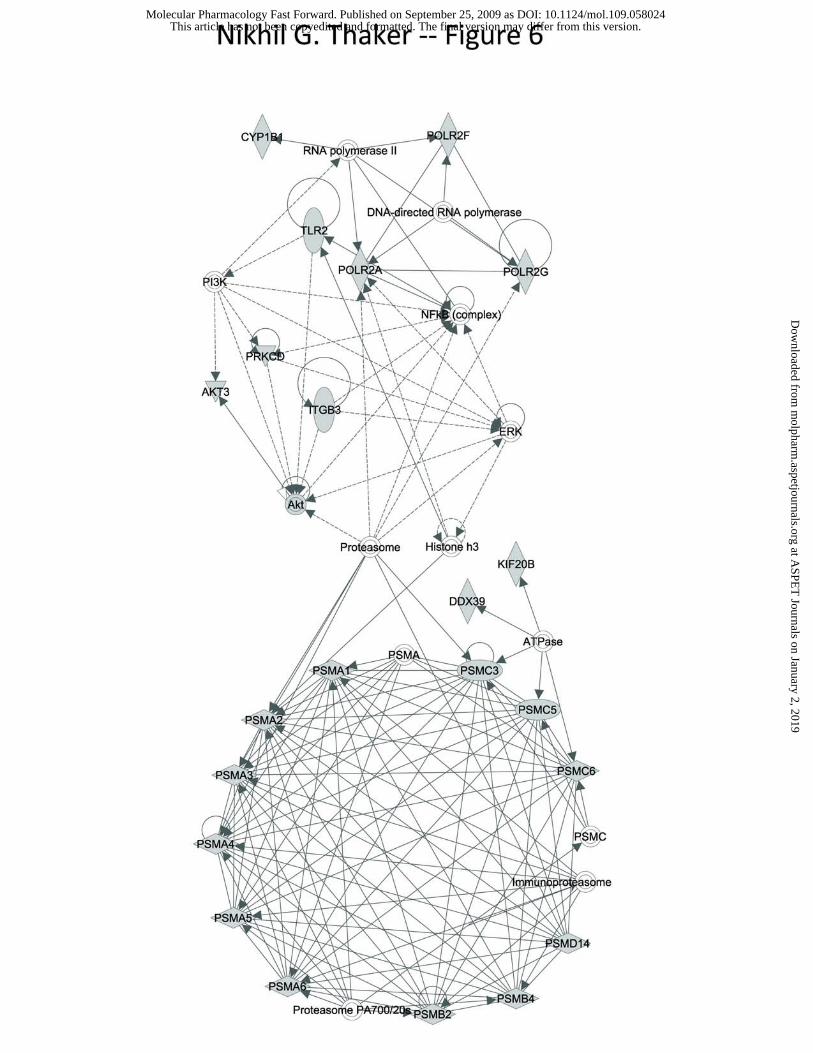
We then mapped clusters of survival genes to functional networks. Within these large
networks, genes clustered around specific centers. In a network that consisted of genes related to
dermatological diseases, infectious disease, and embryonic development, the network of genes
centered on the proteasome complex and nuclear factor- B (NF- B) (Fig. 6).
We also organized the set of survival genes into the most highly represented cellular
pathways (Supplementary Fig. S3). These pathways included protein ubiquitination, purine
metabolism, nucleotide excision repair, pyrimidine metabolism, and NF- B, in order of
statistical significance. Not surprisingly, the survival genes comprised several constituents of the
protein ubiquitination and NF- B pathways.
DISCUSSION
Identifying the genes that are essential for cell survival may facilitate the discovery of
opportunistic molecular targets by uncovering the molecular weaknesses in cancer cell biology.
This article has not been copyedited and formatted. The final version may differ from this version.Molecular Pharmacology Fast Forward. Published on September 25, 2009 as DOI: 10.1124/mol.109.058024
at ASPE
T Journals on January 2, 2019
molpharm
.aspetjournals.orgD
ownloaded from
MOL 58024
17
Large-scale siRNA screening can facilitate this effort by providing a platform to systematically
assess the loss-of-function phenotypes associated with protein knockdown of thousands of genes.
We developed a semi-automated high-throughput siRNA screen to identify survival genes in the
T98G glioma cell line and employed a druggable genome to focus our efforts on targets that may
be candidates for small molecule inhibition. We identified 55 survival genes through the use of
two orthogonal statistical methods.
Identification of several known cancer targets provided confidence that our approach was
sufficiently robust to identify novel regulators of cell survival. AKT has been implicated in GBM
(Gallia et al., 2009) and is a known regulator of cell proliferation, differentiation, apoptosis, and
tumorigenesis. AKT3 is a gene in the AKT family (Yang et al., 2004) and has been identified as a
survival gene. Furthermore, we identified the chloride channel 3 (CLCN3) as an essential gene,
and inhibition with chlorotoxin has been previously explored as a treatment for glioma
(Soroceanu et al., 1998).
High-throughput screening, however, is inevitably associated with false positive and false
negative results. Our motivation was not to capture all of the essential genes for cell survival, but
rather to use a rigorous algorithm to identify a few genes that could be further validated for
future targeting. We speculate there are several reasons why some well-known cancer survival
genes were not identified by our screen. First, the druggable genome comprises targets that are
candidates for small molecule inhibition, and some of the putative cancer cell survival genes,
such as constituents of the Rb1 and EGFR/PI3K/mTOR pathways, are not all targeted by this
library. Additionally, our goal was to implement an unbiased screen to uncover previously
unknown regulators of cell survival. Furthermore, inherent limitations of this siRNA technique
may also result in false negative results. Protein knock-down depends on target protein and/or
This article has not been copyedited and formatted. The final version may differ from this version.Molecular Pharmacology Fast Forward. Published on September 25, 2009 as DOI: 10.1124/mol.109.058024
at ASPE
T Journals on January 2, 2019
molpharm
.aspetjournals.orgD
ownloaded from
MOL 58024
18
mRNA transcript stability, turnover, and overall abundance. Cancer cells may be “addicted” to
specific oncogenic pathways that comprise well known cancer cell survival genes, and siRNA-
induced protein knockdown may not be sufficient to suppress protein levels below the threshold
for inducing cell death. Thus, these targets would not be identified by this screening strategy.
A major challenge in analyzing the large data set generated by genome-scale screening is
the need to develop and implement rigorous statistical algorithms. We constructed an analysis
method that combined screening reproducibility with magnitude of effect, and we ensured a high
stringency threshold by employing two orthogonal statistical strategies. First, a binning method
was applied to rank-ordered cell viabilities to select only those hits that consistently reproduced
in the top 2.5 percentile of genes. This method ensured that only the most cytotoxic siRNAs were
selected. Second, we adapted and applied an outlier detection (MAD) method to the screening
data. Outliers shift the mean and variance of the observations so that the widely used Z-scores
and other mean-variance-based outlier detection methods are not suitable to detect these values
(Iglewicz and Hoaglin, 1993; Zhang et al., 1999). Thus, we employed the MAD analysis to
remove such outliers prior to calculating the target specific cell viability. Together, these two
orthogonal analysis strategies facilitated the selection of a small number of high-confidence hits
from the genome-scale siRNA library, although the hit threshold can be dynamically regulated
depending on the desired number of hits.
Of the 55 survival genes we identified in this study, 22% were constituents of the
proteasome complex, and we selected PSMB4 to further illustrate the validity of the proteasome
as a target for survival inhibition. The proteasome is a multicatalytic complex that degrades most
intracellular proteins, including proteins involved in cell cycle regulation and apoptosis
(Voorhees et al., 2003). Remarkably, studies have reported a selective susceptibility of
This article has not been copyedited and formatted. The final version may differ from this version.Molecular Pharmacology Fast Forward. Published on September 25, 2009 as DOI: 10.1124/mol.109.058024
at ASPE
T Journals on January 2, 2019
molpharm
.aspetjournals.orgD
ownloaded from
MOL 58024
19
transformed cells to proteasome inhibition (Voorhees et al., 2003). For instance, transformed
fibroblasts were 40 times more susceptible to proteasome inhibition than primary fibroblasts
(Orlowski et al., 1998). Although the molecular mechanisms of this differential susceptibility are
still unknown, possible explanations include increased susceptibility of actively proliferating
cells and the de-regulation of the ubiquitin-proteasome pathway in transformed cells (Voorhees
et al., 2003). Future research efforts will focus on the potential selective susceptibility of glioma
cells to proteasome inhibition.
In our initial screen, systematic interrogation of 26 proteasome components with siRNA
conferred significant toxicity in 12 components, and decrease in PSMB4 protein occurred prior
to induction of significant cell death, which supported our hypothesis that cell death occurred as
a result of PSMB4 knockdown. PSMB4 siRNA transfection in a panel of glioma and non-glioma
cell lines demonstrated the generality of this cytotoxic effect. Depletion of many of the
remaining 14 proteasome components also resulted in significant growth inhibition. siRNA
against PSMB5, which is a target for the proteasome inhibitor bortezomib, did not produce as
large a decrease in growth inhibition as siRNA against PSMB4 or other subunits. One
explanation for the lack of a large growth inhibitor effect to PSMB5 siRNA could be could be
due to poor protein suppression with this siRNA. It is also interesting that PSMB4 siRNA caused
a marked reduction in PSMB1, PSMB2, and PSMB5 protein levels. Previous results (Hirano et
al., 2008) reveal that RNA interference against subunits can result in an accumulation of
intermediate forms. The proteasome subunits can stabilize each other another during assembly
and the loss of other mature subunits might be due to destabilizing of the -ring assembly
pathway, which could contribute to metabolic stress and loss of viability. Collectively, our
results suggest the presence of a sub-network of essential proteasome components that may be
This article has not been copyedited and formatted. The final version may differ from this version.Molecular Pharmacology Fast Forward. Published on September 25, 2009 as DOI: 10.1124/mol.109.058024
at ASPE
T Journals on January 2, 2019
molpharm
.aspetjournals.orgD
ownloaded from
MOL 58024
20
most essential for cell survival, proteasome structure or function, or may have the most rapid
protein turnover.
We demonstrated the cytotoxic effect of the prototypic proteasome inhibitor MG132 in a
panel of glioma cell lines, and previous studies have reported a similar effect with the
proteasome inhibitor bortezomib in various cell types (Fribley et al., 2004; Poulaki et al., 2007;
Yin D, 2005). Bortezomib is clinically valuable for multiple myeloma and mantle cell lymphoma
and has demonstrated antitumor activity in the National Cancer Institute tumor cell line screen,
in GBM cell lines (Yin et al., 2005), and in several xenograft models (Voorhees et al., 2003).
Nonetheless, it is generally believed that limited penetration through an intact blood-brain barrier
restricts its use in the treatment of glioma. Our results suggest that glioma treatment might be
enhanced with the development of second-generation proteasome inhibitors that can penetrate
the blood-brain barrier.
Another challenge in analyzing large genomic data sets is the identification of functional
groups within the gene set, which can identify related groups of genes in pathways that may not
be readily connected from the raw data. These network analyses have provided further
confirmation for our observation of the key role of the proteasome complex in cell survival.
Given the numerous substrates that are regulated by proteasome degradation, it is perhaps not
surprising that other survival genes would interact with this complex. For instance, NF- B is a
transcriptional factor that is activated in response to cellular stress and regulates the expression
of genes involved in cell proliferation and cell death. Normally the proteasome regulates cellular
levels of the inhibitor of NF- B, although NF- B activation can be disrupted by proteasome
inhibition, thus inducing apoptosis (Jung and Dritschilo, 2001). This previously reported role of
This article has not been copyedited and formatted. The final version may differ from this version.Molecular Pharmacology Fast Forward. Published on September 25, 2009 as DOI: 10.1124/mol.109.058024
at ASPE
T Journals on January 2, 2019
molpharm
.aspetjournals.orgD
ownloaded from
MOL 58024
21
the proteasome in NF- B activation lends further support for the molecular connectivity of this
network.
Biological functions represented by these survival genes included genes implicated in
dermatologic diseases, gastrointestinal diseases, and developmental processes. Previous
dermatologic studies have shown that the ubiquitin-proteasome pathway regulates levels of the
retinoic acid receptor in human keratinocytes (Boudjelal et al., 2000) and that topical proteasome
inhibitors could be clinically valuable for the treatment of inflammatory disorders (Arbiser et al.,
2005). Additionally, others have found that pathways altered in GBM are also altered in
colorectal cancers and may represent processes that underlie tumorigenesis (Lin et al., 2007;
Parsons et al., 2008). Recent studies have also highlighted the significance of developmental
processes in gliomagenesis (Bredel et al., 2005), and we have identified embryonic development
and nervous system development as significant biological functions in our survival genes.
Identification of these developmental processes in our screen suggests that genes implicated in
tumor development and gliomagenesis may also be essential for glioma cell survival. These
functional network analyses have facilitated the investigation of the molecular connectivity of
genes central to cell survival, and future research will scrutinize the mechanisms of cytotoxicity.
We have catalogued the genes that are most essential for cell survival using a high-
throughput screening approach and sophisticated statistical algorithms. This study provides a
broad understanding of the core genes and pathways that are generally essential for cell survival
and represents a first attempt to annotate the essential genes in a glioma cell-based system.
Although the identified genes may not represent glioblastoma-specific chemosensitivity nodes,
future research efforts using in vivo systems will reveal the selectively toxic effects of targeting
these genes in GBM and other cancers.
This article has not been copyedited and formatted. The final version may differ from this version.Molecular Pharmacology Fast Forward. Published on September 25, 2009 as DOI: 10.1124/mol.109.058024
at ASPE
T Journals on January 2, 2019
molpharm
.aspetjournals.orgD
ownloaded from
MOL 58024
22
In conclusion, siRNA is a powerful tool that provides an unbiased approach to the
systematic interrogation of loss-of-function cellular phenotypes. We implemented this approach
in a druggable genome-wide siRNA screen and identified several genes that positively regulate
cell survival. Of note, the proteasome complex appears to play a central role in cell survival in
vitro, and to our knowledge, this is the first study utilizing a systematic siRNA-based screen of
glioma cells and the first siRNA-based interrogation of the proteasome in glioma. Discovery of
novel genes that contribute to cell survival validates the utility of genome-wide genetic analysis
of tumors and opens new paradigms of brain tumor research.
This article has not been copyedited and formatted. The final version may differ from this version.Molecular Pharmacology Fast Forward. Published on September 25, 2009 as DOI: 10.1124/mol.109.058024
at ASPE
T Journals on January 2, 2019
molpharm
.aspetjournals.orgD
ownloaded from
MOL 58024
23
References
Arbiser J, Li X, Hossain C, Nagle D, Smith D, Miller P, Govindarajan B, DiCarlo J, Landis-
Piwowar K and Dou Q (2005) Naturally occurring proteasome inhibitors from Mate Tea
(Ilex paraguayensis) serve as models for topical proteasome inhibitors. J Invest Dermatol
125:207-212.
Bansal P and Lazo JS (2007) Induction of Cdc25B regulates cell cycle resumption after
genotoxic stress. Cancer Res 67:3356-3363.
Berns K, Hijmans EM, Mullenders J, Brummelkamp TR, Velds A, Heimerikx M, Kerkhoven
RM, Madiredjo M, Nijkamp W, Weigelt B, Agami R, Ge W, Cavet G, Linsley PS,
Beijersbergen RL and Bernards R (2004) A large-scale RNAi screen in human cells
identifies new components of the p53 pathway. Nature 428:431-437.
Boudjelal M, Wang Z, Voorhees JJ and Fisher GJ (2000) Ubiquitin/proteasome pathway
regulates levels of retinoic acid receptor {{gamma}} and retinoid X receptor {{alpha}}
in human keratinocytes. Cancer Res 60:2247-2252.
Bredel M, Bredel C, Juric D, Harsh G, Vogel H, Recht L and Sikic B (2005) Functional network
analysis reveals extended gliomagenesis pathway maps and three novel MYC-interacting
genes in human gliomas. Cancer Res 65:8679-8689.
Catlow K, Ashurst HL, Varro A and Dimaline R (2007) Identification of a gastrin response
element in the vesicular monoamine transporter type 2 promoter and requirement of 20 S
proteasome subunits for transcriptional activity. J Biol Chem 282:17069-17077.
This article has not been copyedited and formatted. The final version may differ from this version.Molecular Pharmacology Fast Forward. Published on September 25, 2009 as DOI: 10.1124/mol.109.058024
at ASPE
T Journals on January 2, 2019
molpharm
.aspetjournals.orgD
ownloaded from
MOL 58024
24
Fribley A, Zeng Q and Wang C-Y (2004) Proteasome inhibitor PS-341 induces apoptosis
through induction of endoplasmic reticulum stress-reactive oxygen species in head and
neck squamous cell carcinoma cells. Mol Cell Biol 24:9695-9704.
Gallia G, Tyler B, Hann C, Siu I, Giranda V, Vescovi A, Brem H and Riggins G (2009)
Inhibition of Akt inhibits growth of glioblastoma and glioblastoma stem-like cells. Mol
Cancer Ther 8:386-393.
Hawkins D (1980) Identification of Outliers. Chapman and Hall, London.
Hirano Y, Kaneko T, Okamoto K, Bai M, Yashiroda H, Furuyama K, Kato K, Tanaka K, and
Murata S (2008) Dissecting -ring assembly pathway of the mammalian 20S proteasome.
EMBO J 27:2204-2213.
Hopkins AL and Groom CR (2002) The druggable genome. Nat Rev Drug Discov 1:727-730.
Iglewicz B and Hoaglin D (1993) How to detect and handle outliers, the ASQC Basic References
in Quality Control: Statistical Techniques. ASQC.
Iorns E, Lord CJ, Turner N and Ashworth A (2007) Utilizing RNA interference to enhance
cancer drug discovery. Nat Rev Drug Discov 6:556-568.
Jung M and Dritschilo A (2001) NF- B signaling pathway as a target for human tumor
radiosensitization. Sem Rad Oncol 11:346-351.
Lin J, Gan CM, Zhang X, Jones Sn, Sjöblom T, Wood LD, Parsons DW, Papadopoulos N,
Kinzler KW, Vogelstein B, Parmigiani G and Velculescu VE (2007) A multidimensional
analysis of genes mutated in breast and colorectal cancers. Genome Res 17:1304-1318.
Mi H, Guo N, Kejariwal A and Thomas PD (2007) PANTHER version 6: protein sequence and
function evolution data with expanded representation of biological pathways. Nucl Acids
Res 35(suppl 1):D247-252.
This article has not been copyedited and formatted. The final version may differ from this version.Molecular Pharmacology Fast Forward. Published on September 25, 2009 as DOI: 10.1124/mol.109.058024
at ASPE
T Journals on January 2, 2019
molpharm
.aspetjournals.orgD
ownloaded from
MOL 58024
25
Mischel PS and Cloughesy TF (2003) Targeted molecular therapy of GBM. Brain Path 13:52-
61.
Nandi D, Woodward E, Ginsburg DB and Monaco JJ (1997) Intermediates in the formation of
mouse 20S proteasomes: implications for the assembly of precursor beta subunits. EMBO
J 16:5363-5375.
Orlowski RZ, Eswara JR, Lafond-Walker A, Grever MR, Orlowski M and Dang CV (1998)
Tumor growth inhibition induced in a murine model of human Burkitt's lymphoma by a
proteasome inhibitor. Cancer Res 58:4342-4348.
Overington JP, Al-Lazikani B and Hopkins AL (2006) How many drug targets are there? Nat
Rev Drug Discov 5:993-996.
Parsons DW, Jones S, Zhang X, Lin JC-H, Leary RJ, Angenendt P, Mankoo P, Carter H, Siu IM,
Gallia GL, Olivi A, McLendon R, Rasheed BA, Keir S, Nikolskaya T, Nikolsky Y,
Busam DA, Tekleab H, Diaz LA, Jr., Hartigan J, Smith DR, Strausberg RL, Marie SKN,
Shinjo SMO, Yan H, Riggins GJ, Bigner DD, Karchin R, Papadopoulos N, Parmigiani G,
Vogelstein B, Velculescu VE and Kinzler KW (2008) An integrated genomic analysis of
human glioblastoma multiforme. Science 321:1807-1812.
Poulaki V, Mitsiades CS, Kotoula V, Negri J, McMillin D, Miller JW and Mitsiades N (2007)
The proteasome inhibitor bortezomib induces apoptosis in human retinoblastoma cell
lines in vitro. Invest Ophthalmol Vis Sci 48:4706-4719.
Ramadan N, Flockhart I, Booker M, Perrimon N and Mathey-Prevot B (2007) Design and
implementation of high-throughput RNAi screens in cultured Drosophila cells. Nat
Protocols 2:2245-2264.
This article has not been copyedited and formatted. The final version may differ from this version.Molecular Pharmacology Fast Forward. Published on September 25, 2009 as DOI: 10.1124/mol.109.058024
at ASPE
T Journals on January 2, 2019
molpharm
.aspetjournals.orgD
ownloaded from
MOL 58024
26
Rich J and Bigner D (2004) Development of novel targeted therapies in the treatment of
malignant glioma. Nat Rev Drug Discov 3:430-446.
Russ AP and Lampel S (2005) The druggable genome: an update. Drug Discovery Today
10:1607-1610.
Sachse C and Echeverri CJ (2004) Oncology studies using siRNA libraries: the dawn of RNAi-
based genomics. Oncogene 23:8384-8391.
Short S, Mayes C, Woodcock M, Johns H and Joiner M (1999) Low dose hypersensitivity in the
T98G human glioblastoma cell line. Int J Radiat Biol 75:847-855.
Soroceanu L, Gillespie Y, Khazaeli MB and Sontheimer H (1998) Use of chlorotoxin for
targeting of primary brain tumors. Cancer Res 58:4871-4879.
Stein G (1979) T98G: An anchorage-independent human tumor cell line that exhibits stationary
phase G1 arrest in vitro. J Cell Physiol 99:43-54.
The Cancer Genome Atlas Research Network (2008) Comprehensive genomic characterization
defines human glioblastoma genes and core pathways. Nature 455:1061-1068.
Tomko RJ, Jr. and Lazo JS (2008) Multimodal control of Cdc25A by nitrosative stress. Cancer
Res 68:7457-7465.
Voorhees PM, Dees EC, O'Neil B and Orlowski RZ (2003) The proteasome as a target for cancer
therapy. Clin Cancer Res 9:6316-6325.
Weller M, Rieger J, Grimmel C, Van Meir E, De Tribolet N, Krajewski S, Reed J, von Deimling
A and Dichgans J (1998) Predicting chemoresistance in human malignant glioma cells:
the role of molecular genetic analyses. Int J Cancer 79:640-644.
Yang ZZ, Tschopp O, Baudry A, Dümmler B, Hynx D and Hemmings BA (2004) Physiological
functions of protein kinase B/Akt. Biochem Soc Trans 32(Pt 2):350-354.
This article has not been copyedited and formatted. The final version may differ from this version.Molecular Pharmacology Fast Forward. Published on September 25, 2009 as DOI: 10.1124/mol.109.058024
at ASPE
T Journals on January 2, 2019
molpharm
.aspetjournals.orgD
ownloaded from
MOL 58024
27
Yin D, Zhou H, Kumagai T, Liu G, Ong J, Black K and Koeffler H (2005) Proteasome inhibitor
PS-341 causes cell growth arrest and apoptosis in human glioblastoma multiforme
(GBM). Oncogene 24:344-354.
Zhang J-H, Chung TDY and Oldenburg KR (1999) A simple statistical parameter for use in
evaluation and validation of high throughput screening assays. J Biomol Screen 4:67-73.
This article has not been copyedited and formatted. The final version may differ from this version.Molecular Pharmacology Fast Forward. Published on September 25, 2009 as DOI: 10.1124/mol.109.058024
at ASPE
T Journals on January 2, 2019
molpharm
.aspetjournals.orgD
ownloaded from
MOL 58024
28
FOOTNOTES:
This work was supported in part by the National Institutes of Health National Institute of
Neurological Disorders and Stroke [Grant P01 NS40923]; the National Institutes of Health
National Cancer Institute [Grant P01 CA78039]; and the Doris Duke Charitable Foundation.
This article has not been copyedited and formatted. The final version may differ from this version.Molecular Pharmacology Fast Forward. Published on September 25, 2009 as DOI: 10.1124/mol.109.058024
at ASPE
T Journals on January 2, 2019
molpharm
.aspetjournals.orgD
ownloaded from
MOL 58024
29
FIGURE LEGENDS
Figure 1. Two-condition analysis and frequency distribution and classification of survival gene
siRNAs. (A) Fifty-eight genes were selected using the binning method, and 138 genes (2.5
percentile) were selected using the MAD method. A composite set of 55 survival genes was
created by overlapping the binned and MAD gene lists. (B) Histogram analysis of this set of 55
survival genes revealed a cell viability distribution in the range of 6% to 35%. (C) Survival genes
were classified by shared molecular and biological functions (Mi et al., 2007). This classification
scheme revealed enriched protein classes, including proteases, kinases, transferases, transcription
regulators, RAS family proteins, and signaling molecules. The largest class of genes was
proteases (12 genes).
Figure 2. Replicate validation of screening siRNAs. Replicate validation of screening siRNAs
demonstrated reproducible cytotoxicity. (A) Suppression of cell viability was confirmed by
replicate transfection with the 12 survival gene proteasome components. siRNAs targeting
PSMC3, PSMD14, and PSMB2 induced the most significant cytotoxicity. Student’s t-test
indicated significant differences from cells treated with scrambled siRNA (p<0.05). (B)
Replicate validation confirmed cytotoxicity of various non-proteasome targeting survival gene
siRNAs. Transfection with siRNA targeting RAN, DDX39, and K-ALPHA-1 induced the most
significant cytotoxicity. (C) Re-assaying the remaining 14 non-survival gene proteasome
component siRNAs did not result in significant cytotoxicity, except for PSMD7. Each
experiment was performed in triplicate and error bars represent SEM. Student’s t-test indicated
significant differences from cells treated with scrambled siRNA (p<0.05).
This article has not been copyedited and formatted. The final version may differ from this version.Molecular Pharmacology Fast Forward. Published on September 25, 2009 as DOI: 10.1124/mol.109.058024
at ASPE
T Journals on January 2, 2019
molpharm
.aspetjournals.orgD
ownloaded from
MOL 58024
30
Figure 3. Suppression of cell viability by PSMB4 silencing. PSMB4 was chosen as a
representative proteasome target for further validation. (A) Transfection with siRNA sequences
A, B, and pooled but not C demonstrated protein knockdown and suppression of cell viability.
Student’s t-test indicated significant differences from control cells (p<0.05). (B) Cell viability
after PSMB4 transfection was measured at 24 hr time-intervals over a 96 hr period. There was
minimal cytotoxicity with sequences A, B, C, and pooled at 0 – 48 hr, while significant
cytotoxicity was observed with sequences A, B, and pooled at 72 – 96 hr. (C) Protein
knockdown was observed at 48 and 72 hr and appeared to occur before induction of cell death.
The values below the Western blots are the quantification of band density normalized to -
tubulin from 3 independent experiments. Asterisks indicate a significant difference from cells
treated with scrambled siRNA using a Student’s t-test (p<0.05).
Figure 4. Proteasome inhibition in cell lines. (A). Immunoblotting was used to detect relative
amounts of PSMB4 protein in glioma and control cell lines. The molecular mass of PSMB4 has
been reported to be 55 kDa. (B). The glioma cell lines T98G, U373, U87, LN-Z308, LN-Z428,
and A172, breast adenocarcinoma cell line MCF7, and lung adenocarcinoma epithelial cell line
A549 were transfected with PSMB4 siRNA, and cell viability was measured at 96 hr. LN-Z308
and LN-Z428 were most resistant to cell death, while A549 and A172 were most sensitive.
Student’s t-test indicated the growth inhibition for all cells was significantly different from
control cells (p<0.05). (C). The proteasome inhibitor MG-132 inhibited cancer cell viability.
Cell viability of T98G, U87, U373, LN-Z308, LN-Z428, and A172 glioma cells 48 hr following
addition of increasing concentrations of MG-132 was measured with CellTiter-Blue and
This article has not been copyedited and formatted. The final version may differ from this version.Molecular Pharmacology Fast Forward. Published on September 25, 2009 as DOI: 10.1124/mol.109.058024
at ASPE
T Journals on January 2, 2019
molpharm
.aspetjournals.orgD
ownloaded from
MOL 58024
31
corroborated with cell count data. Viability is shown as a percentage of viability of cells treated
with vehicle (0.5% DMSO). Values are mean + SEM from at least three independent
experiments. IC50 values for cell lines are as follow: 140.7 nM (T98G), 323.6 (U87), 288.4
(U373), 972.8 (LN-Z308), 374.1 (LN-Z428), and 242 (A172). The values below the Western
blots are the quantification of band density normalized to -tubulin from three independent
experiments.
Figure 5. PSMB1, PSMB2, and PSMB5 mRNA and protein levels in T98G cells after PSMB4
siRNA transfection. (A) mRNA levels of PSMB4, PSMB2, and PSMB5 were determined in
T98G cells transfected with either scramble siRNA or PSMB4 siRNA. PSMB4, but not PSMB2
and PSMB5, mRNA level was substantially decreased 48 hr after PSMB4 siRNA transfection.
(B) Western blotting for PSMB1, PSMB2, and PSMB5 expression in T98G cells transfected
with scramble siRNA or PSMB4 siRNA. Treatment with siRNA against PSMB4 for 48 hr
resulted in a loss of all three subunits with the appearance of a higher molecular weight
immunoreactive band. (C) Western blotting analysis of PARP in T98G cells transfected with
scramble or PSMB4 siRNA. PARP cleavage was apparent 48 hr after the transfection with
PSMB4 siRNA with prominent PARP protein at 72 and 96 hr.
Figure 6. Mapping of survival genes onto a protein-protein interaction network. Functional
analysis of survival genes was performed with IPA. The genes are represented as nodes, and
edges connecting two nodes represent a biological relationship that is supported by at least one
published reference or the IPA knowledge base. Shaded nodes represent survival genes. The
network score refers to the negative exponent of the p-value calculation. In a network that
This article has not been copyedited and formatted. The final version may differ from this version.Molecular Pharmacology Fast Forward. Published on September 25, 2009 as DOI: 10.1124/mol.109.058024
at ASPE
T Journals on January 2, 2019
molpharm
.aspetjournals.orgD
ownloaded from

MOL 58024
32
comprises genes related to dermatological diseases, infectious disease, and embryonic
development, the network of genes centered on the proteasome complex and NF- B (network
score: 53).
This article has not been copyedited and formatted. The final version may differ from this version.Molecular Pharmacology Fast Forward. Published on September 25, 2009 as DOI: 10.1124/mol.109.058024
at ASPE
T Journals on January 2, 2019
molpharm
.aspetjournals.orgD
ownloaded from
This article has not been copyedited and form
atted. The final version m
ay differ from this version.
Molecular Pharm
acology Fast Forward. Published on Septem
ber 25, 2009 as DO
I: 10.1124/mol.109.058024
at ASPET Journals on January 2, 2019 molpharm.aspetjournals.org Downloaded from
This article has not been copyedited and form
atted. The final version m
ay differ from this version.
Molecular Pharm
acology Fast Forward. Published on Septem
ber 25, 2009 as DO
I: 10.1124/mol.109.058024
at ASPET Journals on January 2, 2019 molpharm.aspetjournals.org Downloaded from
This article has not been copyedited and formatted. The final version may differ from this version.Molecular Pharmacology Fast Forward. Published on September 25, 2009 as DOI: 10.1124/mol.109.058024
at ASPE
T Journals on January 2, 2019
molpharm
.aspetjournals.orgD
ownloaded from
This article has not been copyedited and form
atted. The final version m
ay differ from this version.
Molecular Pharm
acology Fast Forward. Published on Septem
ber 25, 2009 as DO
I: 10.1124/mol.109.058024
at ASPET Journals on January 2, 2019 molpharm.aspetjournals.org Downloaded from
This article has not been copyedited and formatted. The final version may differ from this version.Molecular Pharmacology Fast Forward. Published on September 25, 2009 as DOI: 10.1124/mol.109.058024
at ASPE
T Journals on January 2, 2019
molpharm
.aspetjournals.orgD
ownloaded from
This article has not been copyedited and formatted. The final version may differ from this version.Molecular Pharmacology Fast Forward. Published on September 25, 2009 as DOI: 10.1124/mol.109.058024
at ASPE
T Journals on January 2, 2019
molpharm
.aspetjournals.orgD
ownloaded from


![A Case of Glioblastoma Multiforme Masquerading as Rapidly ... · out to be glioblastoma multiforme on histopathology [2]. Despite optimal treatment, the median survival is only 12](https://img.pdfslide.us/doc/110x75/5f024f727e708231d403a2ba/a-case-of-glioblastoma-multiforme-masquerading-as-rapidly-out-to-be-glioblastoma.jpg)