Embed Size (px)
Citation preview

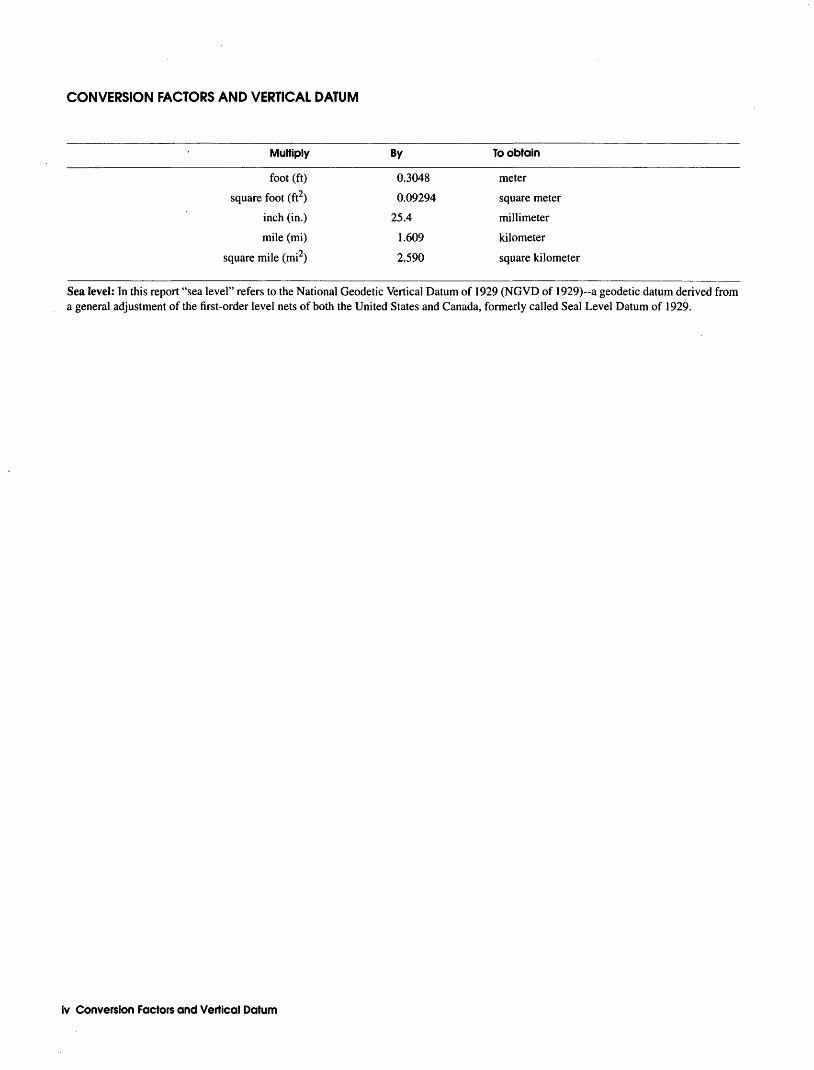
IDENTIFICATION OF POTENTIAL PUBLIC WATER-SUPPLY AREAS OF THE CAPE COD AQUIFER, MASSACHUSETTS, USING A GEOGRAPHIC INFORMATION SYSTEMU.S. GEOLOGICAL SURVEYWater-Resources Investigations Report 94-4156
Prepared in cooperation with THE CAPE COD COMMISSION

COVER
Potential public water-supply areas of the Cape Cod aquifer, Massachusetts, were identified in an analysis which sequentially overlaid seven criteria-based data layers. The inset shows the amount of data available despite the regional scale of the analysis.

TAKE PRIDE INUnited States Department of the Interior AMERICA
GEOLOGICAL SURVEY
WATER RESOURCES DIVISION Massachusetts-Rhode Island District Office
28 Lord Road, Suite 280 Marlborough, Massachusetts 01752
POTENTIAL PUBLIC WATER-SUPPLY AREAS IDENTIFIED ON CAPE COD
Potential areas for public water supplies on Cape Cod are presented in a new report released by the U.S. Geological Survey (USGS), Department of the Interior. The report discusses identification of potential public water-supply areas using a geographic information system (GIS). Areas identified as potential public water supply are presented on a plate; the identified areas comprise about 6 percent of Cape Cod's area. The report also discusses a GIS menu application that was developed to allow study results to be easily accessi ble to regional planners. The map-based, menu-driven application provides interactive display and query of study results and other data layers in the GIS data base.
Ground water is the sole source of drinking water to most municipal and domestic supplies on Cape Cod. However, protection of the ground-water resources necessary to support present and future drinking- water needs is often in conflict with increased land development. Results of this study provide tools to aid in regional and local ground-water resource management. Several criteria were selected, on the basis of con cerns and requirements for the siting of new public water-supply wells, to identify areas with limitations on
the potential for public water supply. Remaining areas, those with no limiting criteria, are the primary areas of potential public water supply; these areas range from 0.5 to 7.9 percent of the Cape Cod flow cells, or 5.6 percent of the total area analyzed. The menu application can be used to provide detailed information from the Cape Cod data base for distinguishing between potential public water-supply areas identified by the Analysis.
The study was done by the USGS in cooperation with the Cape Cod Commission (CCC). Results of the study will provide information needed by the CCC to implement a regional aquifer protection strategy, as part of the Regional Policy Plan for Barnstable County.
Copies of the report titled "Identification of potential public water-supply areas of the Cape Cod aquifer, Massachusetts, using a Geographic Information System," by S.L. Harris and P.A. Steeves, has been released as U.S. Geological Survey Water-Resources Investigations Report 94-4156. Copies are available for inspection at the U.S. Geological Survey, Massachusetts-Rhode Island District Office, 28 Lord Road, Suite 280, Marlborough, Massachusetts 01752. The report can be purchased at cost from the Open-File Services Section, U.S. Geological Survey Federal Center, Box 25286, MS 517, Denver, Colorado 80225 (telephone: (303) 236-7476). Orders must include checks or money orders payable to U.S. Department of the Interior, U.S. Geological Survey.
Armando J. Carbonell, Executive DirectorThomas C. Cambareri,
Water Resources Program ManagerCape Cod Commission
Wayne Sonntag, District Chief U.S. Department of the Interior
U.S. Geological Survey,Water Resources Division
Massachusetts Rhode Island District

IDENTIFICATION OF POTENTIAL PUBLIC WATER-SUPPLY AREAS OF THE CAPE COD AQUIFER, MASSACHUSETTS, USING A GEOGRAPHIC INFORMATION SYSTEM
U.S. GEOLOGICAL SURVEYWater-Resources Investigations Report 94-4156
Prepared in cooperation with THE CAPE COD COMMISSION
Marlborough, Massachusetts 1994

U.S. DEPARTMENT OF THE INTERIOR BRUCE BABBITT, Secretary
U.S. GEOLOGICAL SURVEY Gordon P. Eaton, Director ,
For additional information, write to:
District Chief,Massachusetts-Rhode Island District U.S. Geological Survey Water Resources Division 28 Lord Road, Suite 280 Marlborough, MA 01752
Copies of this report can be purchased from:
U.S. Geological SurveyEarth Science Information CenterOpen-File Reports SectionBox 25286, MS 517Federal CenterDenver, CO 80225

CONTENTS
Abstract.............................................................................................................................................................................. 1
Introduction............................................................................................._^ 1
Purpose and Scope............................................................................................................:..................................... 3Approach................................................................................................................................................................. 3Regional Hydrogeologic Setting............................................................................................................................. 3
Development of Geographic Information System Data Base............................................................................................ 4
Analysis Criteria................................................................................................................................................................. 5
Restricted Use......................................................................................................................................................... 5
Wetland Zones........................................................................................................................................................ 5Land-Use Based Criteria......................................................................................................................................... 6
Ground-Water Contamination Zones...................................................................................................................... 7Potential Saltwater Intrusion Zone......................................................................................................................... 8
Identification of Potential Public Water-Supply Areas ...................................................................................................... 9
Potential Public Water-Supply Areas...................................................................................................................... 12
Limitations of the Analysis..................................................................................................................................... 14Development of Interactive Geographic Information System Application ....................................................................... 15
Summary and Conclusions................................................................................................................................................. 17
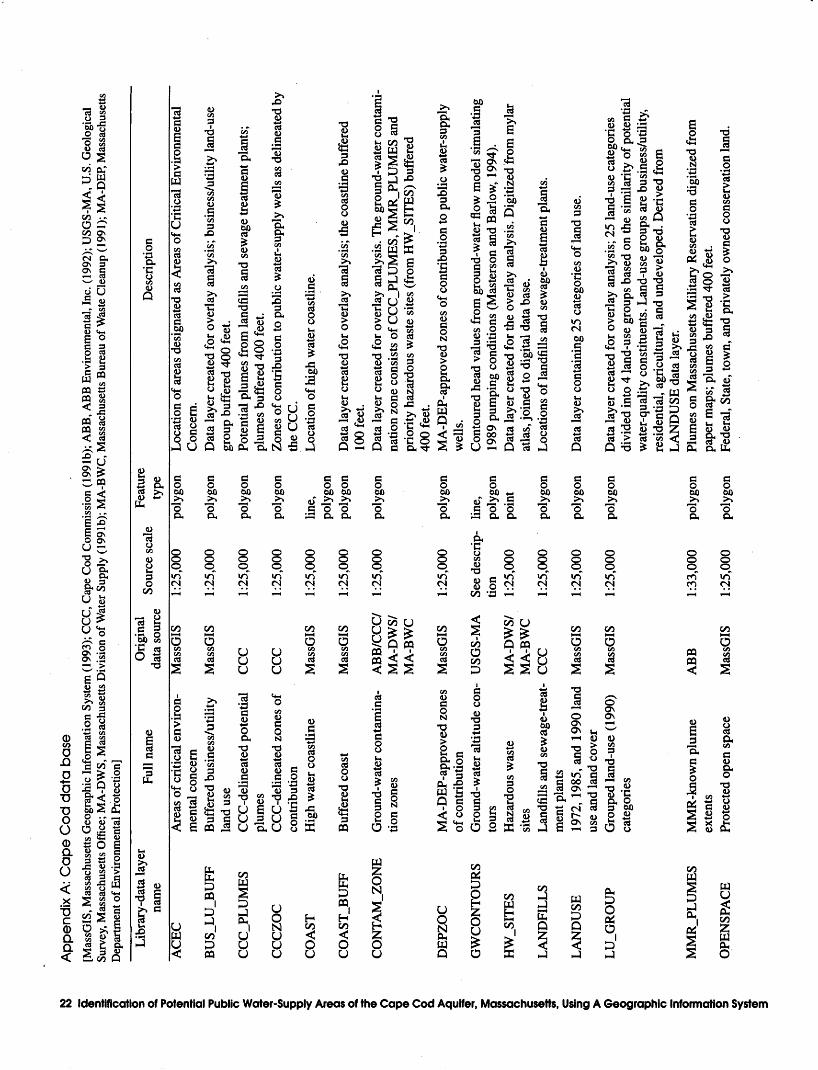
References Cited.........................................................................................................................................................^ 18Appendix A: Cape Cod Data Base............................................;........................................................................................ 21
PLATE(Plate is in pocket)
1. Potential public water-supply areas of the Cape Cod aquifer, Massachusetts.
FIGURES
1-3. Maps showing:
1. Study area and location of six ground-water-flow cells of the Cape Cod aquifer, Massachusetts................... 2
2. Example of overlay analysis for a generalized area; data layers are overlaid in orderof increasing limitations on the potential for public water supply ............................................................ 10
3. Primary potential public water-supply areas of the Cape Cod aquifer, Massachusetts.................................... 13
4. Main display screen of the interactive Geographic Information System application.............................................. 165. Use of the Identify tool-option from the interactive Geographic Information System application......................... 17
TABLES
1. Land-use groups used in land-use based criteria to estimate regional ground-water qualityof the Cape Cod aquifer, Massachusetts............................................................................................................. 7
2. Percentage of area in each overlay criteria for five flow cells of theCape Cod aquifer, Massachusetts....................................................................................................................... 12
Contents iii
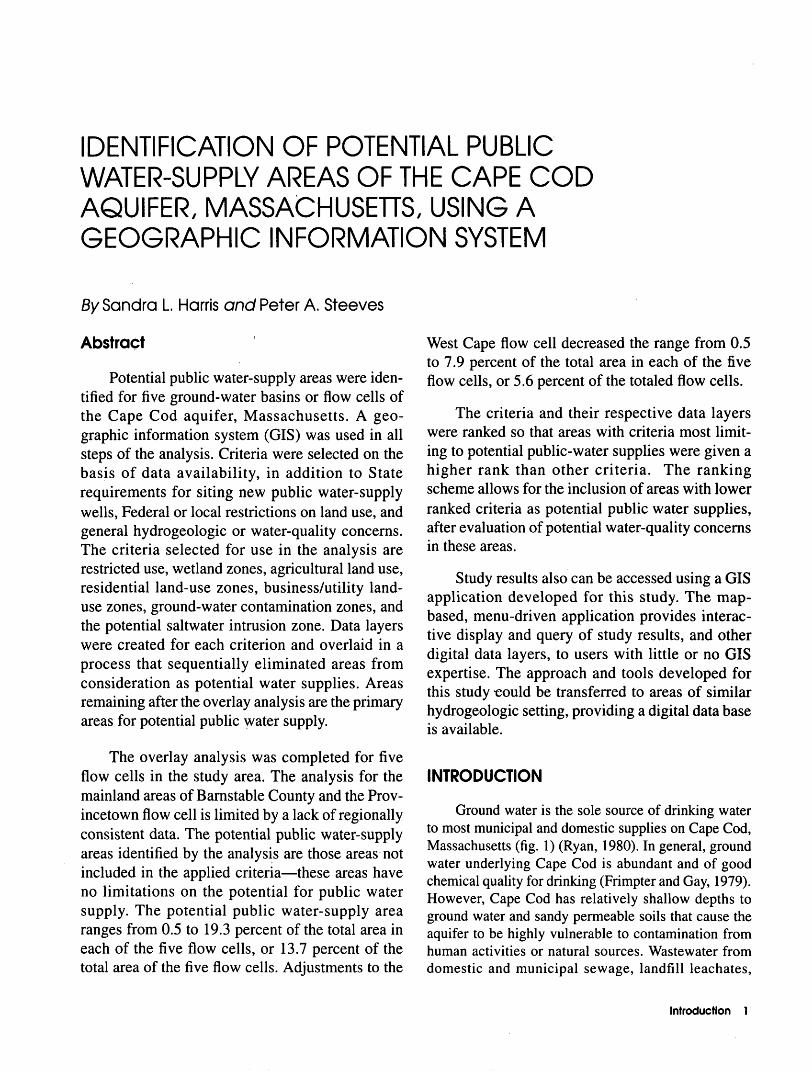
CONVERSION FACTORS AND VERTICAL DATUM
Multiply
foot (ft)
square foot (ft2)
inch (in.)
mile (mi)
square mile (mi2)
By
0.3048
0.09294
25.4
1.609
2.590
To obtain
meter
square meter
millimeter
kilometer
square kilometer
Sea level: In this report "sea level" refers to the National Geodetic Vertical Datum of 1929 (NGVD of 1929) a geodetic datum derived from a general adjustment of the first-order level nets of both the United States and Canada, formerly called Seal Level Datum of 1929.
iv Conversion Factors and Vertical Datum
IDENTIFICATION OF POTENTIAL PUBLIC WATER-SUPPLY AREAS OF THE CAPE COD AQUIFER, MASSACHUSETTS, USING A GEOGRAPHIC INFORMATION SYSTEM
By Sandra L. Harris and Peter A. Steeves
Abstract
Potential public water-supply areas were iden tified for five ground-water basins or flow cells of the Cape Cod aquifer, Massachusetts. A geo graphic information system (GIS) was used in all steps of the analysis. Criteria were selected on the basis of data availability, in addition to State requirements for siting new public water-supply wells, Federal or local restrictions on land use, and general hydrogeologic or water-quality concerns. The criteria selected for use in the analysis are restricted use, wetland zones, agricultural land use, residential land-use zones, business/utility land- use zones, ground-water contamination zones, and the potential saltwater intrusion zone. Data layers were created for each criterion and overlaid in a process that sequentially eliminated areas from consideration as potential water supplies. Areas remaining after the overlay analysis are the primary areas for potential public water supply.
The overlay analysis was completed for five flow cells in the study area. The analysis for the mainland areas of Barnstable County and the Prov- incetown flow cell is limited by a lack of regionally consistent data. The potential public water-supply areas identified by the analysis are those areas not included in the applied criteria these areas have no limitations on the potential for public water supply. The potential public water-supply area ranges from 0.5 to 19.3 percent of the total area in each of the five flow cells, or 13.7 percent of the total area of the five flow cells. Adjustments to the
West Cape flow cell decreased the range from 0.5 to 7.9 percent of the total area in each of the five flow cells, or 5.6 percent of the totaled flow cells.
The criteria and their respective data layers were ranked so that areas with criteria most limit ing to potential public-water supplies were given a higher rank than other criteria. The ranking scheme allows for the inclusion of areas with lower ranked criteria as potential public water supplies, after evaluation of potential water-quality concerns in these areas.
Study results also can be accessed using a GIS application developed for this study. The map- based, menu-driven application provides interac tive display and query of study results, and other digital data layers, to users with little or no GIS expertise. The approach and tools developed for this study t:ould be transferred to areas of similar hydrogeologic setting, providing a digital data base is available.
INTRODUCTION
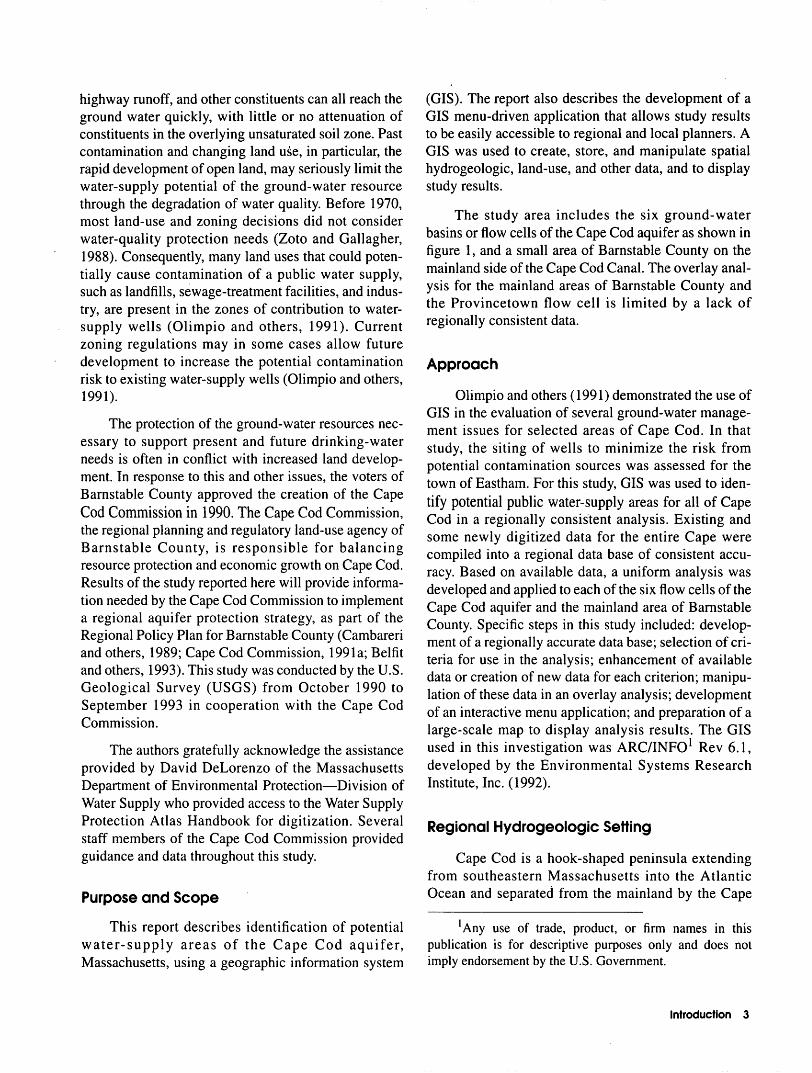
Ground water is the sole source of drinking water to most municipal and domestic supplies on Cape Cod, Massachusetts (fig. 1) (Ryan, 1980). In general, ground water underlying Cape Cod is abundant and of good chemical quality for drinking (Frimpter and Gay, 1979). However, Cape Cod has relatively shallow depths to ground water and sandy permeable soils that cause the aquifer to be highly vulnerable to contamination from human activities or natural sources. Wastewater from domestic and municipal sewage, landfill leachates,
Introduction 1

73°00'
INDEX MAP OF MASSACHUSETTS
72°0071°00'
42°30'-/PROVINCETOWN
FLOW CELL (PILGRIM)
7005'
Pilgrim Heights
ATLANTIC OCEAN
EXPLANATION
SANDWICH MORAINE
BUZZARDS BAY MORAINE
APPROXIMATE BOUNDARIES OF THE SIX FLOW CELLS OF THE CAPE COD AQUIFER. FLOW CELL NAMES IN PARENTHESES USED BY CAPE COD COMMISSION (JANIK, 1987).
WELLFLEET FLOW CELL (CHEQUESSET)
5 WATER-TABLE CONTOURS--Shows altitude of water table, 1963-76. Contour interval, in feet, is variable. Datum is sea level. (From LeBlanc and others, 1986)
NANTUCKET SOUND
02466 10 MILES
BUZZARDS BAY
41°40'
02468 10 KILOMETERS
Figure 1. Study area and location of six ground-water-flow cells of the Cape Cod aquifer, Massachusetts.
2 Identification of Potential Public Water-Supply Areas of the Cape Cod Aquifer, Massachusetts, Using A Geographic Information System
highway runoff, and other constituents can all reach the ground water quickly, with little or no attenuation of constituents in the overlying unsaturated soil zone. Past contamination and changing land use, in particular, the rapid development of open land, may seriously limit the water-supply potential of the ground-water resource through the degradation of water quality. Before 1970, most land-use and zoning decisions did not consider water-quality protection needs (Zoto and Gallagher, 1988). Consequently, many land uses that could poten tially cause contamination of a public water supply, such as landfills, sewage-treatment facilities, and indus try, are present in the zones of contribution to water- supply wells (Olimpio and others, 1991). Current zoning regulations may in some cases allow future development to increase the potential contamination risk to existing water-supply wells (Olimpio and others, 1991).
The protection of the ground-water resources nec essary to support present and future drinking-water needs is often in conflict with increased land develop ment. In response to this and other issues, the voters of Barnstable County approved the creation of the Cape Cod Commission in 1990. The Cape Cod Commission, the regional planning and regulatory land-use agency of Barnstable County, is responsible for balancing resource protection and economic growth on Cape Cod. Results of the study reported here will provide informa tion needed by the Cape Cod Commission to implement a regional aquifer protection strategy, as part of the Regional Policy Plan for Barnstable County (Cambareri and others, 1989; Cape Cod Commission, 199la; Belfit and others, 1993). This study was conducted by the U.S. Geological Survey (USGS) from October 1990 to September 1993 in cooperation with the Cape Cod Commission.
The authors gratefully acknowledge the assistance provided by David DeLorenzo of the Massachusetts Department of Environmental Protection Division of Water Supply who provided access to the Water Supply Protection Atlas Handbook for digitization. Several staff members of the Cape Cod Commission provided guidance and data throughout this study.
Purpose and Scope
This report describes identification of potential water-supply areas of the Cape Cod aquifer, Massachusetts, using a geographic information system
(GIS). The report also describes the development of a GIS menu-driven application that allows study results to be easily accessible to regional and local planners. A GIS was used to create, store, and manipulate spatial hydrogeologic, land-use, and other data, and to display study results.
The study area includes the six ground-water basins or flow cells of the Cape Cod aquifer as shown in figure 1, and a small area of Barnstable County on the mainland side of the Cape Cod Canal. The overlay anal ysis for the mainland areas of Barnstable County and the Provincetown flow cell is limited by a lack of regionally consistent data.
Approach
Olimpio and others (1991) demonstrated the use of GIS in the evaluation of several ground-water manage ment issues for selected areas of Cape Cod. In that study, the siting of wells to minimize the risk from potential contamination sources was assessed for the town of Eastham. For this study, GIS was used to iden tify potential public water-supply areas for all of Cape Cod in a regionally consistent analysis. Existing and some newly digitized data for the entire Cape were compiled into a regional data base of consistent accu racy. Based on available data, a uniform analysis was developed and applied to each of the six flow cells of the Cape Cod aquifer and the mainland area of Barnstable County. Specific steps in this study included: develop ment of a regionally accurate data base; selection of cri teria for use in the analysis; enhancement of available data or creation of new data for each criterion; manipu lation of these data in an overlay analysis; development of an interactive menu application; and preparation of a large-scale map to display analysis results. The GIS used in this investigation was ARC/INFO 1 Rev 6.1, developed by the Environmental Systems Research Institute, Inc. (1992).
Regional Hydrogeologic Setting
Cape Cod is a hook-shaped peninsula extending from southeastern Massachusetts into the Atlantic Ocean and separated from the mainland by the Cape
Any use of trade, product, or firm names in this publication is for descriptive purposes only and does not imply endorsement by the U.S. Government.
Introduction 3

Cod Canal. Cape Cod is composed of unconsolidated, glacially derived sediments underlain by bedrock. The bedrock surface has a complex topography that ranges in altitude from 80 ft below sea level near the Cape Cod Canal to more than 900 ft below sea level in a deep valley near Pilgrim Heights (Oldale, 1969). In general, the bedrock surface slopes gently south to southeast from Buzzards Bay to Nantucket Island.
The unconsolidated sediments comprising the Cape Cod aquifer consist primarily of extensive plains of outwash and high ridges of moraine deposited during the last glaciation (Oldale, 1976). Moraines were formed during periods of ice margin re-advance; advancing ice pushed pre-glacial strata and older glacial sediments into ridges (Oldale and O'Hara, 1984). Lobes of ice, occupying Buzzards and Cape Cod Bays, formed the intersecting segments of the Buzzards Bay and Sandwich moraine (fig. 1). Moraines are composed of deformed and thrusted deposits veneered in many places by till; the till can range from coarse, poorly sorted gravel and sand to compact silts (Oldale and O'Hara, 1984). Outwash or stratified drift was depos ited by glacial meltwater in front of ice margins and generally is composed of well-sorted gravel and sands. Most water for public water supply on Cape Cod is pumped from wells completed in the outwash sediments.
The Cape Cod aquifer is defined as the zone of fresh ground water within the porous and permeable sediments underlying Cape Cod. The aquifer is com prised of six ground-water basins or flow cells (LeBlanc and others, 1986): the West Cape, East Cape, Eastham, Wellfleet, Truro, and Provincetown flow cells. The flow cells are locally referred to as the Sagamore, Monomoy, Nauset, Chequesset, Pamet, and Pilgrim lenses, respec tively (Janik, 1987). Aquifer boundaries include the water table, saline surface-water bodies, and either the bedrock surface or the interface between fresh and saline (chloride concentrations greater than 250 mg/L) ground water (Guswa and LeBlanc, 1985). The aquifer is maintained in dynamic equilibrium by recharge from infiltrated precipitation and discharge to streams, surface-water bodies, and the sea (Guswa and LeBlanc, 1985). Septic systems, sewage-treatment facilities, and ponds may recharge ground water locally. On a regional
scale, ground water flows radially from water-table highs in the middle of the peninsula to the edge of the aquifer near the coast (LeBlanc and others, 1986).
DEVELOPMENT OF GIS DATA BASE
An abundance of data are available for Cape Cod due to Federal, State, and regional data-collection efforts. Data were compiled from various sources to form a digital data base for Cape Cod (see Appendix A). Some spatial data were digitized and added to the data base for use in this study. Considerable time was spent to ensure a consistent scale of data layers in the data base, so that the data layers could be used at either regional or local scales without compromising data quality. This means that, in most cases, specific features from one data layer should coincide with features from another data layer with little overlay registration error. For example, the data layers for land use and protected open space were first digitized at a scale of 1:25,000, but using a coastline at a scale of 1:100,000. Data layer enhancements included adjusting the land-use and pro tected open-space data layers to a coastline at a scale of 1:25,000 (Allder and Elassal, 1985).
The data base was managed using ARC/INFO's spatial data base management software that provides access and view capabilities from any directory. A large data base or library is partitioned into smaller, more easily managed units using data layers and tiles. A data layer consists of a single-data theme defined over the entire spatial extent of the library, in this case Cape Cod. Tiling is used to partition the data base into smaller spa tial units. Multiple data layers can be present within a tile (directory); however, the data layers will have the same spatial extent.
Flow cells are the basic hydrologic unit of the Cape Cod aquifer. For this reason, the data base was parti tioned into tiles according to flow-cell boundaries. Under predevelopment and present pumping condi tions, each of the flow cells are considered to be hydro- logically independent; it is assumed that ground water from one flow cell is unlikely to flow to an adjoining flow cell (Guswa and LeBlanc, 1985). Tiles based on flow-cell boundaries resulted in a data base organized into seven separate directories; one directory for each of
4 Identification of Potential Public Water-Supply Areas of the Cape Cod Aquifer, Massachusetts, Using A Geographic Information System
the six flow cells and one directory for the mainland area. Each tile includes all data layers available for a flow cell.
After developing the tile structure, data layers were loaded one at a time into the library. Most data layers include the entire Cape; therefore, the data layers were split into the seven directories. When complete, the directory for each flow cell contained files of the data layers (for example, land use, protected open space, and roads) for the area represented by the flow cell. The directories varied in size because of differences in flow- cell areas or other factors, but the data structure remained the same.
ANALYSIS CRITERIA
Criteria were selected for use in a regionally consistent analysis to identify potential public water- supply areas of the Cape Cod aquifer. The criteria were selected on the basis of data availability, in addition to State requirements for siting new public water-supply wells, Federal or State restrictions on land use, and general hydrogeologic or water-quality concerns. The specific criteria selected for use in the analysis were: (1) restricted use, (2) wetland zones, (3) agricultural land use, (4) residential land-use zones, (5) business/ utility land-use zones, (6) ground-water contamination zones, and (7) potential saltwater intrusion zone. After selection of the analysis criteria, criteria-specific data layers were created and overlaid to identify potential public water-supply areas. Formulation and subsequent data-layer development are described for each criterion in the following sections. The three criteria based on land use (agricultural land use, residential land-use zones, and business/utility land-use zones) are described as a group under the section entitled 'Land-Use Based Criteria.'
Restricted Use
Cape Cod contains areas that have been reserved for the conservation and enjoyment of natural, scenic, or recreational resources. These areas, called protected open space, include a National Park, National Wildlife Refuge, State parks, town parks and nature areas, and privately owned nature preserves and sanctuaries. Most of the land in the Eastham, Wellfleet, and Truro flow cells is a part of the Cape Cod National Seashore. The National Park was created under Public Law 87-126 so
that the unique flora, fauna, and physiographic setting, including ponds, wetlands, and estuaries in the area would be preserved. Restricted development of land within Park boundaries has protected ground water from the adverse effect of human activities of more developed areas of Cape Cod. Federal law generally prohibits the removal of water resources from Federally protected open space such as a National Park. Because of restrictions on the use of protected open space for potential water-supply development, these areas were incorporated into the restricted-use criteria. All National, State, or privately owned protected open space areas were included in the restricted-use criteria of the analysis and in the resulting RESTRICTED data layer. Town-owned areas of open space were not included in the RESTRICTED data layer, so that town ownership of potential well sites could be maximized (Olimpio and others, 1991).
Wetland Zones
Regulations imposed by the Massachusetts Wet lands Protection Act restrict activities in wetlands and within a 100-foot buffer zone extending horizontally from any wetland (310 Code of Massachusetts Regula tions 10.00). No person may remove, dredge, fill, or alter a wetland without a permit granting permission for action from the local conservation commission or the Massachusetts Department of Environmental Protec tion (DEP). Any lake, pond, creek, stream, river, fresh water wetland, coastal wetland, beach, dune, tidal flat or coastline is included in the definition of a wetland in the Act. Projects requiring more than 5,000 ft of wetland fill can receive a variance directly from the DEP Commissioner, if minimal wetland impacts from the project are proven (Michael Stroman, Massachusetts Department of Environmental Protection, Division of Wetlands and Waterways, oral commun., 1993). Future revisions to the regulations may allow limited access to water suppliers developing wells in wetlands (Michael Stroman, Massachusetts Department of Environmental Protection - Division of Wetlands and Waterways, oral commun., 1993).
As a consequence of the restrictions on activities in wetland areas, all wetland areas and a 100-foot buffer are included in the wetland-zones criteria. Wetlands were identified from l:25,000-scale USGS digital line graph (DLG) data (Allder and Elassal, 1985). All surface-water bodies included in the legal wetland
Analysis Criteria 5

definition (Massachusetts Wetland Protection Act) were selected and merged to form a wetland data layer from the DLG data layer. The wetlands and coastline data layers were buffered 100 ft to create the WETLAND_BUFF and COAST_BUFF data layers, respectively. The coastline data layer was buffered separately from the wetlands due to size and processing-time constraints. These buffered data layers together comprise the wetland-zones criteria for use in the overlay analysis.
Land-Use Based Criteria
Land-use based criteria are used to account for regional ground-water-quality conditions resulting from nonpoint human sources. These criteria also are used to comply with State regulations concerning land use near public water supplies.
Recent, regionally consistent water-quality data were not available to determine general water-quality conditions; consequently, land use was used as an esti mator of ground-water quality in the aquifer. Several statistical studies in aquifers composed of unconsoli- dated glacial sediments have shown a correlation between regional ground-water quality and human activities, expressed as land use (Persky, 1986; Grady and Fisher-Weaver, 1988; Cain and others, 1989; Eckhardt and others, 1989). Although ground-water constituents may vary between agricultural, residential, commercial, and industrial land-use areas, results of the cited publications indicate that all these areas are sus ceptible to significantly higher concentrations or detec tion frequencies of dissolved inorganic and organic constituents than undeveloped land-use areas. In accor dance with these results, land use was categorized into four broad groups, business/utility, residential, agricul tural, and undeveloped, according to the similarity of potential water-quality constituents.
In addition to general water-quality concerns, State law prohibits siting new public water-supply wells within 400 ft of any land use that may pose a threat to water quality (Drinking Water Regulations, 310 Code of Massachusetts Regulation 22.21). The business/utility land-use group is affected by this regulation, and as a result, areas in this land-use group were buffered 400 ft to form the business/utility land-use zones criteria. Areas in the residential land-use group were buffered 400 ft to create the residential land-use zones criteria.
Residential land-use areas were buffered to minimize potential water-quality degradation at new public water- supply wells. The agricultural land-use group is the final land-use based criteria used in the analysis; agricultural land-use areas were not buffered.
The three land-use based criteria, the business/ utility land-use zones, residential land-use zones, and agricultural land use, were developed for use in the analysis to identify potential public water-supply areas. Undeveloped land use, the fourth land-use group, was not used to develop a criteria. Other non-land-use based criteria limit the potential of undeveloped land-use areas for public water supply.
Several steps were needed to create data layers for the three land-use based criteria. The original land-use data layer for Cape Cod, LANDUSE, classified land use according to 25 categories (Massachusetts Geographic Information System, 1993). The original data layer was interpreted from l:25,000-scale, color infrared photog raphy taken in the spring of 1990. A new data layer, LU_GROUP, was created in which all areas were cate gorized according to the four land-use groups business/utility, residential, agricultural, and undevel oped as shown in table 1. Because of conflicts evident between known landfill locations and the interpretation of some landfills as gravel operations in the land-use data layer, the mining land-use category was included in the business/utility land-use group. In addition, the accurate location of previously and presently operating landfills was ensured using the separate LANDFILLS data layer to correct the grouped land-use data layer. Future updates of the land-use data layer may have a separate category for power lines, presently included in the open-land category (Massachusetts Geographic Information System, 1993). The use of herbicides and pesticides around power lines may warrant the inclusion of this land-use category in a different land-use group such as agricultural. The business/utility land-use group was selected and buffered 400 ft to create the business/ utility land-use zone of the BUS_LU_BUFF data layer. Similarly, the residential land-use group was selected and buffered to create the residential land-use zone for the data layer, RES_LU_BUFF. The agricultural land- use group was not used to create a new data layer; these areas were selected from the LU_GROUP data layer for the analysis.
6 Identification of Potential Public Water-Supply Areas of the Cape Cod Aquifer, Massachusetts, Using A Geographic Information System

Table 1 . Land-use groups used in land-use based criteria to estimate regional ground-water quality of the Cape Cod aquifer, Massachusetts
[Land-use categories and definitions from Massachusetts Geographic Information System (1993). Land-use categories are grouped according to the similarity of potential water-quality constituents]
Land-use group Land-use category Definition
Undeveloped
Agricultural
Residential
Business/utility
ForestNew oceanOpen landParticipation recreationSalt wetlandWaterWater-based recreationWetland
Cranberry bogCroplandGolfPastureSpectator recreationUrban open
Woody perennial
Residential (RO) Residential (Rl) Residential (R3) Residential (R4)
CommercialIndustrialMarinaMiningTransportationWaste disposal
Forested areasAreas of accretionAbandoned agriculture, power lines, and areas of no vegetationTennis and playgroundsSalt marshFreshwater and coastal embaymentsBeaches and swimming poolsNon-forested, freshwater wetland
Cranberry bogsIntensive agricultureGolf coursesExtensive agricultureStadiums and racetracksParks, cemeteries, public and institutional greenspace,
and vacant undeveloped land Orchards and nurseries
Multi-family residential Residential lots smaller than 1/4 acre Residential lots 1/4 to 1/2 acre Residential lots larger than 1/2 acre
General urban and shopping centersLight and heavy industryMarinasSand, gravel, and rockAirports, docks, divided highway, and railroadsLandfills and sewage lagoons
Ground-Wafer Contamination Zones
Ground-water contamination has been identified at several areas in the Cape Cod aquifer. Sources of con tamination include sites on the Massachusetts Military Reservation of the West Cape flow cell (LeBlanc, 1984; ABB Environmental Services, Inc., 1992), hazardous waste disposal sites (Massachusetts Bureau of Waste Cleanup, 1991), and plumes from landfills and sewage- treatment facilities (Cape Cod Commission, 1991b). For public water-supply wells to be approved for use, water suppliers must comply with State requirements (Massachusetts General Laws 310 CMR 22.02, 22.21; Massachusetts Division of Water Supply, 199la). The regulations specify that a land use that will have a
significant adverse effect on water quality cannot be located within 400 ft of a new public water-supply well. For this reason, all known contamination sources were identified and buffered by 400 ft to create the ground- water contamination zones criteria for the analysis, and the data layer CONTAM_ZONE.
In a preliminary assessment, 76 possible sources of contamination were identified on the Massachusetts Military Reservation (ABB Environmental Services, Inc., 1992). The full or partial extent of ground-water contamination has been delineated for 12 of these sources (LeBlanc, 1984; ABB Environmental Services, Inc., 1992). Contaminants in the ground water include chlorinated solvents, primarily tetrachloroethylene
Analysis Criteria 7

(PCE), trichloroethylene (TCE), 1,2-dichloroethylene (DCE), and carbon tetrachloride (CC^), and fuel components such as benzene, ethylbenzene, toluene, and xylenes (ABB Environmental Services, Inc., 1992). The extent of contamination plumes associated with the 12 sources from the Massachusetts Military Reservation were digitized for this study to create the MMR_PLUMES data layer. The plume extents were buffered 400 ft and included as part of the data layer for the ground-water contamination zones criterion.
Eighteen ground-water contamination plumes have been identified by the Cape Cod Commission (1991b). These plumes are the result of waste disposal at landfills and sewage-treatment facilities throughout Cape Cod. The extent of these plumes are included in the data base as the data layer CCC_PLUMES. The data layer shows plume paths projected downgradient to the nearest major water body (Thomas Cambareri, Cape Cod Commission, written commun., 1993). The plume extents were buffered 400 ft and also were included as part of the data layer for the ground-water contamination zones criterion.
Barnstable County has 96 confirmed disposal sites where petroleum and/or hazardous waste have been released, 15 remedial disposal sites, and 76 locations considered to be likely disposal sites (locations to be investigated) (Massachusetts Bureau of Waste Cleanup, 1991). Of the confirmed sites, 45 are listed as priority because they are considered to pose a substantial hazard to health, safety, public welfare, or the environment. Priority sites meet any one of the priority criteria listed in Massachusetts General Law 310 CMR 20.544 (Mas sachusetts Bureau of Waste Cleanup, 1991). The remaining confirmed sites consist of 35 non-priority and 16 unclassified sites.
Hazardous waste sites were digitized from an atlas of site locations (Massachusetts Division of Water Supply, 1991b) and joined to a data base of site descrip tors supplied by the Massachusetts Department of Envi ronmental Protection (Massachusetts Bureau of Waste Cleanup, 1991). More locations were listed in the data base than identified in the atlas. Consequently, not all known hazardous waste site locations could be included in the data layer HW_SITES. There are 14 priority waste-disposal sites missing from the data layer, with 9 of these sites located on the Massachusetts Military Reservation. The point locations of the 31 known priority hazardous waste-site locations were buffered
400 ft, in accordance with State requirements, and were included in the data layer for the ground-water contamination zones criterion.
Potential Saltwater Intrusion Zone
Wells pumped near the interface between fresh and saline water may be subject to contamination from saltwater intrusion. For instance, heavy pumping of a well in the Truro flow cell resulted in increased sodium and chloride concentrations attributable to saltwater intrusion (Frimpter and Gay, 1979). Studies in the Truro flow cell indicate that changes in the position of the salt water interface are greatest beneath the pumped well (LeBlanc, 1982). By maximizing the vertical distance from a well to the saltwater interface, the potential for saltwater intrusion from vertical and horizontal flow into a public water-supply well is decreased.
The potential saltwater intrusion zone criterion was developed for the analysis to identify areas where saltwater intrusion is most likely to result. The depth to the bottom of water-supply wells completed in the Truro flow cell range from 22 to 55 ft below sea level (LeBlanc, 1982), and generally less than 80 ft below sea level in the West Cape and East Cape flow cells (J.P. Masterson, U.S. Geological Survey, oral commun., 1993). Assuming a maximum well depth of 80 ft below sea level and adding an 80-foot vertical buffer, a depth of 160 ft below sea level to the saltwater interface was used as the criterion for the potential saltwater intrusion zone. For example, all areas with depths to the saltwater interface less than or equal to 160 ft below sea level would be included in the criterion for the potential saltwater intrusion zone.
In order to determine the horizontal extent of the potential saltwater intrusion zone, a correlation between depth to the freshwater/saltwater interface and altitude of the water table was developed. The location of the freshwater/saltwater interface was calculated using the Ghyben-Herzenberg principle, which assumes a station ary boundary between freshwater and saltwater that is reflective of undisturbed conditions in the aquifer (Fetter, 1988, p. 151). The Ghyben-Herzenberg principle is an approximation; local hydrologic condi tions may result in differences from the calculated freshwater/saltwater interface. The Ghyben- Herzenberg principle states that at a given location, the depth of freshwater below sea level divided by 40 is
8 Identification of Potential Public Water-Supply Areas of the Cape Cod Aquifer, Massachusetts, Using A Geographic Information System
equal to the height of freshwater above sea level. Thus, a depth of 160 ft to the saltwater interface would indicate 4 ft of freshwater above sea level. All areas with water-table altitudes less than or equal to 4 ft above sea level are included in the data layer for the potential saltwater intrusion zone criterion, SALTZONE.
The potential saltwater intrusion zone was derived from the water-table data layer, GWCONTOURS. Model-calculated water-table altitude contours were used from a simulation of the Cape Cod aquifer using a three-dimensional finite-difference ground-water-flow model (Masterson and Barlow, 1994). The model- calculated contours provide information on the regional behavior of the aquifer, which is consistent with the regional-scale of the analysis in this study. Because of data discretization in the regional-scale model, the loca tion of model-calculated water-table contours may devi ate from actual contours by several miles. For example, data discretization resulted in some discrepancies between water levels in hydrologic features such as ponds and the water-table altitude contours. Modifica tions were made to water-table altitude contours around large ponds in order for contours to be consistent with known hydrologic features.
Because the saltwater intrusion zone was derived from model-based, water-table altitude contours, it is subject to the limitations of that data. The saltwater intrusion zone represents a general area in which salt water intrusion is more likely to result in and near public water-supply wells than in areas farther upgradient in the flow system. The possibility for saltwater intrusion beyond the delineated zone may result due to (1) the regional scale of the ground-water-model data used to derive the water-table altitude contours, (2) larger pumping rates of present and possible wells than simu lated in the model, (3) wells not included in the ground- water model, and (4) possible changes in the recharge rate to the aquifer due to climate or other changes. For example, decreased recharge rates to the aquifer would result in a lower freshwater head and increased likeli hood of saltwater intrusion upgradient of the potential saltwater intrusion zone.
IDENTIFICATION OF POTENTIAL PUBLIC WATER-SUPPLY AREAS
Once the criteria-specific data layers were created, they were used in an overlay analysis to identify poten tial water-supply areas. Initially, all areas of Cape Cod
were considered to have the potential for public water supply. As the criteria were applied, or the data layers overlaid, areas with limitations on the potential for public water supply were successively eliminated from consideration. After application of the seven criteria, any remaining areas those with no criteria or no limitations are the primary areas for potential public water supply.
The criteria were ranked based on the degree to which a criterion may impose a limitation on the potential for public water supply. Criteria indicative of potentially poor water quality were considered more limiting than other criteria on potential public water supply and were therefore given a higher rank. Consid ering the consequences of saltwater intrusion, the expense of desalinization and potential loss or negative effects on water-supply wells, the potential saltwater intrusion zone was determined to be the most limiting criterion for potential public water supply. The criteria in order of increasing limitations on the potential for public water supply (or increasing rank) are: restricted use, wetland zones, agricultural land use, residential land-use zones, business/utility land-use zones, ground- water contamination zones, and the potential saltwater intrusion zone.
The data layers were ranked or overlaid in a spe cific order to increase the usefulness of the analysis. Although a particular area may be included in more than one criterion, the ranking of the criteria results in only a single criterion, the criterion with the most limitations on the potential for water supply being shown after overlay of all criteria. The ranking scheme allows areas with lower ranked criteria, or areas with less limiting criteria, to be considered for potential public water supplies after taking into account relevant land-use restrictions or water-quality concerns.
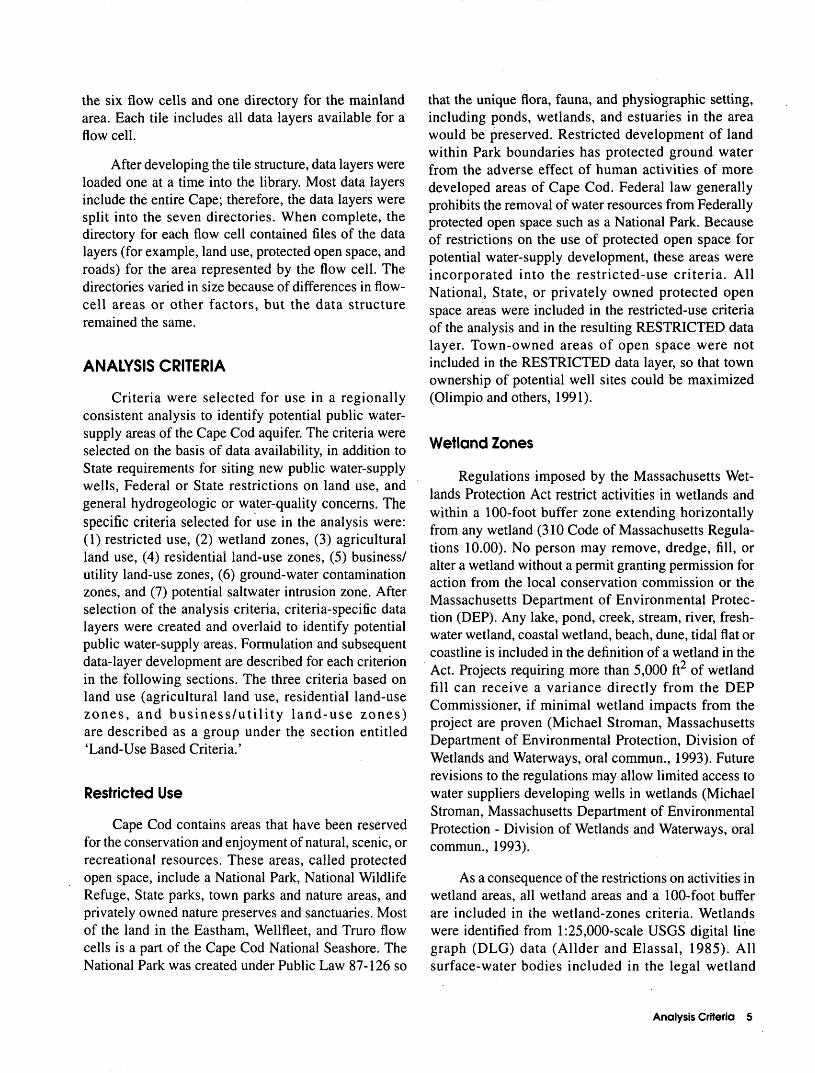
The overlay analysis is illustrated in figure 2 for a generalized area, and on the insets of plate 1 for a specific area. Areas with restricted use are shaded green in figure 2A, with ocean and bay areas shown in light blue. The remaining area, shown in figure 2A as white, consists of areas not included in the applied criterion. The next ranked data layer, wetland zones, is overlaid on the previous data layer in figure 2B. The two compo nents of the wetland zones criterion, the buffered coast line and wetlands, are clearly visible. Some restricted- use areas and some white areas have been covered by area included in the wetland zones criterion. As all the
Identification of Potential Public Water-Supply Areas 9

Figure 2. Example of overlay analysis for a generalized area; data layers are overlaid in order
10 Identification of Potential Public Water-Supply Areas of the Cape Cod Aquifer, Massachusetts, Using A Geographic Information System

EXPLANATION
D Area of potential public water supply
D Restricted use
D Wetland zone
D Agricultural land use
n Residential land-use zones
n Business/Utility land-use zones
D Ground-water contamination zones
Potential saltwater intrusion zones
of increasing limitations on the potential for public water supply.
Identification of Potential Public Water-Supply Areas 11
data layers are overlaid, the shaded areas expand, leav ing only small areas of white (figs. 2 A-G). The areas identified by the analysis as potential public water sup plies are the areas not included in the seven applied cri teria, or the white areas, in figure 2G. Because of the ranking scheme, only the highest ranked criterion for a shaded area is shown in the final data layer (fig. 2G).
Potential Public Water-Supply Areas
The results of the overlay analysis for Cape Cod are shown on plate 1. Most of the area on the plate is shaded because it is included within a criterion; how ever, there are many areas on the plate with no shading (white). These white areas are not included in the applied criteria the analysis indicates that these areas have no limitations on the potential public water supply. These areas consist primarily of undeveloped land; ground water that underlies undeveloped land generally has the lowest and least variable concentrations of con taminants from human activities. The areas identified as potential public water supplies range from 0.5 to 19.3 percent of the total area of each of the five flow cells, as shown in table 2. Results are not included in table 2 for the Provincetown flow cell and mainland areas of Barn- stable County due to limited data; although available data were included in the analysis and are shown on the plate for these areas. Potential'public water supplies account for 13.7 percent of the total area of the five flow cells.
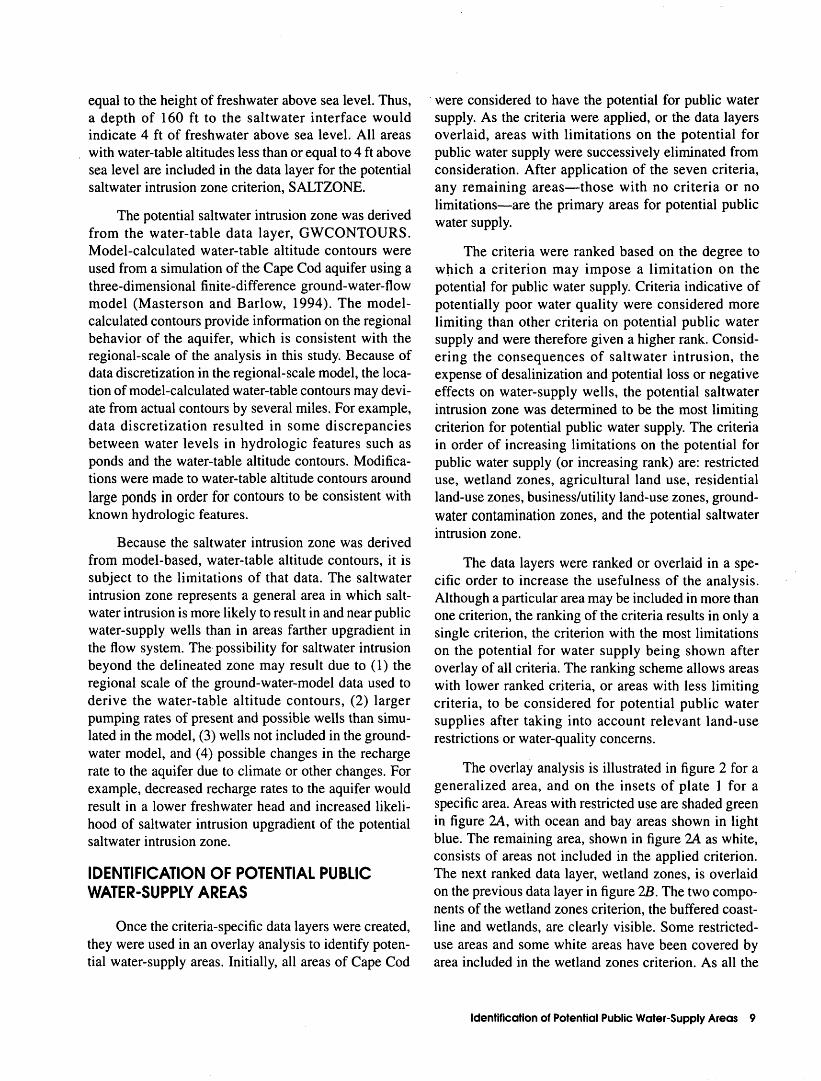
The percentage of potential public water-supply area is higher for the West Cape flow cell than for other flow cells. As discussed in the section "Ground-Water Contamination Zones," several sources of contamina tion have been identified but not fully delineated on the Massachusetts Military Reservation. These sources of contamination and associated buffer areas could not be included in the ground-water contamination zone data layer, which contributes to the higher percentage of potential public water-supply area for the West Cape flow cell. The Massachusetts Military Reservation accounts for 13.7 percent of the total area of the West Cape flow cell (fig. 3). If the contribution of the Massa chusetts Military Reservation is subtracted, the poten tial public water-supply area of the West Cape flow cell would decrease from 19.3 to 9.6 percent.
Additionally, 22.6 percent of the aquifer in West Cape flow cell is composed of moraine (fig. 3). Because of highly variable lithology and generally large depths
Table 2. Percentage of area in each overlay criteria for five flow cells of the Cape Cod aquifer, Massachusetts
[Results are not shown for the Provincetown flow cell and mainland areas of Barnstable County due to limited data. Percentages do not sum to 100 due to rounding. Percentages in parentheses have been adjusted for area of the West Cape flow cell included in the Massachusetts Military Reservation and moraines. <, actual value is less than value shown]
OverlayPercentage of flow cell
West East East- Well- Cape Cape ham fleet Truro Total
Area of 19.3 7.9 0.7 0.5 1.3 13.7 potential (5.8) (5.6) public water supply.
Restricted 1.5 2.5 17.5 26.6 16.7 4.5 use.
Wetland 3.5 5.0 1.5 2.0 <0.05 3.6 zones.
Agricultural 2.3 1.3 0.5 <0.05 0.4 1.7 land use.
Residential 30.7 40.6 33.4 18.5 20.9 32.4land-usezones.
Business/ 13.5 11.8 10.2 4.6 9.1 12.2 utility land- use zones.
Ground- 7.1 3.3 2.9 2.4 0.3 5.4water contaminationzones.
Potential 22.2 27.7 33.3 45.4 51.3 26.4saltwaterintrusionzone.
to water, moraines are considered a poor source of ground water for public water-supply wells (Guswa and LeBlanc, 1985). Most public water-supply wells on Cape Cod are located within outwash plains or stratified-drift deposits. If areas of moraine are sub tracted from the areas identified as potential public water supplies outside of the Massachusetts Military Reservation, the potential public water-supply area of the West Cape flow cell would decrease to 5.8 percent. When summed for the entire area included within the five flow cells considered, the potential public water- supply area decreases to 5.6 percent after adjustments to the West Cape flow cell.
12 Identification of Potential Public Water-Supply Areas of the Cape Cod Aquifer, Massachusetts, Using A Geographic Information System

PROVINCETOWN FLOW CELL
(PILGRIM)
EXPLANATION
POTENTIAL PUBLIC WATER-SUPPLY AREAS
SANDWICH MORAINE
BUZZARDS BAY MORAINE
APPROXIMATE BOUNDARIES OF THE SIX FLOW CELLS OF THE CAPE COD AQUIFER. FLOW CELL NAMES IN PARENTHESES USED BY CAPE COD COMMISSION (JANIK, 1987).
BOUNDARY OF MASSACHUSETTS MILITARY RESERVATION
7005'
Pilgrim Heights
ATLANTIC OCEAN
BUZZARDS BAY
41°40'
NANTVCKET SOUND
02468 10 KILOMETERS
Figure 3. Primary potential public water-supply areas of the Cape Cod aquifer, Massachusetts.
After adjustments to the West Cape flow cell, a dis tinction between the West Cape and East Cape flow cells, and the Eastham, Truro, and Wellfleet flow cells can be identified. As compared to the latter three flow cells, the West Cape and East Cape flow cells have sim ilar sized areas of potential public water supply and also a similar proportion of area within each criterion (table 2). Because the Eastham, Wellfleet, and Truro
flow cells have considerably less percentage of their total area identified as potential public water supplies than do the West Cape and East Cape flow cells, siting public water-supply wells requires the balancing of dif ferent priorities. For example, the restricted-use criterion accounts for a relatively large percentage of total area in the three smaller flow cells.
Identification of Potential Public Water-Supply Areas 13
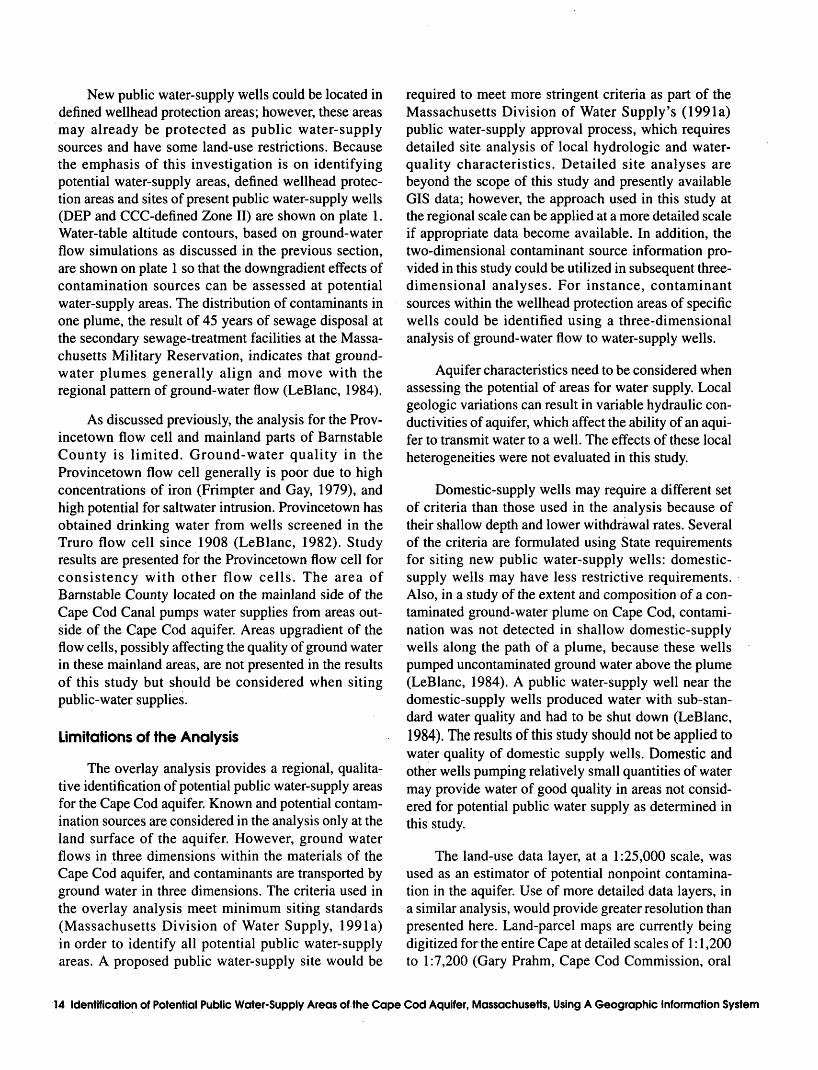
New public water-supply wells could be located in denned wellhead protection areas; however, these areas may already be protected as public water-supply sources and have some land-use restrictions. Because the emphasis of this investigation is on identifying potential water-supply areas, defined wellhead protec tion areas and sites of present public water-supply wells (DEP and CCC-defined Zone II) are shown on plate 1. Water-table altitude contours, based on ground-water flow simulations as discussed in the previous section, are shown on plate 1 so that the downgradient effects of contamination sources can be assessed at potential water-supply areas. The distribution of contaminants in one plume, the result of 45 years of sewage disposal at the secondary sewage-treatment facilities at the Massa chusetts Military Reservation, indicates that ground- water plumes generally align and move with the regional pattern of ground-water flow (LeBlanc, 1984).
As discussed previously, the analysis for the Prov- incetown flow cell and mainland parts of Barnstable County is limited. Ground-water quality in the Provincetown flow cell generally is poor due to high concentrations of iron (Frimpter and Gay, 1979), and high potential for saltwater intrusion. Provincetown has obtained drinking water from wells screened in the Truro flow cell since 1908 (LeBlanc, 1982). Study results are presented for the Provincetown flow cell for consistency with other flow cells. The area of Barnstable County located on the mainland side of the Cape Cod Canal pumps water supplies from areas out side of the Cape Cod aquifer. Areas upgradient of the flow cells, possibly affecting the quality of ground water in these mainland areas, are not presented in the results of this study but should be considered when siting public-water supplies.
Limitations of the Analysis
The overlay analysis provides a regional, qualita tive identification of potential public water-supply areas for the Cape Cod aquifer. Known and potential contam ination sources are considered in the analysis only at the land surface of the aquifer. However, ground water flows in three dimensions within the materials of the Cape Cod aquifer, and contaminants are transported by ground water in three dimensions. The criteria used in the overlay analysis meet minimum siting standards (Massachusetts Division of Water Supply, 1991a) in order to identify all potential public water-supply areas. A proposed public water-supply site would be
required to meet more stringent criteria as part of the Massachusetts Division of Water Supply's (199la) public water-supply approval process, which requires detailed site analysis of local hydrologic and water- quality characteristics. Detailed site analyses are beyond the scope of this study and presently available GIS data; however, the approach used in this study at the regional scale can be applied at a more detailed scale if appropriate data become available. In addition, the two-dimensional contaminant source information pro vided in this study could be utilized in subsequent three- dimensional analyses. For instance, contaminant sources within the wellhead protection areas of specific wells could be identified using a three-dimensional analysis of ground-water flow to water-supply wells.
Aquifer characteristics need to be considered when assessing the potential of areas for water supply. Local geologic variations can result in variable hydraulic con ductivities of aquifer, which affect the ability of an aqui fer to transmit water to a well. The effects of these local heterogeneities were not evaluated in this study.
Domestic-supply wells may require a different set of criteria than those used in the analysis because of their shallow depth and lower withdrawal rates. Several of the criteria are formulated using State requirements for siting new public water-supply wells: domestic- supply wells may have less restrictive requirements. Also, in a study of the extent and composition of a con taminated ground-water plume on Cape Cod, contami nation was not detected in shallow domestic-supply wells along the path of a plume, because these wells pumped uncontaminated ground water above the plume (LeBlanc, 1984). A public water-supply well near the domestic-supply wells produced water with sub-stan dard water quality and had to be shut down (LeBlanc, 1984). The results of this study should not be applied to water quality of domestic supply wells. Domestic and other wells pumping relatively small quantities of water may provide water of good quality in areas not consid ered for potential public water supply as determined in this study.
The land-use data layer, at a 1:25,000 scale, was used as an estimator of potential nonpoint contamina tion in the aquifer. Use of more detailed data layers, in a similar analysis, would provide greater resolution than presented here. Land-parcel maps are currently being digitized for the entire Cape at detailed scales of 1:1,200 to 1:7,200 (Gary Prahm, Cape Cod Commission, oral
14 Identification of Potential Public Water-Supply Areas of the Cape Cod Aquifer, Massachusetts, Using A Geographic Information System

commun., 1993). The land-parcel data base includes a State class code for each parcel. The State code identifies the exact use of the land parcel and could be used to group parcels with similar potential constitu ents. In addition, there are many large data bases that are not geographically referenced and use a local street address to specify site location. The only practical way to use this data in a GIS is to match site locations using a street address. This capability, termed address match ing, is available through land-parcel data. Land-parcel data were included in the interactive menu application for the town of Brewster to demonstrate the analysis possibilities such a detailed data layer could provide.
DEVELOPMENT OF INTERACTIVE GIS APPLICATION
A second objective of this study was to design an interactive application to assist in the viewing of digital data layers available for Cape Cod (see Appendix A). A menu-driven application was developed to provide interactive graphics display and query of the Cape Cod data base similar to the menu-applications programs of Liebermann and others (1993). The application operates on a UNIX-based workstation and uses ARC/INFO Version 6.1 (Environmental Systems Research Institute, Inc., 1992) GIS software.
ARC Macro Language was used extensively to create the user-friendly, menu-driven application. Cur rently, 30 files make up the directory that controls the application. Throughout an interactive session, a mouse is used to select from menu options, to click features on or off, open temporary windows to view detailed infor mation on a feature, or to set particular areas of interest for display. With the menu-driven application, it is pos sible for a user with little or no GIS experience to view available digital data layers.
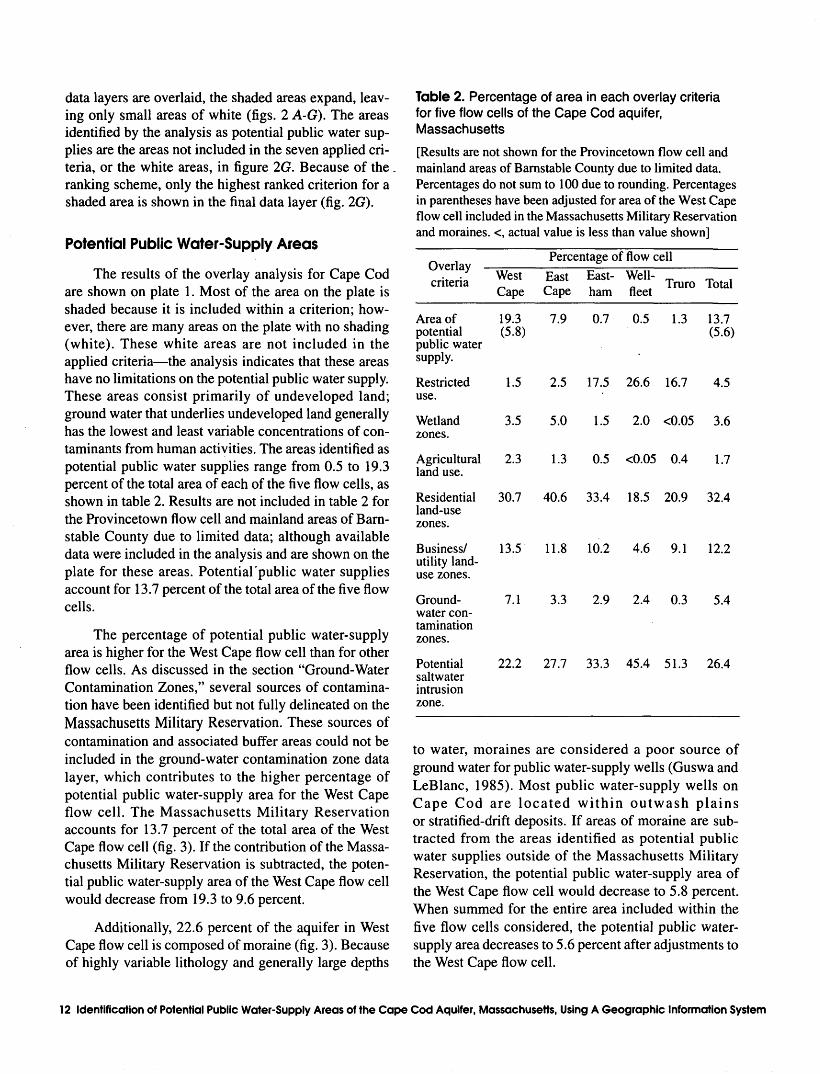
At the start of a graphics session, a main display screen showing the six flow cells of Cape Cod, a map extent window, the main menu, and an explanation appear (fig. 4). The map extent window shows the Cape with the geographic location of the area drawn in the main display screen. Initially, the entire Cape is shown shaded; the shaded area changes as new display areas are selected. The explanation shows the shading pat terns, line types, and marker symbols of all data layers available for display from the data base. After a data layer has been selected and drawn on the screen, the text
associated with the data layer in the explanation will change color. This feature aids in distinguishing which data layers are currently selected.
Data can be displayed for all six flow cells of the Cape Cod aquifer, the mainland, or any area of interest. After an area has been selected, it is drawn on the main display screen with the overlay analysis data layer shown. The map extent window will show the new area of display. There are many options available through the main menu (fig. 4). Aside from the area selection options, the menu design is mostly combined into three main subheadings with the titles map display, tools, and custom made. Additional submenus provide more detailed features.
Map Display. The submenus listed below Map Display, on the right side of the graphics screen, allow data layers to be selected from the data base and dis played on the main display screen. Data layers can be drawn by using the mouse to activate or deactivate each data layer. The submenus are land use, Digital Line Graph (DLG) data, hazardous-waste data, overlay data, other data, and parcels. Each submenu lists all available data layers, and allows any combination of the data to be selected and drawn on the main display. Any data layer that has been selected during the session will remain active when changing the map view. An active data layer can be deactivated with the submenu and deactivating the data layer or by returning to the default settings in the main menu.
Tools. The submenus and options listed below the Tools option on the main menu (fig. 4) are used for locating, identifying, and displaying specific areas of interest. Map Window, the first of these submenu options allows an area to be enlarged, movement to an adjacent area, or return to the original view. The area can be selected by entering a lower left and upper right coordinate on the map, or by moving in to a center-point using a specified scaling factor. At certain scales, differ ences in detail between some of the data layers will be noticeable when viewed together. These differences are most noticeable when the land-parcel data layer (Cape Cod Commission, written commun., 1993) is drawn with any other data layer. The differences are due to the scale at which the original data layer was digitized or scanned.
Measure is a submenu with many options. A latitude/longitude coordinate can be identified by using a cursor. A latitude/longitude coordinate can be located
Development of Interactive GIS Application 15
ET ARCPLOT
KNTIFICATION OF POTENTIAL PUBLIC WA' . v|? THE CAPE COD AQUIFER, MASSACHUS5
User: Userl, Rev: Cape Cod Menu Program 1.1.1
MAPSCALE: 65,000 MAPEXTENT: 810627,175661,1042349, 410517
xwud; WOW Main Menu
j Select A Fiowcell
Map Display Landuse Data
1:24KDLGData ?
Haz Waste Data
Screening Data]
Other Data
Parcels
Tools Map Window
Measure
Identify :
Identify Parcel s
Resetect Parcels
_ Refresh current
^Default settings
Save to Plotfile
Custom Made Coverages
^Symbols I
Paint
Arcpjot command '
Arc command
System command
WESTCAPE
PROVINCETOWNTRURO
WEUFLEET
EASTCAPE
OVERLAY ANALYSIS
D Potential Water Supply D Residential Land-Use Zones Restricted Use D Business/Utility Land-Use Zones O Wetland Zones G Ground-Water Contam. Zones n Agricultural Land Use O Potential Saltwater Intr. Zone
HW SITES ( OEP ) Priority Non-Priority LTBIRemedial
If. Waiver
U Plumes (CCC)DACECD Open Space D Zone II (DEP) D ZOCS (CCC)
89 GW Elev. Town Lines Parcels (CCC) Public Wells
D Spectator Recr.
& Lakes and PondsD WetlandsQ Cranberry Bogs
Rivers and Streams Canals through Bogs Major Roads AM Roads
D OrchardsO> 1/2 Acre Lots
D Freshwater Wetland D Water Based Recr. D 1 /4-1/2 Acre LotsD Salt MarshD Areas of Accretionn Open LandD ForestO Urban Open Participation Recr.
DGolf n Marina d Mining , DCranbei O Cropland n Pasture
O< 1/4 Acre Lots n Multi-Family Res.
rcial.al
n Transportation D Waste Disposal
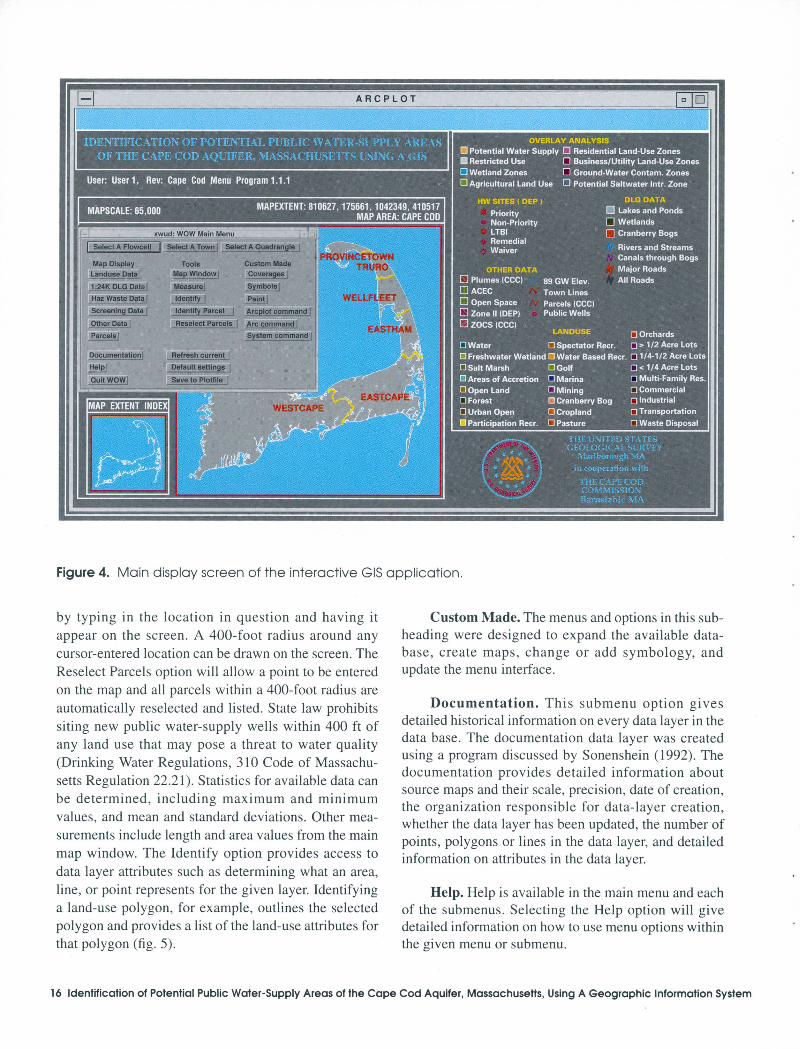
Figure 4. Main display screen of the interactive GIS application.
by typing in the location in question and having it appear on the screen. A 400-foot radius around any cursor-entered location can be drawn on the screen. The Reselect Parcels option will allow a point to be entered on the map and all parcels within a 400-foot radius are automatically reselected and listed. State law prohibits siting new public water-supply wells within 400 ft of any land use that may pose a threat to water quality (Drinking Water Regulations, 310 Code of Massachu setts Regulation 22.21). Statistics for available data can be determined, including maximum and minimum values, and mean and standard deviations. Other mea surements include length and area values from the main map window. The Identify option provides access to data layer attributes such as determining what an area, line, or point represents for the given layer. Identifying a land-use polygon, for example, outlines the selected polygon and provides a list of the land-use attributes for that polygon (fig. 5).
Custom Made. The menus and options in this sub heading were designed to expand the available data base, create maps, change or add symbology, and update the menu interface.
Documentation. This submenu option gives detailed historical information on every data layer in the data base. The documentation data layer was created using a program discussed by Sonenshein (1992). The documentation provides detailed information about source maps and their scale, precision, date of creation, the organization responsible for data-layer creation, whether the data layer has been updated, the number of points, polygons or lines in the data layer, and detailed information on attributes in the data layer.
Help. Help is available in the main menu and each of the submenus. Selecting the Help option will give detailed information on how to use menu options within the given menu or submenu.
16 Identification of Potential Public Water-Supply Areas of the Cape Cod Aquifer, Massachusetts, Using A Geographic Information System

ARCPLOT
User: Used, Rev: Cape Cod Menu Program 1.1.1
MAPSCALE: 42,990 MAPEXTENT:870268,175661,1005027, 357802 MAP AREA: FLOW/CELL TRURO
HREfl:PERIMETER : LnNDUSEttIfihDUSE-IDLU-1985CH90UJ-1990TOWN-IB
iLUSS ILII90
OVERLAY ANALYSIS
El Potential Water Supply D Residential Land-Use Zones Restricted Use D Business/Utility Land-Use Zones D Wetland Zones O Ground-Water Contam. Zones Q Agricultural Land Use D Potential Saltwater Intr. Zone
HW SITES { DEP )
Priority Non-Priority
I Potential Saltwater Intr. Zone
DLG DATA ^ Lakes and Ponds D Wetlands
ranberry Bogs
75265.938 1238.573
61 253
3 13 13
13FOREST > 1/2 ACRE LOTS
ivers and Streams anals through Bogs lajor Roads II Roads
Q Orchards Q> 1/2 Acre Lots
D Freshwater Wetland H Water Based Recr. D 1/4.1/2 Acre LotsD Salt Marsh UGolfO Areas of Accretion O MarinaD Open Land D MiningD Forest Q CranbeD Urban Open Q Croplar
Q Cranberry Bog O Cropland
I Participation Recr. G Pasture
Q < 1/4 Acre Lots D Multi-Family Res. D Commercial Q Industrial G Transportation D Waste Disposal
Figure 5. Use of the Identify tool-option from the interactive GIS application.
SUMMARY AND CONCLUSIONS
Ground water is the sole source of drinking water to most municipal and domestic supplies on Cape Cod, Massachusetts. Past contamination and changing land use adversely affect the water-supply potential of the ground-water resource. The protection of the ground- water resources necessary to support present and future drinking-water needs is often in conflict with the pres sures for increased land development. This study iden tified potential public water-supply areas of the Cape Cod aquifer. Results of this study will be used by the Cape Cod Commission in the implementation of a regional aquifer protection strategy.
A geographic information system was used to create, store, and manipulate the large spatial data base required for this study. A scale-consistent data base was created from available regional-scale data layers and newly digitized data. Seven criteria were selected for
use in a regionally consistent analysis to identify poten tial water-supply areas of Cape Cod. Criteria were selected on the basis of data availability, in addition to State requirements for siting new public water-supply wells, Federal or local restrictions on land use, and gen eral hydrogeologic or water-quality concerns. The specific criteria used in the analysis were: restricted use, wetland zones, agricultural land use, residential land- use zones, business/utility land-use zones, ground- water contamination zones, and potential saltwater intrusion zone. Data layers were created for each criterion and overlaid in a process that sequentially eliminated areas from consideration as potential public water supplies. The areas remaining after the overlay analysis are the primary areas for potential public water supply.
The areas identified as potential public water supply range from 0.5 to 19.3 percent of the total area in each of the five flow cells considered, or 13.7 percent of
Summary and Conclusions 17
the total area of the five flow cells. Adjustments to the West Cape flow cell decrease the range from 0.5 to 7.9 for the five flow cells, or 5.6 percent of the total flow- cell area. Results are not included for the Provincetown flow cell and mainland areas of Barnstable County due to limited data.
The potential public water-supply areas reflect the elimination of any area included within a criterion. The criteria were ranked so that criteria most limiting to potential public water supplies the criteria indicative of potentially poor water quality were given higher rank than other criteria. Many areas may be included within several of the criteria; however, only the highest ranked criterion is shown for a shaded area. The ranking scheme allows for the inclusion of areas with lower ranked criteria as potential public water supplies, after the evaluation of potential water-quality concerns in these areas.
This study demonstrated the use of geographic information system technology to aid regional and local planners in making ground-water resource management decisions. An interactive menu-driven application, developed for this study, allows access to study results and many other data layers for Cape Cod. Access to this information can decrease the time needed to investigate planning and management decisions and identify effec tive solutions to planning problems. The data base and menu-driven application were designed to be adaptable to future needs and the availability of more refined data layers. The approach used in this study is readily trans ferable to areas of similar hydrogeologic setting if a GIS data base is available. The menu-driven application is adaptable for use with any GIS data base.
REFERENCES CITED
ABB Environmental Services, Inc., 1992, Groundwater remediation strategy report Massachusetts Military Reservation, Cape Cod, Massachusetts, First Edition: prepared for Hazardous Waste Remedial Actions Program, Oak Ridge, Tennessee.
Allder, W.R., and Elassal, A.A., 1985, Digital line graphs from l:24,000-scale maps: U.S. Geological Survey Circular 895-C, 79 p.
Belfit, G.C., Cambareri, T.C., McCaffery, D.B., Prahm, G.K., and Smith, B.P., 1993, Monomoy groundwater protec tion project: Barnstable, Massachusetts, Cape Cod Commission, 52 p.
Cain, D., Helsel, D.R., and Ragone, S.E., 1989, Preliminary evaluations of regional ground-water quality in relation to land use: Ground Water, v. 27, p. 230-244.
Cambareri, T.C., Belfit, G.C., and Janik, D.S., 1989, Truro/ Provincetown aquifer assessment and groundwater pro tection plan: Barnstable, Massachusetts, Cape Cod Plan ning and Economic Development Commission, 65 p.
Cape Cod Commission, 1991a, Regional policy plan for Barnstable County: Barnstable, Massachusetts, Cape Cod Commission, 99 p.
___1991b, Regional policy plan atlas for Barnstable County: Barnstable, Massachusetts, Cape Cod Commission, 12 maps.
Eckhardt, D.A., Flipse, W.J., Jr., and Oaksford, E.T., 1989, Relation between land use and ground-water quality in the upper glacial aquifer in Nassau and Suffolk Coun ties, Long Island, New York: U.S. Geological Survey Water-Resources Investigations Report 86-4142, 35 p.
Environmental Systems Research Institute, Inc., 1992, ARC/INFO, Version 6.1, Redlands, California.
Fetter, C.W., 1988, Applied Hydrogeology, Second edition: Columbus, Ohio, Merrill Publishing Company, 592 p.
Frimpter, M.H., and Gay, F.B., 1979, Chemical quality of ground water on Cape Cod, Massachusetts: U.S. Geo logical Survey Water-Resources Investigations Report 79-65, lip.
Grady, S.J., and Fisher-Weaver, M., 1988, Preliminary appraisal of the effects of land use on water quality in stratified-drift aquifers in Connecticut: U.S. Geological Survey Water-Resources Investigations Report 87-4005, 41 p.
18 Identification of Potential Public Water-Supply Areas of the Cape Cod Aquifer, Massachusetts, Using A Geographic Information System

Guswa, J.H., and LeBlanc, D.R., 1985, Digital models of ground-water flow in the Cape Cod aquifer system, Mas sachusetts: U.S. Geological Survey Water-Supply Paper 2209, 112 p.
Janik, D.S., 1987, State of the aquifer report: Barnstable, Massachusetts, Cape Cod Planning and Economic Development Commission.
LeBlanc, D.R., 1982, Potential hydrologic impacts of ground-water withdrawal from the Cape Cod National Seashore, Truro, Massachusetts: U.S. Geological Survey Open-File Report 82-438, 42 p.
___1984, Sewage plume in a sand and gravel aquifer, Cape Cod, Massachusetts: U.S. Geological Survey Water- Supply Paper 2218, 28 p.
LeBlanc, D.R., Guswa, J.H., Frimpter, M.H., and Londquist, C.J., 1986, Ground-water resources of Cape Cod, Massachusetts: U.S. Geological Survey Hydrologic Investigations Atlas HA-692,4 sheets.
Liebermann, T.D., Ciegler, J.C., and Lambert, S.C., 1993, Interactive display and query of near real-time data from a hydrologic alert network, in Harlin, J.M., and Lanfear, K.J. (eds.), Geographic Information Systems and Water Resources: American Water Resources Association, Symposium, Mobile, Alabama, March 14-17, 1993, Proceedings, p. 517-522.
Massachusetts Bureau of Waste Cleanup, 1991, List of con firmed disposal sites and locations to be investigated: Boston, Massachusetts, Department of Environmental Protection.
Massachusetts Division of Water Supply, 1991a, Guidelines and policies for public water systems: Boston, Massa chusetts, Department of Environmental Protection.
___1991b, Water Supply Protection Atlas Handbook: Lakeville, Massachusetts, Department of Environmental Protection.
Massachusetts Geographic Information System, 1993, MassGIS data layer descriptions and guide to user services: Boston, Massachusetts, Executive Office of Environmental Affairs Data Center, 77 p.
Masterson, J.P., and Barlow, P.M., 1994, Effects of simulated ground-water pumping and recharge on ground-water flow in Cape Cod, Martha's Vineyard, and Nantucket Island Basins, Massachusetts: U.S. Geological Survey Open-File Report 94-316, 78 p.
Oldale, R.N., 1969, Seismic investigations on Cape Cod, Martha's Vineyard, and Nantucket, Massachusetts, and a topographic map of the basement surface from Cape Cod Bay to the Islands: U.S. Geological Survey Professional Paper 650-B, p. B122-B127.
___1976, Notes on the generalized geologic map of Cape Cod: U.S. Geological Survey Open-File Report 76-765, 23 p.
Oldale, R.N., and O'Hara, C.J., 1984, Glaciotectonic origin of the Massachusetts coastal end moraines and a fluctu ating late Wisconsinan ice margin: Geological Society of America Bulletin, v. 95, p. 61-74.
Olimpio, J.C., Flynn, E.G., Tso, Saiping, and Sleeves, P.A., 1991, Use of a geographic information system to assess risk to ground-water quality at public-supply wells, Cape Cod, Massachusetts: U.S. Geological Survey Water-Resources Investigations Report 90-4140, 35 p.
Persky, J.H., 1986, The relation of ground-water quality to housing density, Cape Cod, Massachusetts: U.S. Geo logical Survey Water-Resources Investigations Report 86-4093, 28 p.
Ryan, B.J., 1980, Cape Cod aquifer, Cape Cod, Massachu setts: U.S. Geological Survey Water-Resources Investigations Report 80-571, 23 p.
Sonenshein, R.S., 1992, Documentation of a digital spatial data base for hydrologic investigations, Broward County, Florida: U.S. Geological Survey Water- Resources Investigations Report 92-4061, p. 8-9.
Zoto, G. A., and Gallagher, Tara, 1988, The Cape Cod Aquifer Management Project (CCAMP) Final Report: Washing ton, D.C., EPA 901/3-88-006, September 1988, 183 p.
References Cited 19

APPENDIX A: Cape Cod Data Base
Q.
§ 9. ! I cr
o t ? s J2.
(Q i §
</> 1
Appendix
A:
Ca
pe
Co
d d
ata
bas
e[M
assG
IS, M
assa
chus
etts
Geo
grap
hic
Info
rmat
ion
Syst
em (
1993
); C
CC
, Cap
e C
od C
omm
issi
on (
1991
b); A
BB
, AB
B E
nviro
nmen
tal,
Inc.
(19
92);
USG
S-M
A, U
.S. G
eolo
gica
l Su
rvey
, Mas
sach
uset
ts O
ffic
e; M
A-D
WS,
Mas
sach
uset
ts D
ivis
ion
of W
ater
Sup
ply
(199
1b);
MA
-BW
C, M
assa
chus
etts
Bur
eau
of W
aste
Cle
anup
(19
91);
MA
-DEP
, Mas
sach
uset
ts
Dep
artm
ent o
f Env
ironm
enta
l Pro
tect
ion]
Lib
rary
-dat
a la
yer
nam
eA
CE
C
BU
S_L
U_B
UFF
CC
C_P
LU
ME
S
CC
CZ
OC
CO
AST
CO
AST
_BU
FF
CO
NTA
M_Z
ON
E
DE
PZO
C
GW
CO
NT
OU
RS
HW
_SIT
ES
LA
ND
FIL
LS
LA
ND
USE
LU
_GR
OU
P
Full
nam
e
Are
as o
f cri
tical
env
iron
m
enta
l con
cern
Buf
fere
d bu
sine
ss/u
tility
land
use
CC
C-d
elin
eate
d po
tent
ial
plum
esC
CC
-del
inea
ted
zone
s of
cont
ribu
tion
Hig
h w
ater
coa
stlin
e
Buf
fere
d co
ast
Gro
und-
wat
er c
onta
min
atio
n zo
nes
MA
-DE
P-ap
prov
ed z
ones
of c
ontr
ibut
ion
Gro
und-
wat
er a
ltitu
de c
on
tour
sH
azar
dous
was
tesi
tes
Land
fills
and
sew
age-
trea
tm
ent p
lant
s19
72,
1985
, and
199
0 la
ndus
e an
d la
nd c
over
Gro
uped
land
-use
(19
90)
cate
gori
es
Orig
inal
da
ta s
ourc
eM
assG
IS
Mas
sGIS
CC
C
CC
C
Mas
sGIS
Mas
sGIS
AB
B/C
CC
/M
A-D
WS/
MA
-BW
C
Mas
sGIS
USG
S-M
A
MA
-DW
S/M
A-B
WC
CC
C
Mas
sGIS
Mas
sGIS
Sour
ce s
cale
1:25
,000
1:25
,000
1:25
,000
1:25
,000
1:25
,000
1:25
,000
1:25
,000
1:25
,000
See
desc
rip
tion
1:25
,000
1:25
,000
1:25
,000
1:25
,000
Feat
ure
type
poly
gon
poly
gon
poly
gon
poly
gon
line,
poly
gon
poly
gon
poly
gon
poly
gon
line,
poly
gon
poin
t
poly
gon
poly
gon
poly
gon
Des
crip
tion
Loc
atio
n of
are
as d
esig
nate
d as
Are
as o
f Cri
tical
Env
ironm
enta
lC
once
rn.
Dat
a la
yer c
reat
ed fo
r ove
rlay
anal
ysis
; bus
ines
s/ut
ility
land
-use
grou
p bu
ffer
ed 4
00 fe
et.
Pote
ntia
l plu
mes
fro
m la
ndfil
ls a
nd s
ewag
e tr
eatm
ent p
lant
s;pl
umes
buf
fere
d 40
0 fe
et.
Zon
es o
f con
trib
utio
n to
pub
lic w
ater
-sup
ply
wel
ls a
s de
linea
ted
byth
e C
CC
.L
ocat
ion
of h
igh
wat
er c
oast
line.
Dat
a la
yer c
reat
ed f
or o
verla
y an
alys
is; t
he c
oast
line
buff
ered
100
feet
.D
ata
laye
r cre
ated
for
ove
rlay
anal
ysis
. The
gro
und-
wat
er c
onta
mi
natio
n zo
ne c
onsi
sts
of C
CC
.PL
UM
ES,
MM
R_P
LUM
ES a
ndpr
iori
ty h
azar
dous
was
te s
ites
(fro
m H
W_S
ITES
) buf
fere
d40
0 fe
et.
MA
-DE
P-ap
prov
ed z
ones
of c
ontr
ibut
ion
to p
ublic
wat
er-s
uppl
yw
ells
.C
onto
ured
hea
d va
lues
fro
m g
roun
d-w
ater
flow
mod
el s
imul
atin
g19
89 p
umpi
ng c
ondi
tions
(M
aste
rson
and
Bar
low
, 19
94).
Dat
a la
yer c
reat
ed f
or th
e ov
erla
y an
alys
is. D
igiti
zed
from
myl
arat
las,
join
ed to
dig
ital d
ata
base
.Lo
catio
ns o
f lan
dfill
s an
d se
wag
e-tre
atm
ent p
lant
s.
Dat
a la
yer c
onta
inin
g 25
cat
egor
ies
of la
nd u
se.
Dat
a la
yer c
reat
ed fo
r ove
rlay
anal
ysis
; 25
land
-use
cat
egor
ies
divi
ded
into
4 la
nd-u
se g
roup
s ba
sed
on th
e si
mila
rity
of p
oten
tial
MM
R_P
LU
ME
S
OPE
NSP
AC
E
MM
R-k
now
n pl
ume
exte
nts
Prot
ecte
d op
en s
pace
AB
B
1:33
,000
po
lygo
n
Mas
sGIS
1:
25,0
00
poly
gon
wat
er-q
ualit
y co
nstit
uent
s. L
and-
use
grou
ps a
re b
usin
ess/
utili
ty,
resi
dent
ial,
agric
ultu
ral,
and
unde
velo
ped.
Der
ived
from
LA
ND
USE
dat
a la
yer.
Plum
es o
n M
assa
chus
etts
Mili
tary
Res
erva
tion
digi
tized
from
pape
r map
s; p
lum
es b
uffe
red
400
feet
.Fe
dera
l, St
ate,
tow
n, a
nd p
rivat
ely
owne
d co
nser
vatio
n la
nd.

Ap
pe
nd
ix A
: C
ape C
od
data
ba
se-C
on
tinu
ed
Lib
rary
-dat
a la
yer
nam
e
OV
ER
LA
Y
PAR
CE
LS
PON
DS
PUB
WE
LL
S
RE
STR
ICT
ED
RE
S_L
U_B
UFF
RO
AD
S
SAL
TZ
ON
E
TO
WN
_LIN
ES
WE
TL
AN
D_B
UFF
Full
nam
e
Ove
rlay
dat
a la
yer
for
this
proj
ect
Lan
d-pa
rcel
map
Surf
ace-
wat
er b
odie
s
Publ
ic w
ater
-sup
ply
wel
ls
Are
as w
ith r
estr
icte
d us
e
Buf
fere
d re
side
ntia
l la
ndus
e
All
road
s
Pote
ntia
l sa
ltwat
erin
trus
ion
zone
Tow
n bo
unda
ries
Buf
fere
d w
etla
nds
Ori
gina
l da
ta s
ourc
e
ccc
uses
Mas
sGIS
Mas
sGIS
Mas
sGIS
Mas
sGIS
USG
S-M
A
Mas
sGIS
/us
esU
SGS
Sour
ce s
cale
Var
iabl
e-pr
imar
ily1:
25,0
00<1
:7,0
001:
24,0
00 &
1:25
,000
1:25
,000
1:25
,000
1:25
,000
1:25
,000
1:25
,000
1:25
,000
1:25
,000
Feat
ure
type
poly
gon
poly
gon
line,
poly
gon
poin
t
poly
gon
poly
gon
line
poly
gon
line
poly
gon
Des
crip
tion
Dat
a la
yer
crea
ted
for o
verl
ay a
naly
sis
from
oth
er c
reat
ed d
ata
laye
rs.
Ava
ilabl
e fo
r the
tow
n of
Bar
nsta
ble
only
.L
akes
, pon
ds,
stre
ams,
fre
shw
ater
wet
land
s, s
alt m
arsh
es, a
nd c
ran
berr
y bo
gs. D
eriv
ed f
rom
USG
S D
igita
l Lin
e G
raph
dat
a la
yer
(Alld
er a
nd E
lass
el,
1985
).Pu
blic
wat
er-s
uppl
y w
ell l
ocat
ions
, inc
ludi
ng w
ater
qua
lity
attr
ibut
es.
Dat
a la
yer
crea
ted
for o
verl
ay a
naly
sis;
pro
tect
ed o
pen
spac
eex
clud
ing
tow
n-ow
ned
area
s.D
ata
laye
r cr
eate
d fo
r ove
rlay
ana
lysi
s; t
he r
esid
entia
l lan
d-us
eca
tego
ry b
uffe
red
400
ft. L
and-
use
cate
gori
es e
xtra
cted
fro
mL
AN
DU
SE d
ata
laye
r.Sm
all
sect
ions
of F
alm
outh
are
at
l:100
,000
-sca
le.
Dat
a la
yer
crea
ted
for
over
lay
anal
ysis
; the
pot
entia
l sa
ltwat
erin
trus
ion
zone
. Con
sist
s of
are
as b
elow
the
4-fo
ot w
ater
-tab
le c
on
tour
. Der
ived
fro
m C
OA
ST a
nd G
WC
ON
TO
UR
S da
ta la
yers
.T
own
boun
dari
es.
Dat
a la
yer
crea
ted
for o
verl
ay a
naly
sis;
sur
face
-wat
er b
odie
s bu
ff
ered
100
fee
t. D
eriv
ed f
rom
USG
S D
igita
l L
ine
Gra
ph d
ata
laye
r(A
llder
and
Ela
ssal
, 19
85).
1 Q.
X

District ChiefMassachusetts - Rhode Island DistrictU.S. Geological Survey28 Lord Road, Suite 280Marlborough, MA 01752