Embed Size (px)
Citation preview
Chapter 5
Identification of Potential
Isoflavone Glycoside Sources
Chapter 5 Identification of Potential Isoflavone Glycoside Sources
153
5.1. Introduction
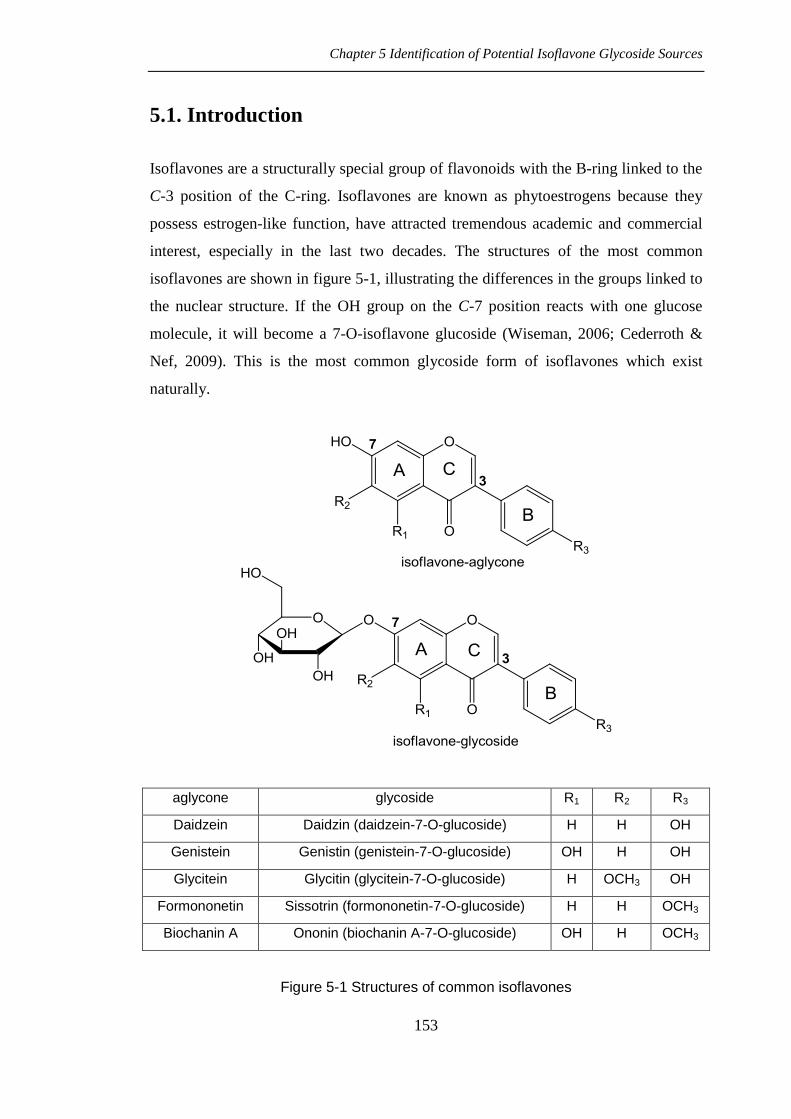
Isoflavones are a structurally special group of flavonoids with the B-ring linked to the
C-3 position of the C-ring. Isoflavones are known as phytoestrogens because they
possess estrogen-like function, have attracted tremendous academic and commercial
interest, especially in the last two decades. The structures of the most common
isoflavones are shown in figure 5-1, illustrating the differences in the groups linked to
the nuclear structure. If the OH group on the C-7 position reacts with one glucose
molecule, it will become a 7-O-isoflavone glucoside (Wiseman, 2006; Cederroth &
Nef, 2009). This is the most common glycoside form of isoflavones which exist
naturally.
aglycone glycoside R1 R2 R3
Daidzein Daidzin (daidzein-7-O-glucoside) H H OH
Genistein Genistin (genistein-7-O-glucoside) OH H OH
Glycitein Glycitin (glycitein-7-O-glucoside) H OCH3 OH
Formononetin Sissotrin (formononetin-7-O-glucoside) H H OCH3
Biochanin A Ononin (biochanin A-7-O-glucoside) OH H OCH3
Figure 5-1 Structures of common isoflavones
Chapter 5 Identification of Potential Isoflavone Glycoside Sources
154
5.1.1. Distribution
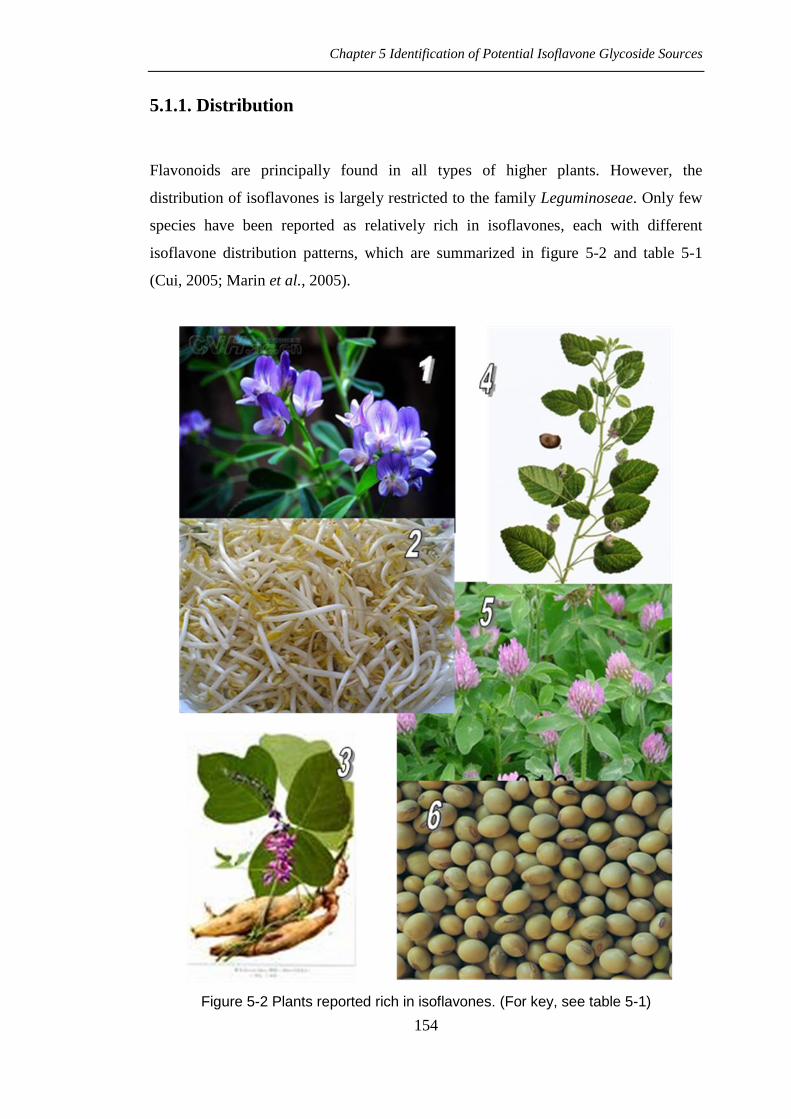
Flavonoids are principally found in all types of higher plants. However, the
distribution of isoflavones is largely restricted to the family Leguminoseae. Only few
species have been reported as relatively rich in isoflavones, each with different
isoflavone distribution patterns, which are summarized in figure 5-2 and table 5-1
(Cui, 2005; Marin et al., 2005).
Figure 5-2 Plants reported rich in isoflavones. (For key, see table 5-1)

Chapter 5 Identification of Potential Isoflavone Glycoside Sources
155
Table 5-1 Isoflavone contents of selected plants (Cui, 2005; Marin et al., 2005)
Key (fig 5-2) Plants (with botanic name) Content of isoflavones
1 Alfalfa (Medicago sativa) 0.5-3.5%
2 Bean sprouts (Vigna radiata) 3.51mg/kg wet sample
3 Kudzu roots (Pueraria lobata) 0.95g/kg daidzein
4 Psoralea (Psoralea corylifolia) 2g/kg dry sample
5 Red clover (Trifolium pratense) 1.5-2.5%
6 Soy bean (Glycine max) 0.1-0.5%
Up to now, all of the materials reported to be rich in isoflavones are largely restricted
to the subfamily Faboideae, family Fabaceae, order Fabales, class Magnoliopsida,
division Magnoliophyta, kingdom Plantae (www.wikipedia.org/wiki/isoflavones,
accessed 02/2007).
Alfalfa and red clover are flowering plants of the pea family cultivated as important
forage crops and for increasing soil fertility due to their nitrogen fixing ability, and are
native to Europe and the Middle East. Their tender shoots are eaten by man in some
places as a leaf vegetable. Alfalfa and red clover have also been used as herbal
medicines for over 1500 years (www.wikipedia.org/wiki/alfalfa, accessed 04/2007).
Psoralea and Kudzu are also used as herbal medicines, especially important in the
Indian Ayurveda system of medicine and in Chinese medicine. Psoralea is a genus in
the legume family (Fabaceae). Common names include tumble-weed and white
tumble-weed. Most species are poisonous, but the starchy roots of P. esculenta and P.
hypogaea are edible (www.wikipedia.org/wiki/psoralea, accessed 04/2007). Kudzu,
Pueraria lobata, is one of about 20 species in the genus Pueraria in the pea family
Fabaceae, subfamily Faboideae. It is native to the southeast of Asia. Kudzu root is a
common food in the southeast of Asia, and its young leaves can be eaten not only by
man, but also by animals and used as a soil fertility promoter
(www.wikipedia.org/wiki/kudzu, accessed 04/2007).
Bean sprouts and soy beans are common foods in Asia. Normally there are two types
of bean sprouts but mung bean sprouts are much more popular than soy bean sprouts.
Chapter 5 Identification of Potential Isoflavone Glycoside Sources
156
Soy is the main protein source for many vegans and vegetarians. Tofu, a well-known
processed soy bean product, is known as “meat for monks”. There are thousands of
processed soy bean foods available in China either fermented or non-fermented.
All of the above plants have been reported to be rich in isoflavones, and consequently
have become research targets regarding human health especially the soy bean and red
clover due to their ready availability (Radd & Setchell, 2003).
5.1.2. Isoflavone Pattern
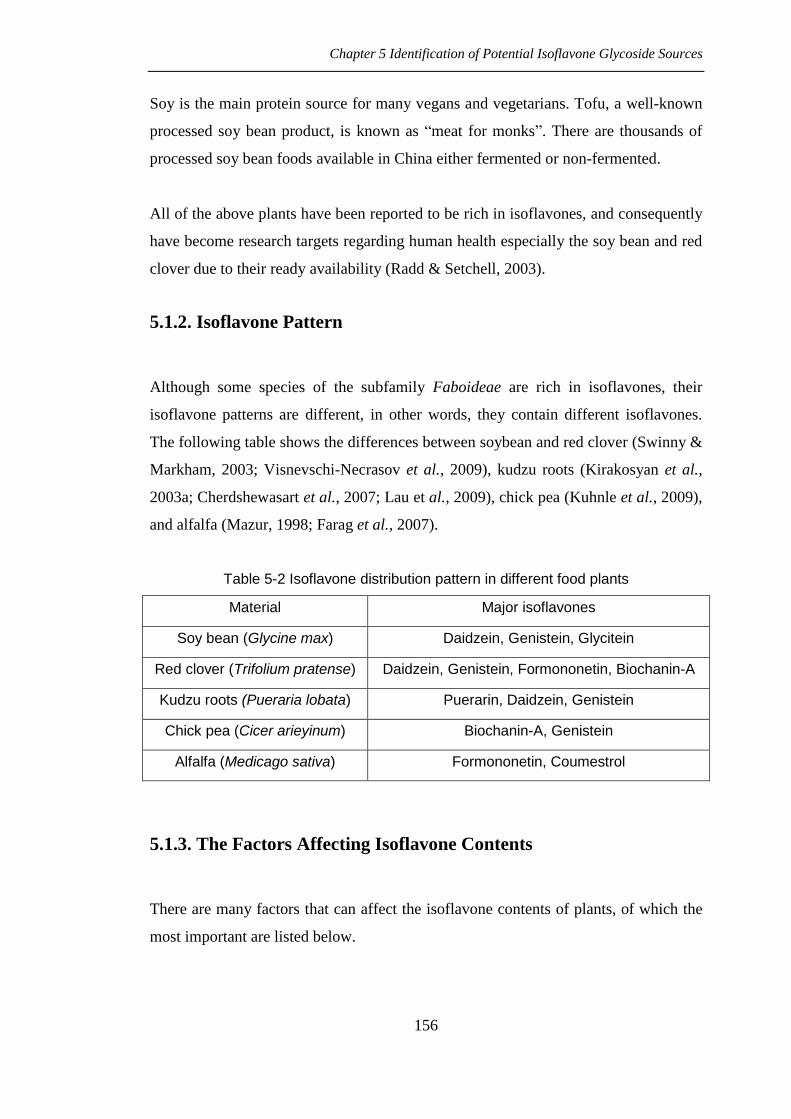
Although some species of the subfamily Faboideae are rich in isoflavones, their
isoflavone patterns are different, in other words, they contain different isoflavones.
The following table shows the differences between soybean and red clover (Swinny &
Markham, 2003; Visnevschi-Necrasov et al., 2009), kudzu roots (Kirakosyan et al.,
2003a; Cherdshewasart et al., 2007; Lau et al., 2009), chick pea (Kuhnle et al., 2009),
and alfalfa (Mazur, 1998; Farag et al., 2007).
Table 5-2 Isoflavone distribution pattern in different food plants
Material Major isoflavones
Soy bean (Glycine max) Daidzein, Genistein, Glycitein
Red clover (Trifolium pratense) Daidzein, Genistein, Formononetin, Biochanin-A
Kudzu roots (Pueraria lobata) Puerarin, Daidzein, Genistein
Chick pea (Cicer arieyinum) Biochanin-A, Genistein
Alfalfa (Medicago sativa) Formononetin, Coumestrol
5.1.3. The Factors Affecting Isoflavone Contents
There are many factors that can affect the isoflavone contents of plants, of which the
most important are listed below.

Chapter 5 Identification of Potential Isoflavone Glycoside Sources
157
5.1.3.1. Species and Cultivars
Undoubtedly, the genetic background is one of the most important factors affecting
isoflavone content (Pietta & Mauri, 2001; Fleuriet & Macheix, 2003). The variation
among species and cultivars leads to significant differences in both isoflavone
contents and composition. As mentioned previously, the isoflavone contents and
patterns differ in species although the distribution is mainly restricted to the legume
family. Several groups have reported large differences in the contents of isoflavones
in different species (for example, Sun & Ding, 1998; Cassidy et al., 2000;
Cherdshewasart et al., 2007). In different varieties of soy bean, the contents of
isoflavones could range from several hundreds of micrograms per gram to several
thousands of micrograms per gram (Wang & Murphy, 1994a; Reinli & Block, 1996;
Mazur, 1998).
5.1.3.2. Tissue Localization
The distribution of isoflavones is significantly different in different parts of the plants.
In soy bean, most isoflavones exist in the cotyledon and hypocotyl, with a trace in the
seed coat. 80-90% of the isoflavones are distributed in the cotyledon with a
concentration of 0.1-0.3%, while in the hypocotyl the concentration of isoflavones can
reach 1-2% (which makes up 10-20% of total isoflavone content although the
hypocotyl makes up only 2% of soy seeds) (Cui, 2005; Marin et al. 2005). In kudzu,
most isoflavones are found in the roots and seeds with traces in the leaf (Mazur &
Adlercreutz, 1998; Kirakosyan et al., 2003a).
5.1.3.3. Physiological Stage of Growth
Concentrations of flavonoids in a plant organ result from a balance between
biosynthesis and further metabolism, including turnover and catabolism. Considerable
variations are generally observed in the amount of flavonoids according to the
physiological stage when plant organs are picked to be consumed or processed by
humans. This may concern each type of organ (leaves, flowers, stalks, tubers, roots,
etc.), and the most spectacular cases are those of fruits, as considerable variations in
phenolic compounds occur during maturation (Fleuriet & Macheix, 2003). Flavonoids
Chapter 5 Identification of Potential Isoflavone Glycoside Sources
158
have also been sometimes implicated in the control of plant growth, maturation and
abscission.
Concentrations of soluble forms of flavonoid conjugates are generally highest in
young fruits, with a maximum during the early weeks after blossoming and a rapid
decrease during fruit development (Mayr et al., 1995). Some scientists suggested
dividing the life of a fruit into two main periods (Fleuriet & Macheix, 2003). In the
first period, flavonoid derivatives accumulate in the fruit with a positive balance
among in situ biosynthesis, migration and possible re-utilization, while in the second
period, this balance becomes negative and the overall flavonoid levels in the fruit falls.
Raw materials in different physiological stages have different isoflavone contents
(Dueñas et al., 2009). Sun and Ding (1998) reported that in soy beans, the isoflavone
contents decreased gradually during storage and increased gradually with soybean
seed development. The content of isoflavones increased after blossoming for 1-2
months, and more than 76% of isoflavones can be accumulated in the last week of
seed development, due to the accumulation of seeds and the loss of water content
during seed maturation as well.
5.1.3.4. Environmental Factors
Secondary metabolism, and in particular phenolic metabolism, largely depends on
external factors such as light, temperature, and various stresses (Fleuriet & Macheix,
2003; Lee et al., 2007; Cherdshewasart et al., 2007), which leads to the correlation
between flavonoid contents and environmental factors.
Sun and Ding (1998) reported that there existed a positive correlation between
isoflavone content in soy bean with latitude, but a negative correlation with longitude
and also a positive correlation with elevation above sea level. Moreover, there was a
negative correlation of isoflavone content with temperature and precipitation; a
positive correlation with duration of sunshine. Light strongly stimulates the
accumulation of isoflavones in soybean seedlings, especially in soybean leaves.
However, the isoflavone contents tended to decline with higher soil moisture and
higher fertility. Caldwell et al. (2005) also reported that increasing the temperature
Chapter 5 Identification of Potential Isoflavone Glycoside Sources
159
from 18°C during seed development to 23°C decreased total isoflavone content by
about 65% while a further 5°C increase to 28°C decreased the total isoflavone content
by about 90%. They found that elevated CO2 at elevated temperatures could partially
reverse the effects of temperature on soybean seed isoflavone content.
The individual isoflavones often had different responses to the various growth
conditions during seed maturation, modifying the proportions of the principal
isoflavones. Therefore, subtle changes in certain environmental factors may change
the isoflavone content of commercially grown soybean, altering the nutritional values
of soy products (Caldwell et al., 2005).
5.1.3.5. Food Processing
Food processing is an important factor which can affect not only the contents of total
isoflavones in a food, but also the pattern of isoflavones before the food is consumed
by humans (Sun & Ding, 1998). Food processing can cause significant amounts of
isoflavone loss, processes which include:
Soaking
Soaking in water or basic solution is the first stage for production of some soy
products like tofu, which may cause loss of up to 12% total isoflavones (Cui,
2005). Isoflavones were largely removed during water processing and also the
pattern changed. After soaking, the contents of the acetyl form and the aglycone
form increased accompanying the decreasing of the malonyl form of isoflavones
because of the activity of endogenous enzyme β-glucosidase (Wardhani et al.,
2008).
Heating
Flavonoids have been reported to show a significant reduction during the thermal
treatment, e.g. flavonols in onions (Price et al., 1997) and broccoli (Price et al.,
1998a). In contrast, isoflavones are relatively stable molecules. Heating itself
cannot change the contents of isoflavones but may change the pattern (Barnes et
al., 1994). As with soaking, heating can cause an increase of the acetyl form and
the aglycone form resulting from the decrease of the malonyl form since thermal
Chapter 5 Identification of Potential Isoflavone Glycoside Sources
160
treatment can stimulate the endogenous enzyme. Moreover, heating in water can
significantly improve the isoflavone transferring into water leading to the loss of
isoflavones (Sun & Ding, 1998).
Solidifying/Gelatinizing
Solidifying can exclude isoflavones, so that they remain in the liquid phase, which
may cause up to 44% isoflavone loss (Cui, 2005).
Fermenting
Fermenting may not change the total content of isoflavones in soy food but may
change the pattern. As mentioned in chapter 1, most flavonoids exist as the
glucoside forms naturally. However, large amounts of the aglycone form can be
found in fermented food and in some products nearly 100% of isoflavone exists as
the aglycone form due to the hydrolases from microbial sources (Wang & Murphy,
1994b; McDonald et al., 1998; Chun et al., 2008; Haron et al., 2009).
5.1.4. Determining Isoflavone Contents
Regarding flavonoid analysis, the majority of published work now refers to qualitative
and quantitative applications of high performance liquid chromatography (HPLC).
Flavonoids can be separated, quantified, and identified in one operation by coupling
HPLC to ultraviolet (UV), mass, or nuclear magnetic resonance (NMR) detectors.
Recently, the technique of capillary electrophoresis (CE) has been gaining attention
(Marston & Hostettmann, 2006).
One feature used for flavonoid detection is the presence of the phenyl ring. This
chromophore is UV active and enables flavonoids to be easily detected. Their UV
spectra are particularly informative, meaning that minor differences in structure are
often seen as significant differences in their UV spectra, providing considerable
structural information that can rapidly distinguish the type of phenol and the oxidation
pattern. Modern instrumental techniques enable us to gain much information
regarding the mass and UV-VIS spectra of individual components in a complex
mixture. For the purposes of analysis, the flavonoids can be basically classified into
Chapter 5 Identification of Potential Isoflavone Glycoside Sources
161
three types: flavonoid glycosides, non-polar flavonoids (aglycones, methylated, or
alkylated flavonoids), and anthocyanins. Each type requires a different analytical
technique (Bloor, 2001).
Preparative separation of flavonoids is still a challenge. There is no general, simple,
straightforward strategy for the isolation of natural products, even if certain
compounds are readily accessible by modern chromatographic techniques. Each
particular separation problem has to be considered on its own and a suitable procedure
has to be developed. A number of techniques have been used for the preparative
separation of flavonoids. The choice of methods and strategies varies from research
group to research group and depends often on the class of flavonoid studied (Swinny
& Markham, 2003).
However, analytical separations of flavonoids are now routine. In quantitative
measurements, the amounts of the individual components within a particular class of
constituent need to be determined. Nowadays, this can easily be achieved through the
use of GC, HPLC, and hyphenated techniques (Marston & Hostettmann, 2006).
5.1.4.1. Sample Preparation
Principally, the analysis of flavonoids should include extraction, separation (isolation),
purification and determination, etc. However, due to the application of HPLC which
can be used for either separation or determination, there may be no clear border
between those steps. The analysis may simply be divided into sample preparation and
sample determination. Sample preparation can include extraction, initial separation or
purification until ready for HPLC injection.
Because flavonoids (particularly glycosides) can be degraded by enzyme action when
collected plant material is fresh or non-dried, it is thus advisable to use dry,
lyophilized, or frozen samples. When dry plant material is used, it is generally ground
into a powder. For extraction, the solvent is chosen as a function of the type of
flavonoid required. Polarity is an important consideration here. Less polar flavonoids
(e.g., isoflavones, flavanones, methylated flavones, and flavonols) are extracted with
chloroform, dichloromethane, diethyl ether, or ethyl acetate, while flavonoid
Chapter 5 Identification of Potential Isoflavone Glycoside Sources
162
glycosides and more polar aglycones are extracted with alcohols or alcohol-water
mixtures. Glycosides have increased water solubility and aqueous alcoholic solutions
are suitable. The bulk of extractions of flavonoid-containing material are still
performed by simple direct solvent extraction (Marston & Hostettmann, 2006).
Powdered plant material can also be extracted in a Soxhlet apparatus, first with
hexane, for example, to remove lipids and then with ethyl acetate or ethanol to obtain
phenolics. This approach is not suitable for heat-sensitive compounds.
A convenient and frequently used procedure is sequential solvent extraction. A first
step, with dichloromethane, for example, will extract flavonoid aglycones and less
polar material. A subsequent step with an alcohol will extract flavonoid glycosides
and polar constituents.
Extraction is typically performed with magnetic stirring or shaking but other methods
have recently been introduced to increase the efficiency and speed of the extraction
procedure, such as pressurized liquid extraction (PLE), supercritical fluid extraction
(SFE), ultrasound-assisted extraction, and microwave-assisted extraction (MAE)
(Marston & Hostettmann, 2006).
5.1.4.2. HPLC Determination
The method of choice for the qualitative and quantitative analysis of flavonoids is
HPLC. Since its introduction in the 1970s, HPLC has been used for all classes of
flavonoids and hundreds of applications have been published. The most frequently
used detection method for HPLC is UV spectrophotometry. Routine detection in
HPLC is typically based on measurement of UV absorption, or visible absorption in
the case of anthocyanins (Marston & Hostettmann, 2006). No single wavelength is
ideal for all classes of flavonoids since they display absorbance maxima at distinctly
different wavelengths. The most commonly used wavelength for routine detection has
been 280 nm, which represents a suitable compromise.
With the introduction of diode-array technology in the 1980s, a further dimension is
now possible because coupled LC-UV with diode array detection (DAD) allows the
Chapter 5 Identification of Potential Isoflavone Glycoside Sources
163
chromatographic elute to be scanned for UV-visible spectral data, which are stored
and can later be compared with a library for peak identification. This increases the
power of HPLC analysis because with the information from the UV spectrum, it may
be possible to identify the compound subclass or perhaps even the compound itself.
UV spectral data of 175 flavonoids in several solvents can be found, for example, in a
book by Mabry et al. (1970). LC-UV with DAD enables simultaneous recording of
chromatograms at different wavelengths. This improves the possibilities of
quantification because detection can be performed at the wavelength maximum of the
compound in question. These are typically to be found at 270 and 330 to 365nm for
flavones and flavonols, at 290nm for flavanones, at 236 or 260nm for isoflavones, at
340 to 360nm for chalcones, at 280nm for dihydrochalcones, at 502 or 520nm for
anthocyanins, and at 210 or 280nm for catechins (Merken & Beecher, 2000).
Peak purity can also be determined. The spectra of eluting peaks obtained at the apex
and both inflexion points of the peak can be compared in order to obtain a measure of
the purity of the particular component of the sample.
5.2. Aims of Chapter
The aim of this chapter was to obtain and analyse some natural materials which are
reported to contain isoflavones, especially daidzin and genistin, and to investigate to
what extent these materials contain isoflavones, particularly related to highest levels.
Chapter 5 Identification of Potential Isoflavone Glycoside Sources
164
5.3. Materials and Methods
5.3.1. Sources of Plant Materials
The plant materials were obtained as described in chapter 2.
5.3.2. Acid and Base
1M hydrochloric acid: 8.28ml of hydrochloric acid (min 37%) was diluted by
water and made up to a final volume of 100ml
6M sodium hydroxide: 4.8g of sodium hydroxide was dissolved in water and
made up to a final volume of 20ml
5.3.3. Sample Preparation
Dried samples were ground, put in air-tight glass bottles, sealed, labelled and stored at
-20°C until taken for further analysis. Fresh samples needed to be freeze-dried as soon
as possible after purchase. Fresh samples were separated, weighed, and homogenised
with 200ml water by blending for 3mins. After measuring the volume, 50ml of the
homogenate was transferred to a 250ml round bottom flask, frozen by a mixture of
dry ice and acetone, then transferred to a Birchover Instruments Freeze Dryer for 5-
18hr for freeze-drying. When using the Scanvac Coolsafe Freeze Dryer, 50ml
homogenate was frozen in a -80ºC extra low freezer before freeze-drying.
After being freeze-dried, the sample was carefully removed and powdered with a
pestle and mortar, weighed, put into air-tight glass bottles, sealed, labelled, and stored
at -20°C until analysis.
Chapter 5 Identification of Potential Isoflavone Glycoside Sources
165
5.3.4. Isoflavone Extraction
Powdered sample (1g or 0.5g) was weighed and put in a 50ml test tube. 20ml of 80%
methanol was added. The test tube was vortexed for 1min and then incubated in a
shaking water bath at 37°C for 2.0hr. The solution was then filtered through Whatman
No. 40 filter paper. 80% methanol was used to wash the filter paper and make the
final filtrate to 25ml. An aliquot of this solution was then filtered through a 0.2µm
PTFE filter and analysed by HPLC. The resultant chromatograms were examined for
evidence of flavonoid glucosides or aglycones.
For the low content materials, 10-20g of raw sample was weighed prior to extraction,
and the final extracted solution might be concentrated by evaporation before HPLC
injection, dependent on the concentration of isoflavones.
5.3.5. Enzymatic Hydrolysis
In order to identify HPLC peaks, especially if there were some unknown components
and in the absence of purified standard, all samples were hydrolysed by enzyme after
extraction. Aliquots (1.0ml or 0.5ml) of the extract solution from 5.3.4 were removed
into 2ml micro-centrifuge tubes, evaporated with a rotary evaporator or with the
Genevac to dryness. Then 600µl buffer (0.1M, pH 5.5) and 150µl apple seed extracts
(described as 3.3.4.) were added and the tubes were incubated at 65°C for 2hr. After
incubation, 750µl of methanol was added to stop the reaction. The reacted solution
was then removed and filtered through a 0.2µm PTFE filter and analysed by HPLC.
The retention time and spectral characteristics were examined for evidence of
flavonoid aglycones.
5.3.6. Acidic Hydrolysis
For some components which could not be hydrolysed by β-glucosidase, acidic
hydrolysis was carried out by adding 300µl 1M hydrochloric acid (HCl) into a micro-
centrifuge tube containing dried residue from 0.5ml extract solution. After incubating

Chapter 5 Identification of Potential Isoflavone Glycoside Sources
166
for 2hr in a boiling water bath, the solution was neutralized by 50µl 6M sodium
hydroxide (NaOH), then 400µl buffer (pH5.5, 0.1M) was added to buffer the pH
between 5 and 6, and then 750µl methanol was added to make the final volume 1.5ml.
This solution can be injected onto the HPLC after filtration. This method was
modified from the method described by Garrett et al. (1999).
5.3.7. Recovery
In order to test the efficiency of extraction, experiments were carried out by adding
specific amounts of daidzin and genistin to the raw material immediately before
extraction and calculating the percentage recovery. For extracting soy flour, purified
standard daidzin and genistin were used. For extracting other materials, previously
determined soy flour extracts were used (10g of soy flour was weighed accurately,
and evaporated to 25ml after being extracted by 80% methanol. This solution was
analysed for concentrations of daidzin and genistin in triplicate by HPLC).
5.4. Results and Discussion
The chromatograms of the tested materials are shown below followed by peak
identification, isoflavone contents, and recovery (if applied). Peaks were identified on
the following criteria: (і) comparison to behaviour of standards; (іі) characteristics of
peak spectra; (ііі) behaviour after enzymatic or acid hydrolysis; (іv) comparison to
literature reports. Some compounds, for example, acetyl- and malonyl- form of soy
isoflavones, were not available in standard form because these components are still
not widely commercially available may be due to they are relatively unstable (Farag et
al., 2007; Rostagno et al., 2009). As a result, enzymatic or acidic treatments in sample
preparation for isoflavone determination have been widely used and the results have
been broadly accepted, for example, Mazur & Adlercreutz (1998), Liggins et al.
(2000), Kuhnle et al. (2009).
Chapter 5 Identification of Potential Isoflavone Glycoside Sources
167
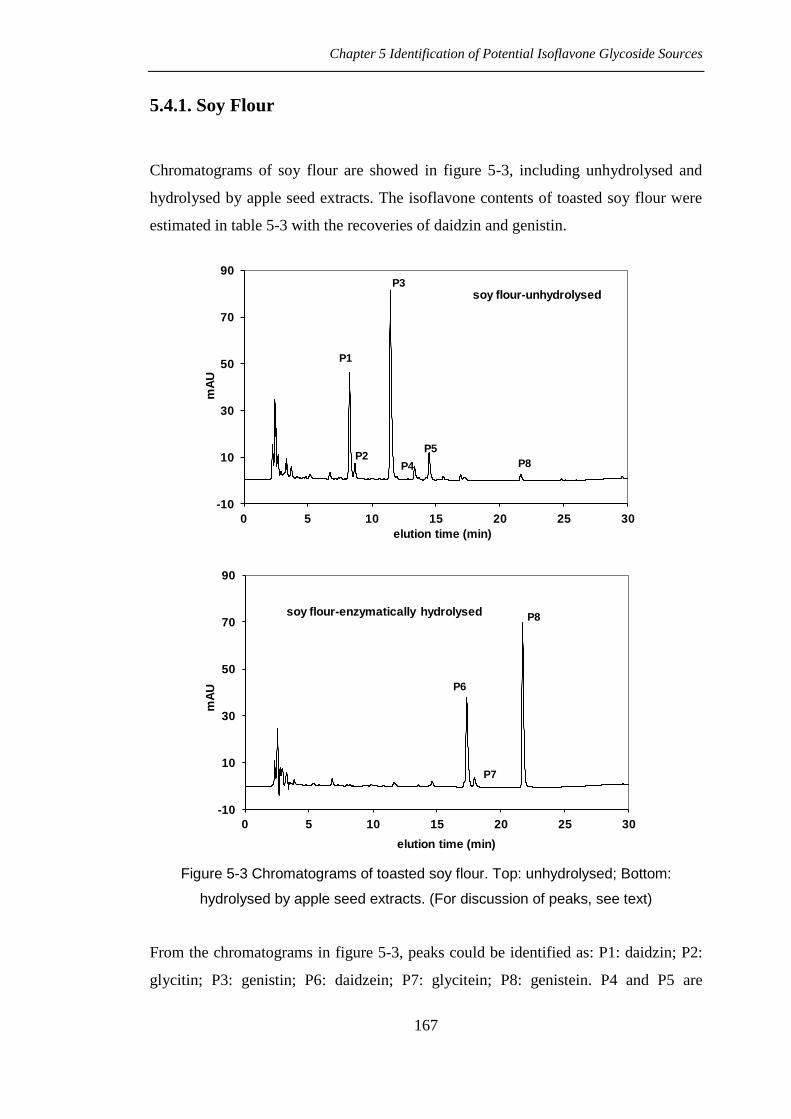
5.4.1. Soy Flour
Chromatograms of soy flour are showed in figure 5-3, including unhydrolysed and
hydrolysed by apple seed extracts. The isoflavone contents of toasted soy flour were
estimated in table 5-3 with the recoveries of daidzin and genistin.
-10
10
30
50
70
90
0 5 10 15 20 25 30
mA
U
elution time (min)
soy flour-unhydrolysed
P1
P2
P3
P4
P5
P8
-10
10
30
50
70
90
0 5 10 15 20 25 30
mA
U
elution time (min)
soy flour-enzymatically hydrolysed
P6
P7
P8
Figure 5-3 Chromatograms of toasted soy flour. Top: unhydrolysed; Bottom:
hydrolysed by apple seed extracts. (For discussion of peaks, see text)
From the chromatograms in figure 5-3, peaks could be identified as: P1: daidzin; P2:
glycitin; P3: genistin; P6: daidzein; P7: glycitein; P8: genistein. P4 and P5 are
Chapter 5 Identification of Potential Isoflavone Glycoside Sources
168
probably acetyl- or malonyl- forms of daidzin or genistin; their spectra were very
similar to daidzin and genistin, but could not be further identified due to lack of
purified components.
In soy flour, isoflavones exist as glucoside forms which are mainly daidzin and
genistin, and small amounts of glycitin, small amounts of acetyl or malonyl forms,
and small amounts of aglycone forms. After hydrolysis, the peaks representing
glucoside forms, which were P1, P2 and P3, disappeared or decreased sharply; the
peaks representing acetyl or malonyl forms also decreased (P5) or disappeared (P4);
while the peaks representing aglycone forms, which were P6 and P8, increased
sharply; and P7, a new peak, appeared, which is probably glycitein, the aglycone form
of glycitin.
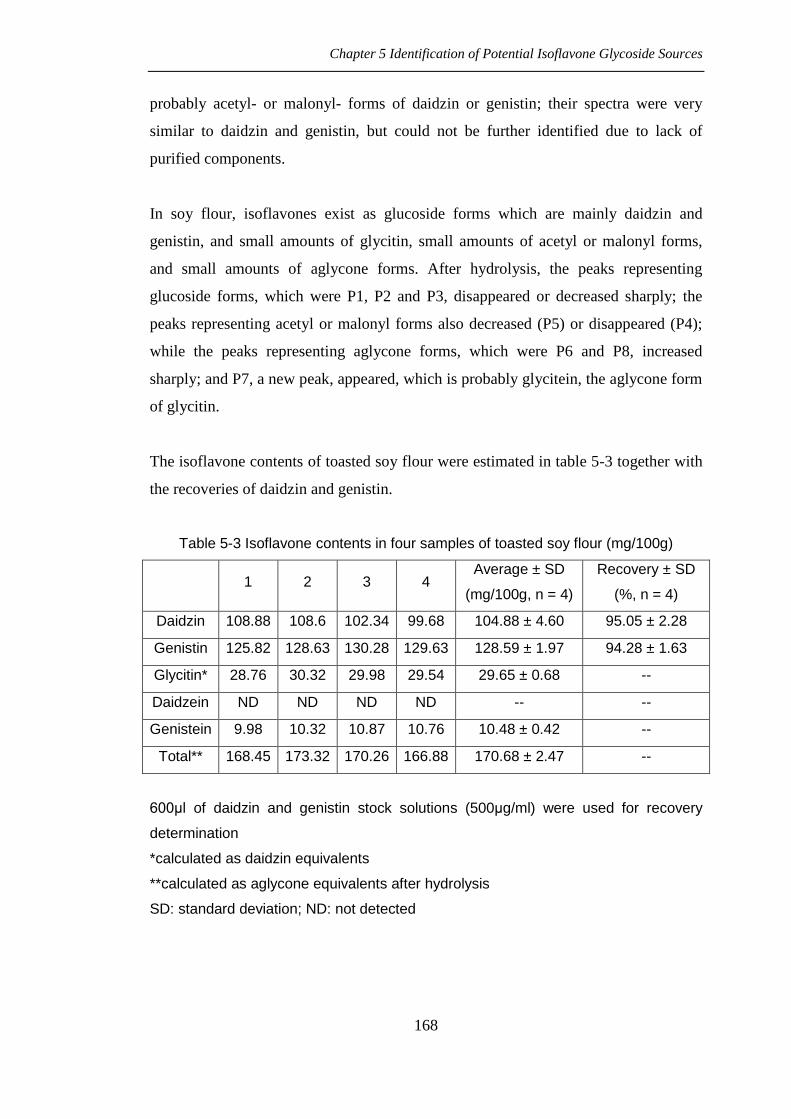
The isoflavone contents of toasted soy flour were estimated in table 5-3 together with
the recoveries of daidzin and genistin.
Table 5-3 Isoflavone contents in four samples of toasted soy flour (mg/100g)
1 2 3 4 Average ± SD
(mg/100g, n = 4)
Recovery ± SD
(%, n = 4)
Daidzin 108.88 108.6 102.34 99.68 104.88 ± 4.60 95.05 ± 2.28
Genistin 125.82 128.63 130.28 129.63 128.59 ± 1.97 94.28 ± 1.63
Glycitin* 28.76 30.32 29.98 29.54 29.65 ± 0.68 --
Daidzein ND ND ND ND -- --
Genistein 9.98 10.32 10.87 10.76 10.48 ± 0.42 --
Total** 168.45 173.32 170.26 166.88 170.68 ± 2.47 --
600μl of daidzin and genistin stock solutions (500μg/ml) were used for recovery
determination
*calculated as daidzin equivalents
**calculated as aglycone equivalents after hydrolysis
SD: standard deviation; ND: not detected
Chapter 5 Identification of Potential Isoflavone Glycoside Sources
169
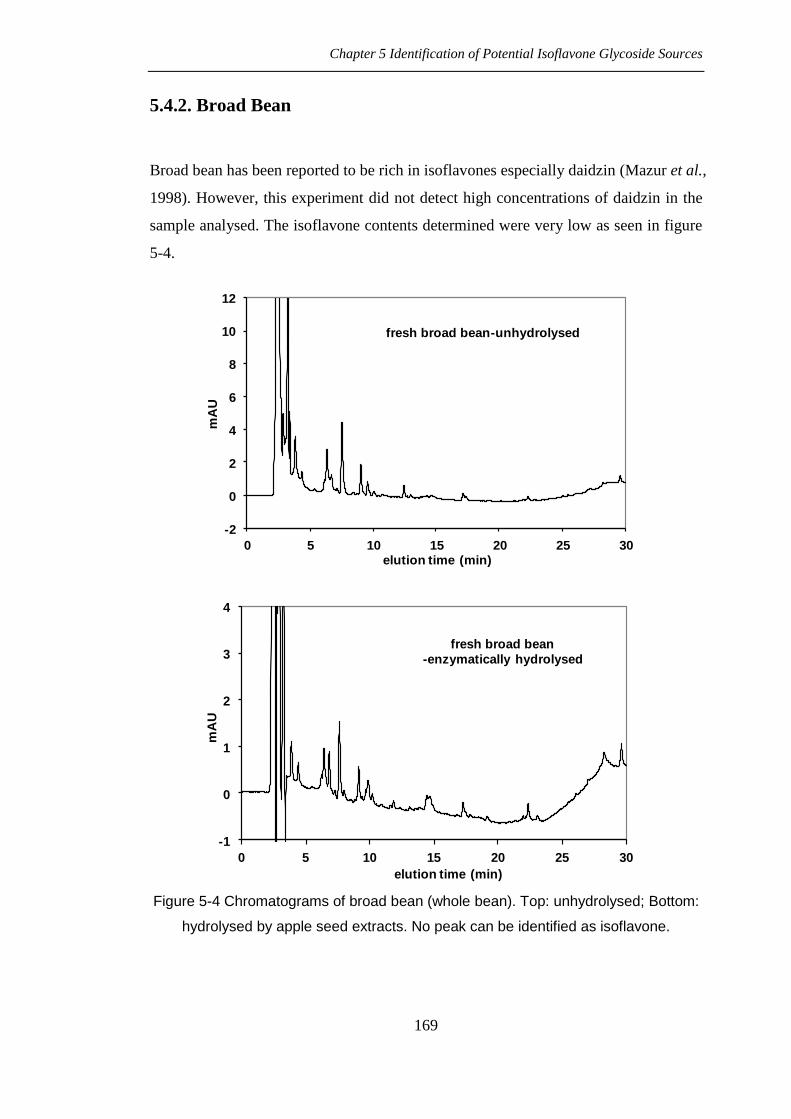
5.4.2. Broad Bean
Broad bean has been reported to be rich in isoflavones especially daidzin (Mazur et al.,
1998). However, this experiment did not detect high concentrations of daidzin in the
sample analysed. The isoflavone contents determined were very low as seen in figure
5-4.
-2
0
2
4
6
8
10
12
0 5 10 15 20 25 30
mA
U
elution time (min)
fresh broad bean-unhydrolysed
-1
0
1
2
3
4
0 5 10 15 20 25 30
mA
U
elution time (min)
fresh broad bean
-enzymatically hydrolysed
Figure 5-4 Chromatograms of broad bean (whole bean). Top: unhydrolysed; Bottom:
hydrolysed by apple seed extracts. No peak can be identified as isoflavone.
Chapter 5 Identification of Potential Isoflavone Glycoside Sources
170
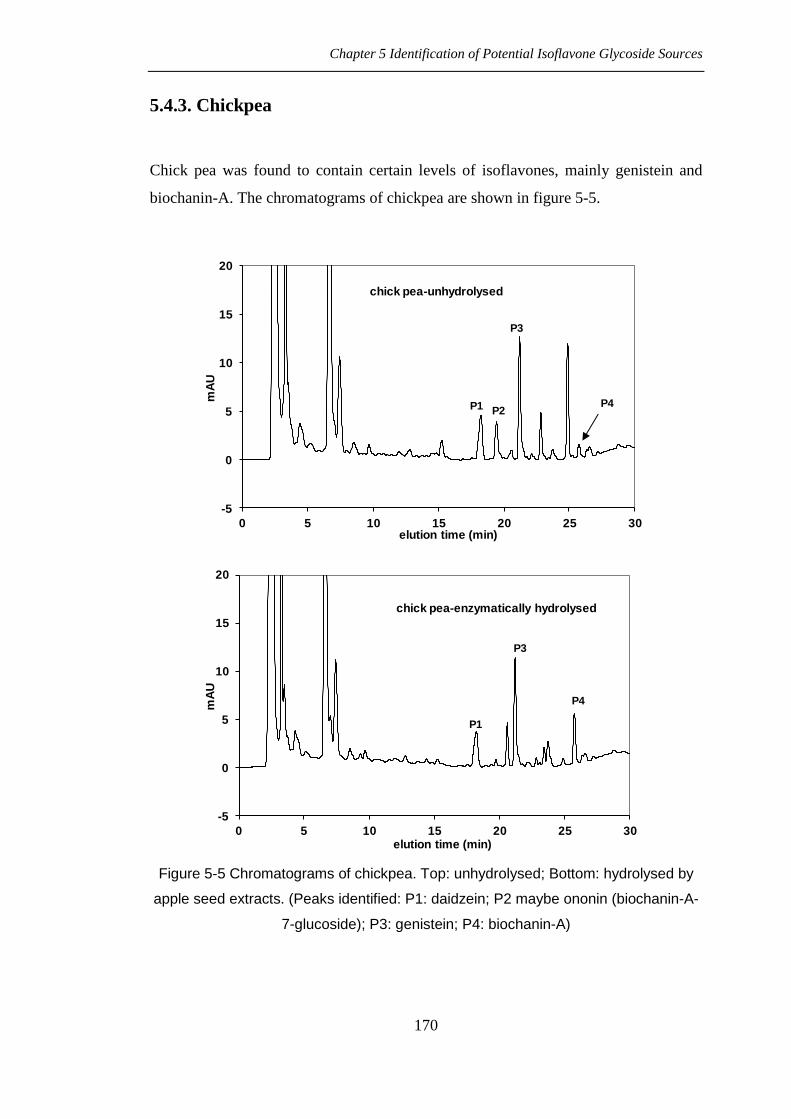
5.4.3. Chickpea
Chick pea was found to contain certain levels of isoflavones, mainly genistein and
biochanin-A. The chromatograms of chickpea are shown in figure 5-5.
-5
0
5
10
15
20
0 5 10 15 20 25 30
mA
U
elution time (min)
chick pea-unhydrolysed
P1 P2
P3
P4
-5
0
5
10
15
20
0 5 10 15 20 25 30
mA
U
elution time (min)
chick pea-enzymatically hydrolysed
P1
P3
P4
Figure 5-5 Chromatograms of chickpea. Top: unhydrolysed; Bottom: hydrolysed by
apple seed extracts. (Peaks identified: P1: daidzein; P2 maybe ononin (biochanin-A-
7-glucoside); P3: genistein; P4: biochanin-A)

Chapter 5 Identification of Potential Isoflavone Glycoside Sources
171
5.4.4. Clover
Chromatograms of clover extracts are shown in figure 5-6, both of them were
chromatograms of an hydrolysed sample but the different scales of the y axis
emphasizing the presence of peaks other than formononetin and biochanin-A.
-100
100
300
500
700
0 5 10 15 20 25 30
mA
U
elution time (min)
Clover diluted-unhydrolysed
P7
P8
-5
5
15
25
35
0 5 10 15 20 25 30
mA
U
elution time (min)
Clover diluted-unhydrolysed
P1
P2
P3
P4
P5
P6
P7 P8
Figure 5-6 Chromatograms of clover. Top: original extract; Bottom: original extract
but changing Y axis scale in order to show other peaks. Both chromatograms were of
an unhydrolysed sample. (Peaks identified: P1: rutin; P2: quercetin-3-glucoside; P3:
maybe sissotrin (formononetin-7-glucoside); P4: daidzein; P5: maybe ononin
(biochanin-A-7-glucoside); P6: genistein; P7: formononetin; P8: biochanin-A)
Chapter 5 Identification of Potential Isoflavone Glycoside Sources
172
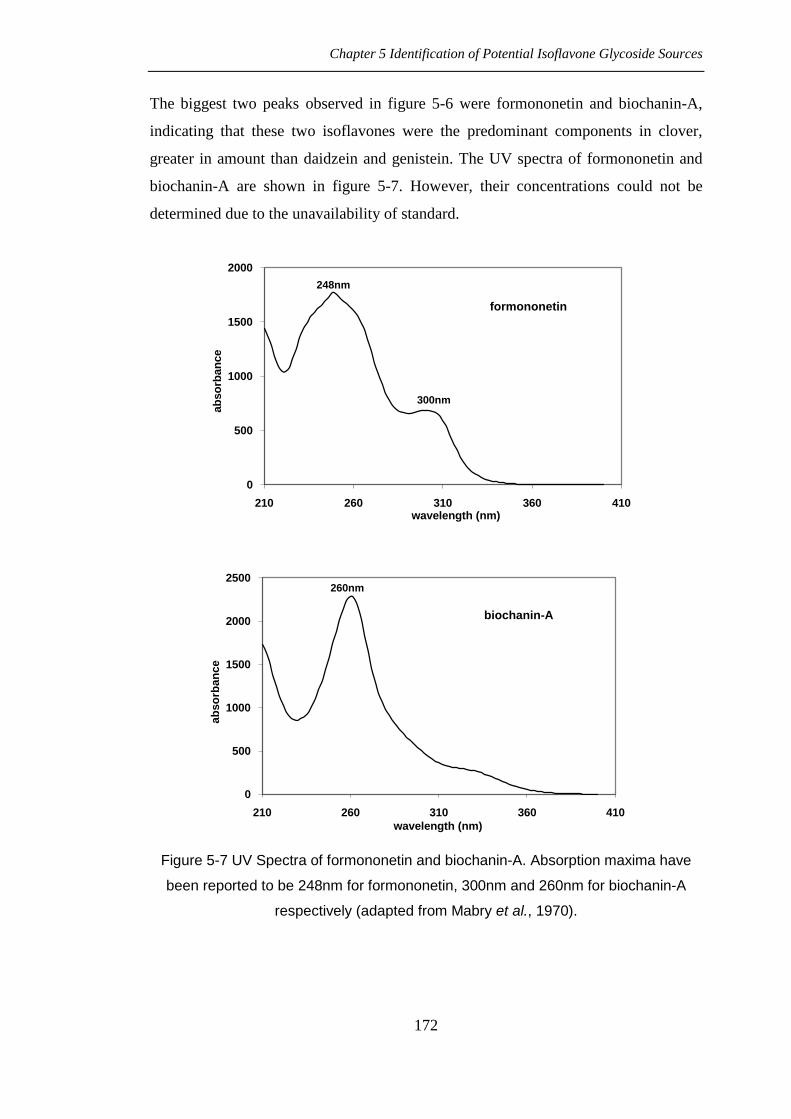
The biggest two peaks observed in figure 5-6 were formononetin and biochanin-A,
indicating that these two isoflavones were the predominant components in clover,
greater in amount than daidzein and genistein. The UV spectra of formononetin and
biochanin-A are shown in figure 5-7. However, their concentrations could not be
determined due to the unavailability of standard.
0
500
1000
1500
2000
210 260 310 360 410
ab
so
rban
ce
wavelength (nm)
formononetin
248nm
300nm
0
500
1000
1500
2000
2500
210 260 310 360 410
ab
so
rban
ce
wavelength (nm)
biochanin-A
260nm
Figure 5-7 UV Spectra of formononetin and biochanin-A. Absorption maxima have
been reported to be 248nm for formononetin, 300nm and 260nm for biochanin-A
respectively (adapted from Mabry et al., 1970).
Chapter 5 Identification of Potential Isoflavone Glycoside Sources
173
5.4.5. Kudzu
-20
0
20
40
60
80
100
0 5 10 15 20 25 30
mA
U
elution time (min)
Kudzu roots-unhydrolysedP1
P2
P3P4
P5
-10
0
10
20
30
40
0 5 10 15 20 25 30
mA
U
elution time (min)
Kudzu roots-enzymatically hydrolysedP1
P4
P5
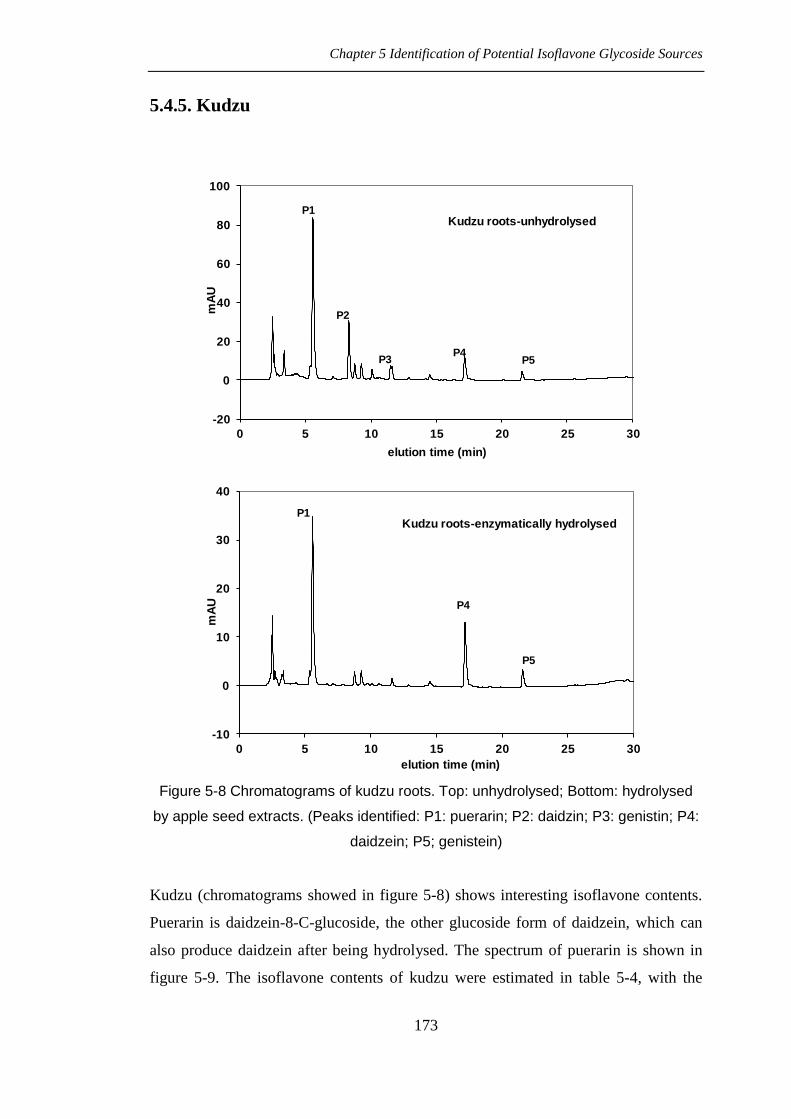
Figure 5-8 Chromatograms of kudzu roots. Top: unhydrolysed; Bottom: hydrolysed
by apple seed extracts. (Peaks identified: P1: puerarin; P2: daidzin; P3: genistin; P4:
daidzein; P5; genistein)
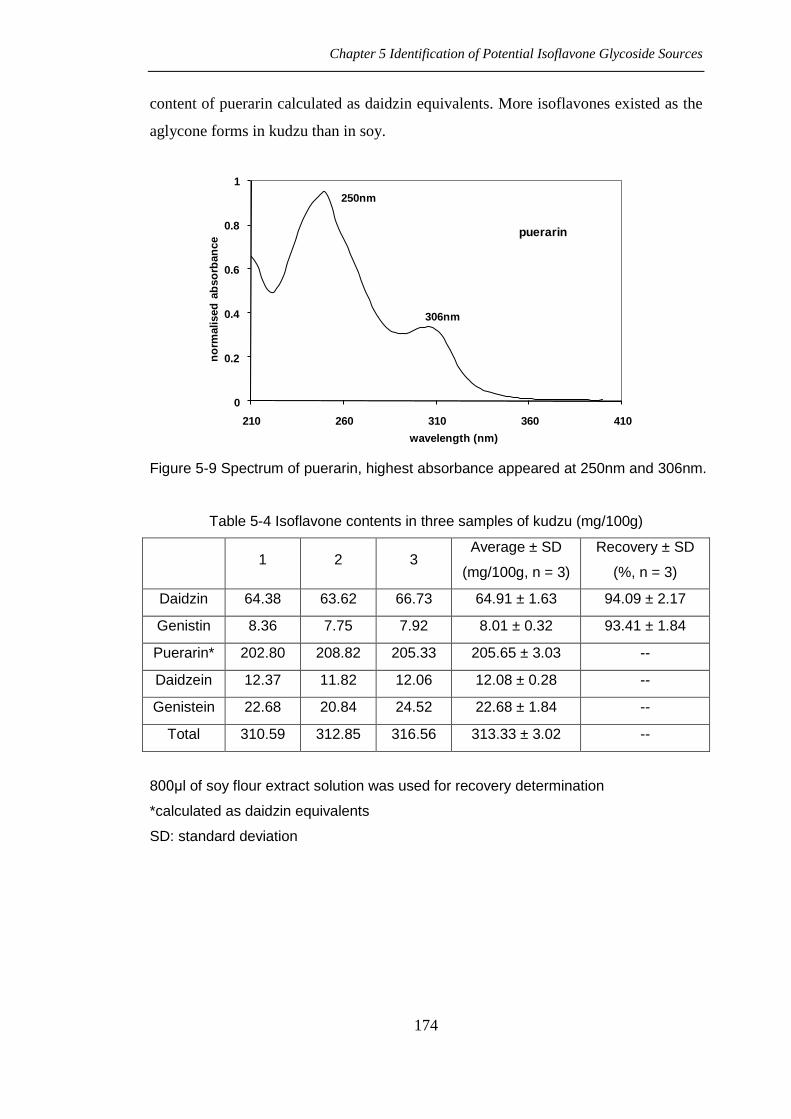
Kudzu (chromatograms showed in figure 5-8) shows interesting isoflavone contents.
Puerarin is daidzein-8-C-glucoside, the other glucoside form of daidzein, which can
also produce daidzein after being hydrolysed. The spectrum of puerarin is shown in
figure 5-9. The isoflavone contents of kudzu were estimated in table 5-4, with the
Chapter 5 Identification of Potential Isoflavone Glycoside Sources
174
content of puerarin calculated as daidzin equivalents. More isoflavones existed as the
aglycone forms in kudzu than in soy.
0
0.2
0.4
0.6
0.8
1
210 260 310 360 410
no
rmalised
ab
so
rban
ce
wavelength (nm)
puerarin
250nm
306nm
Figure 5-9 Spectrum of puerarin, highest absorbance appeared at 250nm and 306nm.
Table 5-4 Isoflavone contents in three samples of kudzu (mg/100g)
1 2 3 Average ± SD
(mg/100g, n = 3)
Recovery ± SD
(%, n = 3)
Daidzin 64.38 63.62 66.73 64.91 ± 1.63 94.09 ± 2.17
Genistin 8.36 7.75 7.92 8.01 ± 0.32 93.41 ± 1.84
Puerarin* 202.80 208.82 205.33 205.65 ± 3.03 --
Daidzein 12.37 11.82 12.06 12.08 ± 0.28 --
Genistein 22.68 20.84 24.52 22.68 ± 1.84 --
Total 310.59 312.85 316.56 313.33 ± 3.02 --
800μl of soy flour extract solution was used for recovery determination
*calculated as daidzin equivalents
SD: standard deviation

Chapter 5 Identification of Potential Isoflavone Glycoside Sources
175
5.4.6. Mung Bean
-50
0
50
100
150
200
0 5 10 15 20 25 30
mA
U
elution time (min)
mung bean-unhydrolysed
P1
P2
-10
10
30
50
70
0 5 10 15 20 25 30
mA
U
elution time (min)
mung bean-enzymatically hydrolysed
P1
P2
Figure 5-10 Chromatograms of dried mung bean extracts. Top: unhydrolysed; Bottom:
hydrolysed by apple seed extracts. No peak can be identified as isoflavone. For
discussion of P1 and P2, see text.
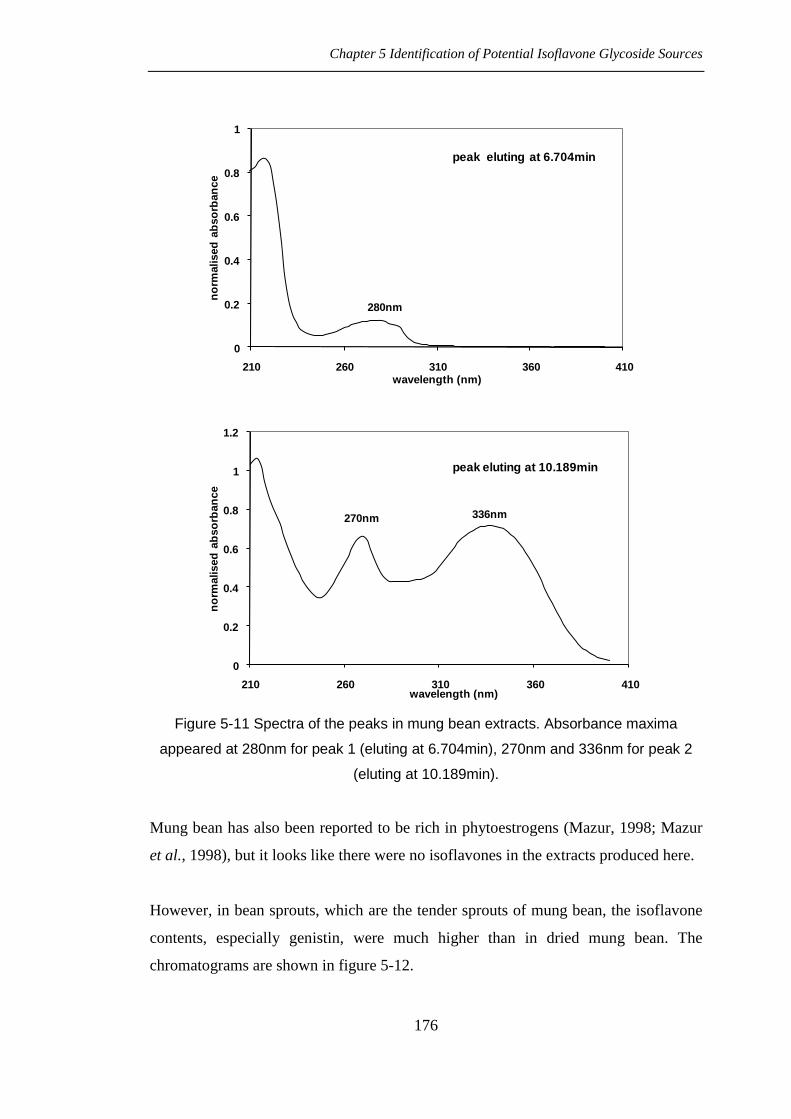
No peak could be identified as isoflavone in this mung bean extracts (chromatograms
shown in figure 5-10), but the UV spectra of peaks, shown in figure 5-11, were
characteristic of a flavonoid and P2 might be some form of apigenin. (see figure 2-6)
based on similarity of the spectra.
Chapter 5 Identification of Potential Isoflavone Glycoside Sources
176
0
0.2
0.4
0.6
0.8
1
210 260 310 360 410
no
rmalised
ab
so
rban
ce
wavelength (nm)
peak eluting at 6.704min
280nm
0
0.2
0.4
0.6
0.8
1
1.2
210 260 310 360 410
no
rmalised
ab
so
rban
ce
wavelength (nm)
peak eluting at 10.189min
270nm 336nm
Figure 5-11 Spectra of the peaks in mung bean extracts. Absorbance maxima
appeared at 280nm for peak 1 (eluting at 6.704min), 270nm and 336nm for peak 2
(eluting at 10.189min).
Mung bean has also been reported to be rich in phytoestrogens (Mazur, 1998; Mazur
et al., 1998), but it looks like there were no isoflavones in the extracts produced here.
However, in bean sprouts, which are the tender sprouts of mung bean, the isoflavone
contents, especially genistin, were much higher than in dried mung bean. The
chromatograms are shown in figure 5-12.

Chapter 5 Identification of Potential Isoflavone Glycoside Sources
177
-5
0
5
10
15
20
25
0 5 10 15 20 25 30
mA
U
elution time (min)
bean sprouts-unhydrolysed
P1
P2
P3
Figure 5-12 Chromatogram of mung bean sprout extracts. (Peaks identified: P1:
daidzin; P2: genistin; P3: genistein)
Chapter 5 Identification of Potential Isoflavone Glycoside Sources
178
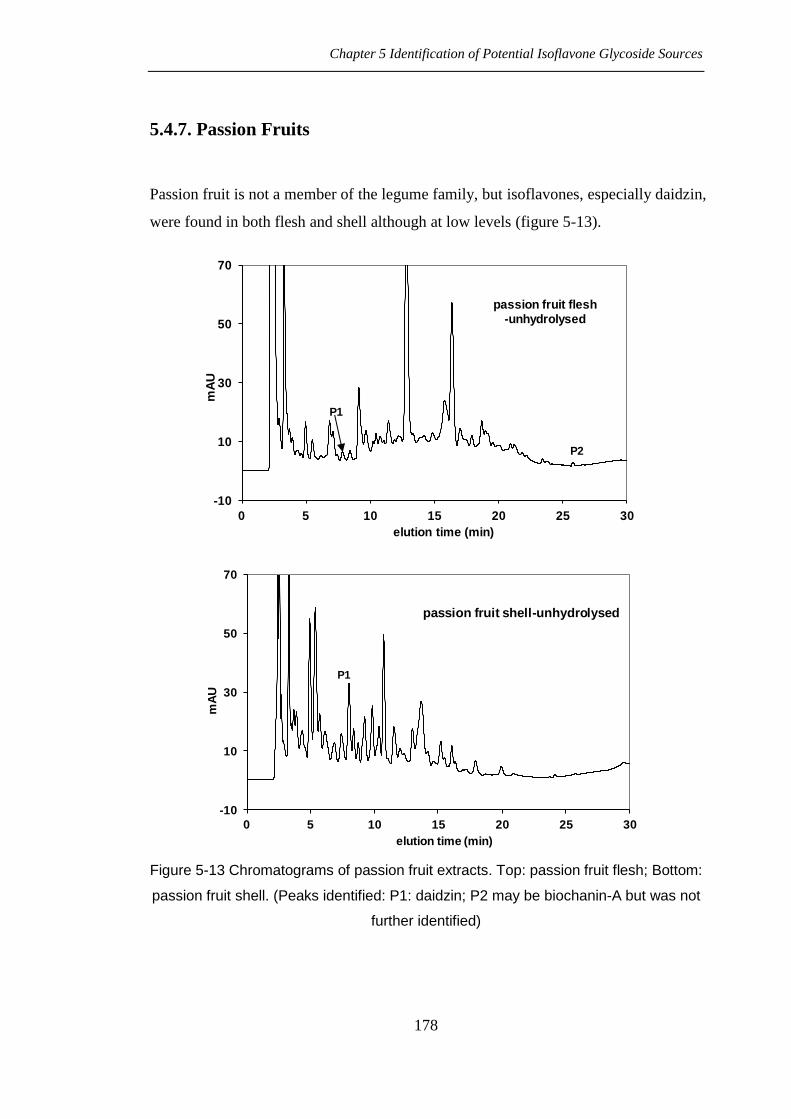
5.4.7. Passion Fruits
Passion fruit is not a member of the legume family, but isoflavones, especially daidzin,
were found in both flesh and shell although at low levels (figure 5-13).
-10
10
30
50
70
0 5 10 15 20 25 30
mA
U
elution time (min)
passion fruit flesh-unhydrolysed
P1
P2
-10
10
30
50
70
0 5 10 15 20 25 30
mA
U
elution time (min)
passion fruit shell-unhydrolysed
P1
Figure 5-13 Chromatograms of passion fruit extracts. Top: passion fruit flesh; Bottom:
passion fruit shell. (Peaks identified: P1: daidzin; P2 may be biochanin-A but was not
further identified)
Chapter 5 Identification of Potential Isoflavone Glycoside Sources
179
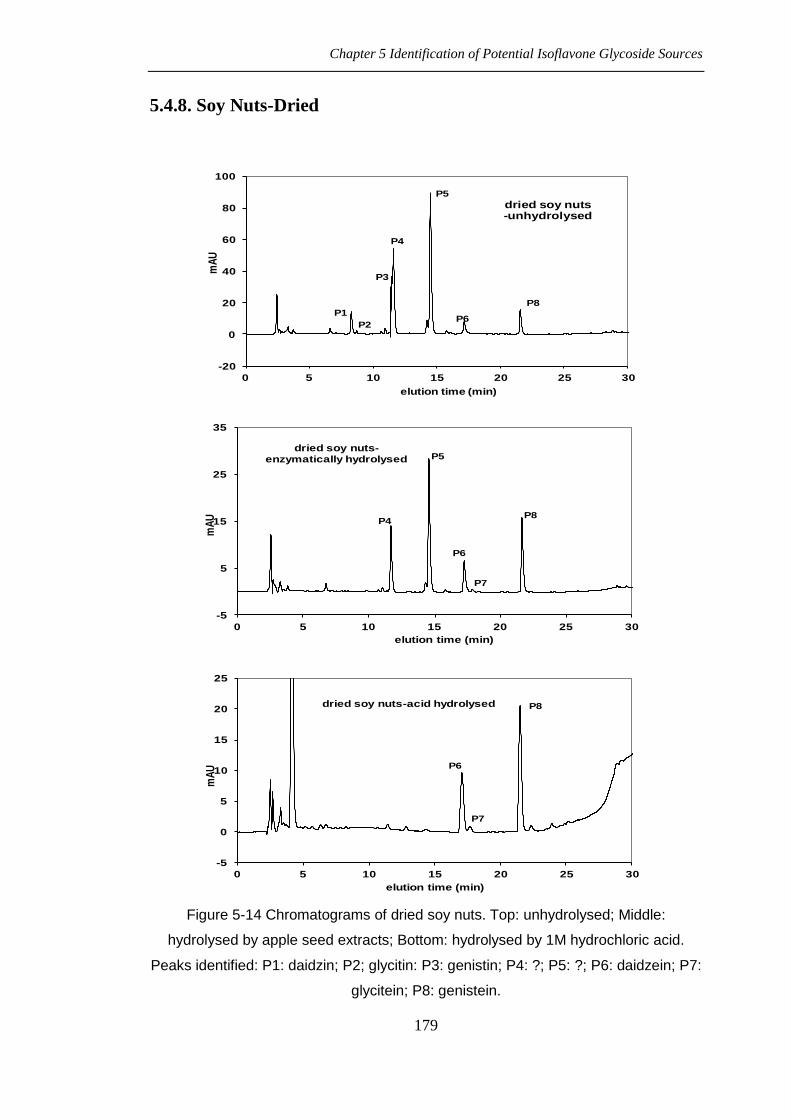
5.4.8. Soy Nuts-Dried
-20
0
20
40
60
80
100
0 5 10 15 20 25 30
mA
U
elution time (min)
dried soy nuts-unhydrolysed
P1
P2
P3
P4
P5
P6
P8
-5
5
15
25
35
0 5 10 15 20 25 30
mA
U
elution time (min)
dried soy nuts-enzymatically hydrolysed
P4
P5
P6
P7
P8
-5
0
5
10
15
20
25
0 5 10 15 20 25 30
mA
U
elution time (min)
dried soy nuts-acid hydrolysed
P6
P7
P8
Figure 5-14 Chromatograms of dried soy nuts. Top: unhydrolysed; Middle:
hydrolysed by apple seed extracts; Bottom: hydrolysed by 1M hydrochloric acid.
Peaks identified: P1: daidzin; P2; glycitin: P3: genistin; P4: ?; P5: ?; P6: daidzein; P7:
glycitein; P8: genistein.
Chapter 5 Identification of Potential Isoflavone Glycoside Sources
180
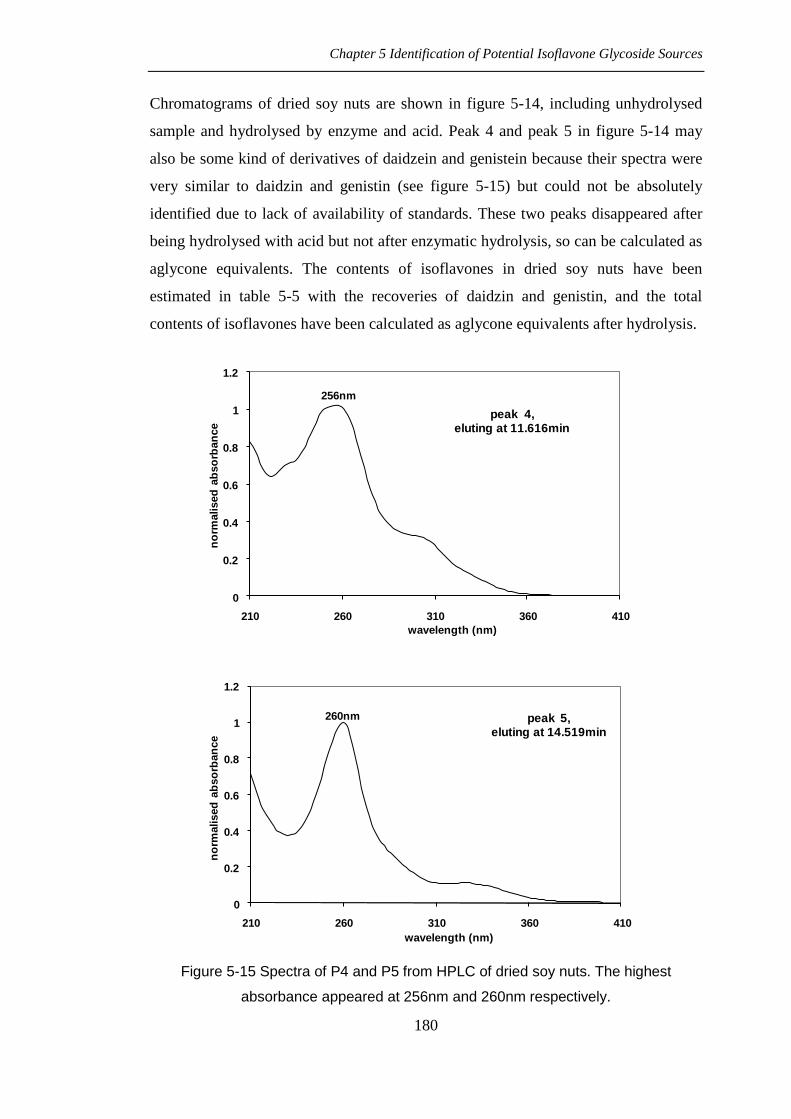
Chromatograms of dried soy nuts are shown in figure 5-14, including unhydrolysed
sample and hydrolysed by enzyme and acid. Peak 4 and peak 5 in figure 5-14 may
also be some kind of derivatives of daidzein and genistein because their spectra were
very similar to daidzin and genistin (see figure 5-15) but could not be absolutely
identified due to lack of availability of standards. These two peaks disappeared after
being hydrolysed with acid but not after enzymatic hydrolysis, so can be calculated as
aglycone equivalents. The contents of isoflavones in dried soy nuts have been
estimated in table 5-5 with the recoveries of daidzin and genistin, and the total
contents of isoflavones have been calculated as aglycone equivalents after hydrolysis.
0
0.2
0.4
0.6
0.8
1
1.2
210 260 310 360 410
no
rmalised
ab
so
rban
ce
wavelength (nm)
peak 4, eluting at 11.616min
256nm
0
0.2
0.4
0.6
0.8
1
1.2
210 260 310 360 410
no
rmalised
ab
so
rban
ce
wavelength (nm)
peak 5, eluting at 14.519min
260nm
Figure 5-15 Spectra of P4 and P5 from HPLC of dried soy nuts. The highest
absorbance appeared at 256nm and 260nm respectively.
Chapter 5 Identification of Potential Isoflavone Glycoside Sources
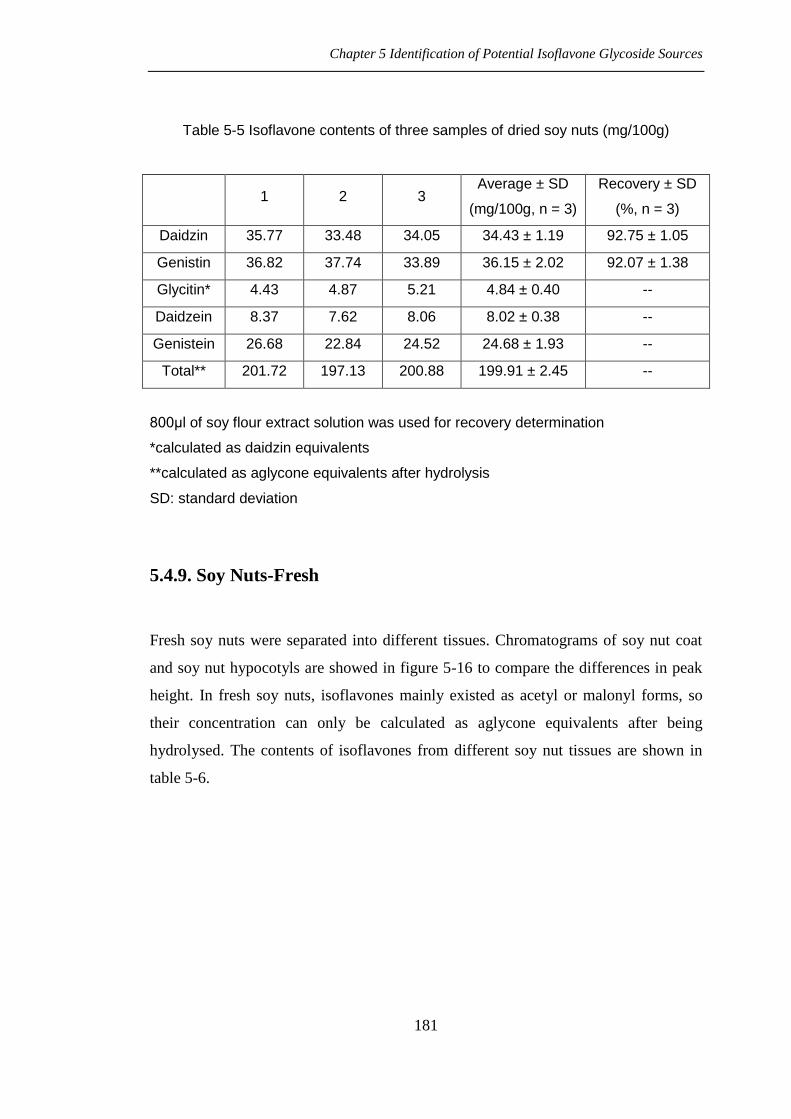
181
Table 5-5 Isoflavone contents of three samples of dried soy nuts (mg/100g)
1 2 3 Average ± SD
(mg/100g, n = 3)
Recovery ± SD
(%, n = 3)
Daidzin 35.77 33.48 34.05 34.43 ± 1.19 92.75 ± 1.05
Genistin 36.82 37.74 33.89 36.15 ± 2.02 92.07 ± 1.38
Glycitin* 4.43 4.87 5.21 4.84 ± 0.40 --
Daidzein 8.37 7.62 8.06 8.02 ± 0.38 --
Genistein 26.68 22.84 24.52 24.68 ± 1.93 --
Total** 201.72 197.13 200.88 199.91 ± 2.45 --
800μl of soy flour extract solution was used for recovery determination
*calculated as daidzin equivalents
**calculated as aglycone equivalents after hydrolysis
SD: standard deviation
5.4.9. Soy Nuts-Fresh
Fresh soy nuts were separated into different tissues. Chromatograms of soy nut coat
and soy nut hypocotyls are showed in figure 5-16 to compare the differences in peak
height. In fresh soy nuts, isoflavones mainly existed as acetyl or malonyl forms, so
their concentration can only be calculated as aglycone equivalents after being
hydrolysed. The contents of isoflavones from different soy nut tissues are shown in
table 5-6.

Chapter 5 Identification of Potential Isoflavone Glycoside Sources
182
-2
0
2
4
6
8
10
0 5 10 15 20 25 30
mA
U
elution time (min)
fresh soy nut seed coat-unhydrolysed
P3
P4
-20
0
20
40
60
80
100
0 5 10 15 20 25 30
mA
U
elution time (min)
fresh soy nuthypocotyl-unhydrolysed
P1 P2
P3
P4
Figure 5-16 Chromatograms of the different fresh soy nut tissues compared. Top: soy
nuts seed coat; Bottom: soy nuts hypocotyl. Both extracts are unhydrolysed. Note the
difference of the Y axis. Peaks identified: P1: daidzin; P2; glycitin; P3 was the peak
P4 in dried soy nuts; P4 was the peak 5 in dried soy nuts. The peaks after 25mins
were so-called “ghost peaks”.
Chapter 5 Identification of Potential Isoflavone Glycoside Sources
183
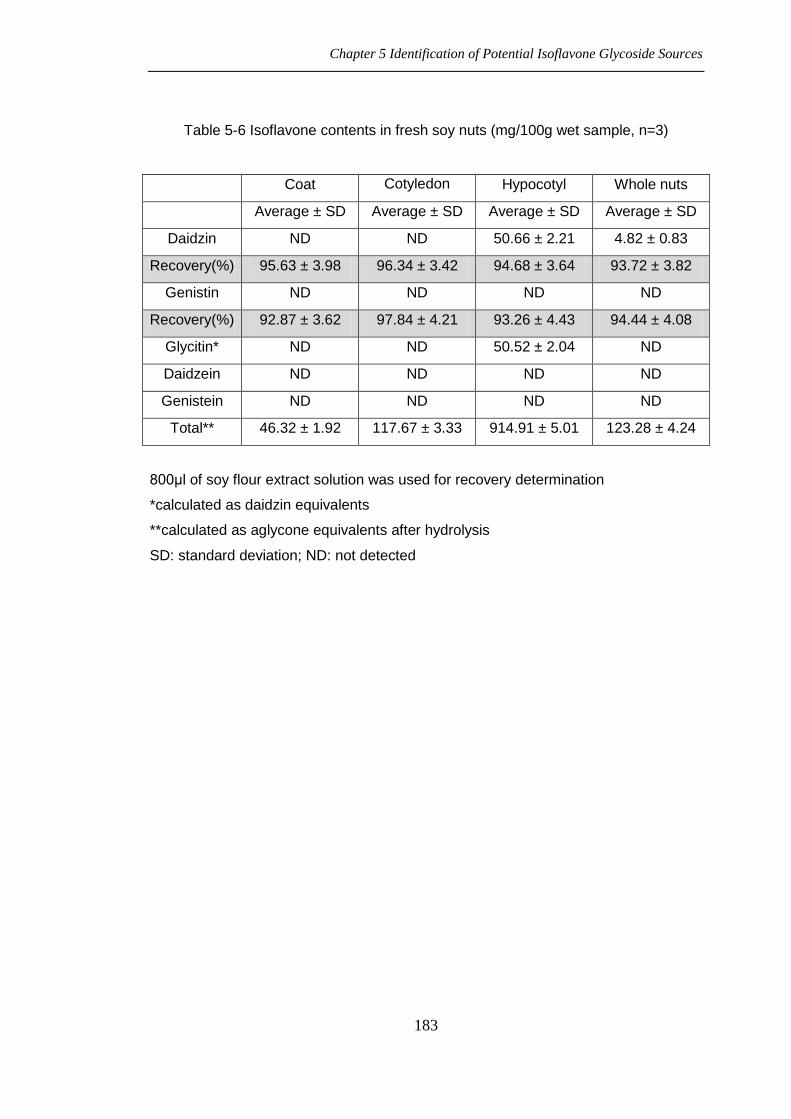
Table 5-6 Isoflavone contents in fresh soy nuts (mg/100g wet sample, n=3)
Coat Cotyledon Hypocotyl Whole nuts
Average ± SD Average ± SD Average ± SD Average ± SD
Daidzin ND ND 50.66 ± 2.21 4.82 ± 0.83
Recovery(%) 95.63 ± 3.98 96.34 ± 3.42 94.68 ± 3.64 93.72 ± 3.82
Genistin ND ND ND ND
Recovery(%) 92.87 ± 3.62 97.84 ± 4.21 93.26 ± 4.43 94.44 ± 4.08
Glycitin* ND ND 50.52 ± 2.04 ND
Daidzein ND ND ND ND
Genistein ND ND ND ND
Total** 46.32 ± 1.92 117.67 ± 3.33 914.91 ± 5.01 123.28 ± 4.24
800μl of soy flour extract solution was used for recovery determination
*calculated as daidzin equivalents
**calculated as aglycone equivalents after hydrolysis
SD: standard deviation; ND: not detected

Chapter 5 Identification of Potential Isoflavone Glycoside Sources
184
5.5. General Discussion
5.5.1. The Method of Determination
As mentioned previously, isoflavone determination can be simply divided into sample
preparation and sample analysis. The aim of sample preparation is to separate
isoflavones from raw materials and other components by extraction into another
solvent. Concentration and purification procedures may then be carried out. Some
researchers have investigated optimum conditions for flavonoid extraction (Barnes et
al., 1994; Liggins et al., 1998; Calabrò et al., 2004; Chang et al., 2004; Cho et al.,
2009; Rostagno et al., 2009; Visnevschi-Necrasov et al., 2009) and found that the best
results could obtained by soaking samples in 70-80% methanol or ethanol and shaking
at 37°C for about 2hrs. Under these conditions, isoflavones can be extracted from
natural materials in their original forms since aqueous solvent can separate
isoflavones with other components with best resolution, especially from other large
molecular weight compounds; and this temperature is a balance point of extract
velocity and protecting not heat-resistant forms of isoflavones. In the present study,
80% methanol was chosen and good recoveries were obtained (see table 5-3, table 5-4,
table 5-5 and table 5-6.). Results show that this method can extract both polar
isoflavones, like daidzin and puerarin, which are hydrophilic isoflavone glycosides
eluted quite early; and non-polar isoflavones, such as formononetin and biochanin-A,
which are hydrophobic isoflavone aglycones eluted later than daidzein and which are
the naturally-existing isoflavone forms in red clover. The extraction recovery of these
two isoflavones weren’t determined. As all materials tested contained high levels of
isoflavones, extra concentration procedures were unnecessary.
HPLC is nowadays the analysis method used predominantly in isoflavone
determination, and is frequently connected with other detectors, including HPLC-UV
Spectrophotometry, HPLC-Mass Spectrometry, HPLC-Nuclear Magnetic Resonance,
etc (Marston & Hostettmann, 2006). Reversed-phase HPLC-UV spectrophotometry
with Diode Array Detector (DAD) is used most popularly, while HPLC-MS and
HPLC-NMR are also used frequently especially for determining unfamiliar
Chapter 5 Identification of Potential Isoflavone Glycoside Sources
185
components. The usage of HPLC in determining isoflavones was reviewed by Merken
& Beecher (2000).
Besides HPLC, other determination methods have been created and provided
satisfactory results for specified samples, such as Capillary Electrophoresis (CE)
(Tomás-Barberán, 1995; Urbánek et al., 2002), Enzyme-Linked ImmunoSorbent
Assay (ELISA) (Ambler & Peters, 1984; Mathey et al., 2006). Usually such methods
are very useful in dealing with large numbers of samples.
CE is an analytical technique providing high separation efficiency and short run times
but exhibiting much lower sensitivity, and less reproducible quantitative data
(Marston & Hostettmann, 2006). Several modes of CE are available, but the simplest
and most versatile is Capillary Zone Electrophoresis (CZE), in which the separation is
based on differences in the charge-to-mass ratio and analytes migrate into discrete
zones at different velocities (Urbánek et al., 2002). Anions and cations are separated
in CZE by electrophoretic migration and electro-osmotic flow (EOF), while neutral
species co-elute with the EOF. Compared with HPLC, CE can provide an alternative
analytical method when higher efficiency or higher resolution is required (Tomás-
Barberán, 1995).
A novel nonisotopic microtitration plate assay based on the human estrogen receptor
has been developed by Garrett et al. (1999) to screen soy-based and soy-containing
foods for their phytoestrogen content. The validation of the assay for use with food
extracts has been demonstrated by investigation of recoveries after acidic and
enzymatic hydrolysis, by investigation of matrix effects, and by comparison of results
with HPLC analysis. Phytoestrogen levels in soy products analysed ranged between
520 and 1872μg of genistein equivalent/g of soy flour, 5-282μg/g of soy concentrates,
503-1292μg/g of soy-protein isolates, and 108-226μg/g of soy-based infant formulas.
Comparison of results for 12 samples analysed both by the receptor assay and by
HPLC showed good correlation (r 2 = 0.905). This assay, with sensitivity of 3.4μg/g,
and 14 samples/plate analysed in 4hr following hydrolysis, provide a rapid and simple
analysis method for screening phytoestrogen-containing foods.
Chapter 5 Identification of Potential Isoflavone Glycoside Sources
186
5.5.2. Soy Isoflavones
5.5.2.1. Tissue location of soy isoflavones
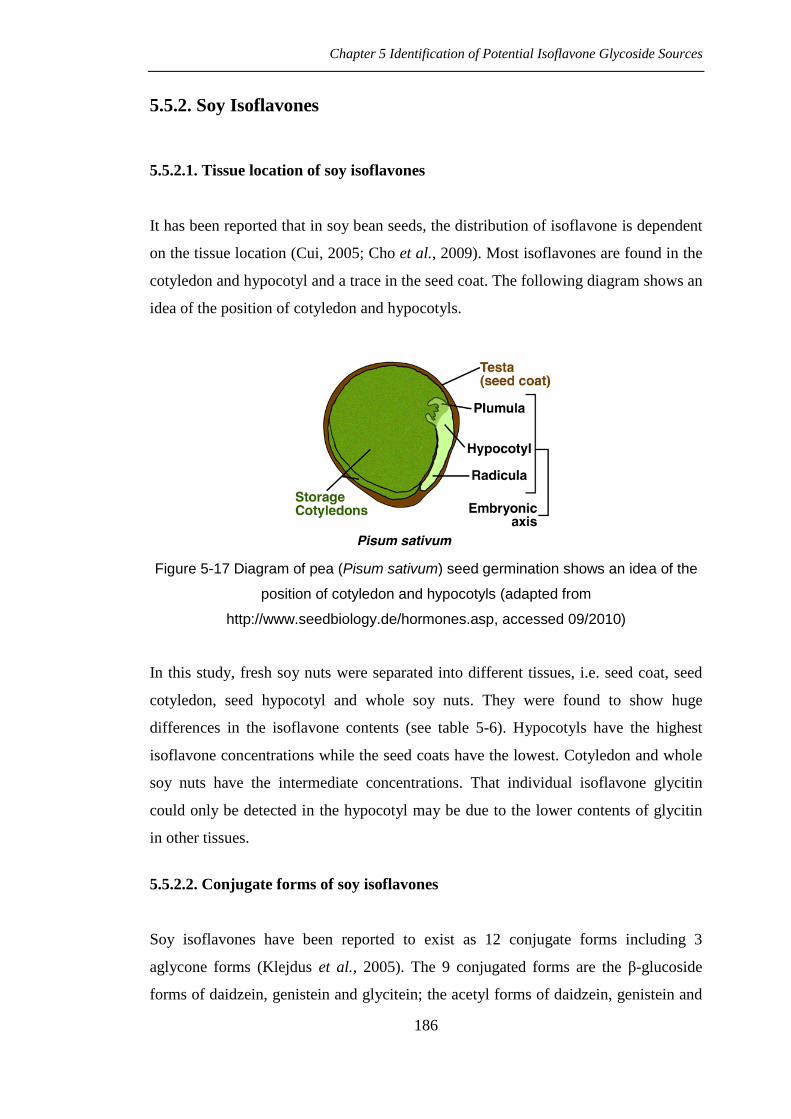
It has been reported that in soy bean seeds, the distribution of isoflavone is dependent
on the tissue location (Cui, 2005; Cho et al., 2009). Most isoflavones are found in the
cotyledon and hypocotyl and a trace in the seed coat. The following diagram shows an
idea of the position of cotyledon and hypocotyls.
Figure 5-17 Diagram of pea (Pisum sativum) seed germination shows an idea of the
position of cotyledon and hypocotyls (adapted from
http://www.seedbiology.de/hormones.asp, accessed 09/2010)
In this study, fresh soy nuts were separated into different tissues, i.e. seed coat, seed
cotyledon, seed hypocotyl and whole soy nuts. They were found to show huge
differences in the isoflavone contents (see table 5-6). Hypocotyls have the highest
isoflavone concentrations while the seed coats have the lowest. Cotyledon and whole
soy nuts have the intermediate concentrations. That individual isoflavone glycitin
could only be detected in the hypocotyl may be due to the lower contents of glycitin
in other tissues.
5.5.2.2. Conjugate forms of soy isoflavones
Soy isoflavones have been reported to exist as 12 conjugate forms including 3
aglycone forms (Klejdus et al., 2005). The 9 conjugated forms are the β-glucoside
forms of daidzein, genistein and glycitein; the acetyl forms of daidzein, genistein and

Chapter 5 Identification of Potential Isoflavone Glycoside Sources
187
glycitein; and the malonyl forms of daidzein, genistein and glycitein. The difference is
the sugar moiety linked with the OH group on the 6′′ position of the glucose residue
of the β-glucoside form. The structure is shown in figure 5-18 (Barnes et al., 1994;
Ismail & Hayes, 2005).
Figure 5-18 Conjugate forms of soy isoflavones
Naturally, in soy bean raw materials, most of the isoflavones exist as malonyl forms,
reaching 60% (Barnes et al., 1994). However, the malonyl forms are relatively
unstable, and are very easily hydrolysed into acetyl forms and subsequently β-
glycoside forms once heated. But conversion into aglycone forms is harder and needs
the presence of exogenous enzyme (Cui, 2005). In some soy products which have
been thermally treated, the isoflavones being determined may not be in the malonyl
form any more, but are seen as acetyl forms and even glucoside forms only.
In soy flour, isoflavones mainly existed as glucoside forms, i.e. daidzin, genistin, and
glycitin, indicating that most of the malonyl forms and acetyl forms had been
hydrolysed into glucoside forms when being toasted. In soy nuts, no matter whether
dried or fresh, there were large amounts of acetyl and malonyl forms of isoflavone.
The difference in the isoflavone content results reflects the efficiency of the extraction
method, and therefore the real situation in the plant material analysed.
Since β-glucosidase cannot hydrolyse the peak 4 and peak 5 in soy nuts significantly
(see figure 5-14), and peaks 4 and 5 were high indicating there were large amounts of
Chapter 5 Identification of Potential Isoflavone Glycoside Sources
188
these components existing in both fresh and dried soy nuts, acidic hydrolysis was
carried out in order to calculate the total amount of isoflavones.
5.5.2.3. The elution order of 12 soy isoflavones
The principle of HPLC is eluting components according to their polarity. So the
elution time may be different between different HPLC methods, but the elution order
which correlates to polarity order should be similar and can be used as reference.
According to the HPLC method of the Japanese Association of Soy Isoflavones, the
elution order of the 12 soy isoflavones should be: daidzin, glycitin, genistin,
malonyldaidzin, malonylglycitin, acetyldaidzin, acetylglycitin, malonylgenistin,
daidzein, glycitein, acetlygenistein, genistein (Cui, 2005).
5.5.3. Broad Beans
Broad beans have been reported to be rich in isoflavones (Mazur et al., 1998).
However, surprisingly, the isoflavone contents detected in the extracts (both fresh
broad beans and salted broad beans) were very much lower than expected.
5.5.4. Chickpea Isoflavones
The isoflavone pattern of chick pea (Cicer arietinum) was different to soy. Besides
daidzin and genistein, there was a large amount of biochanin-A although genistein
was represented by the biggest peak. In chickpea, genistein and daidzein existed as
aglycone forms while biochanin-A existed mainly as glycoside forms. This indicated
that chickpea was a good source of biochanin-A and genistein in the diet because it is
readily available in most food stores and supermarkets.
Chickpea is one of the earliest cultivated vegetables, rich in protein, carbohydrate,
zinc, and folate, grown in the Mediterranean, western Asia, Indian and Australia, one
of the most popular vegetarian foods in India, Pakistan, Bangladesh and the UK.
(www.wikipedia.org/wiki/chickpea, accessed 03/2007). Mature chickpea can be
Chapter 5 Identification of Potential Isoflavone Glycoside Sources
189
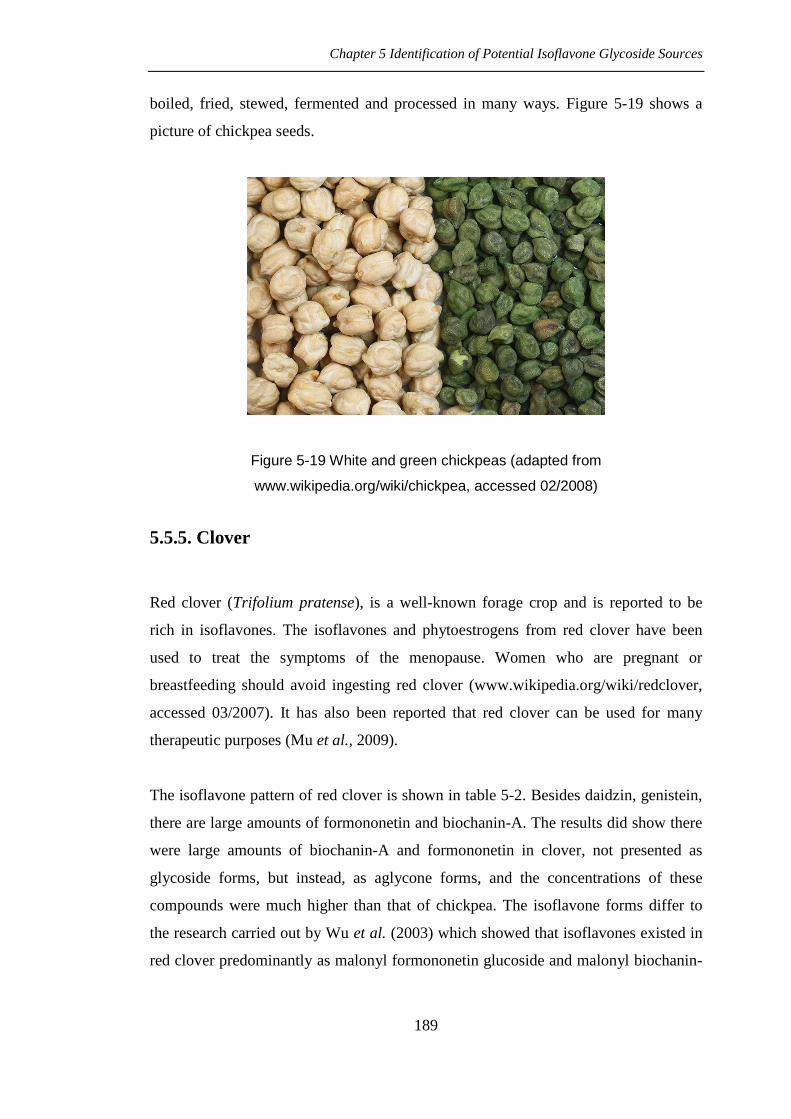
boiled, fried, stewed, fermented and processed in many ways. Figure 5-19 shows a
picture of chickpea seeds.
Figure 5-19 White and green chickpeas (adapted from
www.wikipedia.org/wiki/chickpea, accessed 02/2008)
5.5.5. Clover
Red clover (Trifolium pratense), is a well-known forage crop and is reported to be
rich in isoflavones. The isoflavones and phytoestrogens from red clover have been
used to treat the symptoms of the menopause. Women who are pregnant or
breastfeeding should avoid ingesting red clover (www.wikipedia.org/wiki/redclover,
accessed 03/2007). It has also been reported that red clover can be used for many
therapeutic purposes (Mu et al., 2009).
The isoflavone pattern of red clover is shown in table 5-2. Besides daidzin, genistein,
there are large amounts of formononetin and biochanin-A. The results did show there
were large amounts of biochanin-A and formononetin in clover, not presented as
glycoside forms, but instead, as aglycone forms, and the concentrations of these
compounds were much higher than that of chickpea. The isoflavone forms differ to
the research carried out by Wu et al. (2003) which showed that isoflavones existed in
red clover predominantly as malonyl formononetin glucoside and malonyl biochanin-
Chapter 5 Identification of Potential Isoflavone Glycoside Sources
190
A glucoside although certain levels of free aglycones existed. This could be explained
either by differences in extraction method or differences between red clover samples.
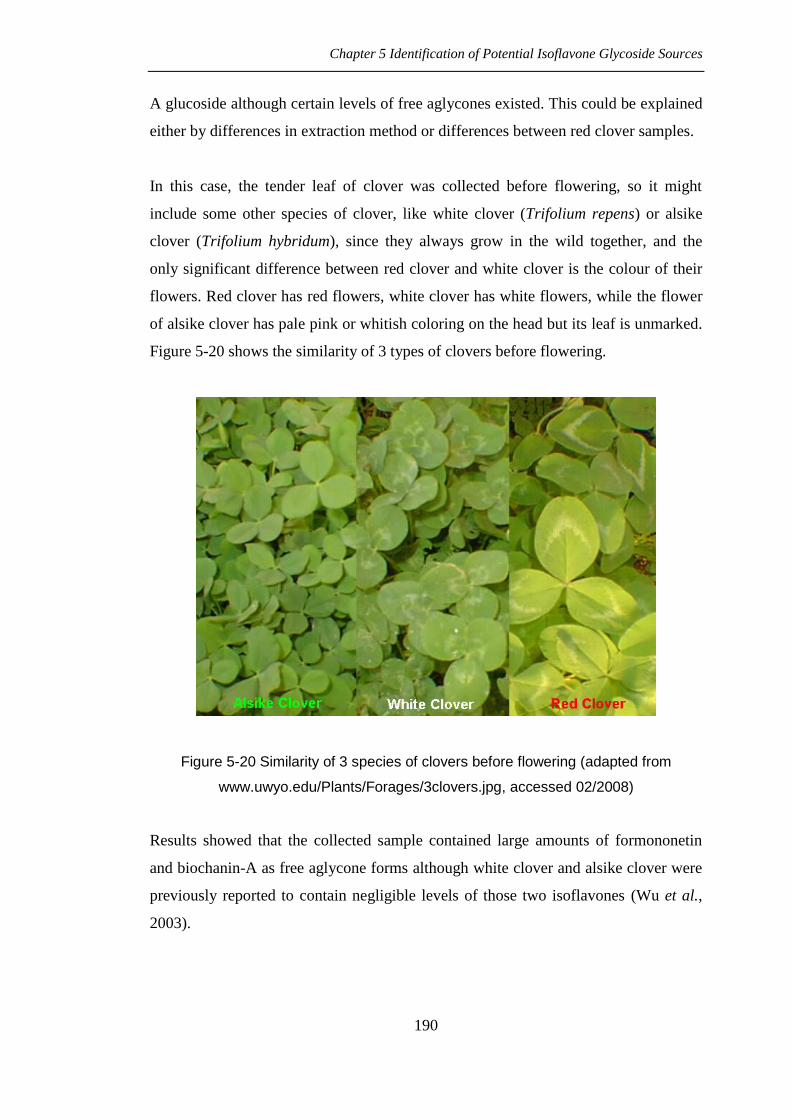
In this case, the tender leaf of clover was collected before flowering, so it might
include some other species of clover, like white clover (Trifolium repens) or alsike
clover (Trifolium hybridum), since they always grow in the wild together, and the
only significant difference between red clover and white clover is the colour of their
flowers. Red clover has red flowers, white clover has white flowers, while the flower
of alsike clover has pale pink or whitish coloring on the head but its leaf is unmarked.
Figure 5-20 shows the similarity of 3 types of clovers before flowering.
Figure 5-20 Similarity of 3 species of clovers before flowering (adapted from
www.uwyo.edu/Plants/Forages/3clovers.jpg, accessed 02/2008)
Results showed that the collected sample contained large amounts of formononetin
and biochanin-A as free aglycone forms although white clover and alsike clover were
previously reported to contain negligible levels of those two isoflavones (Wu et al.,
2003).

Chapter 5 Identification of Potential Isoflavone Glycoside Sources
191
5.5.6. Kudzu Isoflavones
In kudzu (Pueraria lobata), which has a special isoflavone pattern, the biggest peak
appeared at 5.545mins (see figure 5-8, P1), which has been confirmed as puerarin
(Setchell et al., 2001; Kirakosyan et al., 2003a; Lau et al., 2009).
Puerarin is daidzein-8-C-glucoside, also a glucoside form of daidzein (Pei et al., 1999;
Lau et al., 2009). The structure of puerarin is shown in figure 5-21. In principle, after
hydrolysing kudzu extract solution, the increased area of daidzein included not only
that produced from daidzin, but also produced from puerarin. However, this
hydrolysis reaction could not be carried out either by enzymatic catalysis or by acidic
hydrolysis described in 5.3.6., because the C- type of glycoside of flavonoid cannot be
either enzymatically hydrolysed or by acid (Mabry et al., 1970). In order to hydrolyse
this type of glycosylated flavonoid, another more drastic hydrolysis methods should
be applied, such as the FeCl3 hydrolysis method described by Mabry et al. (1970).
Figure 5-21 Structure of puerarin
Puerarin content in kudzu was calculated from the standard curve of daidzin due to
the lack of purified puerarin standard. Thus isoflavone content was estimated although
this might not be precise. Puerarin was an important isoflavone predominantly in
kudzu.
Chapter 5 Identification of Potential Isoflavone Glycoside Sources
192
5.5.7. Mung Bean
Mung bean (Vigna radiata), is very popular in south Asia and east Asia, and its
sprouts have been reported to be rich in isoflavones (Kuhnle et al., 2009). However,
for Mung bean itself, the isoflavone content was very low and the main flavonoids
observed in extracts weren’t isoflavones.
However, in mung bean sprouts, which are simply called “bean sprouts” and easily
available in most UK supermarkets, there were certain amounts of daidzin and
genistin. This might also confirm that the isoflavone content is affected by the
physiological stage of the plant (see 5.1.3.3).
5.5.8. Passion Fruits
Passion fruits (Passiflora edulis) is not a member of the family Leguminoseae, but
belongs to the genus Passiflora, family Passifloraceae, order Malpighiales, class
Magoliopsida (www.wikipedia.org/wiki/passionfruit, accessed 02/2008). Interestingly,
it was found that there was a significant amount of daidzin in passion fruit, which
means that humans might be able to supplement isoflavones from outside the
Leguminoseae family.
Passion fruit is a plant cultivated commercially in frost-free areas for its fruit, native
to South America and then widely spread (www.wikipedia.org/wiki/passionfruit,
accessed 02/2008). The passion fruit is round to oval, yellow or dark purple at
maturity, with a soft to firm, juicy interior filled with numerous seeds, and the fruit
can be grown to eat or for its juice, which is often added to other fruit juices to
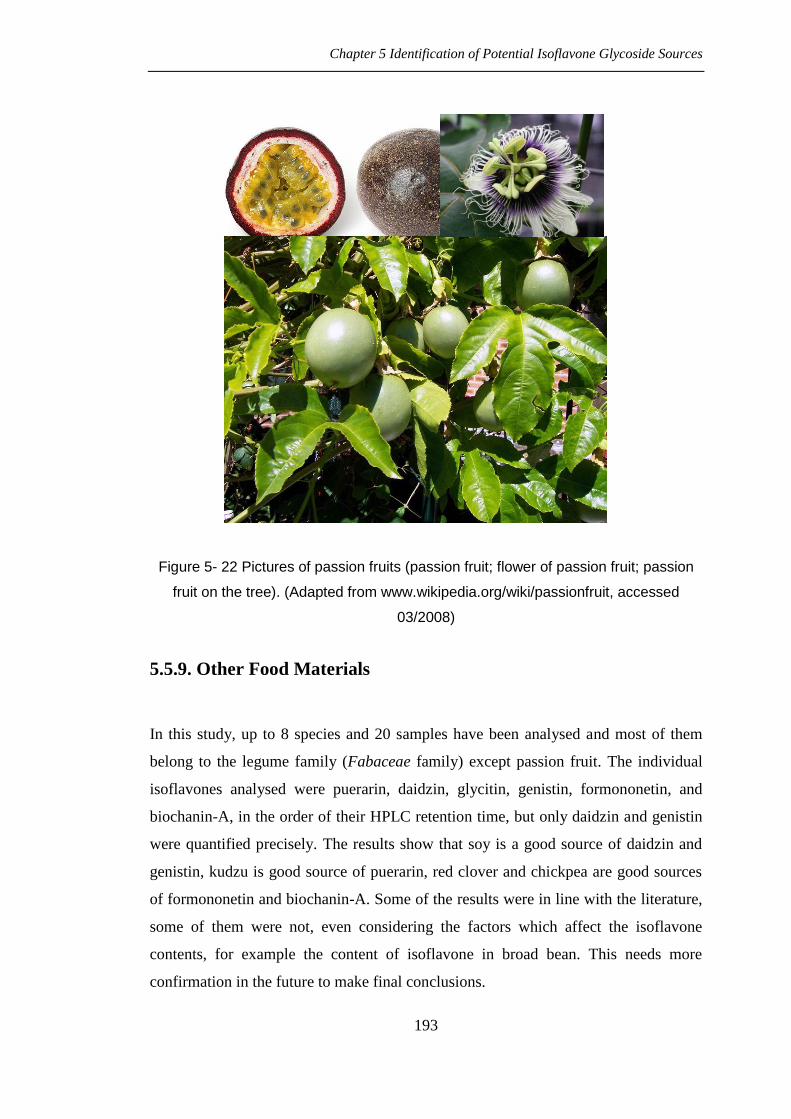
enhance aroma. Nowadays it is easily found in supermarkets in the UK. Figure 5-22
shows the fruit, the flower, and the tree of passion fruit.
Chapter 5 Identification of Potential Isoflavone Glycoside Sources
193
Figure 5- 22 Pictures of passion fruits (passion fruit; flower of passion fruit; passion
fruit on the tree). (Adapted from www.wikipedia.org/wiki/passionfruit, accessed
03/2008)
5.5.9. Other Food Materials
In this study, up to 8 species and 20 samples have been analysed and most of them
belong to the legume family (Fabaceae family) except passion fruit. The individual
isoflavones analysed were puerarin, daidzin, glycitin, genistin, formononetin, and
biochanin-A, in the order of their HPLC retention time, but only daidzin and genistin
were quantified precisely. The results show that soy is a good source of daidzin and
genistin, kudzu is good source of puerarin, red clover and chickpea are good sources
of formononetin and biochanin-A. Some of the results were in line with the literature,
some of them were not, even considering the factors which affect the isoflavone
contents, for example the content of isoflavone in broad bean. This needs more
confirmation in the future to make final conclusions.

Chapter 5 Identification of Potential Isoflavone Glycoside Sources
194
Besides the materials have been tested, there are other materials reported rich in
isoflavones, and some of them may also be available as human food. Determination of
their isoflavone contents and pattern can provide more information for human
isoflavone dietary supplementation.
First of all, some raw materials are worth trying, including alfalfa, psoralea, lupine,
peanut, etc. Alfalfa (Medicago sativa L.) is an important forage crop and soil fertility
promoter, native to Europe. Alfalfa seeds are readily found in local food stores
especially those selling organic or health food. Interestingly, alfalfa was also reported
as a source of β-D-glucosidase (Robinson, 1966) like soy bean (Hsieh & Graham,
2001; Suzuki et al., 2006) and chickpea (Hinderer et al., 1986). So it may become
both a source of β-D-glucosidase and a source of isoflavones. Psoralea (Psoralea
corylifolia), normally its seeds, is used as a Chinese herb and can be found in Chinese
medical clinics or pharmacies either in China or in UK, and which has been claimed
to contain the highest levels of daidzein and genistein (Shinde et al., 2010). Lupine
(Lupinus spp), a beautiful flowering plant, native to North America and then spread
throughout the world, is also cultivated as forage and grain legumes, can bought from
the internet and found as a processed food, for example, as pickled seeds, in the UK.
Lupine has also been reported as containing high levels of genistein (Dueñas et al.,
2009). Peanut (Arachis hypogaea), a well-known nut, rich in protein, fat, starch, and
other nutrients, is very popular in the UK, and has also been reported to contain
certain levels of isoflavone especially genistein. Although the level of isoflavones in
peanut may be lower than the other materials mentioned here (Mazur & Adlercreutz,
1998; Liggins et al., 2000), however, it may be the most available source.
Additionally, some berries such as currants and raisins have also been reported to
contain certain levels of daidzin and genistin (Mazur, 1998; Liggins et al., 2000) and
may be worthy of analysis since they are not members of the Legume family.
Besides raw food materials, other plant tissues from the above species may also be
worthy of analysis, including their leaf, stem, and sprouts, for instance, sprouts of
alfalfa and spouts of lupine can also be found in food stores.
Chapter 5 Identification of Potential Isoflavone Glycoside Sources
195
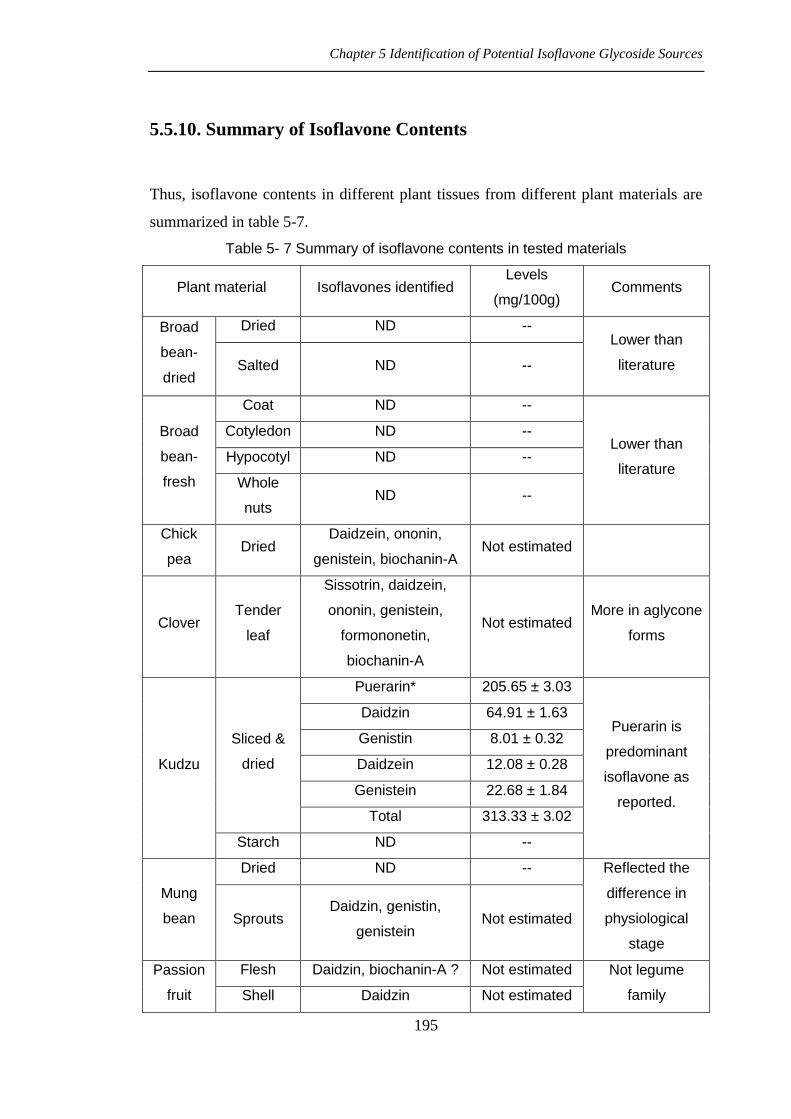
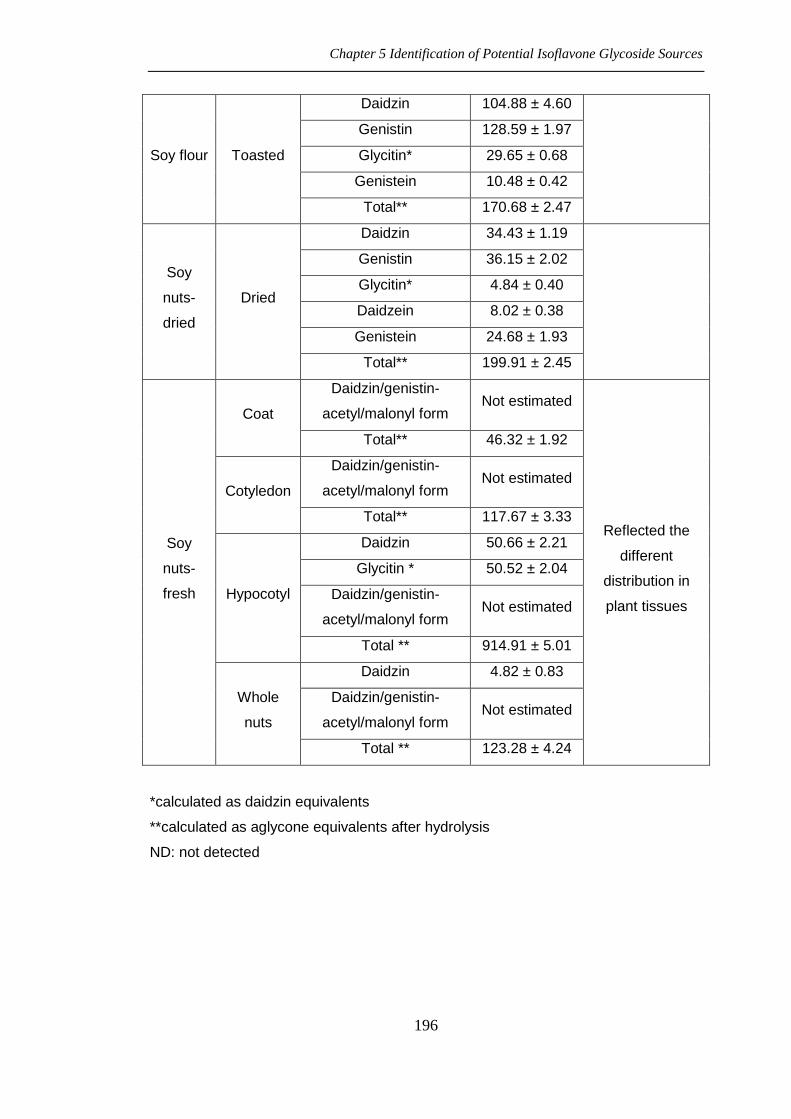
5.5.10. Summary of Isoflavone Contents
Thus, isoflavone contents in different plant tissues from different plant materials are
summarized in table 5-7.
Table 5- 7 Summary of isoflavone contents in tested materials
Plant material Isoflavones identified Levels
(mg/100g) Comments
Broad
bean-
dried
Dried ND -- Lower than
literature Salted ND --
Broad
bean-
fresh
Coat ND --
Lower than
literature
Cotyledon ND --
Hypocotyl ND --
Whole
nuts ND --
Chick
pea Dried
Daidzein, ononin,
genistein, biochanin-A Not estimated
Clover Tender
leaf
Sissotrin, daidzein,
ononin, genistein,
formononetin,
biochanin-A
Not estimated More in aglycone
forms
Kudzu
Sliced &
dried
Puerarin* 205.65 ± 3.03
Puerarin is
predominant
isoflavone as
reported.
Daidzin 64.91 ± 1.63
Genistin 8.01 ± 0.32
Daidzein 12.08 ± 0.28
Genistein 22.68 ± 1.84
Total 313.33 ± 3.02
Starch ND --
Mung
bean
Dried ND -- Reflected the
difference in
physiological
stage
Sprouts Daidzin, genistin,
genistein Not estimated
Passion
fruit
Flesh Daidzin, biochanin-A ? Not estimated Not legume
family Shell Daidzin Not estimated
Chapter 5 Identification of Potential Isoflavone Glycoside Sources
196
Soy flour Toasted
Daidzin 104.88 ± 4.60
Genistin 128.59 ± 1.97
Glycitin* 29.65 ± 0.68
Genistein 10.48 ± 0.42
Total** 170.68 ± 2.47
Soy
nuts-
dried
Dried
Daidzin 34.43 ± 1.19
Genistin 36.15 ± 2.02
Glycitin* 4.84 ± 0.40
Daidzein 8.02 ± 0.38
Genistein 24.68 ± 1.93
Total** 199.91 ± 2.45
Soy
nuts-
fresh
Coat
Daidzin/genistin-
acetyl/malonyl form Not estimated
Reflected the
different
distribution in
plant tissues
Total** 46.32 ± 1.92
Cotyledon
Daidzin/genistin-
acetyl/malonyl form Not estimated
Total** 117.67 ± 3.33
Hypocotyl
Daidzin 50.66 ± 2.21
Glycitin * 50.52 ± 2.04
Daidzin/genistin-
acetyl/malonyl form Not estimated
Total ** 914.91 ± 5.01
Whole
nuts
Daidzin 4.82 ± 0.83
Daidzin/genistin-
acetyl/malonyl form Not estimated
Total ** 123.28 ± 4.24
*calculated as daidzin equivalents
**calculated as aglycone equivalents after hydrolysis
ND: not detected
Chapter 5 Identification of Potential Isoflavone Glycoside Sources
197
5.6. Conclusions
It was confirmed that there are large amount of isoflavones in soy flour. The
isoflavone pattern was daidzin, genistin, glycitin, plus small amounts of the
acetyl forms of daidzin and genistin, and small amounts of the aglycone forms
of daidzein and genistein. The contents were high enough and the pattern was
simple enough to make this material suitable to be chosen for feeding
experiments.
Besides soy flour, some other materials were analysed and their isoflavone
contents and pattern were determined, which included broad bean, chickpea,
clover (tender leaf), kudzu, mung bean (dried bean and bean sprouts), passion
fruit, and soy bean (dried and fresh).
Amongst the tested materials, soy bean is the best source for daidzin and
genistin (glucoside forms), kudzu is the best source for puerarin, while clover
is the best source for formononetin and biochanin-A as the aglycone forms.
Passion fruit may be an interesting non-legume source of isoflavones worthy
of further study.
Contrary to literature reports, broad beans and mung beans were poor sources
of isoflavones, while mung bean sprouts contained isoflavones at relatively
high levels.
Less-well studied isoflavones such as biochanin-A, formononetin, puerarin
and the malonyl and the acetyl conjugates merit further study on absorption,
metabolism and bioactivity.