Embed Size (px)
Citation preview
RESEARCH ARTICLE Open Access
Identification of mycoparasitism-related genesagainst the phytopathogen Sclerotinia sclerotiorumthrough transcriptome and expression profileanalysis in Trichoderma harzianumAndrei Stecca Steindorff1, Marcelo Henrique Soller Ramada2, Alexandre Siqueira Guedes Coelho3,Robert Neil Gerard Miller1, Georgios Joannis Pappas Júnior1, Cirano José Ulhoa4* and Eliane Ferreira Noronha1
Abstract
Background: The species of T. harzianum are well known for their biocontrol activity against plant pathogens.However, few studies have been conducted to further our understanding of its role as a biological control agentagainst S. sclerotiorum, a pathogen involved in several crop diseases around the world. In this study, we have usedRNA-seq and quantitative real-time PCR (RT-qPCR) techniques in order to explore changes in T. harzianum geneexpression during growth on cell wall of S. sclerotiorum (SSCW) or glucose. RT-qPCR was also used to examinegenes potentially involved in biocontrol, during confrontation between T. harzianum and S. sclerotiorum.
Results: Data obtained from six RNA-seq libraries were aligned onto the T. harzianum CBS 226.95 reference genomeand compared after annotation using the Blast2GO suite. A total of 297 differentially expressed genes were foundin mycelia grown for 12, 24 and 36 h under the two different conditions: supplemented with glucose or SSCW.Functional annotation of these genes identified diverse biological processes and molecular functions requiredduring T. harzianum growth on SSCW or glucose. We identified various genes of biotechnological value encodingproteins with functions such as transporters, hydrolytic activity, adherence, appressorium development and pathogenesis.To validate the expression profile, RT-qPCR was performed using 20 randomly chosen genes. RT-qPCR expression profileswere in complete agreement with the RNA-Seq data for 17 of the genes evaluated. The other three showed differencesat one or two growth times. During the confrontation assay, some genes were up-regulated during and after contact,as shown in the presence of SSCW which is commonly used as a model to mimic this interaction.
Conclusions: The present study is the first initiative to use RNA-seq for identification of differentially expressed genesin T. harzianum strain TR274, in response to the phytopathogenic fungus S. sclerotiorum. It provides insights into themechanisms of gene expression involved in mycoparasitism of T. harzianum against S.sclerotiorum. The RNA-seq datapresented will facilitate improvement of the annotation of gene models in the draft T. harzianum genome and provideimportant information regarding the transcriptome during this interaction.
Keywords: T. harzianum, S. sclerotiorum, RNA-seq, Gene expression, Mycoparasitism
* Correspondence: [email protected] de Bioquímica e Biologia Molecular, Universidade Federal deGoiás, Campus Samambaia, Instituto de Ciências Biológicas, CEP 74.090-900Goiânia, GO, BrazilFull list of author information is available at the end of the article
© 2014 Steindorff et al.; licensee BioMed Central Ltd. This is an Open Access article distributed under the terms of the CreativeCommons Attribution License (http://creativecommons.org/licenses/by/2.0), which permits unrestricted use, distribution, andreproduction in any medium, provided the original work is properly credited. The Creative Commons Public DomainDedication waiver (http://creativecommons.org/publicdomain/zero/1.0/) applies to the data made available in this article,unless otherwise stated.
Steindorff et al. BMC Genomics 2014, 15:204http://www.biomedcentral.com/1471-2164/15/204
BackgroundSclerotinia sclerotiorum (Lib.) de Bary is one of the mostdevastating and cosmopolitan plant pathogens. This fungusinfects over 400 species of plants worldwide includingimportant crops and numerous weeds [1]. S. sclerotiorumposes a threat to crops such as sunflower, soybean, oilseedrape, edible dry bean, chickpea, peanut, dry pea, lentils,onion and tulip [1]. It is capable of infecting flowers, leaves,fruits or stems [2] and its life cycle initiates by the germin-ation of sclerotia and formation of infectious propagules.During the crop growing season, which dependson a set ofenvironmental factors, fungal sclerotia germinate to formmycelia, which can directly infect host plants, or produceascospores. Further, ascospores develop forming apothecia[3]. Ascospores are the primary infective propagules of S.sclerotiorum on many crops, and also can act in diseasescattering since they may be transported to neighboringfields as well as over longer distances [1].Chemical treatment is today the main strategy employed
worldwide for fungal disease control. In order to developalternative and sustainable methods for control of whitemold, which do not cause negative environmental oreconomic impacts during crop production, as observedwith the routine use of fungicides, our research grouphas isolated strains of a number of Trichoderma speciesfrom diverse agro-ecosystems in Brazil and assessed theirpotential for biocontrol of S. sclerotiorum. This analysis hasincluded evaluation of antagonistic capacity, productionof cell wall-degrading enzymes and production of volatileantibiotics [4]. Our results have identified T. harzianumRifai (anamorph) strain TR274 as a promising biocontrolagent against S.sclerotiorum in vitro and under field condi-tions [5,6].Biological control is a complex process which requires
the host to be recognised by the biocontrol agent, followedby hydrolytic enzyme and antibiotic production which istriggered by the direct attachment of the mycoparasite tothe host fungus. This contact is mediated by lectins andproteins harboring cellulose binding modules from hyphaeof the host and mycoparasitic fungus, respectively, therebyeliciting a signaling cascade comprising G-proteins andMAPKs that can modulate Trichoderma’s protein expres-sion pattern [7,8]. However, the detailed molecular mech-anisms involved in this process remain unknown. Thiscomplex mechanism is influenced by the pathogen andTrichoderma isolates evaluated [9]. In this context, studiesconducted on different strains are necessary for increasedunderstanding of the biocontrol mechanism.The sequencing of expressed-sequence-tag (EST) libraries
for different Trichoderma strains cultivated in the presenceof host fungi has contributed significantly to the large-scaleidentification ofmycoparasitism-related genes [10-12]. Ourresearch group has described gene mapping using EST andsuppression subtractive hybridization (SSH) approaches
[12,13] during the interaction of T. harzianum with Fusar-ium solani and proteomic approaches for T. harzianumgrown in liquid containing Rhizoctonia solani, Macropho-mina phaseolina and Fusarium sp cell walls [14]. WhilstDNA microarrays have been used to study the interactionamong Trichoderma and host plants [15], only two studieshave employed high-throughput transcriptomic approachesto investigate mycoparasitism mechanisms of Trichoderma[16,17]. RNA sequencing (RNA-Seq), a high-throughputtechnology used to sequence complementary DNA, hasbeen widely thought of as a revolutionary tool for tran-scriptomics [18-21]. The publically available whole genomesequence for T. harzianum CBS 226.95 [22], which wasrecently released by the Joint Genome Institute (JGI)(http://genome.jgi.doe.gov/Triha1/Triha1.home.html), nowallows for use of RNA-Seq approaches and mapping of datato the reference sequence, which will likely contributeto identification of mycoparasite-related genes, as wellas the molecular mechanisms by which this fungus isable to inhibit phytopathogen fungal growth.The present study is the first initiative to use RNA-seq
for identification of differentially expressed genes in T.harzianum strain TR274, in response to the phytopath-ogenic fungus S. sclerotiorum. T. harzianum TR274 wascultivated on liquid medium containing S. sclerotiorumcell wall (SSCW) to mimick fungal host presence. Quantita-tive real-time PCR (RT-qPCR) supported in silico-basedevidence for differential gene expression of candidate genesinvolved in mycoparasitism.
Results and discussionIllumina sequencing and mapping onto the T. harzianumreference genomeIn this present study, an RNA-seq approach was usedto map genes differentially expressed during T. harzianumgrowth on SSCW. The experimental design enabled com-parison of gene expression in the presence of host cell wallor glucose as sole carbon source. Samples of mRNA fromT. harzianum following three growth periods in the pres-ence of SSCW (12, 24 and 36 h) were used to construct sixIllumina libraries. A total of 171,442,148 sequence readswere obtained after quality trimming, varying from 25to 100 bp in length. Each library was represented by atleast 16,845,349 reads, representing a coverage of 66Xwhen compared with the full transcriptome, a densityregarded as adequate to perform gene expression analysis[23]. Complete mapping information can be accessed inAdditional file 1: Table S8.Sequence reads were aligned onto the T. harzianum CBS
226.95 reference genome [22]. This strain was isolatedfrom garden soil in the UK, while strain TR274 wasisolated from Brazilian cerrado soil. Despite the geneticdifferences among T. harzianum isolates described in theliterature [24,4] and the fact that the reference genome
Steindorff et al. BMC Genomics 2014, 15:204 Page 2 of 14http://www.biomedcentral.com/1471-2164/15/204
published is only a first draft, 82.6% ± 10.08% of the ob-tained reads were mapped onto the reference genomeusing the default settings of the Bowtie2 aligner. The highmapping percentage suggests a high similarity betweenthese isolates, at least at the transcriptome level. Only0.8% ± 0.15% of reads for each library was mapped inmore than one region on the reference genome and thesereads were not used in the expression analysis.
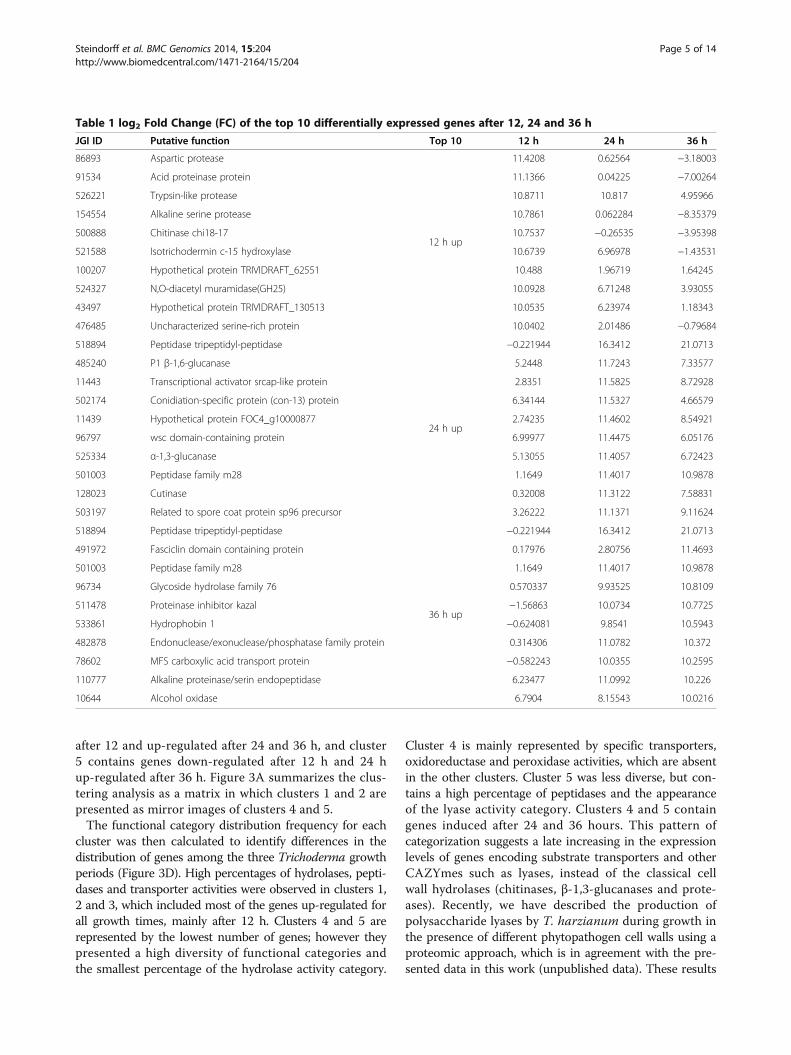
Gene expression analysis using “in silico” approachThe present work presents a first draft version of T. harzia-num CBS 226.95 [22] using the RNA-seq approach,and provided a total of 14095 predicted genes. Fromthese, the cuffdiff software analysis detected a total of297 differentially expressed genes in the presence of SSCWin comparison to glucose as carbon source, as showedby the Venn diagram (Figure 1A). Remarkably, differencesin gene distribution pattern were detected when the threeinduction times were compared. Data suggest a similarexpressed gene set distribution between 24 and 36 hours,with most changes detected between 12 hours and 24 hoursafter Trichoderma growth in the presence of SSCW. Thissame expression pattern was confirmed by gene regulatorynetwork analysis (GNR) (Figure 1B). The main modulationpattern was shared between 12 and 24 hours and a clear in-version between 12 and 36 h. The main genes with differentmodulation after 12 and 36 h belong to CAZymes andtransporters (Additional file 2: Table S1 and Additionalfile 3: Table S4). This suggests that some proteins requiredduring initial phases of cell wall degradation are not ne-cessary in late times such as 36 hours.The most notable increase in the gene expression was
observed between 12 and 24 hours with a noteworthlychange in expression pattern and protein functions de-tected between 12 and 36 hours. The main genes up ordownregulated after 12 and 36 h of growth encodedCAZymes and transporters (Additional file 2: Table S1and Additional file 3: Table S4). This suggests that someproteins required during early growth phases which areinvolved in cell wall degradation and sugar transport areno longer necessary after 36 hours of growth.In order to further evaluate the time course expression
profile, the top 10 differentially expressed genes after 12,24 and 36 hours were identified (Table 1). The top 10up-regulated genes at 12 h included a chitinase chi18-17and a GH25, four proteases, an isotrichodermin c-15 hy-droxylase and three proteins of unknown function (Table 1).The top 10 up-regulated genes at 24 h included two pepti-dases, one Carbohydrate Esterase Family 5 (cutinase),two GH (P1 and α-1,3-glucanase), one transcription factor(srcap-like), two conidiation related and one unknownprotein (Table 1). The top 10 up-regulated genes at 36 hincluded three proteases, a GH76, a MFS transport protein,two proteins involved in cell adhesion (hydrophobin 1 and
fasciclin domain protein), an alcohol oxidase, a proteaseinhibitor kazal and a CBM3 protein. It is interesting tonote that there are more proteases/peptidases across thethree growth times than GHs in the top 10 up-regulatedgenes. The combination of proteases and GHs seems to bepreferential in mycoparasitism-related conditions [12-14].Other genes also within the top 10 genes are involved inaccessory fuctions like cell adhesion, antibiotic biosynthesis,conidiation and transport, complementing the main deg-radation activity.To broadly compare gene expression patterns between
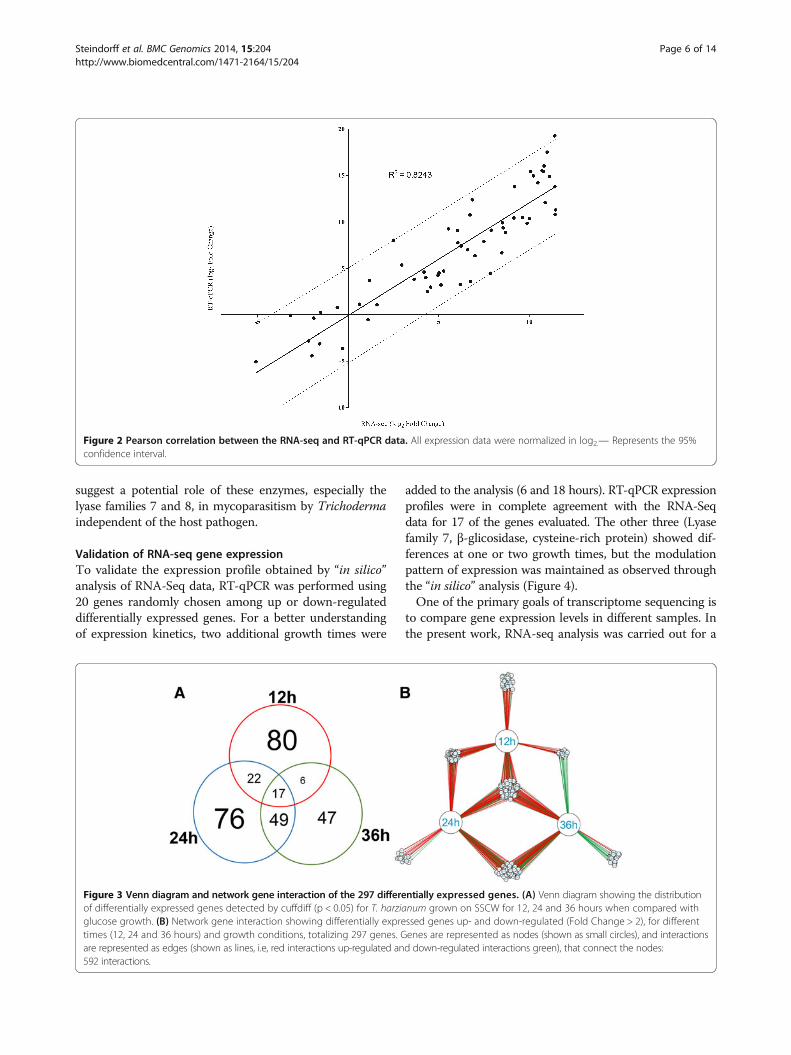
growth periods, functional categories were assigned to thedifferentially expressed genes according to Gene Ontology(GO) guidelines [25] using Blast2GO [26]. Interproscantool was used to improve the Gene Ontology annotations(Additional file 4: Table S2). To enrich the category analysisfor up and down regulated genes at each growth time point,an exact Fisher test (p < 0.05) was performed (Figure 2).Data showed a clear up-regulation of transcripts catego-rized as involved in primary metabolic processes andpresenting hydrolase activity, such as chitinases, β-1,3-glu-canases and proteases [10,12,13]. This sort of expressionpattern is expected, since the host fungus S. sclerotiorumcell wall is composed basically of proteins, chitin andβ-1,3/1,6/α-1,3glucans [27] and presents the first barrierto be overcome by the mycoparasite to achieve host cellinvasion. On the other hand, Trichoderma can also usethe fungal cell wall as carbon and nitrogen sources, andtherefore has to increase expression level of hydrolyticenzymes (chitinases, mutanases, β-1,3-glucanases andproteases) and primary metabolism encoding genes todegrade and metabolize the host cell wall.The down-regulated transcripts for all the stages of
growth were categorized into oxidoreductase activity,oxidation-reduction process and some “binding” childcategories, such as small molecule binding and nucleotidebinding proteins. A hypothesis for repression could be thenature of basal metabolism of the genes belonging tothese categories. This fact is consistent with the extensivemetabolic activity expected for a filamentous fungus grow-ing on a rich medium (glucose 2% medium) with an easilyassimilable substrate [17]. Under this culture conditionup-regulation of a specific subset of oxidoreductases andnucleotide binding proteins endoding genes related to pri-mary metabolism is commonly observed for Trichodermaspecies, which are down-regulated in the presence of com-plex substrates [13]. Vieira et al. in 2013 showed the samepattern of repressed categories when T. harzianum wasgrown on Fusarium solani cell wall, suggesting that thisresult is not pathogen-dependent.Finally, the expression profiles of the differentially
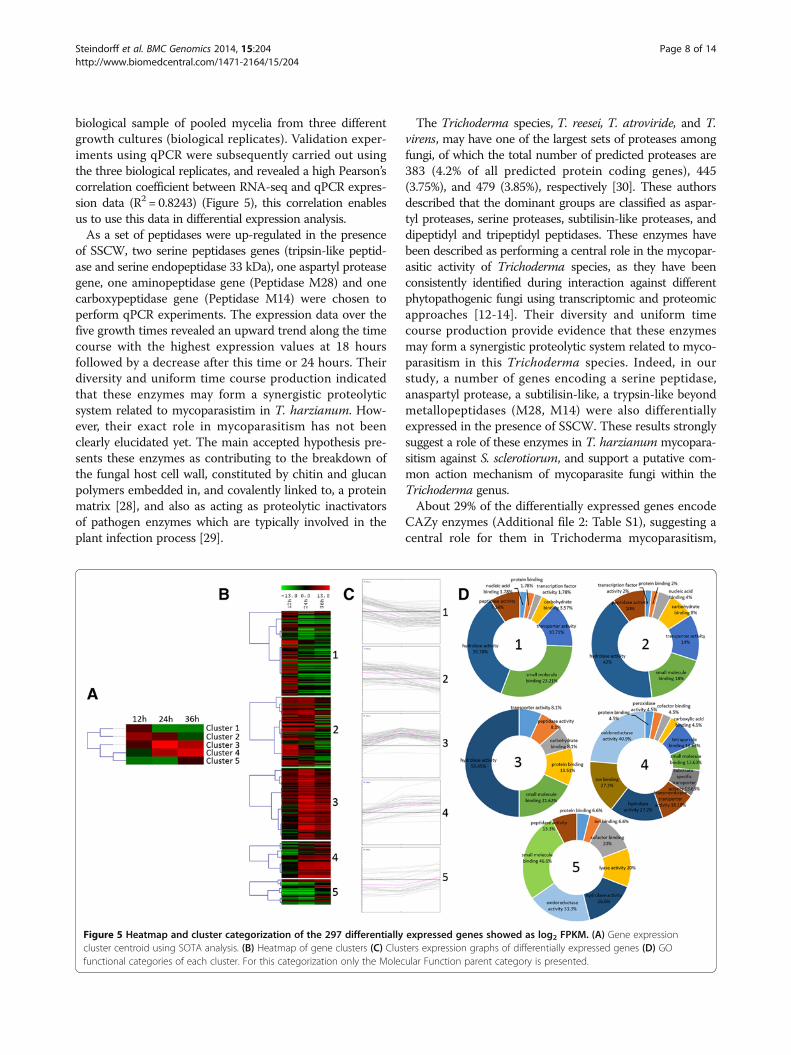
expressed genes were determined by cluster analysis basedon the SOTA method using Pearson’s correlation distance.These genes were divided into five groups based on their
Steindorff et al. BMC Genomics 2014, 15:204 Page 3 of 14http://www.biomedcentral.com/1471-2164/15/204
expression modulation over time (Figure 3). Cluster 1contains genes up-regulated after 12 h growth and down-regulated after 24 and 36 h, cluster 2 contains genes
up-regulated after 12 and 24 h and down-regulatedafter 36 h, cluster 3 contains genes up-regulated during thewhole time course, cluster 4 contains genes down-regulated
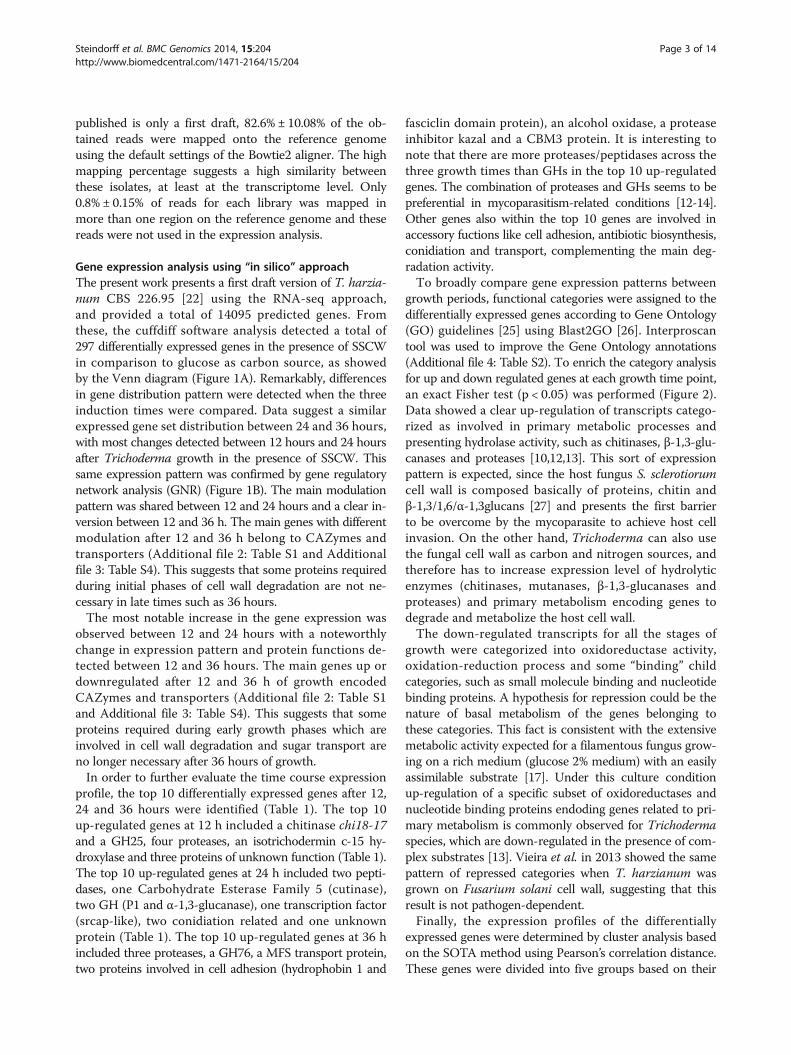
Figure 1 Comparison of RNA-Seq and real-time RT-PCR analyses. Histograms represent the relative expression levels (log2) (FPKM SSCW/FPKMglucose) as assessed by RNA-seq. Black dotted lines represent expression levels (log2) of the relative expression (SSCW compared to glucose for eachtime) as assessed by RT-qPCR analysis and reported as means and standard errors of three biological replicates for each treatment.
Steindorff et al. BMC Genomics 2014, 15:204 Page 4 of 14http://www.biomedcentral.com/1471-2164/15/204
after 12 and up-regulated after 24 and 36 h, and cluster5 contains genes down-regulated after 12 h and 24 hup-regulated after 36 h. Figure 3A summarizes the clus-tering analysis as a matrix in which clusters 1 and 2 arepresented as mirror images of clusters 4 and 5.The functional category distribution frequency for each
cluster was then calculated to identify differences in thedistribution of genes among the three Trichoderma growthperiods (Figure 3D). High percentages of hydrolases, pepti-dases and transporter activities were observed in clusters 1,2 and 3, which included most of the genes up-regulated forall growth times, mainly after 12 h. Clusters 4 and 5 arerepresented by the lowest number of genes; however theypresented a high diversity of functional categories andthe smallest percentage of the hydrolase activity category.
Cluster 4 is mainly represented by specific transporters,oxidoreductase and peroxidase activities, which are absentin the other clusters. Cluster 5 was less diverse, but con-tains a high percentage of peptidases and the appearanceof the lyase activity category. Clusters 4 and 5 containgenes induced after 24 and 36 hours. This pattern ofcategorization suggests a late increasing in the expressionlevels of genes encoding substrate transporters and otherCAZYmes such as lyases, instead of the classical cellwall hydrolases (chitinases, β-1,3-glucanases and prote-ases). Recently, we have described the production ofpolysaccharide lyases by T. harzianum during growth inthe presence of different phytopathogen cell walls using aproteomic approach, which is in agreement with the pre-sented data in this work (unpublished data). These results
Table 1 log2 Fold Change (FC) of the top 10 differentially expressed genes after 12, 24 and 36 h
JGI ID Putative function Top 10 12 h 24 h 36 h
86893 Aspartic protease
12 h up
11.4208 0.62564 −3.18003
91534 Acid proteinase protein 11.1366 0.04225 −7.00264
526221 Trypsin-like protease 10.8711 10.817 4.95966
154554 Alkaline serine protease 10.7861 0.062284 −8.35379
500888 Chitinase chi18-17 10.7537 −0.26535 −3.95398
521588 Isotrichodermin c-15 hydroxylase 10.6739 6.96978 −1.43531
100207 Hypothetical protein TRIVIDRAFT_62551 10.488 1.96719 1.64245
524327 N,O-diacetyl muramidase(GH25) 10.0928 6.71248 3.93055
43497 Hypothetical protein TRIVIDRAFT_130513 10.0535 6.23974 1.18343
476485 Uncharacterized serine-rich protein 10.0402 2.01486 −0.79684
518894 Peptidase tripeptidyl-peptidase
24 h up
−0.221944 16.3412 21.0713
485240 P1 β-1,6-glucanase 5.2448 11.7243 7.33577
11443 Transcriptional activator srcap-like protein 2.8351 11.5825 8.72928
502174 Conidiation-specific protein (con-13) protein 6.34144 11.5327 4.66579
11439 Hypothetical protein FOC4_g10000877 2.74235 11.4602 8.54921
96797 wsc domain-containing protein 6.99977 11.4475 6.05176
525334 α-1,3-glucanase 5.13055 11.4057 6.72423
501003 Peptidase family m28 1.1649 11.4017 10.9878
128023 Cutinase 0.32008 11.3122 7.58831
503197 Related to spore coat protein sp96 precursor 3.26222 11.1371 9.11624
518894 Peptidase tripeptidyl-peptidase
36 h up
−0.221944 16.3412 21.0713
491972 Fasciclin domain containing protein 0.17976 2.80756 11.4693
501003 Peptidase family m28 1.1649 11.4017 10.9878
96734 Glycoside hydrolase family 76 0.570337 9.93525 10.8109
511478 Proteinase inhibitor kazal −1.56863 10.0734 10.7725
533861 Hydrophobin 1 −0.624081 9.8541 10.5943
482878 Endonuclease/exonuclease/phosphatase family protein 0.314306 11.0782 10.372
78602 MFS carboxylic acid transport protein −0.582243 10.0355 10.2595
110777 Alkaline proteinase/serin endopeptidase 6.23477 11.0992 10.226
10644 Alcohol oxidase 6.7904 8.15543 10.0216
Steindorff et al. BMC Genomics 2014, 15:204 Page 5 of 14http://www.biomedcentral.com/1471-2164/15/204
suggest a potential role of these enzymes, especially thelyase families 7 and 8, in mycoparasitism by Trichodermaindependent of the host pathogen.
Validation of RNA-seq gene expressionTo validate the expression profile obtained by “in silico”analysis of RNA-Seq data, RT-qPCR was performed using20 genes randomly chosen among up or down-regulateddifferentially expressed genes. For a better understandingof expression kinetics, two additional growth times were
added to the analysis (6 and 18 hours). RT-qPCR expressionprofiles were in complete agreement with the RNA-Seqdata for 17 of the genes evaluated. The other three (Lyasefamily 7, β-glicosidase, cysteine-rich protein) showed dif-ferences at one or two growth times, but the modulationpattern of expression was maintained as observed throughthe “in silico” analysis (Figure 4).One of the primary goals of transcriptome sequencing is
to compare gene expression levels in different samples. Inthe present work, RNA-seq analysis was carried out for a
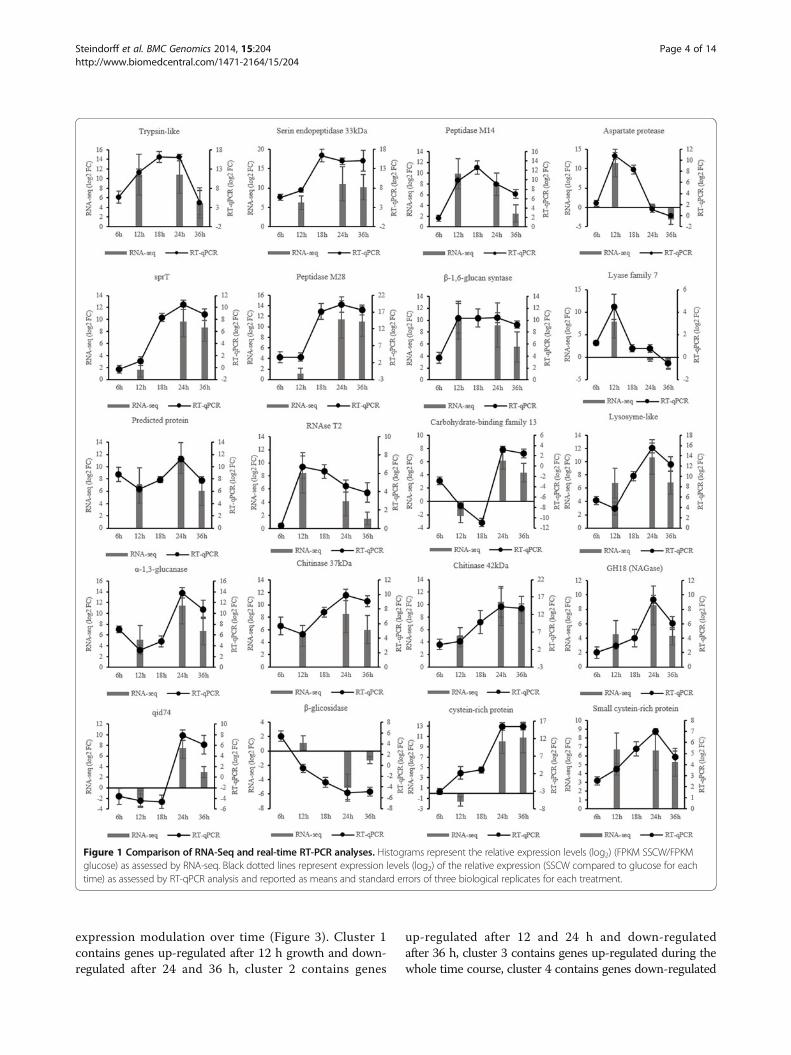
Figure 2 Pearson correlation between the RNA-seq and RT-qPCR data. All expression data were normalized in log2.— Represents the 95%confidence interval.
Figure 3 Venn diagram and network gene interaction of the 297 differentially expressed genes. (A) Venn diagram showing the distributionof differentially expressed genes detected by cuffdiff (p < 0.05) for T. harzianum grown on SSCW for 12, 24 and 36 hours when compared withglucose growth. (B) Network gene interaction showing differentially expressed genes up- and down-regulated (Fold Change > 2), for differenttimes (12, 24 and 36 hours) and growth conditions, totalizing 297 genes. Genes are represented as nodes (shown as small circles), and interactionsare represented as edges (shown as lines, i.e, red interactions up-regulated and down-regulated interactions green), that connect the nodes:592 interactions.
Steindorff et al. BMC Genomics 2014, 15:204 Page 6 of 14http://www.biomedcentral.com/1471-2164/15/204
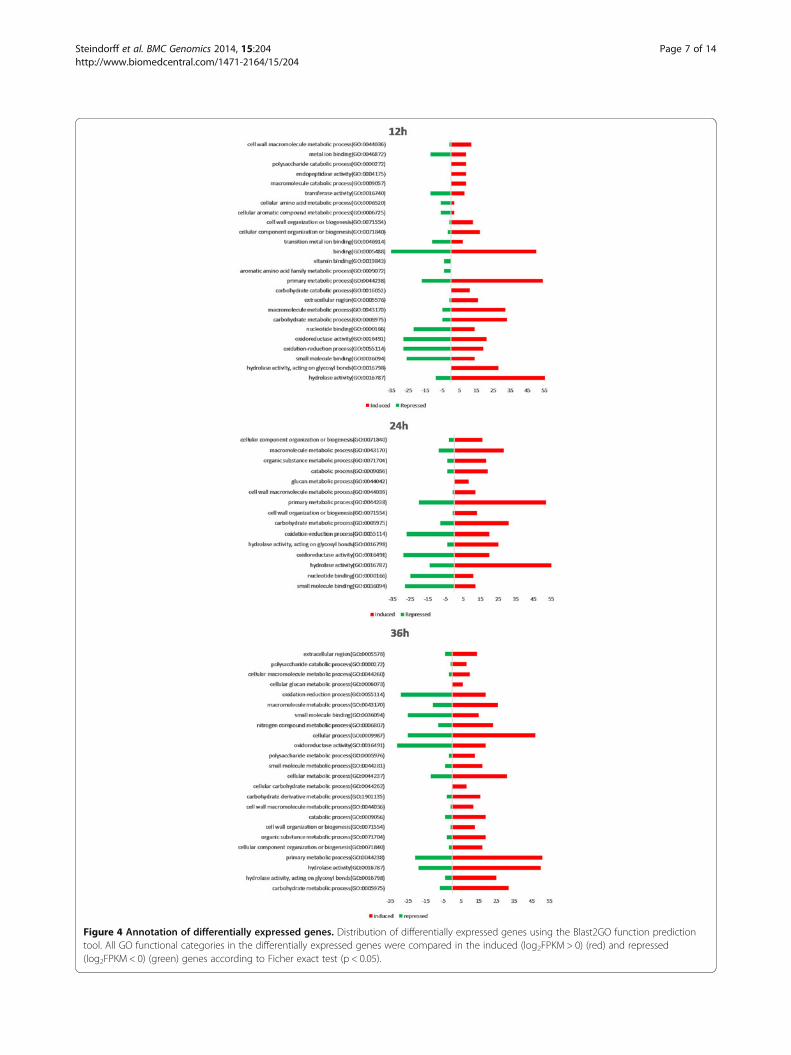
Figure 4 Annotation of differentially expressed genes. Distribution of differentially expressed genes using the Blast2GO function predictiontool. All GO functional categories in the differentially expressed genes were compared in the induced (log2FPKM > 0) (red) and repressed(log2FPKM < 0) (green) genes according to Ficher exact test (p < 0.05).
Steindorff et al. BMC Genomics 2014, 15:204 Page 7 of 14http://www.biomedcentral.com/1471-2164/15/204
biological sample of pooled mycelia from three differentgrowth cultures (biological replicates). Validation exper-iments using qPCR were subsequently carried out usingthe three biological replicates, and revealed a high Pearson’scorrelation coefficient between RNA-seq and qPCR expres-sion data (R2 = 0.8243) (Figure 5), this correlation enablesus to use this data in differential expression analysis.As a set of peptidases were up-regulated in the presence
of SSCW, two serine peptidases genes (tripsin-like peptid-ase and serine endopeptidase 33 kDa), one aspartyl proteasegene, one aminopeptidase gene (Peptidase M28) and onecarboxypeptidase gene (Peptidase M14) were chosen toperform qPCR experiments. The expression data over thefive growth times revealed an upward trend along the timecourse with the highest expression values at 18 hoursfollowed by a decrease after this time or 24 hours. Theirdiversity and uniform time course production indicatedthat these enzymes may form a synergistic proteolyticsystem related to mycoparasistim in T. harzianum. How-ever, their exact role in mycoparasitism has not beenclearly elucidated yet. The main accepted hypothesis pre-sents these enzymes as contributing to the breakdown ofthe fungal host cell wall, constituted by chitin and glucanpolymers embedded in, and covalently linked to, a proteinmatrix [28], and also as acting as proteolytic inactivatorsof pathogen enzymes which are typically involved in theplant infection process [29].
The Trichoderma species, T. reesei, T. atroviride, and T.virens, may have one of the largest sets of proteases amongfungi, of which the total number of predicted proteases are383 (4.2% of all predicted protein coding genes), 445(3.75%), and 479 (3.85%), respectively [30]. These authorsdescribed that the dominant groups are classified as aspar-tyl proteases, serine proteases, subtilisin-like proteases, anddipeptidyl and tripeptidyl peptidases. These enzymes havebeen described as performing a central role in the mycopar-asitic activity of Trichoderma species, as they have beenconsistently identified during interaction against differentphytopathogenic fungi using transcriptomic and proteomicapproaches [12-14]. Their diversity and uniform timecourse production provide evidence that these enzymesmay form a synergistic proteolytic system related to myco-parasitism in this Trichoderma species. Indeed, in ourstudy, a number of genes encoding a serine peptidase,anaspartyl protease, a subtilisin-like, a trypsin-like beyondmetallopeptidases (M28, M14) were also differentiallyexpressed in the presence of SSCW. These results stronglysuggest a role of these enzymes in T. harzianum mycopara-sitism against S. sclerotiorum, and support a putative com-mon action mechanism of mycoparasite fungi within theTrichoderma genus.About 29% of the differentially expressed genes encode
CAZy enzymes (Additional file 2: Table S1), suggesting acentral role for them in Trichoderma mycoparasitism,
Figure 5 Heatmap and cluster categorization of the 297 differentially expressed genes showed as log2 FPKM. (A) Gene expressioncluster centroid using SOTA analysis. (B) Heatmap of gene clusters (C) Clusters expression graphs of differentially expressed genes (D) GOfunctional categories of each cluster. For this categorization only the Molecular Function parent category is presented.
Steindorff et al. BMC Genomics 2014, 15:204 Page 8 of 14http://www.biomedcentral.com/1471-2164/15/204
probably during host fungal cell wall degradation. Thekinetics expression for CAZy category enzymes presentedas expression average showed a decrease trend along thegrowth timecourse, with a maximal expression at 24 h. Anexception were the enzymes categorized as auxiliary activ-ities and polysaccharide lyases (Additional file 5: Table S3).Glycosyl hydrolase family 18 and other enzymes which actmainly as fungal cell wall degrading enzymes (CWDE) havealso been described as presenting a central role in mycopar-asitism in Trichoderma atroviride [31]. Genes encoding thisfamily were also up-regulated in the present work based on“in silico” RNA-seq data analysis. As a consequence, eightgenes encoding three GH18 (Chitinase 37 kDa, Chitinase42 kDa and a not well characterized Chitinase), a α-1,3-glu-canase, a β-glicosidase, a lyzosyme-like, a polyssacharidelyase Family 7 and a carbohydrate binding Family 13 pro-tein were selected for expression validation by RT-qPCR.The expression levels of all CWDE genes followed thesame trend, except for the β-glucosidase gene that was re-pressed from 12 hours onwards. The common expressionprofile was an increase in transcripts after 12 hours until24 hours and a similar level or decrease of transcripts at36 hours. This kinetic suggests use of small sugars duringthe first growth time and an expression of CWDE after12 hours, indicating a role in degradation of the cell wallas carbon source to allow continued growth. KEGG path-way analysis (Additional file 6: Table S7) shows the mappedgenes in starch and sucrose metabolism. All genes mappedare in the final stages of the pathway, mainly in the forma-tion of small sugars such as D-glucose and D-xylose.Alginate lyases are enzymes classified as belonging to
the polyssacharide lyase Family 7 and are usually involvedin the deconstruction of complex polyssacharides, such aspolyguluronate and polymannuronate [32]. Their expres-sion observed in our study suggests a possible role inmycoparasitism, complementing the classical GH activitywhich is known to be involved. The carbohydrate bindingmodule Family 13 gene encodes a protein with a domainrelated to lectins, which, in Rhizoctonia solani, is impli-cated in fungal insecticidal activity [33]. Our expressiondata suggest that this gene is related to the lectins andmay play a role mediating the physical contact with thehost and elicitation of the signaling cascade comprisingG-proteins and MAPKs.Small secreted cysteine-rich proteins (SSCPs) have been
described as up-regulated in Trichoderma species duringmycoparasitism against phytopathogenic fungi [31]. Thepresent work is the first to report their probable role inmycoparasitism of T. harzianum against S. sclerotiorum.In this work we also indentified genes enconding two
predicted cistein-rich proteins and qid74, all up-regulatedin the presence of SSCW. These genes were highlyexpressed in the later induction time periods (24 and36 h) as showed by “in silico” analysis of RNA-seq and are
in agreement with the results of validation by RT-qPCR.Hydrophobins I and II were also identified by the “insilico” analysis of RNA-seq data, as shown in Additionalfile 4: Table S2 with a high expression at 24 and 36 hours.Small secreted cysteine-rich proteins (SSCPs) are one of
the largest groups of proteins secreted by Trichoderma.Hydrophobins, probably the most widely known SSCPs,are characterized by the presence of eight positionallyconserved cysteine residues of which four occur in dou-bles. They are found on the outer surfaces of cell walls ofhyphae and conidia, where they mediate interactions be-tween the fungus and the environment and also betweenthe fungus and host plant roots [34]. Class II hydrophobinsrepresent the predominant class described for Trichodermaspecies [35]. T. atroviride and T. virens have also class I-likehydrophobins, however they present differences in severalaspects when compared to other fungi and form a separateclade in phylogenetic analysis within the Ascomycetes [36].As well as other cysteine-rich proteins, T. harzianumthe qid74 gene encodes a cell wall protein which has animportant role in adherence to hydrophobic surfacesand cellular protection [34]. The gene RNaseT2, whichhas been described as a stress related protein and involvedin permeability and stability of the plasmatic membrane inSaccharomyces cerevisiae [37], was also up-regulated after12 hours growth of T.harzianum on SSCW, decreasingover time.Among the 297 differentially expressed genes, 30 encode
transporter proteins (Additional file 3: Table S4). MFS(Major Facilitator Superfamily) permeases are the mostabundant proteins among transporter proteins over thethree growth times. These proteins enable the transport ofessential nutrients and ions, in addition to the excretion ofend products of metabolism and cell-environment com-munication [38]. Their expression levels vary according tothe time of growth and culture growth condition (pres-ence or absence of SSCW and glucose).In summary, our results demonstrated a time course
dependent expression of T. harzianum genes duringgrowth on media with S. sclerotiorum cell wall as solecarbon and nitrogen source. The majority of the genesdescribed in this work have also been reported in theliterature during growth of Trichoderma spp. on cell-wallof phytopathogenic fungi [10,12,13], as well as duringconfrontation against R. solani [31].
RT-qPCR for dual culturesThe direct confrontation assay is a powerful tool forstudyng mycoparasitism by Trichoderma [12,13,30] underlaboratory conditions. To validate RNA-seq data using agrowth condition which closely mimics the interactionTrichoderma/host fungus, RT-qPCR was also performedusing total RNA from dual cultures of T. harzianum andS. sclerotiorum over three different interaction stages:
Steindorff et al. BMC Genomics 2014, 15:204 Page 9 of 14http://www.biomedcentral.com/1471-2164/15/204
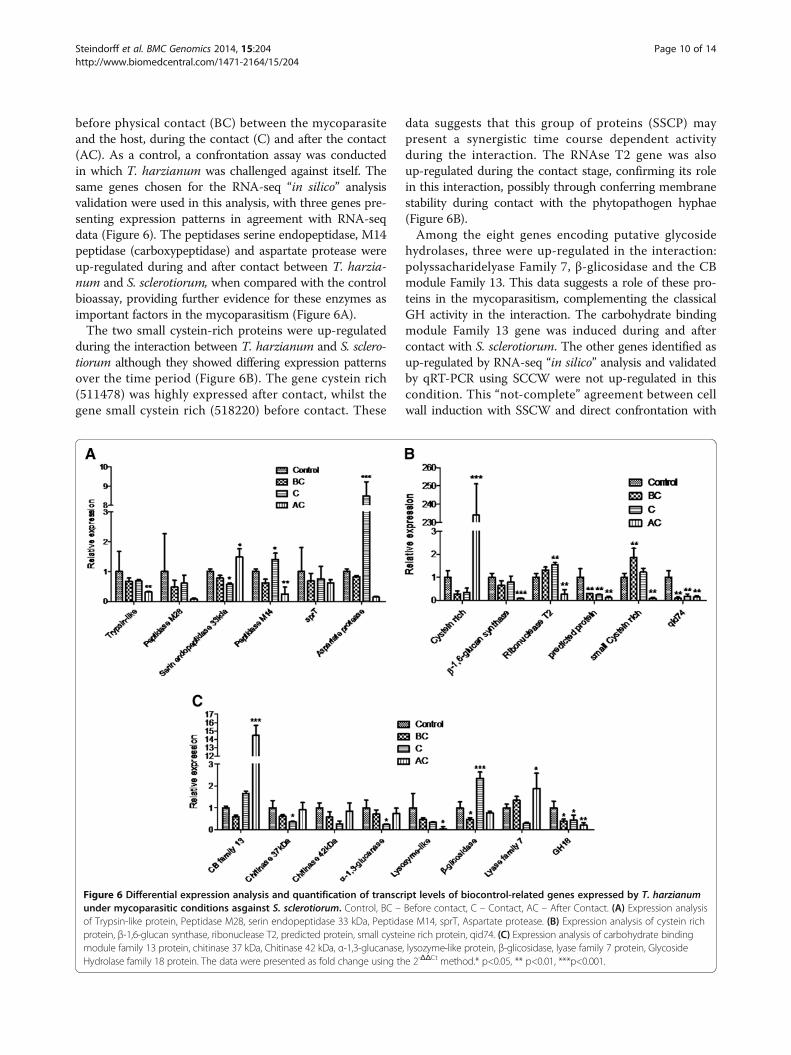
before physical contact (BC) between the mycoparasiteand the host, during the contact (C) and after the contact(AC). As a control, a confrontation assay was conductedin which T. harzianum was challenged against itself. Thesame genes chosen for the RNA-seq “in silico” analysisvalidation were used in this analysis, with three genes pre-senting expression patterns in agreement with RNA-seqdata (Figure 6). The peptidases serine endopeptidase, M14peptidase (carboxypeptidase) and aspartate protease wereup-regulated during and after contact between T. harzia-num and S. sclerotiorum, when compared with the controlbioassay, providing further evidence for these enzymes asimportant factors in the mycoparasitism (Figure 6A).The two small cystein-rich proteins were up-regulated
during the interaction between T. harzianum and S. sclero-tiorum although they showed differing expression patternsover the time period (Figure 6B). The gene cystein rich(511478) was highly expressed after contact, whilst thegene small cystein rich (518220) before contact. These
data suggests that this group of proteins (SSCP) maypresent a synergistic time course dependent activityduring the interaction. The RNAse T2 gene was alsoup-regulated during the contact stage, confirming its rolein this interaction, possibly through conferring membranestability during contact with the phytopathogen hyphae(Figure 6B).Among the eight genes encoding putative glycoside
hydrolases, three were up-regulated in the interaction:polyssacharidelyase Family 7, β-glicosidase and the CBmodule Family 13. This data suggests a role of these pro-teins in the mycoparasitism, complementing the classicalGH activity in the interaction. The carbohydrate bindingmodule Family 13 gene was induced during and aftercontact with S. sclerotiorum. The other genes identified asup-regulated by RNA-seq “in silico” analysis and validatedby qRT-PCR using SCCW were not up-regulated in thiscondition. This “not-complete” agreement between cellwall induction with SSCW and direct confrontation with
Figure 6 Differential expression analysis and quantification of transcript levels of biocontrol-related genes expressed by T. harzianumunder mycoparasitic conditions asgainst S. sclerotiorum. Control, BC – Before contact, C – Contact, AC – After Contact. (A) Expression analysisof Trypsin-like protein, Peptidase M28, serin endopeptidase 33 kDa, Peptidase M14, sprT, Aspartate protease. (B) Expression analysis of cystein richprotein, β-1,6-glucan synthase, ribonuclease T2, predicted protein, small cysteine rich protein, qid74. (C) Expression analysis of carbohydrate bindingmodule family 13 protein, chitinase 37 kDa, Chitinase 42 kDa, α-1,3-glucanase, lysozyme-like protein, β-glicosidase, lyase family 7 protein, GlycosideHydrolase family 18 protein. The data were presented as fold change using the 2-ΔΔCt method.* p<0.05, ** p<0.01, ***p<0.001.
Steindorff et al. BMC Genomics 2014, 15:204 Page 10 of 14http://www.biomedcentral.com/1471-2164/15/204
S. sclerotiorum is expected due to differences in growthconditions for T. harzianum. Investigation of mycoparasi-tisn using inactivated cell walls is a useful approach toevaluate the broad arsenal of induced genes in Tricho-derma spp. and to identify candidate mycoparasitism re-lated genes that can be further evaluated for expressionduring mycoparasitism through dual culture assays. Thegenes which were observed to be up-regulated in bothinteraction bioassays are certainly promising candidatesfor future biotechnological applications as well as furtherdetailed investigations to unveil their precise function inT. harzianum mycoparasistism.
ConclusionsThe RNA-seq data presented will not only facilitate im-provement of the annotation of gene models in the draftT. harzianum genome, but also provide important infor-mation regarding the transcriptome during growth onSSCW and during “in vivo” interactions with S. sclero-tiorum. Our data represent an important step towards un-derstanding the mycoparasitic process of T. harzianumduring its interaction with S. sclerotiorum. Further studiesfor functional characterization of candidate genes reportedhere are necessary in order to better define the exact path-ways involved in mycoparasitism in T. harzianum.
MethodsOrganism culture conditionsT. harzianum TR274 was isolated from soil samplesfrom the Brazilian Cerrado region and identified to specieslevel based upon ribosomal RNA ITS 1 and 2 sequenceidentities (Genbank number KC993076). This strain is de-posited in the ICB Enzymology Group culture collectionat the Universidade Federal de Goias. A strain of thephytopathogenic fungus S. sclerotiorum belonging to theEMBRAPA-CNPAF culture collection was originally iso-lated from Phaseolus vulgaris. These fungi were grown onMYG medium (w/v: 0.5% malt extract, 0.25% yeast extract,1% glucose and 2% agar) for 2 days at 28°C. T. harzianumspores were collected from cultures by washing with sterilewater and centrifugation at 2000 rpm. Following tworounds of washes, spore suspensions at a concentrationof 107 spores mL−1 were used to inoculate flasks contain-ing 50 mL of TLE medium [14]. Cultures were incubatedat 28°C with constant shaking at 120 rpm. After 24 hoursgrowth, mycelia were collected and transferred to flaskscontaining 50 mL of minimal medium (TM) (w/v: 0.2%KH2PO4, 1.4% (NH4)2SO4, 0.03% MgSO4.7H2O) sup-plemented with 2% (w/v) of glucose or 0.5% (w/v) ofinactivated SSCW (previously autoclaved at 120°C for20 min). Cultures were incubated with constant shaking at120 rpm at 28°C. After 6, 12, 18, 24 and 36 hours ofgrowth, mycelium was harvested and immediately flashfrozen in liquid nitrogen and stored at -80°C until RNA
isolation. This experiment was carried out in triplicate foreach growth period, with mycelia subsequently pooled toconstitute composed samples.
RNA isolation, cDNA library preparation and sequencingRNA was extracted from macerated frozen mycelia usingTRI-Reagent (Sigma-Aldrich), according to manufacturer’sinstructions. Integrity and quantity of isolated RNA wereassessed using a RNA Pico chip on an Agilent Bioanalyzer2100 (Agilent Technologies) (Additional file 7: Table S5).The RNA samples were stored at -80°C until libraryconstruction for sequencing and RT-qPCR. Normalizedstarting quantities of total RNA extracted from myceliagrown for 12, 24 and 36 h under the two different condi-tions (supplemented with glucose or SSCW), were thenused to prepare six separate barcoded RNA-seq librariesusing the TruSeq™ RNA sample preparation kit (Illumina,CA, USA). Three biological replicates were pooled in prep-aration of each of the six final samples. All library prepar-ation and sequencing was carried out by Eurofins MWGOperon (Al, USA). Barcoded libraries were preparedaccording to the manufacturer’s instructions, then se-quenced on a single lane on an Illumina HiSeq2000sequencer, to generate 100 bp paired-end reads.
Mapping of sequenced reads and assessment ofgene expressionFastQCfiles were used to visualize the libraries qualitybefore and after trimming. For quality trimming and se-quence filtering, the software Trimmomatic (version 0.30)[39] was employed to remove sequencing adapters, k-mers,and bases with a Phred quality score lower than 20 fromthe read ends. All reads shorter than 25 nucleotideswere then discarded. Filtered reads were mapped onto theTrichoderma harzianum v1.0 genome sequence (http://gen-ome.jgi.doe.gov/Triha1/Triha1.home.html) using TopHat2.0.8 release with default settings [40]. Gene expressionvalues were determined using Cufflinks 2.1.1 release [41],and the FPKM (Fragments per kilobase mapped) valueswere calculated for each transcript. The gene expressionlevels in the T. harzianum genome were obtained usingthe Cuffdiff software within Cufflinks. Fungal transcriptlevels were calculated using uniquely mapped reads onto thegenome. The expression profiles of differentially expressedgenes were determined by SOTA (Self Organizing TreeAlgorithm), cluster analysis was carried out using theMeV 4.9 software, and gene ontology assignment con-ducted according to Gene Ontology (GO) guidelines [25]using the Blast2GO platform [26].Each T. harzianum sample grown in SSCW had a cor-
responding control sample of culture growth on glucose,enabling normalization using the relation FPKM SSCW/FPKM glucose. Positive values were considered as up-regulated transcripts in the presence of cell wall and
Steindorff et al. BMC Genomics 2014, 15:204 Page 11 of 14http://www.biomedcentral.com/1471-2164/15/204
negative values were considered as down-regulated tran-scripts. Expression level differences were judged to besignificant and the expression level estimate status ac-ceptable when a gene was identified as differentiallyexpressed with an FDR of the Benjamini-Hochberg mul-tiple tests of 5% (P < 0.05).
Gene regulatory network of T. harzianumA regulatory network was generated using Cytoscape 3.0.2software and a table of data containing the differentiallyexpressed genes detected using the cuffdiff program,presenting Fold Change > 2, the interaction type (up- ordown-regulated) and the target gene (i.e., the Protein IDof each gene affected). This analysis was carried out inorder to reconstruct a T. harzianum time course networkrepresentation for all 297 identified genes (Figure 1B) [42].
RT-qPCRTwenty genes were randomly selected between the differ-entially expressed genes in silico for the expression analysisby RT-qPCR. Real-time qPCR (Additional file 8: Table S6)primers were designed using the PerlPrimer v1.1.20 soft-ware. Total RNA from the above described preparationswas digested with DNase I (Invitrogen) and a total of 5 μgfrom each pooled sample was reverse transcribed intocDNA using the Maxima™ First Strand cDNA synthesiskit for RT-qPCR in a final volume of 20 μL (Fermentas).The synthesized cDNA was diluted with 80 μL of waterand used as a template for real-time PCR reactions usingthe instrument iQ5 real-time PCR system (Bio-Rad). Eachreaction (20 μL) contained 10 μL of MAXIMA® SYBR-green PCR Master Mix (Fermentas), forward and reverseprimers (500 nM each), cDNA template, and nuclease freewater. PCR cycling conditions were: 10 min at 95°C(1 cycle), 15 s at 95°C followed by 1 min at 60°C (40 cycles),and a melting curve ramping from 60°C to 95°C with anincreasing temperature of 0.2°C for 10 s (1 cycle) andcontinuous data collection to test for primer dimers andnonspecific amplification. Determination of the PCR effi-ciency was performed using triplicate reactions from a dilu-tion series of cDNA (1, 0.1, 10−2, and 10−3). Amplificationefficiency was then calculated from the given slopes inthe IQ5 Optical System Software v2.0 (Additional file 8:Table S6). The α-tubulin and β-actin transcript wereused as internal references to normalize the amount oftotal RNA present in each reaction [12]. Gene expressionlevelswere calculated from the threshold cycle accordingto the 2-ΔΔCT method [43]. All samples were analyzed inat least two independent experiments with three technicalreplicates in each run.
Analysis of expression of biocontrol-related genesRT-qPCR was used to evaluate T. harzianum gene expres-sion during confrontation against the fungal pathogen S.
sclerotiorum. Confrontation bioassays were conducted asdescribed in Steindorff et al. [12]. T. harzianum TR274and S. sclerotiorum circular plaques of 5 mm diameter werecut from 7-day-old cultures on MYG Plates. T. harzianumTR274 plaques were inoculated onto plates containing solidminimal medium supplemented with 0.2% of glucoseand overlaid with cellophane at a distance of 7 cm fromS. sclerotiorum plaque mycelia. A control confrontationassay was conducted following the same setup describedabove, except that T. harzianum was challenged againstitself. Confrontation plates were incubated in the dark at28°C and the mycelia were harvested at different growthstages: prior to fungal contact, at contact, and after con-tact (overlapping mycelia). The confrontation assays wereconducted in triplicate with RNA extracted for all treat-ments and replicates. The RNA samples were used forRT-qPCR reactions as described above, with results com-pared by ANOVA coupled with the Dunnet’s test (α = 5%)using GraphPad Prism 5 software, to allow analysis ofdifferences between confrontation assay gene expressionpatterns.
Availability of supporting dataSequences have been deposited at the Sequence ReadArchive (SRA) of the National Center for Biotechnologyunder BioProject number PRJNA216008. Raw sequencereads can be found in http://www.ncbi.nlm.nih.gov/sra/?term=PRJNA216008.
Additional files
Additional file 1: Table S8. KEGG pathwayanalysisshownenzymesmappedin StarchandSucroseMetabolism. Arrowsin red, greenandblue(12, 24 and36h respectively) show theup-regulatedconditionofallgenes.
Additional file 2: Table S1. Primers used in qPCR experiments.
Additional file 3: Table S4. CAZy enzymes differentially expressed after12, 24 and 36 h.
Additional file 4: Table S2. RNA-Seq sequencing and read mapping.
Additional file 5: Table S3. Functional annotation of the 297differentially expressed genes.
Additional file 6: Table S7. log2 Fold change expression of CAZyclasses. The data shown is the average and standard deviation on eachtime condition.
Additional file 7: Table S5. Transporters differentially expressed in 12,24 and 36 hours.
Additional file 8: Table S6. Bioanalyser profile of the six samples usedto construct RNA-seq libraries.
Competing interestsThe authors declare that they have no competing interests.
Authors’ contributionsASS, GJP, ASGC, RNGM, EFN performed the experimental design, RNAisolation, quality control and designed the bioinformatics analysis. ASS andMHSR performed the RT-PCR analyses and evaluation of the data. ASSdrafted the manuscript. EFN and RNGM were responsible for revision of themanuscript. All authors approved the final version of the paper.
Steindorff et al. BMC Genomics 2014, 15:204 Page 12 of 14http://www.biomedcentral.com/1471-2164/15/204
AcknowledgementsThese sequence data (reference genome) were produced by the USDepartment of Energy Joint Genome Institute http://www.jgi.doe.gov/ incollaboration with the user community. The current study was funded bythe National Council for Scientific and Technological Development (CNPq)(Process 559680/2009-0). EFN and CJU were supported by a biotechnologyresearch grant (FAPEGO and CNPq). ASS and MHSR were supported by CNPqPhD scholarships.
Author details1Departamento de Biologia Celular, Universidade de Brasília, CampusUniversitário Darcy Ribeiro, Instituto de Ciências Biológicas, CEP 70.910-900Brasília, DF, Brazil. 2EMBRAPA Recursos Genéticos e Biotecnologia, ParqueEstação Biológica, CP 02372, CEP 70.770-900 Brasília, DF, Brazil. 3Escola deAgronomia e Engenharia de Alimentos, Universidade Federal de Goiás,Campus Samambaia, P.O. Box 131CEP 74001-970 Goiânia, GO, Brasil.4Departamento de Bioquímica e Biologia Molecular, Universidade Federal deGoiás, Campus Samambaia, Instituto de Ciências Biológicas, CEP 74.090-900Goiânia, GO, Brazil.
Received: 28 November 2013 Accepted: 6 March 2014Published: 18 March 2014
References1. Boland GJ, Hall R: Index of plant hosts of Sclerotinia sclerotiorum. Can J Pl
Pathol 1994, 16:93–108.2. Attanayake RN, Carter PA, Jiang D, Del Río-Mendoza L, Chen W: Sclerotinia
sclerotiorum populations infecting canola from China and the UnitedStates are genetically and phenotypically distinct. Phytopathology 2013,103(7):750–761.
3. Sun P, Yang XB: Light, temperature, and moisture effects on Apotheciumproduction of Sclerotinia sclerotiorum. Plant Dis 2000, 84:1287–1293.
4. Lopes FA, Steindorff AS, Geraldine AM, Brandão RS, Monteiro VN, Lobo M Jr,Coelho AS, Ulhoa CJ, Silva RN: Biochemical and metabolic profiles ofTrichoderma strains isolated from common bean crops in the BrazilianCerrado, and potential antagonism against Sclerotinia sclerotiorum.Fungal Biol 2012, 116(7):815–824.
5. Qualhato TF, Lopes FA, Steindorff AS, Brandão RS, Jesuino RS, Ulhoa CJ:Mycoparasitism studies of Trichoderma species against threephytopathogenic fungi: evaluation of antagonism and hydrolyticenzyme production. Biotechnol Lett 2013, 35(9):1461–1468.
6. Geraldine AM, Lopes FAC, Carvalho DDC, Barbosa ET, Rodrigues AR, BrandãoRS, Ulhoa CJ, Lobo-Junior M: Cell wall-degrading enzymes and parasitismof sclerotia are key factors on field biocontrol of white mold byTrichoderma spp. Biol Control 2013, 67(3):308–316.
7. Lorito M, Woo SL, Harman GE, Monte E: Translational research onTrichoderma: from Omics to the field. Ann Rev Phytopathol 2010,48:395–417.
8. Hermosa R, Viterbo A, Chet I, Monte E: Plant-beneficial effects ofTrichoderma and of its genes. Microbiology 2012, 158:17–25.
9. Druzhinina IS, Seidl-Seiboth V, Herrera-Estrella A, Horwitz BA, Kenerley CM,Monte E, Mukherjee PK, Zeilinger S, Grigoriev IV, Kubicek CP: Trichoderma:the genomics of opportunistic success. Nat Rev Microbiol 2011,16;9(10):749–759.
10. Vizcaíno JA, Redondo J, Suarez MB, Cardoza RE, Hermosa R, Gonzales FJ, ReyM, Monte E: Generation, annotation and analysis of ESTs from fourdifferent Trichoderma strains grown under conditions related tobiocontrol. Appl Microbiol Biotechnol 2007, 75:853–862.
11. Seidl V, Song L, Lindquist E, Gruber S, Koptchinskiy A, Zeilinger S, SchmollM, Martínez M, Sun J, Grigoriev I, Herrera-Estrella A, Baker SE, Kubicek CP:Transcriptomic response of the mycoparasitic fungus Trichodermaatrovirideto the presence of a fungal prey. BMC Genomics 2009, 10:567.
12. Steindorff AS, Silva RN, Coelho ASG, Noronha EF, Ulhoa CJ: Trichodermaharzianum expressed sequence tags for identification of genes withputative roles in mycoparasitism against F. solani. Biol Control 2012,61(2):134–140.
13. Vieira PM, Coelho AS, Steindorff AS, De Siqueira SJ, Silva Rdo N, Ulhoa CJ:Identification of differentially expressed genes from Trichodermaharzianum during growth on cell wall of Fusarium solani as a tool forbiotechnological application. BMC Genomics 2013, 14:177.
14. Monteiro VN, Silva RN, Steindorff AS, Costa FT, Noronha EF, Ricart CAO,Sousa MV, Vainstein MH, Ulhoa CJ: New insights in Trichoderma harzianumantagonism of fungal plant pathogens by secreted protein analysis. CurrMicrob 2010, 61:298–305.
15. Rubio MB, Domínguez S, Monte E, Hermosa R: Comparative study ofTrichoderma gene expression in interactions with tomato plants usinghigh-density oligonucleotide microarrays. Microbiology 2012,158(Pt 1):119–128.
16. Reithner B, Ibarra-Laclette E, Mach RL, Herrera-Estrella A: Identification ofmycoparasitism-related genes in Trichoderma atroviride. Appl EnvironMicrobiol 2011, 77(13):4361–4370.
17. Samolski I, de Luis A, Vizcaíno JA, Monte E, Suárez MB: Gene expressionanalysis of the biocontrol fungus Trichodermaharzianum in the presenceof tomato plants, chitin, or glucose using a high-density oligonucleotidemicroarray. BMC Microbiol 2009, 9:217.
18. Wang WC, Lin FM, Chang WC, Lin KY, Huang HD, Lin NS: miRExpress:analyzing high-throughput sequencing data for profiling microRNAexpression. BMC Bioinform 2009, 10:328.
19. Marioni JC, Mason CE, Mane SM, Stephens M, Gilad Y: RNA-seq: anassessment of technical reproducibility and comparison with geneexpression arrays. Genome Res 2008, 18(9):1509–1517.
20. Ozsolak F, Milos PM: RNA sequencing: advances, challenges andopportunities. Nat Rev Genet 2011, 12(2):87–98.
21. Martin JA, Wang Z: Next-generation transcriptome assembly. Nat RevGenet 2011, 12(10):671–682.
22. Grigoriev IV, Nordberg H, Shabalov I, Aerts A, Cantor M, Goodstein D, Kuo A,Minovitsky S, Nikitin R, Ohm RA, Otillar R, Poliakov A, Ratnere I, Riley R,Smirnova T, Rokhsar D, Dubchak I: The genome portal of the Departmentof energy joint genome Institute. Nucleic Acids Res 2012, 40:26–32.
23. Morin RD, O’Connor MD, Griffith M, Kuchenbauer F, Delaney A, Prabhu AL,Zhao Y, McDonald H, Zeng T, Hirst M, Eaves CJ, Marra MA: Application ofmassively parallel sequencing to microRNA profiling and discovery inhuman embryonic stem cells. Genome Res 2008, 18:610–621.
24. Druzhinina IS, Kubicek CP, Komoń-Zelazowska M, Mulaw TB, Bissett J: TheTrichoderma harzianum demon: complex speciation history resulting incoexistence of hypothetical biological species, recent agamospecies andnumerous relict lineages. BMC Evol Biol 2010, 10:94.
25. Ashburner M, Ball CA, Blake JA, Botstein D, Butler H, Cherry JM, Davis AP,Dolinski K, Dwight SS, Eppig JT, Harris MA, Hill DP, Issel-Tarver L, Kasarskis A,Lewis S, Matese JC, Richardson JE, Ringwald M, Rubin GM, Sherlock G: Geneontology: tool for the unification of biology: the gene ontology consor-tium. Nat Genet 2000, 25(1):25–29.
26. Conesa A, Götz S, Garcia-Gomez JM, Terol J, Talon M, Robles M: Blast2GO: auniversal tool for annotation, visualization and analysis in functionalgenomics research. Bioinformatics 2005, 21:3674–3676.
27. Free SJ: Fungal cell wall organization and biosynthesis. Adv Gene 2013,81:33–82.
28. Kapteyn JC, Montijn RC, Vink E, de la Cruz J, Llobell A, Douwes JE, Shimoi H,Lipke PN, Klis FM: Retention of Saccharomyces cerevisiae cell wallproteins through a phosphodiester-linked beta-1,3-/beta-1,6-glucan het-eropolymer. Glycobiology 1996, 6(3):337–345.
29. Elad Y, Kapat A: The role of Trichoderma harzianum protease in thebiocontrol of Botrytis cinerea. Eur J Plant Pathol 1999, 105:177–189.
30. Druzhinina IS, Shelest E, Kubicek CP: Novel traits of Trichoderma predictedthrough the analysis of its secretome. FEMS Microbiol Lett 2012, 337(1):1–9.
31. Atanasova L, Crom SL, Gruber S, Coulpier F, Seidl-Seiboth V, Kubicek CP,Druzhinina IS: Comparative transcriptomics reveals different strategies ofTrichoderma mycoparasitism. BMC Genomics 2013, 14:121.
32. Wang Y, Guo EW, Yu WG, Han F: Purification and characterization of anew alginate lyase from a marine bacterium Vibrio sp. Biotech Let 2013,35(5):703–708.
33. Skamnaki VT, Peumans WJ, Kantsadi AL, Cubeta MA, Plas K, Pakala S,Zographos SE, Smagghe G, Nierman WC, Van Damme EJ, Leonidas DD:Structural analysis of the Rhizoctonia solani agglutinin reveals a domain-swapping dimeric assembly. FEBS J 2013, 280(8):1750–1763.
34. Samolski I, Rinco AM, Pinzo LM, Viterbo A, Monte E: The qid74 gene fromTrichoderma harzianum has a role in root architecture and plantbiofertilization. Microbiology 2012, 158:129–138.
35. Kubicek CP, Baker S, Gamauf C, Kenerley CM, Druzhinina IS: Purifyingselection and birth-and-death evolution in the class II hydrophobin genefamilies of the ascomycete Trichoderma/Hypocrea. BMC Evol Biol 2008, 8:4.
Steindorff et al. BMC Genomics 2014, 15:204 Page 13 of 14http://www.biomedcentral.com/1471-2164/15/204
36. Seidl-Seiboth V, Gruber S, Sezerman U, Schwecke T, Albayrak A, Neuhof T,Von Öhren H, Baker SE, Kubicek CP: Novel hydrophobins from Trichodermadefine a new hydrophobin subclass: protein properties, evolution,regulation, and processing. J Mol Evol 2011, 72:339–351.
37. MacIntosh GC, Bariola PA, Newbigin E, Green PJ: Characterization of Rny1,the saccharomyces cerevisiae member of the T2 RNase family of RNases:unexpected functions for ancient enzymes? Proc Natl Acad Sci USA 2001,98(3):1018–1023.
38. Pao SS, Paulsen IT, Saier MH: Major facilitator superfamily. Microbiol MolBiol R 1998, 62:1–34.
39. Lohse M, Bolger AM, Nagel A, Fernie AR, Lunn JE, Stitt M, Usadel B: RobiNA:a user-friendly, integrated software solution for RNA-Seq-basedtranscriptomics. Nucleic Acids Res 2012, 40:W622–W627.
40. Kim D, Pertea G, Trapnell C, Pimentel H, Kelley R, Salzberg SL: TopHat2:accurate alignment of transcriptomes in the presence of insertions,deletions and gene fusions. Genome Biol 2013, 14:R36.
41. Shannon P, Markiel A, Ozier O, Baliga NS, Wang JT, Ramage D, Amin N,Schwikowski B, Ideker T: Cytoscape: a software environment forintegrated models of biomolecular interaction networks. Genome Res2003, 13:2498–2504.
42. Trapnell C, Williams BA, Pertea G, Mortazavi A, Kwan G, van Baren MJ,Salzberg SL, Wold BJ, Pachter L: Transcript assembly and quantification byRNA-Seq reveals unannotated transcripts and isoform switching duringcell differentiation. Nat Biotechnol 2010, 28:511–515.
43. Livak KJ, Schmittgen TD: Analysis of relative gene expression data usingreal-time quantitative PCR and the 2-ΔΔCt method. Methods 2001,25(4):402–408.
doi:10.1186/1471-2164-15-204Cite this article as: Steindorff et al.: Identification of mycoparasitism-related genes against the phytopathogen Sclerotinia sclerotiorum throughtranscriptome and expression profile analysis in Trichoderma harzianum. BMCGenomics 2014 15:204.
Submit your next manuscript to BioMed Centraland take full advantage of:
• Convenient online submission
• Thorough peer review
• No space constraints or color figure charges
• Immediate publication on acceptance
• Inclusion in PubMed, CAS, Scopus and Google Scholar
• Research which is freely available for redistribution
Submit your manuscript at www.biomedcentral.com/submit
Steindorff et al. BMC Genomics 2014, 15:204 Page 14 of 14http://www.biomedcentral.com/1471-2164/15/204