Embed Size (px)
Citation preview
1
1
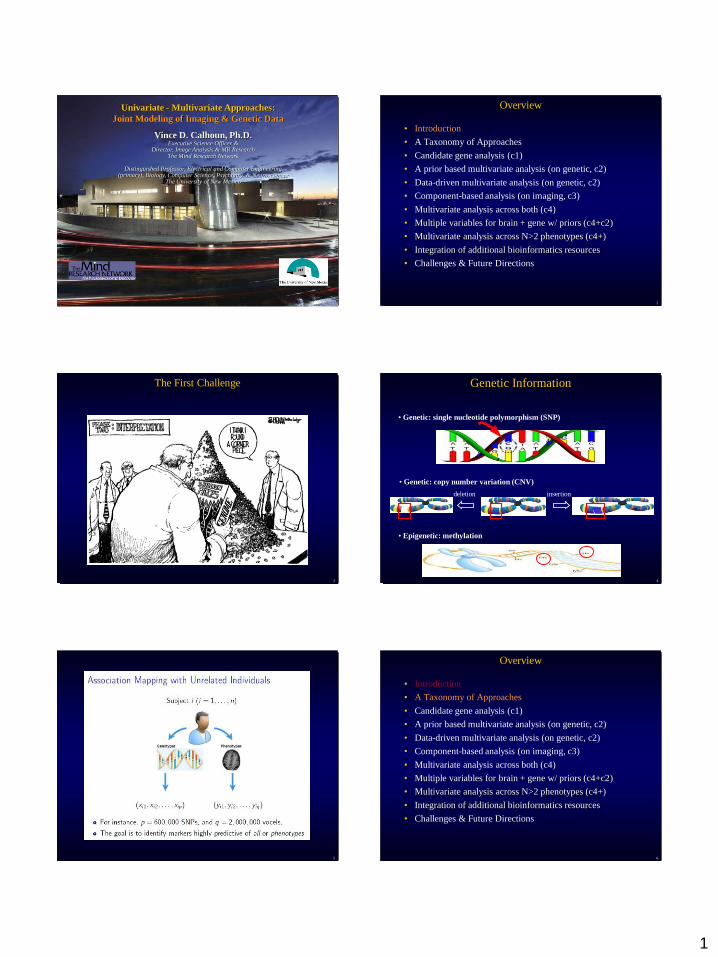
Univariate - Multivariate Approaches:
Joint Modeling of Imaging & Genetic Data
Vince D. Calhoun, Ph.D.Executive Science Officer &
Director, Image Analysis & MR ResearchThe Mind Research Network
Distinguished Professor, Electrical and Computer Engineering (primary), Biology, Computer Science, Psychiatry, & Neurosciences
The University of New Mexico
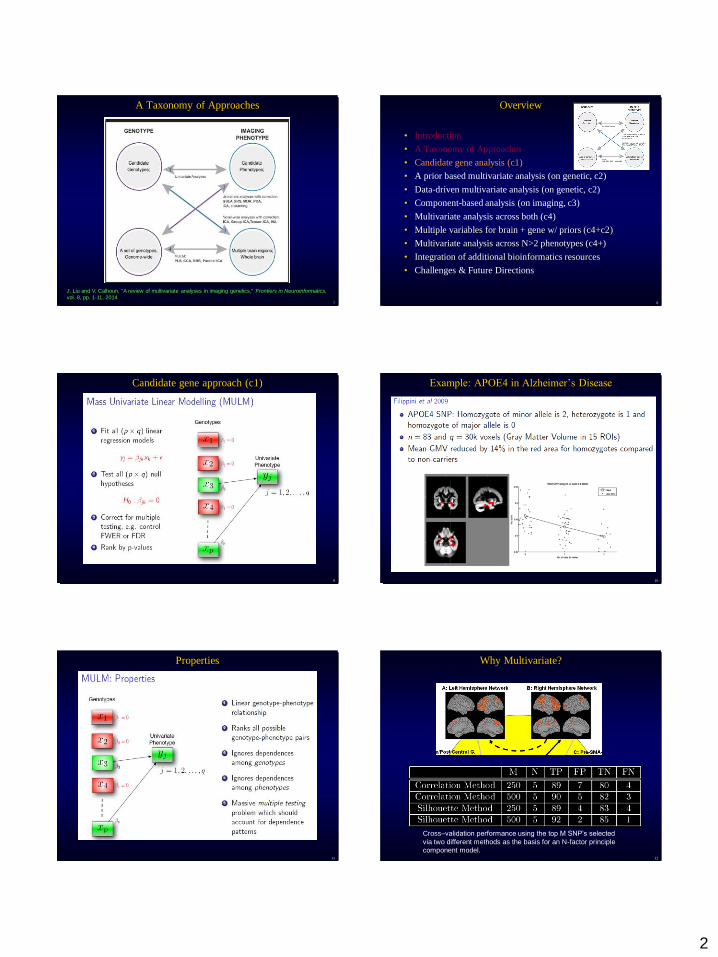
Overview
• Introduction
• A Taxonomy of Approaches
• Candidate gene analysis (c1)
• A prior based multivariate analysis (on genetic, c2)
• Data-driven multivariate analysis (on genetic, c2)
• Component-based analysis (on imaging, c3)
• Multivariate analysis across both (c4)
• Multiple variables for brain + gene w/ priors (c4+c2)
• Multivariate analysis across N>2 phenotypes (c4+)
• Integration of additional bioinformatics resources
• Challenges & Future Directions
2
The First Challenge
3 4
Genetic Information
insertiondeletion
• Genetic: single nucleotide polymorphism (SNP)
• Genetic: copy number variation (CNV)
• Epigenetic: methylation
5
Overview
• Introduction
• A Taxonomy of Approaches
• Candidate gene analysis (c1)
• A prior based multivariate analysis (on genetic, c2)
• Data-driven multivariate analysis (on genetic, c2)
• Component-based analysis (on imaging, c3)
• Multivariate analysis across both (c4)
• Multiple variables for brain + gene w/ priors (c4+c2)
• Multivariate analysis across N>2 phenotypes (c4+)
• Integration of additional bioinformatics resources
• Challenges & Future Directions
6
2
A Taxonomy of Approaches
7
J. Liu and V. Calhoun, "A review of multivariate analyses in imaging genetics," Frontiers in Neuroinformatics,
vol. 8, pp. 1-11, 2014
Overview
• Introduction
• A Taxonomy of Approaches
• Candidate gene analysis (c1)
• A prior based multivariate analysis (on genetic, c2)
• Data-driven multivariate analysis (on genetic, c2)
• Component-based analysis (on imaging, c3)
• Multivariate analysis across both (c4)
• Multiple variables for brain + gene w/ priors (c4+c2)
• Multivariate analysis across N>2 phenotypes (c4+)
• Integration of additional bioinformatics resources
• Challenges & Future Directions
8
Candidate gene approach (c1)
9
Example: APOE4 in Alzheimer’s Disease
10
Properties
11 12
Why Multivariate?
Cross–validation performance using the top M SNP’s selected
via two different methods as the basis for an N-factor principle
component model.

3
Overview
• Introduction
• A Taxonomy of Approaches
• Candidate gene analysis (c1)
• A prior based multivariate analysis (on genetic, c2)
• Data-driven multivariate analysis (on genetic, c2)
• Component-based analysis (on imaging, c3)
• Multivariate analysis across both (c4)
• Multiple variables for brain + gene w/ priors (c4+c2)
• Multivariate analysis across N>2 phenotypes (c4+)
• Integration of additional bioinformatics resources
• Challenges & Future Directions
13
A prior based multivariate analysis (on genetic, c2)
14A. Subramanian, et al, Proc Natl Acad Sci U S A, vol. 102, pp. 15545-15550, Oct 25 2005
Gene-set enrichment analysis
A prior based multivariate analysis (on genetic, c2)
• GSEA, Methylation, & Hippocampal Volume
15
Ehrlich, S, “Associations between DNA methylation and schizophrenia-related intermediate
functional and structural imaging phenotypes – a gene set enrichment analysis”, in preparation.
Overview
• Introduction
• A Taxonomy of Approaches
• Candidate gene analysis (c1)
• A prior based multivariate analysis (on genetic, c2)
• Data-driven multivariate analysis (on genetic, c2)
• Component-based analysis (on imaging, c3)
• Multivariate analysis across both (c4)
• Multiple variables for brain + gene w/ priors (c4+c2)
• Multivariate analysis across N>2 phenotypes (c4+)
• Integration of additional bioinformatics resources
• Challenges & Future Directions
16
Data-driven multivariate analysis (on genetic, c2)
• Reduction of genetic data
• Penalized regression (LASSO)
• PCA
• ICA
17 18
Methylation Gender Correction (c2)
J. Liu, K. Hutchison, M. Morgan, N. I. Perrone-Bizzozero, J. Sui, and V. D. Calhoun, "Identification of
Genetic and Epigenetic Factors Contributing to Population Structure," PLoS ONE, vol. 5, pp. 1-8, 2010

4
19
• Genomic ~27,000 sites from 23 pairs of chromosomes
• 130 subjects (heavy drinker 33 females, 97 males, age 31.39.7)
Goal: Association with gender, age, BMI, alcohol use, cigarette use, marijuana use, depression, stress, etc.
Results: Methylation correlation
0.490.4
0.45
0.55
0.95
0
0.1
0.2
0.3
0.4
0.5
0.6
0.7
0.8
0.9
1
Gender Age* BMI* Max_drinks* MJ_use*
*: after gender effect correction
Epigenetic-methylation study
J. Liu, K. Hutchison, M. Morgan, N. I. Perrone-Bizzozero, J. Sui, and V. D. Calhoun, "Identification of
Genetic and Epigenetic Factors Contributing to Population Structure," PLoS ONE, vol. 5, pp. 1-8, 201020
Ancestry effect on methylation
J. Liu, K. Hutchison, M. Morgan, N. I. Perrone-Bizzozero, J. Sui, and V. D. Calhoun, "Identification of
Genetic and Epigenetic Factors Contributing to Population Structure," PLoS ONE, vol. 5, pp. 1-8, 2010
Overview
• Introduction
• A Taxonomy of Approaches
• Candidate gene analysis (c1)
• A prior based multivariate analysis (on genetic, c2)
• Data-driven multivariate analysis (on genetic, c2)
• Component-based analysis (on imaging, c3)
• Multivariate analysis across both (c4)
• Multiple variables for brain + gene w/ priors (c4+c2)
• Multivariate analysis across N>2 phenotypes (c4+)
• Integration of additional bioinformatics resources
• Challenges & Future Directions
21
Component-based analysis (on imaging, c3)
22
D. C. Glahn, A. M. Winkler, P. Kochunov, L. Almasy, R. Duggirala, M. A. Carless, J. C. Curran, R. L.
Olvera, A. R. Laird, S. M. Smith, C. F. Beckmann, P. T. Fox, and J. Blangero, "Genetic control over
the resting brain," Proc Natl Acad Sci U S A, vol. 107, pp. 1223-1228, Jan 19 2010
Overview
• Introduction
• A Taxonomy of Approaches
• Candidate gene analysis (c1)
• A prior based multivariate analysis (on genetic, c2)
• Data-driven multivariate analysis (on genetic, c2)
• Component-based analysis (on imaging, c3)
• Multivariate analysis across both (c4)
• Multiple variables for brain + gene w/ priors (c4+c2)
• Multivariate analysis across N>2 phenotypes (c4+)
• Integration of additional bioinformatics resources
• Challenges & Future Directions
23
Multiple brain variables & multiple genetic variables (c4)
24
J. Liu and V. Calhoun, "A review of multivariate analyses in imaging genetics," Frontiers in Neuroinformatics,
vol. 8, pp. 1-11, 2014

5
25
fMRI/SNP connection
• fMRI component: specific brain regions with common independent brain function.
• SNP component: a linearly weighted group of SNPs functioning together.
• Relationship assumptionIf an association of SNPs partially define a certain brain function in
specific brain regions, Then, the linked fMRI and SNP components should share a similar pattern of existence across subjects.
fMRI components SNP components
Expression
pattern
Expression
pattern
Subject 1
..
..
Subject N
RRR: one (of many) possible frameworks
Spatial ICA
ICA Components
fMRI
PPI database
Genetic module extraction
Modules
Two sample t-test
Collaborative
sparse reduced
rank regression
GWAS
Module, Gene, SNP
ranking
Functional enrichment
analysis
Imaging Endo-phenotype
ExtractionGenetic Network
construction
Association analysis
Canonical Correlation Analysis (CCA) model
Illustration of combining both imaging and SNP data with the CCA
model to identify correlated genes and voxels.
H. Cao, J. Duan, D. Lin, Y. Shugart, V. D. Calhoun, and Y.-P. Wang, "Sparse Representation Based Biomarker Selection for
Schizophrenia with Integrated Analysis of fMRI and SNPs," NeuroImage, in press,28
A1
Parallel ICA: Two Goals
X1
S2S1
W2W1
X2
Data1: (fMRI) Data2: (SNP)
A2
Identify
Hidden
Features
Identify
Hidden
Features
Identify Linked Features
J. Liu, O. Demirci, and V. D. Calhoun, "A Parallel Independent Component Analysis Approach to Investigate
Genomic Influence on Brain Function," IEEE Signal Proc. Letters, vol. 15, pp. 413-416, 2008.
MAX : {H(Y1) + H(Y2) }, <Infomax> 2
1i 2j2
1 2
1i 2j
Cov(a ,a )g( )=Correlation(A ,A ) =
Var(a )×Var(a )Subject to: arg max g{W1,W2 ŝ1,ŝ2 },
Simulation
29
Simulation results suggest that parallel ICA, in general, is able to extract more accurately the components and connections
than a correlation test, in particular for weak linkages. Results also indicate that the ratio of sample size to SNP size should
be at least 0.02. However, when the data have a low odds ratio or cases vs. controls ratio, the correlation test provides
results reliably, though with lower accuracy.
Liu, J, et al, IEEE Bioinformatics and Biomedicine. 2008: Philadelphia, PA.
Simulation: Designed to provide a more complete understanding of Parallel ICA while applied to genomic SNP array
studies. We specified the parameters for each component and input them into PLINK, an open-source whole genome
association analysis toolset [http://pngu.mgh.harvard.edu/purcell/plink/].
Conditions: sample size effect. case to control ratio, SNP array size effect, case-related SNP’s vs. total SNP’s, odds ratio,
connection strength between genotype and phenotype effects
Initial Proof of Concept: SNP/fMRI Fusion
30
J. Liu, G. D. Pearlson, A. Windemuth, G. Ruano, N. I. Perrone-Bizzozero, and V. D. Calhoun, "Combining
fMRI and SNP data to investigate connections between brain function and genetics using parallel ICA,"
Hum.Brain Map., vol. 30, pp. 241-255, 2009
SNP Z score Gene
Rs1466163 -4.08 AADC: aromatic L-amino acid decarboxylase
Rs2429511 3.97 ADRA2A: alpha-2A adrenergic receptor gene
Rs3087454 -3.09 CHRNA7: alpha 7 nicotinic cholinergic receptor
Rs821616 2.96 DISC1: disrupted in schizophrenia 1
Rs885834 -2.78 CHAT: choline acetyltransferase
Rs1355920 -2.77 CHRNA7: cholinergic receptor, nicotinic, alpha 7
R4765623 2.73 SCARB1: scavenger receptor class B, member 1
Rs4784642 -2.71 GNAO1: guanine nucleotide binding protein (G protein),
alpha activating activity polypeptide O
Rs2071521 2.58 APOC3: apolipoprotein C-III
Rs7520974 2.55 CHRM3: muscarinic-3 cholinergic receptor
Data Description: 20 Sz & 43 Healthy controls
fMRI: one image per subject (Target activation in AOD task)
SNP: one array per subject (384 SNP genotypes - -> 367 SNPs)
Control vs Patient
p<0.001

6
SNP Selection and Approach• Schizophrenia patients and healthy controls
• MCIC data: Boston, Iowa, Minnesota and New Mexico
• Genome-wide 1M SNP data - [biallelic coding (AA, AB, or BB]
• fMRI sensorimotor task- Block design motor response to auditory
stimulation
• 208 subjects with SNP (777365 SNPs) and fMRI data (52322 voxels)
• SNP selection
• SNPs differentiating schizophrenia patients and healthy controls are
included (p-value < 0.005, 3318 SNPs)
• SNPs related to schizophrenia risk genes are included (1843 SNPs
selected, related to DISC1, COMT, etc.)
• Combine selected SNPs: 5157 SNPs as final input
• Parallel ICA
• Use subject type (SZ patients. vs. healthy control) as reference
• Apply reference PCA to SNP and fMRI data to reduce dimension and
select components of interest
• Apply parallel ICA to identify linked components optimized to the
correlation between the two modalities
31
J. Chen, V. D. Calhoun, G. D. Pearlson, S. Ehrlich, J. Turner, B. C. Ho, T. Wassink, A. Michael, and J. Liu, "Multifaceted
genomic risk for brain function in schizophrenia," NeuroImage, vol. 61, pp. 866-875, 2012.
Number of Components
• SNP data component number selection
• Component number estimated to be 8 for fMRI data (MDL)
• Increase component number from 2 to 60 for SNP data
• Compare the identified fMRI and SNP components obtained with
different SNP component numbers
• Sliding window covering 5 consecutive component numbers
• Locate a region in which identified components remain stable
(select 5% most contributing SNPs from the identified component
and evaluate the overlapping ratios)
32
SNP component number Overlapping ratio Correlation
6 0.843 0.982
7 0.927 0.984
8 0.851 0.957
9 0.970 0.951
Reference SNP component number = 5
J. Chen, V. D. Calhoun, and J. Liu, "ICA Order Selection Based on Consistency: Application to Genotype Data," in Proc.
EMBS, San Diego, CA, 2012.
Consistency
• Leave-one-out validation
• Divide subjects into 10 sets
• Apply parallel-ICA to 90% of the data in each validation run
• Evaluate the consistency of the components based on correlations
between components identified in each validation run and the reference
components identified with the full dataset
33
……
1 2 …… 10Subjects
Resulting Linked Component• fMRI component number = 8, SNP component number = 5
• One pair of linked components is identified, with p-value passing
Bonferroni correction
• Bootstrap: Multiple runs of parallel-ICA with 5157 randomly selected
SNPs. The median correlation was 0.16
34
fMRI component index
SNP component index
rfMRI-SNP P-value
1 3 -0.065 3.49E-01
2 2 0.042 5.48E-01
3 1 0.099 1.51E-01
4 2 -0.138 4.54E-02
5 1 0.141 4.16E-02
6 5 -0.128 6.44E-02
7 1 0.178 9.95E-03
8 4 0.282 3.39E-05
J. Chen, V. D. Calhoun, G. D. Pearlson, S. Ehrlich, J. Turner, B. C. Ho, T. Wassink, A. Michael, and J. Liu, "Multifaceted
genomic risk for brain function in schizophrenia," NeuroImage, vol. 61, pp. 866-875, 2012.
Validation Results
• For each validation run, identify
the replicated fMRI/SNP
component exhibiting most similar
pattern to the reference fMRI/SNP
component identified with full
dataset
• Calculate the fMRI-SNP
correlation between the replicated
components obtained in the
validation run
• Determine if the replicated
components are the highest linked
pair (highest correlation)
• A successful validation: both SNP
and fMRI components show
similar patterns to the reference
SNP and fMRI components,
respectively; and they are linked
35
Index of validation run
rSNP-fMRIHighest linked
pair?
1 0.301 √
2 -0.295 √
3 -0.334 0.339
4 -0.301 √
5 0.246 √
6 -0.249 0.259
7 -0.306 √
8 0.347 √
9 0.387 √
10 0.304 √
J. Chen, V. D. Calhoun, G. D. Pearlson, S. Ehrlich, J. Turner, B. C. Ho, T. Wassink, A. Michael, and J. Liu, "Multifaceted
genomic risk for brain function in schizophrenia," NeuroImage, vol. 61, pp. 866-875, 2012.
Identified fMRI component
36
Brain region Brodmann area Volume Max z-score
Postcentral Gyrus 1, 2, 3, 5, 7, 40, 43 9.7/4.4 6.23(42,-32,60)/5.70(-39,-32,62)
Precentral Gyrus 4, 6 8.2/1.7 6.03(42,-12,56)/4.40(-59,-12,42)
Inferior Parietal Lobule 40 3.0/0.5 6.03(45,-35,57)/4.88(-45,-32,57)
Medial Frontal Gyrus :6, 32 1.0/1.6 4.82(3,-3,53)/5.27(0,-3,53)
Superior Temporal Gyrus 21, 22, 38 1.4/0.5 3.24(62,-12,1)/2.93(-50,-3,-5)
J. Chen, V. D. Calhoun, G. D. Pearlson, S. Ehrlich, J. Turner, B. C. Ho, T. Wassink, A. Michael, and J. Liu, "Multifaceted
genomic risk for brain function in schizophrenia," NeuroImage, vol. 61, pp. 866-875, 2012.

7
Summary of SNP Results• Conduct pathway analysis and functional annotation clustering based
on identified 94 genes
• IPA (Ingenuity Pathway Analysis) identifies “Schizophrenia of humans”
as one of the top biofunctions, involving 11 genes
• IPA also identifies a number of significant canonical pathways, four of
which are related to neurotransmitter signaling
• David’s Bioinformatics Resource reports the most significant cluster to be
functionally related to synapse. A cluster annotated as “cell projection” is
also identified
37
Disease and disorder Gene p-valueSchizophrenia of humans BDNF, COMT, DISC1, DRD3, ERBB4, GAD1,
GRIN2B, HTR7, NOTCH4, NRG1, NRG36.49E-09
Neurotransmitter signaling pathway Gene p-valueGABA receptor signaling GABRA4, GABRG3, GAD1 2.13E-03
Dopamine receptor signaling COMT, DRD3, PPP2R2C 7.66E-03
Neuregulin signaling NRG1, NRG3, ERBB4 1.15E-02
Glutamate receptor signaling GRIN2B, GRID2 3.74E-02
Functional annotation cluster Gene p-valueSynapse GABRA4, GABRG3, GAD1, GRIN2B, GRID2, ERBB4,
SHC4, OTOF, PSD3, CTBP25.20E-03
Cell projection DRD3, GAD1, GRIN2B, MYCBP2, DNAH11, WNT2, ESR1, CDH13, ALCAM, MYO5A
9.70E-02
J. Chen, V. D. Calhoun, G. D. Pearlson, S. Ehrlich, J. Turner, B. C. Ho, T. Wassink, A. Michael, and J. Liu, "Multifaceted
genomic risk for brain function in schizophrenia," NeuroImage, vol. 61, pp. 866-875, 2012.
ADNI Data
• European-American ADNI subjects (N=757)
• 209 HC (Mean/SD Age = 76.05/4.94; 113 Males) with
no past history of neurological or psychiatric disorder,
• 367 subjects with MCI (Mean/SD Age = 74.95/7.37;
239 Males)
• 181 subjects (Mean/SD Age = 75.57/7.48; 100 Males)
with clinically-assessed AD
• SNP data
• 533,872 SNPs (after QA)
• sMRI data
• Baseline 1.5T MRI scans
• Segmented into GM maps
38
S. Meda, B. Narayanan, J. Liu, N. I. Perrone-Bizzozero, M. Stevens, V. D. Calhoun, D. C. Glahn, L. Shen, S. L.
Risacher, A. J. Sayking, and G. D. Pearlson, "A large scale multivariate parallel ICA method reveals novel imaging-
genetic relationships for Alzheimer's Disease in the ADNI cohort," NeuroImage, vol. 60, pp. 1608-1621, 2012
ADNI Data
39
S. Meda, B. Narayanan, J. Liu, N. I. Perrone-Bizzozero, M. Stevens, V. D. Calhoun, D. C. Glahn, L. Shen, S. L.
Risacher, A. J. Sayking, and G. D. Pearlson, "A large scale multivariate parallel ICA method reveals novel imaging-
genetic relationships for Alzheimer's Disease in the ADNI cohort," NeuroImage, vol. 60, pp. 1608-1621, 2012
Genetic Components by Group
40
S. Meda, B. Narayanan, J. Liu, N. I. Perrone-Bizzozero, M. Stevens, V. D. Calhoun, D. C. Glahn, L. Shen, S. L.
Risacher, A. J. Sayking, and G. D. Pearlson, "A large scale multivariate parallel ICA method reveals novel imaging-
genetic relationships for Alzheimer's Disease in the ADNI cohort," NeuroImage, vol. 60, pp. 1608-1621, 2012
Alzheimer’s disease functional interaction pathway
41modified from Sleegers K et al., TIGS 2009
42
sMRI/SNP
A. sMRI component –A (group difference)
B. sMRI component –B (linked, but no group difference)
K. Jagannathan, V. D. Calhoun, J. Gelernter, M. Stevens, J. Liu, F. Bolognani, A. Windemuth, G. Ruano, and G. D.
Pearlson, "Genetic associations of brain structural networks in schizophrenia: a preliminary study using parallel ICA,"
Biological Psychiatry, vol. 68, pp. 657-666, 2010
Structural deficits in brain regions consistently implicated in previous schizophrenia reports, including frontal and
temporal lobes and thalamus were related to SNPs from 16 genes, several previously associated with schizophrenia
risk and/or involved in normal CNS development, including AKT, PI3k, SLC6A4, DRD2, CHRM2 and ADORA2A.

8
Genetics and P3 ERP generation
• Subjects: 41 healthy subjects (24 female, 17 male)
• EEG collected during AOD task,
target/novel ERPs extracted
• Blood sample collected, genotyped 384 SNPs from 222
genes 6 physiological systems.
43
J. Liu, K. A. Kiehl, G. D. Pearlson, N. I. Perrone-Bizzozero, and V. D. Calhoun, "Genetic Determinants of
Target and Novelty Processing," NeuroImage, vol. 46, pp. 809-816, 2009. 44
ERP Topography & SNP Associations
Tar
get
Sti
muli
Novel
Sti
muli
0.55
0.47
J. Liu, K. A. Kiehl, G. D. Pearlson, N. I. Perrone-Bizzozero, and V. D. Calhoun, "Genetic Determinants of
Target and Novelty Processing," NeuroImage, vol. 46, pp. 809-816, 2009.
SNPs Genes
rs1800545
rs7412
rs1128503
rs6578993
rs1045642
rs2278718
rs4784642
rs521674
ADRA2A
APOE
ABCB1
TH
ABCB1
MDH1
GNAO1
ADRA2A
SNPs Genes
rs1800545
rs7412
rs6578993
rs2278718
rs1128503
rs429358
rs3813065
rs4121817
rs521674
ADRA2A
APOE
TH
MDH1
ABCB1
APOE
PIK3C3
PIK3C3
ADRA2A
45
Pathway Analysis
J. Liu, K. A. Kiehl, G. D. Pearlson, N. I. Perrone-Bizzozero, and V. D. Calhoun, "Genetic Determinants of
Target and Novelty Processing," NeuroImage, vol. 46, pp. 809-816, 2009. 46
Dataset
Number of
Training
Subjects
Number of
Testing
Subjects
1 4 36
2 12 28
3 20 20
4 28 12
5 36 4
Subjects 20 Patients
20 Healthy Controls
fMRI data Auditory Oddball Task
Gene data 367 SNPs
Classification with SNP & fMRI
SVM Classification
fMRI + Gene
fMRI
Gene
H. Yang, J. Liu, J. Sui, G. Pearlson, and V. D. Calhoun, "A Hybrid Machine Learning Method for Fusing fMRI and
Genetic Data to Classify Schizophrenia," Frontiers in Human Neuroscience, vol. 4, pp. 1-9, 2010.
Overview
• Introduction
• A Taxonomy of Approaches
• Candidate gene analysis (c1)
• A prior based multivariate analysis (on genetic, c2)
• Data-driven multivariate analysis (on genetic, c2)
• Component-based analysis (on imaging, c3)
• Multivariate analysis across both (c4)
• Multiple variables for brain + gene w/ priors (c4+c2)
• Multivariate analysis across N>2 phenotypes (c4+)
• Integration of additional bioinformatics resources
• Challenges & Future Directions
47
Constrained ICA
48
CDK14 (7q21)
ZNF879
GRM6 (5q35)
LOC 100506971
UGDH
SLC5
ZNF354C
ADAMTS2
J. Liu, M. Ghassemi, A. Michael, D. Boutte, W. Wells, N. I. Perrone-Bizzozero, F. Macciardi, D. Mathalon, J. Ford, S. Potkin,
J. Turner, FBIRN, and V. D. Calhoun, "An ICA with reference approach in identification of genetic variation and associated
brain networks," Frontiers in Human Neuroscience, vol. 6, pp. 1-10, 2012.
9
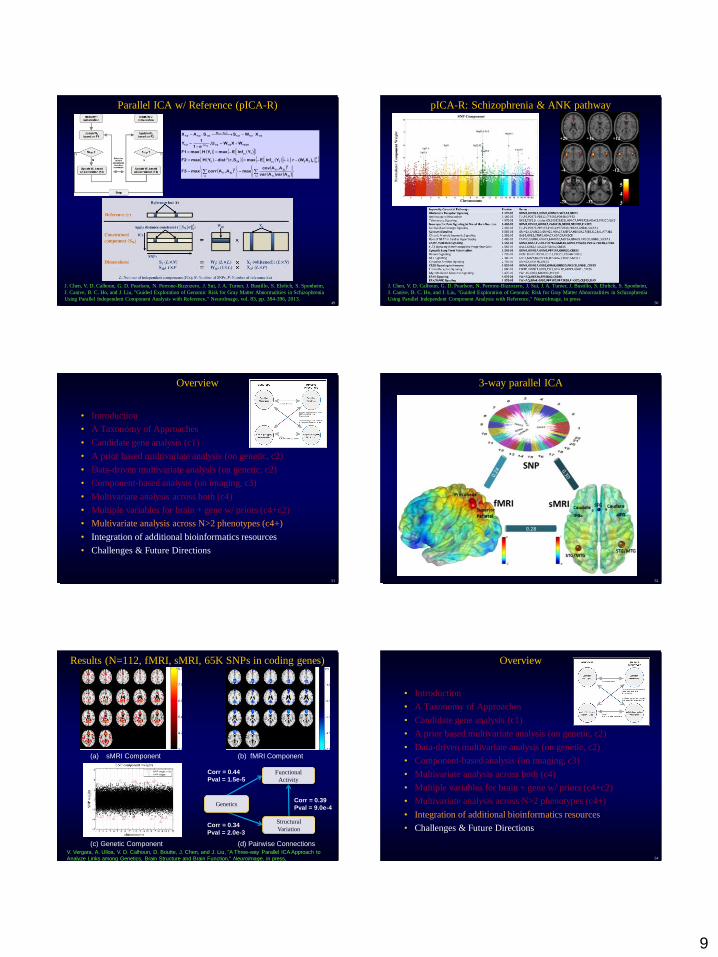
Parallel ICA w/ Reference (pICA-R)
49
ji, 2j1i
2
2j1i
ji,
2
2j1i
2
2k222y2k
2
2
1y1
10/201/21/2U1/2
1/21/21/2
AW
1/21/21/2
AvarAvar
A,AcovmaxA,AcorrmaxF3
)X(Wr Ylnf EmaxSr,distY H maxF2
Ylnf EmaxY H maxF1
WXWU,e1
1Y
XWSSAX
2
1
1/2
11/21/2
λ
J. Chen, V. D. Calhoun, G. D. Pearlson, N. Perrone-Bizzozero, J. Sui, J. A. Turner, J. Bustillo, S. Ehrlich, S. Sponheim,
J. Canive, B. C. Ho, and J. Liu, "Guided Exploration of Genomic Risk for Gray Matter Abnormalities in Schizophrenia
Using Parallel Independent Component Analysis with Reference," NeuroImage, vol. 83, pp. 384-396, 2013.
pICA-R: Schizophrenia & ANK pathway
50
J. Chen, V. D. Calhoun, G. D. Pearlson, N. Perrone-Bizzozero, J. Sui, J. A. Turner, J. Bustillo, S. Ehrlich, S. Sponheim,
J. Canive, B. C. Ho, and J. Liu, "Guided Exploration of Genomic Risk for Gray Matter Abnormalities in Schizophrenia
Using Parallel Independent Component Analysis with Reference," NeuroImage, in press
Overview
• Introduction
• A Taxonomy of Approaches
• Candidate gene analysis (c1)
• A prior based multivariate analysis (on genetic, c2)
• Data-driven multivariate analysis (on genetic, c2)
• Component-based analysis (on imaging, c3)
• Multivariate analysis across both (c4)
• Multiple variables for brain + gene w/ priors (c4+c2)
• Multivariate analysis across N>2 phenotypes (c4+)
• Integration of additional bioinformatics resources
• Challenges & Future Directions
51
3-way parallel ICA
52
Results (N=112, fMRI, sMRI, 65K SNPs in coding genes)
Genetics
Structural
Variation
Functional
Activity
Corr = 0.44
Pval = 1.5e-5
Corr = 0.34
Pval = 2.0e-3
Corr = 0.39
Pval = 9.0e-4
(a) sMRI Component (b) fMRI Component
(c) Genetic Component (d) Pairwise ConnectionsV. Vergara, A. Ulloa, V. D. Calhoun, D. Boutte, J. Chen, and J. Liu, "A Three-way Parallel ICA Approach to
Analyze Links among Genetics, Brain Structure and Brain Function," NeuroImage, in press,
Overview
• Introduction
• A Taxonomy of Approaches
• Candidate gene analysis (c1)
• A prior based multivariate analysis (on genetic, c2)
• Data-driven multivariate analysis (on genetic, c2)
• Component-based analysis (on imaging, c3)
• Multivariate analysis across both (c4)
• Multiple variables for brain + gene w/ priors (c4+c2)
• Multivariate analysis across N>2 phenotypes (c4+)
• Integration of additional bioinformatics resources
• Challenges & Future Directions
54

10
55 56
Overview
• Introduction
• A Taxonomy of Approaches
• Candidate gene analysis (c1)
• A prior based multivariate analysis (on genetic, c2)
• Data-driven multivariate analysis (on genetic, c2)
• Component-based analysis (on imaging, c3)
• Multivariate analysis across both (c4)
• Multiple variables for brain + gene w/ priors (c4+c2)
• Multivariate analysis across N>2 phenotypes (c4+)
• Integration of additional bioinformatics resources
• Challenges & Future Directions
57
Challenges & Issues
• Overfitting (cross-validation, prior information)
• Replication
• Interpretation (e.g. GSEA does not model exact
interaction among SNPs, latent component may
not have a biological purpose).
• Can be partially addressed by incorporating
known biological, cellular, or behavioral specific
information.
• Lots of information not fully incorporated
(proteomic, gene expression, epigenetic,
behavioral and environmental variables)
• CNV (low incidence)
58
• http://mialab.mrn.org/software
• freeware, written in MATLAB
• Group ICA of fMRI Toolbox (GIFT)• Single subject/Group ICA
• Many algorithms (e.g. ICA, cICA, IVA)
• MANCOVA testing framework
• Source Based Morphometry
• Model order estimation
• ICASSO (clustering/stability)
• Dynamic connectivity (dFNC)
• Fusion ICA Toolbox (FIT)• Parallel ICA, jICA
• mCCA+jICA & much more!
• Simulation Toolbox (SimTB)• Flexible generation of fMRI-like data
• Task & rest fMRI
• Space * Time * Amplitude
Left Hemisphere
Visual Stimuli Onset
Left Hemisphere
Visual Stimuli Onset
Software
60


![WONOEP appraisal: Imaging biomarkers in epilepsy...recent advances in identifying the irritative zone (e.g., scalp and intracranial electroencephalography–functional MRI [EEG-fMRI])](https://img.pdfslide.us/doc/110x75/6055314f35bedc66711e5aef/wonoep-appraisal-imaging-biomarkers-in-epilepsy-recent-advances-in-identifying.jpg)