Embed Size (px)
Citation preview
Zhang et al. SpringerPlus (2016) 5:1973 DOI 10.1186/s40064-016-3662-7
RESEARCH
Identification of lumbar disc disease hallmarks: a large cross-sectional studyJun Zhang1†, Fei Zhao2†, Feng‑Liang Wang3†, Yong‑Feng Yang4, Chen Zhang4, Yue Cao4, You‑Lin Wang4, Xiao‑Juan Shi2, Yi Wan5, Min Zhang2, Meng‑Qiao Liu2, Chun‑Guang Zuo1 and Hai‑Qiang Wang2*
Abstract
Background: Lumbar disc disease has a disabling impact on global people with heavy burden on society, mainly consisting of lumbar disc degeneration (LDD) and lumbar disc herniation (LDH). The recently released lumbar disc nomenclature version 2.0 deepens our understandings on the diseases. Consequently, there is an urgent need to clarify the occurrence and distribution features of LDD and LDH in a large‑scale sample in terms of the novel version.
Question/purposes: We asked: (1) Is there a difference in the occurrence and distribution hallmarks of LDD and LDH in a population‑based large‑scale sample? (2) Does the novel nomenclature version bring novel vision on lumbar disc disease?
Methods: Five thousand two hundred eighty‑eight consecutive cases (26,440 lumbar discs) undergoing lumbar spine MRI were retrospectively included from Jan 2008 to Dec 2010 in a territory university hospital. Five hundred nine cases were excluded. There were 2727 males (51.57%) and 2561 females (48.43%) with a mean age of 43.73 years. Both T1 and T2 weighted lumbar MRI images from L1/2 to L5/S1 were profoundly analyzed in axial and sagittal planes. We classified lumbar discs in terms of version 2.0.
Results: The occurrence of LDH and LDD was 14.18 and 44.23% in average, respectively. Notably, lumbar spine discs were more prone to LDD than LDH. L4/5 was the most frequent level in terms of LDH (26.08%) and LDD (56.09%), followed by L5/S1 (LDH: 24.09%; LDD: 55.33%), then L3/4, L2/3 and L1/2 in ranking order. The prevalence of LDH and LDD in upper lumbar discs from L1/2 to L3/4 was significant lower than the average prevalence rate (P < 0.05). The mean age was 24.70 (±14.81) years for normal lumbar discs; 49.76 (±14.95) years for LDD; 37.01 (±12.91) years for LDH; 51.31(±15.00) years for LDD and LDH (P < 0.05). Modic changes, HIZ, spondylosis deformans and decreased disc height were linked with older age; whereas Schmorl node and lumbar disc sequestration were not associated with age (P < 0.05).
Conclusions: The prevalence of LDD is 44.23%, higher than LDH as 14.18%. L4/5 and L5/S1 are the most frequent involved segments for the majority of lumbar disc diseases. Schmorl node occurs (1.6%) more frequently in upper lumbar spine, independent of age. Modic changes (0.87%) are closely related with older age.
Clinical relevance: When diagnosing and treating lumbar disc disease, it might be important to consider the updated nomenclature of LDD and LDH. Our study provides additional novel vision on the features of LDD and LDH in a large‑scale sample based on the nomenclature of novel version.
© The Author(s) 2016. This article is distributed under the terms of the Creative Commons Attribution 4.0 International License (http://creativecommons.org/licenses/by/4.0/), which permits unrestricted use, distribution, and reproduction in any medium, provided you give appropriate credit to the original author(s) and the source, provide a link to the Creative Commons license, and indicate if changes were made.
Open Access
*Correspondence: [email protected]; [email protected] †J. Zhang, F. Zhao and F.‑L. Wang contribute equally to this work
2 Department of Orthopaedics, Xijing Hospital, Fourth Military Medical University, 127 Changle Western Road, Xi’an 710032, People’s Republic of ChinaFull list of author information is available at the end of the article
Page 2 of 8Zhang et al. SpringerPlus (2016) 5:1973
BackgroundIn general, lumbar disc disease comprises both interver-tebral disc degeneration (MeSH Unique ID: D055959, introduced in 2012) and intervertebral disc displacement (MeSH Unique ID: D007405, corresponding to lumbar disc herniation commonly noted). As the main contrib-utor to low back pain and sciatica, the disease greatly affects people’s work, daily lives and quality of life (Bal-aji et al. 2014; Lagerback et al. 2015; Thaler et al. 2015), even permanent neurologic deficit and lifelong incon-tinence due to cauda equina syndrome (Todd 2015). Notably, over 380 thousands patients in USA had to undergo surgical treatments due to lumbar disc disease during between 2000 and 2009 (Yoshihara and Yoneoka 2015), which is only the tip of the iceberg. The majority of patients with lumbar disc disease seek for conservative treatment. In 2013, more than 1 million patients received an epiduralglucocorticoid injection in USA (Racoosin et al. 2015), let alone those outside USA and those seek-ing for other treatment methods within USA.
Despite its disabling impact on global people at all ages, the occurrence and distribution features of lumbar disc disease remains largely undefined. Notwithstand-ing novel diagnostic imaging methods have been identi-fied (Arpinar et al. 2015; Lagerback et al. 2015), the gold standard for grading lumbar disc degeneration (LDD) is still based on T2 weighted MRI of the lumbar spine proposed in 2001 (Pfirrmann et al. 2001). In the classic study, Pfirrmann et al. proposed the 5-grades algorithm following evaluating 300 intervertebral discs (IVDs) in 60 patients. So far, the cross-sectional studies with the larg-est sample size were less than 2600 cases, addressing the hallmarks of lumbar disc disease using MRI (Samartzis et al. 2011; Teraguchi et al. 2014, 2015).
In 2014, the combined task forces of the North Ameri-can Spine Society, the American Society of Spine Radi-ology and the American Society of Neuroradiology released the state-of-the-art lumbar disc nomenclature: version 2.0 (Fardon et al. 2014a, b). The updated termi-nology on LDD and lumbar disc herniation (LDH) greatly expands our understandings of LDD and LDH, starting a new era for scientific community and patients. We asked: (1) Is there a difference in the occurrence and distribu-tion hallmarks of LDD and LDH in a population-based large-scale sample? (2) Does the novel nomenclature ver-sion bring novel vision on lumbar disc disease?
Therefore, it is of vital importance to revisit the issues of LDD and LDH in terms of the novel lumbar disc nomenclature. Bearing this in mind, we aimed for achieving the goal using a large cross-sectional image samples.
Patients and methodsStudy populationFollowing institutional review board approval, a hospital-based image study was initiated to evaluate the epide-miologic phenotypes of LDD and LDH. First, All lumbar spine MRI images were extensively reviewed from Jan 2008 to Dec 2010, including those patients prescribed by both out-patient and in-patients clinicians due to vari-ous factors. Second, the cases with infections, neoplasms, deformities and congenital anomaly were excluded. Third, degenerative cases were profoundly assessed.
Assessment of radiographsAll patients underwent MRI on a 1.5 T MR scanner (MAGNETOM Aera, Siemens AG, Erlangen, Germany) using the integrated spine coil. The T1-weighted sagit-tal, T2-weighted sagittal and axial images were acquired using a standard TSE sequence. Both T1 and T2 weighted lumbar MRI images from L1/2 to L5/S1 were profoundly analyzed in axial and sagittal planes.
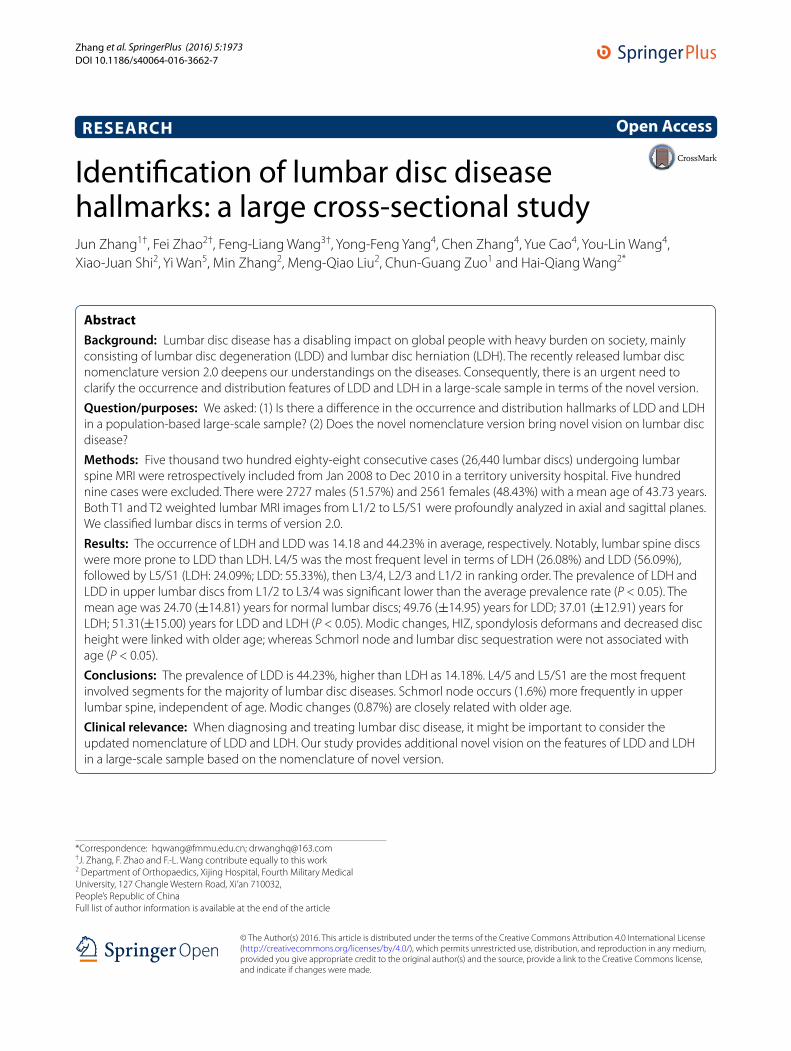
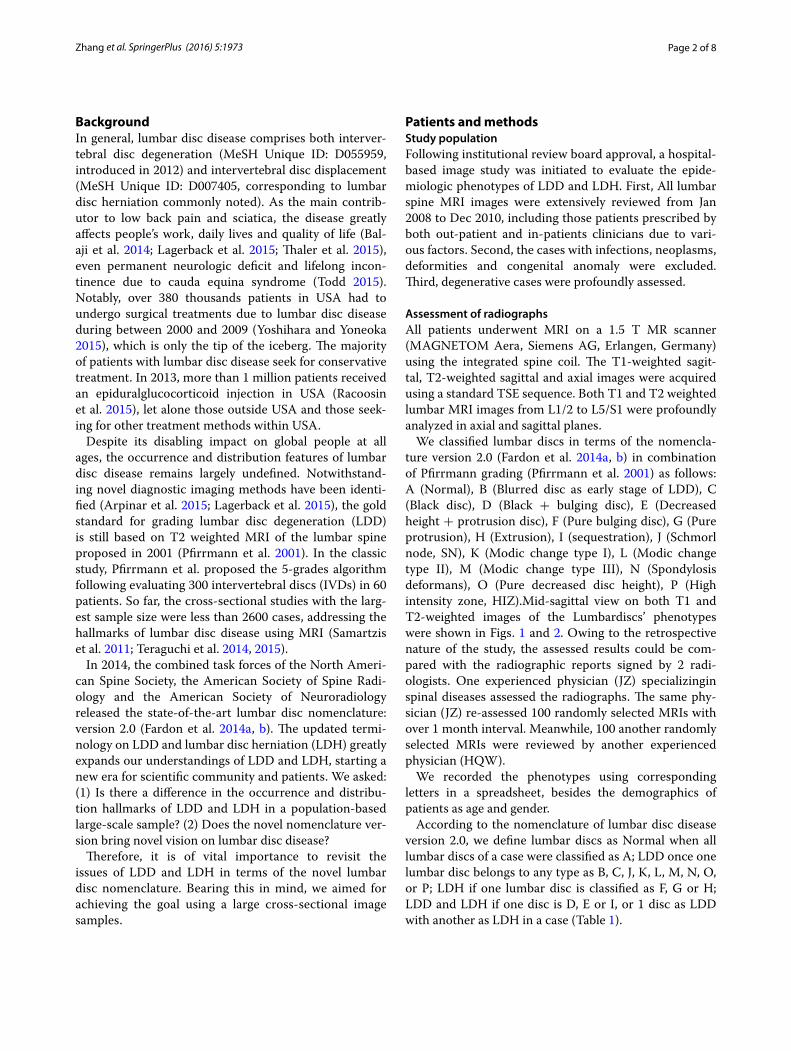
We classified lumbar discs in terms of the nomencla-ture version 2.0 (Fardon et al. 2014a, b) in combination of Pfirrmann grading (Pfirrmann et al. 2001) as follows: A (Normal), B (Blurred disc as early stage of LDD), C (Black disc), D (Black + bulging disc), E (Decreased height + protrusion disc), F (Pure bulging disc), G (Pure protrusion), H (Extrusion), I (sequestration), J (Schmorl node, SN), K (Modic change type I), L (Modic change type II), M (Modic change type III), N (Spondylosis deformans), O (Pure decreased disc height), P (High intensity zone, HIZ).Mid-sagittal view on both T1 and T2-weighted images of the Lumbardiscs’ phenotypes were shown in Figs. 1 and 2. Owing to the retrospective nature of the study, the assessed results could be com-pared with the radiographic reports signed by 2 radi-ologists. One experienced physician (JZ) specializingin spinal diseases assessed the radiographs. The same phy-sician (JZ) re-assessed 100 randomly selected MRIs with over 1 month interval. Meanwhile, 100 another randomly selected MRIs were reviewed by another experienced physician (HQW).
We recorded the phenotypes using corresponding letters in a spreadsheet, besides the demographics of patients as age and gender.
According to the nomenclature of lumbar disc disease version 2.0, we define lumbar discs as Normal when all lumbar discs of a case were classified as A; LDD once one lumbar disc belongs to any type as B, C, J, K, L, M, N, O, or P; LDH if one lumbar disc is classified as F, G or H; LDD and LDH if one disc is D, E or I, or 1 disc as LDD with another as LDH in a case (Table 1).

Page 3 of 8Zhang et al. SpringerPlus (2016) 5:1973
Statistical analysisAll data was recorded in a spreadsheet and analyzed with SPSS 19.0. Inter-class coefficient was used to assess
inter-observer reliability. Reliability scores of <0.79, 0.80 to 0.89, and >0.90 were considered as poor, good, and excellent, respectively. Student t test was employed for
Fig. 1 Mid‑sagittal view on T2‑weighted images of the Lumbardiscs. a (Normal), b (Blurred disc as early stage of LDD), c (Black disc), d (Black + bulging disc), e (Decreased height + protrusion disc), f (Pure bulging disc), g (Pure protrusion), h (Extrusion), i (sequestration), j (Schmorl node, SN)
Fig. 2 MRI of the Lumbardiscs. K1 (Modic change type I on T1‑weighted image), K2 (Modic change type I on T2‑weighted image), L1 (Modic change type II on T1‑weighted image), L2 (Modic change type II on T2‑weighted image), M1 (Modic change type III on T1‑weighted image),M2 (Modic change type III on T2‑weighted image), N (Spondylosis deformans), O (Pure decreased disc height), P1 (Mid‑sagittal viewof High intensity zone, HIZ), P2 (Axial viewof High intensity zone, HIZ)
Page 4 of 8Zhang et al. SpringerPlus (2016) 5:1973
measurement data; whereas enumeration data were ana-lyzed using Chi square test. Lumbar disc degeneration and herniation in each segment were compared using binomial distribution test. A P value of <0.05 was consid-ered statistically significant.
ResultsPatients demographicsIn total, the study included 5288 cases (26,440 lum-bar discs) with lumbar MRI images, excluding 509 cases. The cross-sectional study of lumbar degenera-tion (COLD) consisted of 2727 males (51.57%) and 2561 females (48.43%). The average age of cases was 43.73 ± 18.69 years (range: 1–91 years, Table 1). The intra-observer and inter-observer reliability for lumbar disc phenotypes was 0.93 and 0.92, respectively.
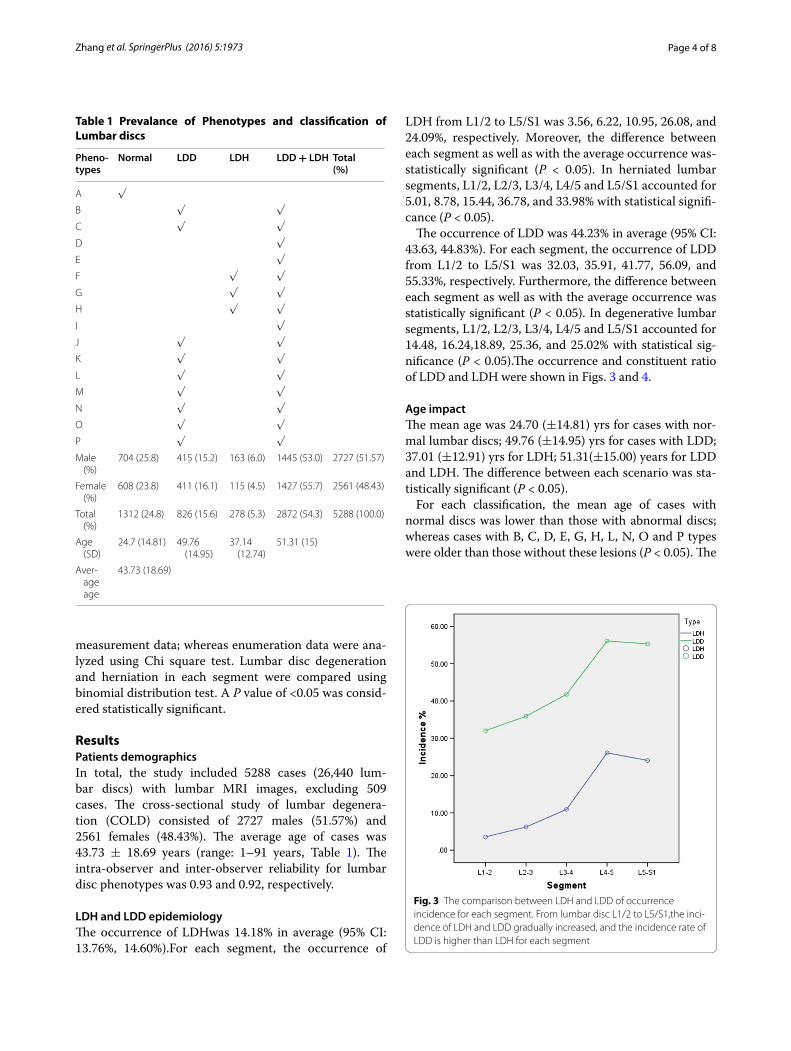
LDH and LDD epidemiologyThe occurrence of LDHwas 14.18% in average (95% CI: 13.76%, 14.60%).For each segment, the occurrence of
LDH from L1/2 to L5/S1 was 3.56, 6.22, 10.95, 26.08, and 24.09%, respectively. Moreover, the difference between each segment as well as with the average occurrence was-statistically significant (P < 0.05). In herniated lumbar segments, L1/2, L2/3, L3/4, L4/5 and L5/S1 accounted for 5.01, 8.78, 15.44, 36.78, and 33.98% with statistical signifi-cance (P < 0.05).
The occurrence of LDD was 44.23% in average (95% CI: 43.63, 44.83%). For each segment, the occurrence of LDD from L1/2 to L5/S1 was 32.03, 35.91, 41.77, 56.09, and 55.33%, respectively. Furthermore, the difference between each segment as well as with the average occurrence was statistically significant (P < 0.05). In degenerative lumbar segments, L1/2, L2/3, L3/4, L4/5 and L5/S1 accounted for 14.48, 16.24,18.89, 25.36, and 25.02% with statistical sig-nificance (P < 0.05).The occurrence and constituent ratio of LDD and LDH were shown in Figs. 3 and 4.
Age impactThe mean age was 24.70 (±14.81) yrs for cases with nor-mal lumbar discs; 49.76 (±14.95) yrs for cases with LDD; 37.01 (±12.91) yrs for LDH; 51.31(±15.00) years for LDD and LDH. The difference between each scenario was sta-tistically significant (P < 0.05).
For each classification, the mean age of cases with normal discs was lower than those with abnormal discs; whereas cases with B, C, D, E, G, H, L, N, O and P types were older than those without these lesions (P < 0.05). The
Table 1 Prevalance of Phenotypes and classification of Lumbar discs
Pheno-types
Normal LDD LDH LDD + LDH Total (%)
A √
B √ √
C √ √
D √
E √
F √ √
G √ √
H √ √
I √
J √ √
K √ √
L √ √
M √ √
N √ √
O √ √
P √ √
Male (%)
704 (25.8) 415 (15.2) 163 (6.0) 1445 (53.0) 2727 (51.57)
Female (%)
608 (23.8) 411 (16.1) 115 (4.5) 1427 (55.7) 2561 (48.43)
Total (%)
1312 (24.8) 826 (15.6) 278 (5.3) 2872 (54.3) 5288 (100.0)
Age (SD)
24.7 (14.81) 49.76 (14.95)
37.14 (12.74)
51.31 (15)
Aver‑age age
43.73 (18.69)
Fig. 3 The comparison between LDH and LDD of occurrence incidence for each segment. From lumbar disc L1/2 to L5/S1,the inci‑dence of LDH and LDD gradually increased, and the incidence rate of LDD is higher than LDH for each segment

Page 5 of 8Zhang et al. SpringerPlus (2016) 5:1973
findings indicate that Modic changes, HIZ, spondylosis deformans and decreased disc height were linked with older age; whereas Schmorl node and lumbar disc seques-trationwere not associated with age (P < 0.05, Table 2).
Lumbar segment impactLumbar spine was classified into upper lumbar (L1/2, L2/3 and L3/4) and lower lumbar spine (L4/5 and L5/S1). In general, normal, blurred disc as early stage of LDD and Schmorlnodeoccurred more frequently in upper lumbar discs than lower lumbar discs. Moreover, other patho-logic types occurred more frequently in lower lumbar discs than upper lumbar discs (P < 0.05, Table 3).
DiscussionThe study is the first providing novel vision on the prevalence and landscape of LDD and LDH in lumbar spine based the largest COLD samples, shedding valu-able lights on lumbar disc diseases. Moreover, the mega-data of lumbar spine images are on the base of the most updated version of lumbar disc nomenclature released by the authorized society (Fardon et al. 2014a, b).
Indeed, LDD and LDH are amongst the most common form of spinal diseases, tightly linked with low back pain. Despite the widespread impact on people’s daily lives, the accurate prevalence and underlying relations with age remain elusive. In summary, the prevalence of lumbar disc degeneration is 44.23%, higher than LDH as 14.18%. L4/5 and L5/S1 are the most frequent involved segments for the majority of lumbar disc diseases. SN occurs (1.6%) more frequently in upper lumbar spine, independent of
Fig. 4 The comparison between LDH and LDD of constituent ratio for each segment. Both LDH and LDD, Lower lumbar disc (L4/5 and L5/S1) have higher proportion, especially of LDH
Table 2 The mean age of positive and negative cases for each phenotype
* P < 0.0001; ** P < 0.05
Phenotypes Positive + Negative − t P
A 33.80 (16.14) 54.92 (14.59) −111.08 0.000*
B 53.93 (12.51) 42.44 (18.94) 31.95 0.000*
C 58.17 (13.92) 41.11 (18.24) 56.51 0.000*
D 54.81 (14.34) 42.67 (18.71) 30.15 0.000*
E 56.59 (15.40) 42.69 (18.54) 32.26 0.000*
F 42.60 (13.72) 43.73 (18.76) −1.29 0.200
G 48.29 (14.53) 43.51 (18.82) 8.48 0.000*
H 50.48 (15.34) 43.69 (18.70) 3.80 0.000*
I 44.75 (13.31) 43.71 (18.70) 0.51 0.614
J 44.93 (17.04) 43.70 (18.70) 1.00 0.316
K 46.64 (8.12) 43.71 (18.70) 0.50 0.604
L 51.26 (10.51) 43.70 (18.70) 2.36 0.018**
M 38.00 (−) 43.71 (18.69) −0.31 0.760
N 71.56 (8.87) 43.68 (18.67) 8.96 0.000*
O 50.97 (16.76) 43.68 (18.69) 4.01 0.000*
P 48.81 (12.94) 43.69 (18.71) 3.10 0.002**
Table 3 Lumbar segment impact on each phenotype
Pathologic types D–L and P occurred more frequently in lower lumbar discs than upper lumbar discs; Whereas A–C and J (normal, blurred disc as early stage of LDD and Schmorl node) occurred more frequently in upper lumbar discs
* P < 0.0001;** P < 0.05
Phenotypes L1–L4 (%) L4–S1 (%) χ2 P
A 9873 (62.2) 4157 (39.3) 1339.9 0.000*
B 1905 (12.0) 1018 (9.6) 36.7 0.000*
C 2096 (13.2) 1937 (18.3) 127.7 0.000*
D 846 (5.3) 1433 (13.5) 543.8 0.000*
E 646 (4.1) 1307 (12.4) 636.8 0.000*
F 121 (0.8) 335 (3.2) 216.5 0.000*
G 295 (1.9) 852 (8.1) 587 0.000*
H 25 (0.2) 85 (0.8) 63.9 0.000*
I 9 (0.1) 74 (0.7) 83.8 0.000*
J 202 (1.3) 34 (0.3) 65 0.000*
K 1 (0.0) 10 (0.1) 11.9 0.001**
L 3 (0.0) 31 (0.3) 37.1 0.000*
M 0 (0.0) 1 (0.0) 0.221 0.400
N 23 (0.1) 13 (0.1) 0.227 0.384
O 71 (0.4) 35 (0.3) 2.162 0.141
P 29 (0.2) 99 (0.9) 74.7 0.000*
Total 16,145 (100) 11,421 (100)

Page 6 of 8Zhang et al. SpringerPlus (2016) 5:1973
age. Modic changes (0.87%) are closely related with older age. Moreover, Modic II is the most common type.
Prevalence of LDD and other phenotypesIn 2014, Teraguchi et al. reported the prevalence of LDD is highest in L4/5 as 69.1% for men and 75.8% for women (Teraguchi et al. 2014). Their study was based on the Wakayama Spine Study with 975 participants. In 2015, the same research team reported that LDD prevalence as 30.4%, SN as 1.5% in terms of the same cross-sectional study (Teraguchi et al. 2015). Samartzis et al. noted LDD prevalence as 72.7% based on 2599 southern Chinese volunteers (mean age 41.9 years). It should be stressed that Teraguchi et al. determined LDD grading in terms of Pfirrmann’s 5-grade scheme on T2-weighted images (Pfirrmann et al. 2001) (grading system on 300 lumbar discs); whereas Samartzis et al. judged LDD based on 4-grade system proposed by Schneiderman et al. (1987) (grading system on 180 lumbar discs).
We reported LDD and LDH separately based on the updated version, considering the aforementioned grad-ing schemes. The prevalence varies between our cross-sectional study and the Wakayama Spine Study, southern Chinese subjects, due to several factors. First, the grad-ing criteria are different. Notably, there is significant variability in the interrater and intrarater agreements of MRI in assessing degenerative conditions of the lum-bar spine even with standardized evaluation criteria (Fu et al. 2014). In particular, as we pointed out (Li et al. 2015), phenotypes, including SN, Modic changes, HIZ, have been relegated into LDD according to the updated version. Therefore, studies using previous MRI grading schemes might not accurately reflect the state-of-the-art concept of lumbar disc disease. On the other hand, it should be stressed that definition of a normal lumbar disc is a relative notion (Li et al. 2015). In general, cur-rent relative signal intensity in MRI is the gold standard for classifying LDD, upon which we diagnose the lum-bar spine as normal or LDD. Strikingly, lumbar discs are among the early degenerative organs in the body, even in the first decade (Roberts et al. 2006). The degeneration sign initiates from cell phenotype conversion from noto-chord cells to small chondrocyte-like nucleus pulposus cells localized within nests (Chen et al. 2013). If we judge lumbar spine discs in terms of more sensitive molecular or RNA expression profiling criteria as we addressed pre-viously (Sun et al. 2013; Wan et al. 2014; Wang et al. 2010, 2011), even early degeneration as phenotype B would be diagnosed as LDD. However, grading 1 to grading 3 would generally be considered as Normal according to MRI grading schemes (Pfirrmann et al. 2001; Schneider-man et al. 1987). Therefore, the grading system of LDD should be integrated for the scientific community.
Second, the sample size should not be overlooked. Apparently, largersample size results in aconclusion with higher confidential level; despite large sample exploration is time-consuming. At this point, the prevalence based on 26,440 lumbar discs with a wide age range might be more reliable.
LDD and LDHDespite LDD and LDH are highly linked with the same OMIM code (Song et al. 2013), they are not exactly the same disease (Wang and Samartzis 2014). LDD is characterized by progressive loss of aggrecan (Le Mai-tre et al. 2009), annular fibrosis rupture (Kazezian et al. 2015; Pirvu et al. 2015), collagen type transformation, cartilage endplate alterations (Arpinar et al. 2015) and decreased disc height (Jarman et al. 2015). In MRI, typical LDD represents as black discs. However, LDH can occur in adolescents without typical signs of LDD (Lagerback et al. 2015). The prevalence of LDH-related sciatica has been reported as 2% in adults (Younes et al. 2006). However, cases with LDH as bulging or mild extrusion, protrusion might not have clinical sci-atica. At this point, the study presents the first line of evidence, unraveling the prevalence of LDH as 14.18%. Moreover, LDH prevalence for each segment has been clarified.
SN hallmarksIn our study, SN occurs in 1.6% of all cases, consistent with the results of the Wakayama Spine Study (Teragu-chi et al. 2015). Previously, it remains unclear whether SN occurs in upper or lower lumbar spine more fre-quently. We noted that SN occurs more frequently in upper lumbar spine than lower lumbar spine, providing novel insights in SN. The underlying mechanisms might be partly due to the anatomic hallmarks of posterior lon-gitudinal ligament as main reinforcement ending in L3 (Wang and Samartzis 2014).
Modic changesIn 1988, Modic and colleagues defined changes in ver-tebral body marrow via MRI imaging. The prevalence of type I changes was 4% among 474 patients; whereas the prevalence of type II changes was 16% (Modic et al. 1988). Thereafter, a number of studies addressed the issue with differences, ranging from 0 to 22% in nor-mal population, 6.3–60% in patients (Jensen et al. 2008; Maatta et al. 2015). In the current study, the prevalence of Modic changes was lower in comparison with the aforementioned studies. The heterogeneousness in sam-ple size and objects of studies contributes to the variety of reports. Therefore, the definite prevalence of Modic changes needs well defined.

Page 7 of 8Zhang et al. SpringerPlus (2016) 5:1973
Despite our study shed novel light on the understand-ings of lumbar disc disease, we acknowledge that several limitations exist. The retrospective image study nature, as well as institutionalbased subjects might weaken the strength of the study. Further research with normal vol-unteers might better clarify the definite feature of lumbar disc disease.
Authors’ contributionsHQW and JZ conceived the study. JZ, FLW and HQW analyzed the MRI images. JZ, FZ, YFY, CZ, YC, YLW, XJS, MZ, MQL, CGZ sub‑grouped and analyzed the data. FZ and YW statistically analyzed the data. JZ and HQW drafted the manu‑script. All authors read and approved the final manuscript.
Author details1 Department of Orthopaedics, Baoji Municipal Central Hospital, Baoji 721008, Shaanxi Province, People’s Republic of China. 2 Department of Orthopaedics, Xijing Hospital, Fourth Military Medical University, 127 Changle Western Road, Xi’an 710032, People’s Republic of China. 3 Department of Orthopaedics, The Third Hospital of PLA, Baoji 721004, Shaanxi Province, People’s Republic of China. 4 Brigade of Undergraduates, Fourth Military Medical University, Xi’an 710032, People’s Republic of China. 5 Department of Health Service, School of Public Health, Fourth Military Medical University, Xi’an 710032, People’s Republic of China.
AcknowledgementsThis work was supported by Chinese National Natural Science Foundation Grants Grant Number (Nos. 81270028, and 81572182).
Competing interestsThe authors declare that they have no competing interests.
Received: 11 June 2016 Accepted: 7 November 2016
ReferencesArpinar VE, Rand SD, Klein AP, Maiman DJ, Muftuler LT (2015) Changes in perfu‑
sion and diffusion in the endplate regions of degenerating intervertebral discs: a DCE‑MRI study. Eur Spine J 24:2458–2467
Balaji VR, Chin KF, Tucker S, Wilson LF, Casey AT (2014) Recovery of severe motor deficit secondary to herniated lumbar disc prolapse: is surgical intervention important? A systematic review. Eur Spine J 23:1968–1977
Chen YF, Zhang YZ, Zhang WL, Luan GN, Liu ZH, Gao Y, Wan ZY, Sun Z, Zhu S, Samartzis D, Wang CM, Wang HQ, Luo ZJ (2013) Insights into the hallmarks of human nucleus pulposus cells with particular reference to cell viability, phagocytic potential and long process formation. Int J Med Sci 10:1805–1816
Fardon DF, Williams AL, Dohring EJ, Murtagh FR, Gabriel Rothman SL, Sze GK (2014a) Lumbar disc nomenclature: version 2.0: recommendations of the combined task forces of the North American Spine Society, the American Society of Spine Radiology and the American Society of Neuroradiology. Spine J 14:2525–2545
Fardon DF, Williams AL, Dohring EJ, Murtagh FR, Gabriel Rothman SL, Sze GK (2014b) Lumbar disc nomenclature: version 2.0: recommendations of the combined task forces of the North American Spine Society, the American Society of Spine Radiology, and the American Society of Neuroradiology. Spine 39:E1448–E1465
Fu MC, Buerba RA, Long WD 3rd, Blizzard DJ, Lischuk AW, Haims AH, Grauer JN (2014) Interrater and intrarater agreements of magnetic resonance imag‑ing findings in the lumbar spine: significant variability across degenera‑tive conditions. Spine J 14:2442–2448
Jarman JP, Arpinar VE, Baruah D, Klein AP, Maiman DJ, Tugan Muftuler L (2015) Intervertebral disc height loss demonstrates the threshold of major pathological changes during degeneration. Eur Spine J 24:1944–1950
Jensen TS, Karppinen J, Sorensen JS, Niinimaki J, Leboeuf‑Yde C (2008) Ver‑tebral endplate signal changes (Modic change): a systematic literature review of prevalence and association with non‑specific low back pain. Eur Spine J 17:1407–1422
Kazezian Z, Gawri R, Haglund L, Ouellet J, Mwale F, Tarrant F, O’Gaora P, Pandit A, Alini M, Grad S (2015) Gene expression profiling identifies interferon signalling molecules and IGFBP3 in human degenerative annulus fibro‑sus. Sci Rep 5:15662
Lagerback T, Elkan P, Moller H, Grauers A, Diarbakerli E, Gerdhem P (2015) An observational study on the outcome after surgery for lumbar disc hernia‑tion in adolescents compared with adults based on the Swedish Spine Register. Spine J 15:1241–1247
Le Maitre CL, Frain J, Millward‑Sadler J, Fotheringham AP, Freemont AJ, Hoyland JA (2009) Altered integrin mechanotransduction in human nucleus pulposus cells derived from degenerated discs. Arthritis Rheum 60:460–469
Li XK, Wu ZG, Ding T, Wang HQ (2015) Revisiting the nomenclature and grading schemes for disc degeneration: issues to be solved. Spine J 15:2594–2595
Maatta JH, Karppinen JI, Luk KD, Cheung KM, Samartzis D (2015) Phenotype profiling of Modic changes of the lumbar spine and its association with other MRI phenotypes: a large‑scale population‑based study. Spine J 15:1933–1942
Modic MT, Masaryk TJ, Ross JS, Carter JR (1988) Imaging of degenerative disk disease. Radiology 168:177–186
Pfirrmann CW, Metzdorf A, Zanetti M, Hodler J, Boos N (2001) Magnetic resonance classification of lumbar intervertebral disc degeneration. Spine 26:1873–1878
Pirvu T, Blanquer SB, Benneker LM, Grijpma DW, Richards RG, Alini M, Eglin D, Grad S, Li Z (2015) A combined biomaterial and cellular approach for annulus fibrosus rupture repair. Biomaterials 42:11–19
Racoosin JA, Seymour SM, Cascio L, Gill R (2015) Serious neurologic events after epidural glucocorticoid injection: the FDA’s risk assessment. New Engl J Med 373:2299–2301
Roberts S, Evans H, Trivedi J, Menage J (2006) Histology and pathology of the human intervertebral disc. J Bone Joint Surg Am 88(Suppl 2):10–14
Samartzis D, Karppinen J, Mok F, Fong DY, Luk KD, Cheung KM (2011) A population‑based study of juvenile disc degeneration and its association with overweight and obesity, low back pain, and diminished functional status. J Bone Joint Surg Am 93:662–670
Schneiderman G, Flannigan B, Kingston S, Thomas J, Dillin WH, Watkins RG (1987) Magnetic resonance imaging in the diagnosis of disc degenera‑tion: correlation with discography. Spine 12:276–281
Song YQ, Karasugi T, Cheung KM, Chiba K, Ho DW, Miyake A, Kao PY, Sze KL, Yee A, Takahashi A, Kawaguchi Y, Mikami Y, Matsumoto M, Togawa D, Kanay‑ama M, Shi D, Dai J, Jiang Q, Wu C, Tian W, Wang N, Leong JC, Luk KK, Yip SP, Cherny SS, Wang J, Mundlos S, Kelempisioti A, Eskola PJ, Mannikko M, Makela P, Karppinen J, Jarvelin MR, O’Reilly PF, Kubo M, Kimura T, Kubo T, Toyama Y, Mizuta H, Cheah KS, Tsunoda T, Sham PC, Ikegawa S, Chan D (2013) Lumbar disc degeneration is linked to a carbohydrate sulfotrans‑ferase 3 variant. J Clin Invest
Sun Z, Guo YS, Yan SJ, Wan ZY, Gao B, Wang L, Liu ZH, Gao Y, Samartzis D, Lan LF, Wang HQ, Luo ZJ (2013) CK8 phosphorylation induced by compres‑sive loads underlies the downregulation of CK8 in human disc degenera‑tion by activating protein kinase C. Lab Investig 93:1323–1330
Teraguchi M, Yoshimura N, Hashizume H, Muraki S, Yamada H, Minamide A, Oka H, Ishimoto Y, Nagata K, Kagotani R, Takiguchi N, Akune T, Kawaguchi H, Nakamura K, Yoshida M (2014) Prevalence and distribution of interver‑tebral disc degeneration over the entire spine in a population‑based cohort: the Wakayama Spine Study. Osteoarthr Cartil 22:104–110
Teraguchi M, Yoshimura N, Hashizume H, Muraki S, Yamada H, Oka H, Minamide A, Nakagawa H, Ishimoto Y, Nagata K, Kagotani R, Tanaka S, Kawaguchi H, Nakamura K, Akune T, Yoshida M (2015) The association of combination of disc degeneration, end plate signal change, and Schmorl node with low back pain in a large population study: the Wakayama Spine Study. Spine J 15:622–628
Thaler M, Lechner R, Foedinger B, Haid C, Kavakebi P, Galiano K, Obwegeser A (2015) Driving reaction time before and after surgery for disc herniation in patients with preoperative paresis. Spine J 15:918–922
Page 8 of 8Zhang et al. SpringerPlus (2016) 5:1973
Todd NV (2015) Cauda equina syndrome: is the current management of patients presenting to district general hospitals fit for purpose? A personal view based on a review of the literature and a medicolegal experience. Bone Joint J 97‑B:1390–1394
Wan ZY, Song F, Sun Z, Chen YF, Zhang WL, Samartzis D, Ma CJ, Che L, Liu X, Ali MA, Wang HQ, Luo ZJ (2014) Aberrantly expressed long noncoding RNAs in human intervertebral disc degeneration: a microarray related study. Arthritis Res Ther 16:465
Wang HQ, Samartzis D (2014) Clarifying the nomenclature of intervertebral disc degeneration and displacement: from bench to bedside. Int J Clin Exp Pathol 7:1293–1298
Wang HQ, Yu XD, Liu ZH, Li XK, Luo ZJ et al (2010) Human nucleus pulposus cell cultures and disc degeneration grading systems: comment on the article by Le Maitre et al. Arthritis Rheum 62:301–302
Wang HQ, Yu XD, Liu ZH, Cheng X, Samartzis D, Jia LT, Wu SX, Huang J, Chen J, Luo ZJ (2011) Deregulated miR‑155 promotes Fas‑mediated apoptosis in human intervertebral disc degeneration by targeting FADD and cas‑pase‑3. J Pathol 225:232–242
Yoshihara H, Yoneoka D (2015) National trends in the surgical treatment for lumbar degenerative disc disease: United States, 2000 to 2009. Spine J 15:265–271
Younes M, Bejia I, Aguir Z, Letaief M, Hassen‑Zrour S, Touzi M, Bergaoui N (2006) Prevalence and risk factors of disk‑related sciatica in an urban population in Tunisia. Joint Bone Spine 73:538–542