Embed Size (px)
Citation preview

1
Identification of Key Factors of Retention of GED/HSED Students at
Chippewa Valley Technical College
By Molly Alm Craker
A Research Paper
Submitted in Patiial Fulfillment of the
Requirements for the·
Education Specialist Degree
111
Career and Technical Education
( ) Ms. Joan Thomas
The Graduate School
University of Wisconsin-Stout
July, 2010

Author:
Title:
The Graduate School University of Wisconsin-Stout
Menomonie, WI
Craker, Molly A.
Identification of Key Factors of Retelltion of GEDmSED Students at
Chippewa Valley Tecllllical College
Graduate Degree/ Major: Ed.S in Career and Technical Education
Research Adviser: Dr. Carol Mooney
Month/Year: July, 2010
Number of Pages: 65
Style Manual Used: American Psychological Association, 6th edition
Abstract
2
This project aspired to identify strategies to help retain GED/HSED students at Chippewa Valley
Technical College (CVTC) in Eau Claire, Wisconsin. The study addressed questions regarding
why students dropped out of high school, why they attempted to earn their GED/HSED, and
what factors made them succeed or fail in their goal. This study also examined demographic
trends of local GED/HSED students in comparison to state and federal statistics. The students
were adults who attended the GED/HSED orientation in November of2009. The project
involved contacting students either through face-to-face interactions while the student was in
class or through the telephone if a student stopped attending class. When contact by phone was
not successful, letters were mailed to the student. The interventions were successful and
provided a 78 percent retention rate compared to a similar group that did not receive
interventions and obtained only a 26 percent retention rate. This suggests that personal contact
by an instructor on a regular basis does improve retention rates of GED/HSED students.

The Graduate School University of Wisconsin-Stout
Menomonie, WI
Acknowledgements
I would first like to thank Dr. Carol Mooney for her insight, direction, and guidance
throughout this project. I would also like to thank Dr. Pamela Holsinger-Fuchs and Ms. Joan
Thomas for serving as members of my research committee. Finally, I would like to thank my
loving husband, Eric, who provided me the encouragement to recognize that I could complete
this goal.
3

4
Table of Contents
......... ... ... ... .. . ...... . ................................................................................. Page
Abstract .......................... ...... . .. ........ ......... ........ ..... .................................... 2
List of Tables ................................................... . ... ............... .. ............. ... ... . ... 6
List of Figures .................. . ....... .. ......... .. . . . . .. .. ......... ..... . ... ........... .. .... . ........... 7
Chapter I: Introduction ......................... ... ............... .... .. .. . ........... ....................... 8
Statement of the Problem .......... .. . . ............. .. . .. . . ............. .. ... ............ ... . ... 10
Definition of Terms .............................................. . ............. .. . .. . . ........... 11
Limitations of the Study ........................................................................ 12
Assum pti ons ..... . ............... .... . . ... . ....... ... ..... ... .... . .. .. ................ .. .......... 12
Chapter II: Literature Review ... .................................. . .......... . ........... ... . .. ........... 14
Reasons Students Drop Out of High School.. ......................................... ...... . 14
History of the OED . .... .......... ....... .......... ..... ........ ... ... . .......................... 15
Reasons Students Drop Out of High School Equivalency Programs ...................... 18
Economic Effects of Obtaining a OED ............ .. ......................................... 19
Demographics of OED Students ........ ......... .............. ... ................. .. ............ 21
Previous Attempts to Improve Retention ofOED/HSED Students ....................... 22
Summary ............ . . .... ............. .. ............ . .. .... ............ . ... ... ........... ....... . 24
Chapter III: Methodology ......................... .... . ..... ............ .. ............. .. ................. 25
Research Design .................................................................................. 25
Population/Sample .... . . . ............ ..... ............. ..... ........ . .... .. . . ................... 26
Instrumentation .............. . . .. ............ . . ... ............. ...... ................... .. ........ 27
Data Collection Procedure .......... . . ... .............. ... .............. .. .................. .. .. 28
Data Analysis ...... .. .................................. ........ ........ ... .... ... . .... ..... .... ..... 28
Chapter IV: Results .. . .... .......... . . .. .............. .. . .... ................ .. .............. ...... ....... 30

5
Factors that Contributed to a Student Not Earning their High School Diploma ......... 31
Decisions to Begin a GED/HSED program ................................................... 34
Factors that Contributed to a Student's Ability of Earning a GED/HSED ............. .. 37
Factors that Contributed to a Student's Decision Not to Complete their GED/HSED .39
Demographics ..................................................................................... 41
Comparisons ........................... . .................................... .... .................. 48
Summary ...................................... . ................................................... 50
Chapter V: Discussion ........ ........ . .. ... .. ....... ....... .. ... ......... ........ . ... . ............ ......... 52
Summary ........................................................................................... 53
Conclusions ............... .. ................ .. .............................................. .... ... 54
Recommendations ............................................................................... 55
Dissemination Plan ............................................................................. . 56
References ............................................ ... . ... ................ ..... .......................... 57
Appendix A: Initial Survey ............................. .... ............................................. 61
Appendix B: Student Contact Form ............................................................... ... .. 62
Appendix C: Student Letter .............................................................................. 63
Appendix D: Consent to Participate in UW-Stout Approved Research .......................... 64

6
List of Tables
Table 1: Completed GED Tests for the October Orientation Group .......... ..... ... .... ..... 27
Table 2: Survey Responses ........................................................................... 31
Table 3: T ABE Scores .............................................. ..... .. .............. .............. 32
Table 4: 'Other" Reasons Students Dropped out of High SchooL .............................. 34
Table 5: Decisions to Begin A GED/HSED Program .................... . ...... . ................. 37
Table 6: Completed GED Tests ............................... . .. .. .. .... ....... ......... ............ 39
Table 7: Decisions Not to Complete Their GED/HSED ................ .. . . ..................... .41
Table 8: Ethnicity ...................................................................................... 42
Table 9: Single Parent Status ............................................ ... ......... ................ .43
Table 10: Highest Grade Completed ............................................................... .43
Table 11: Citizenship .................................................................................. 44
Table 12: Marital Status ............................................................................. .44
Table 13: Work Status ...................................................................... ......... .45
Tablel4: 2009 HHS Poverty Guidelines ............................................. . .... ......... .46
Table 15: Economically Disadvantaged .................................................. ...... ... .47
Table 16: Comparison of Completed GED Tests ................................................. 50

7
List of Figures
Figure 1: Number of GED Test Takers by year, 1954-2001 ... . . .. . ...... . .. ...... ... .. ... ........ 18
Figure 2: Number of Hours Spent in Class ............................................................ 38
Figure 3: Comparison of Demographic Information between October and November GED
Orientation Groups ........................................................................... 48

8
Chapter 1: Introduction
Most people who possess a high school credential take it for granted; however, those who
do not have this credential often believe it is an unobtainable goal. The 2000 census indicates
that more than 40 million adults in the United States do not have a high school diploma. In
Wisconsin for the 2005-2006 school year, only 82 percent of students graduated from high
school with a regular diploma in four years (Alliance, 2009). Yet, between 2001 and 2005, only
2.2 million of those 40 million people actually received a high school credential by passing the
General Educational Development (GED) exams (Gopalakrishnan, 2008). People without a high
school credential have limited employment options, therefore, greatly reducing their earning
potential. "Approximately 50 % of welfare recipients do not have a high school diploma nor a
GED" (Cope, Ziegler, & Brian, 2001, p. 3). This leaves the high school dropout struggling to
provide a decent standard of living for themselves and their families. For people who do manage
to secure employment without a high school diploma their jobs tend to be umewarding, dead
end, and tedious. In Wisconsin, the earning gap between a high school graduate and a dropout is
nearly $10,000 annually (Alliance, 2009).
Many factors contribute to students dropping out of high school. Jerald (2006) indicates
that the dropout rate was attributed to economic factors, such as familial income, parental
support, and the adult responsibilities teenagers often assume such as single parenting and
working rather than going to school. He also believes that failure to achieve proficient reading
and math levels contributes to a student's decision not to finish high school. Other factors that
contribute to students dropping out of school include disabilities, race-ethnicity, absenteeism,
and problems with the law (Alliance, 2007). As described, it is often difficult to determine
exactly why a student drops out of high school because there are so many contributing factors

9
and we depend on self disclosure to collect data.
In Wisconsin there are three ways to obtain a high school credential. One way is to
obtain a General Educational Development (GED) celtificate by passing a test in five different
subject areas: mathematics, reading, writing, social studies, and science. A student could also
choose to get a High School Equivalency Diploma (HSED), which requires passing scores on the
five GED tests in addition to completing coursework in the areas of health, civics, and
employability. A student can meet the health and civics requirements by passing an exam or
completing state approved coursework. Students must complete job search coursework, create a
resume and cover letter, and palticipate in a mock interview to fulfill the employability
requirement. The third option available to Wisconsin residents is to earn high school credit.
This option requires students to obtain a contract between the last high school they attended and
a providing agency. Students must complete 30 hours of coursework for every quarter credit
earned; the coursework can be in any subject area in which the student is deficient. When all
credits are earned, the student will receive a diploma from their original high school (Wisconsin
Legislature, n.d.).
Gopalakrishnan (2008) demonstrated approximately 5.5 percent of adults in need of a
secondary credential earned one. Many students have identified health problems, family
emergencies, or the need for employment as reasons for dropping out of GED programs
(Franl<enburger, 1999). All of these barriers seem like they could be easily conquered if the
student really wanted to complete a program. Perhaps the reason students do not complete the
program is that they do not have the appropriate support they need to obtain their high school
credential. This study aspires to determine what strategies positively impact retention of students
by working with a group of students enrolled in CVTC' s GED/HSED program.

10
Statement of the Problem
Students drop out of high school for a variety of reasons that range from economic
hardships and dysfunctional family situations to a lack of academic skills. Once a student does
not complete their secondary education, research shows it is a very large obstacle to overcome.
Students have the option of "leveling the playing field" with their classmates by obtaining a
GED/HSED. A large number of students begin the initial process of obtaining a GED/HSED,
but the majority does not complete this goal. Maria Kefallinou, the program manager for the
Adult Community Learning Center in Quinsigamond Community College, describes the same
situation at her institution. She states that their ABE/GED program has historically experienced
low retention rates and that students often left the program prior to completing their goals;
furthermore, the students often did not let the staff know they were not planning to return (2009).
In Eau Claire, WI, Chippewa Valley Teclmical College facilitates GED/HSED programs.
Over the last several years, a variety of strategies to increase retention of students emolled in the
GED/HSED program have been implemented. This study aspires to identify strategies that
positively impact the retention of students emolled in CVTC's GED/HSED program.
The research will address the following questions:
1. What factors contributed to a CVTC GED/HSED student not earning their high school
credential?
2. What influenced individuals decisions to begin a GED/HSED program at CVTC?
3. What factors contribute to a student's decision to complete their goal of earning a
GED/HSED at CVTC?
4. What factors contribute to a student's decision not to complete their GED/HSED at
CVTC?

5. Are there trends in the demographics of these high school drop outs?
Definition of Terms
Below are definitions of area specific terms:
Adult Basic Education (ABE). A partially state funded program available to all
community members in the eleven county district that is served by Chippewa Valley Teclmical
College (CVTC). It is a free program to students and provides education in the areas of math ,
reading, writing, employability skills, study skills, computer literacy, and OED/HSED
preparation.
11
Chippewa Yalley Technical College (CYTC), 620 W. Clairemont Avenue, Eau Claire,
WI 54701
General Educational Development (GED). This is a national series of five tests that
includes reading, writing, math, science, and social studies that students must pass to obtain a
OED certificate which qualifies as a high school credential (Burmaster, 2004).
High school credential. A high school credential is a high school diploma, a OED, or a
HSED (Burmaster, 2004) .
High School Equivalency Diploma (HSED). This diploma requires students to pass the
same five national tests as the OED with the addition of meeting three state requirements in the
areas of civics, health, and employability. This is another option for students who wish to earn
their high school credential and it is viewed as equivalent to a high school diploma (Burmaster,
2004).
Student retention is determined by one of the tlu-ee following criteria:
1. A student earns a OED/HSED celiiflcate.
2. A student passes some but not all of the requirements to earn their high school credential

12
they are actively preparing to complete the additional requirements .
3. A student has not yet passed any GED/HSED exams, but they have advanced at least one
grade level as determined by the T ABE.
Test of Adult Basic Education (TABE). A standardized test developed by the McGraw
Hill/Wright Group to determine grade level equivalency for basic skills in the subject areas of
math, reading, and language (CTB/McGraw-Hill, 2009).
Limitations of the Study
The findings of this research are based on a specific case study that includes eighteen
GED/HSED students who attended a GED/HSED orientation at Chippewa Valley Technical
College in Eall Claire, Wisconsin, in November of 2009. The retention results will be compared
to the seventeen students who attended the GED/HSED orientation at Chippewa Valley
Technical College in Eau Claire, Wisconsin, in October of2009. The group of students that
attended the October orientation will not receive any of the interventions that are applied to the
November group as part of this case study. Even though the case study has a relatively small
sample size, based on the collected data, the results can be generalized beyond the scope of this
study.
Assumptions
This case study acknowledges the following assumptions:
1. The TABE tests developed by McGraw-Hill/Wright Group is a valid testing instrument
that accurately measures students ' reading, writing, and math grade levels and accurately
diagnoses specific areas in which the student lacks ability .
2. Students who attend a GED/HSED orientation have intentions of completing the entire
program and receiving a high school credential.

3. Students who do not enter the program with existing academic skills to pass the
GED/HSED exams will receive instruction and remediation to improve their academic
skills.
4 . Students who enter the GED/HSED program at CVTC have equal access to the same
instructors and supplies.
13

14
Chapter II: Literature Review
Reasons Students Drop Out of High School
Many factors contri bute to students dropping out of high school. Brouillette (1999) states
that students identified both external factors and internal feelings as reasons for not completing
their high school education. The external factors included a family'S need for another paycheck,
an unplanned pregnancy, and even threats of violence. The internal feelings that Brouillette
(1999) identifies includes things that are somewhat situational as well: they did not know where
to go to receive assistance or they felt there was no way out of their current situation. "Many
students described alternating between feelings of lethargy and desperation" (Brouillette, 1999,
p. 314). Many of the same external factors were identified by Jerald (2006) in the aJ1icle,
"Identifying Potential Dropouts". It indicates that the dropout rate was attributed to economic
factors, such as familial income, parental support, and the adult responsibilities teenagers often
assume such as single parenting and working rather than going to school.
Golden, Kist, Trehan, and Padak (2005) state that "specific experiences, policies, and
individuals in high schools have a profound impact on students' decisions to leave high school"
(p. 312). There are several studies that use demographics and external factors such as those
identified above but Golden, et. al. (2005) were amazed by the numerous and emotional accounts
of specific high school experiences and challenges. A negative interaction with teachers and
administrators has a profound impact of students' lives. This is reinforced by Schreiner's (2009)
who concluded that increasing student satisfaction in the area of campus climate can increase the
odds of persisting. Campus climate is comprised of a sense of belonging and having positive
experiences with staff members in the institution.
15
History of the GED
The General Educational Development tests were developed for the U.S. Army during
World War II. Many returning service members did not have the high school diploma necessary
to enter college. After World War I, the granting of diplomas was tried but many colleges and
universities opposed the practice. In 1942, the Army selected five tests from the Iowa Test of
Educational Development that focused on everyday life rather than formal academics. From the
beginning, the GED test battery has contained five different exams: writing, reading, math, social
studies, and science. To earn a GED a student must pass a 290-item exam that requires over 7
hours to complete (Boesel, Alsalam, & Smith, 1998).
In the 1940s, GED test takers were mainly veterans and service members, but by 1959
civilian test takers outnumbered service members (Boesel, Alsalam, & Smith, 1998). In the
years immediately following the war, an overwhelming majority of veterans who took the GED
passed it and for examinees who took the test between 1974 and 1995, the median yearly pass
rate was 71.5 percent. Depending on an individual's academic skills, little or no classroom time
may be required (Entwisle, Alexander, & Olson, 2004). Critics charged that passing the tests was
too easy and did not reflect the skills of a high school graduate (Boesel, Alsalam, & Smith,
1998).
The American Council for Education's (ACE) GED Testing Services produces and
administers the tests, its Commission on Educational Credit and Credentials sets the minimum
passing standard. Individual states are free to set their own passing standards for the GED and
awarding credentials as long as it is above the minimum (Boesel, Alsalam, & Smith, 1998). The
GED tests are normed on a random sample of graduating high school seniors, and the passing

16
standard is set so that approximately one third of the sample would meet the passing score
(Tyler,2005).
There have been four generations of OED exams; the original that was released in 1942,
the 1978 series, the 1988 series, and the current series which was released in 2002. In 1997, the
ACE raised the required minimum score. If a student does not receive a passing score on an
exam they are allowed to retake the test. Each year since 1980, between 400,000 and 500,000
individuals have passed the tests and received their OED (Tyler, 2005).
According to the official OED Examiner's Manual (2002), a student can take anyone
OED test three times during any calendar year. This rule is in place because there are three
different versions of each exam. There is no limit to how many times a student can take an exam
in their lifetime but the student does need to repay each time they take an exam. CVTC has
added additional requirements to this re-take policy to ensure best practice. For a student who
needs to re-test, the following rules apply:
1. There is a 90 day waiting period to re-take one of the five OED tests. However, if an
instructor believes that an individual has done an adequate amount of remediation,
this waiting period can be waived. Keep in mind: there are only three forms of the
OED test available each year, so an individual can not attempt the same test more
than three times.
2. There is a 60 day waiting period to re-take Health or Civics, with no exceptions.
Keep in mind: there are only three forms of the OED test available each year, so an
individual can not attempt the same test more than three times (CVTC OED/HSED
Manual, 2009).

17
Funding for the GED exams involves millions of dollars a year. According to Tyler
(2005), in the fiscal year 2000-2001, federal grants to the individual states for adult basic
education programs totaled more than $460 million, and these grants were matched by additional
hundreds of millions of state dollars directed toward adult education. "Approximately 25% of
these funds were targeted to adult secondary education programs that are largely GED
preparation programs provided by public high schools, community colleges, etc ... " (Tyler, 2005,
p.46).
The chatt below illustrates the growth in the number of GED testers from 1954 through
2001. The base in 1954 is about 42,000 and that chart demonstrates a stable increase until about
1963, when the number of dropouts increased dramatically. In 1963, 88,000 attempted the GED
exams; and by 1970 more than 300,000 individuals attempted the GED tests. An additional
factor that led to such a large increase in the number of GED testers in the 1960s is that the
federal government became increasingly involved in the fight against illiteracy earmarking large
amounts of money to be used for ABE programs (Tyler, 2005).

18
1,Oe+06 '
~, c ~
8000DO c· C {j (,' : ) .J ,; ')
~ I' e C
III '.:' ,' :. ;"
'~, ;1 (;. "
I/) ,C
V ...-0 6000DO . , w I:';
(9 4-0 L
U .0
~OOOOO r-G :J Z (;
200000 ','
' , ' t:':
'._' c, :' (~ . ~, rJ :j C ~~ ['.
O ' T-- I I I I I I
1955 1960 1965 1970 1975 1980 1985 1990 1995 2000 Year
FlO. 1 Number of OED Test Takers by Year, 1954-2001.
Source: Tyler, 2005, p. 49
Reasons Students Drop Out of High Schoo) Equivalency Programs
A OED is vital to improve students' lives and the lives of their families. Yet, there are
ample studies that show that the retention rates of these programs are not very high. Several
studies demonstrated that students drop out of OED programs for an alTay of problems or
reasons that affected their absenteeism but very few had to do with academic ability (Jones,
1998). This research is reinforced by Frankenburger (1999) who conducted a survey of students
who stopped attending OED class. He compiled a list of reasons why students stopped
attending. The list identified reasons such as health problems, family emergency, car problems,
employment, etc ... However, no one stated any academic reason for their lack of attendance.
Hayes and Darkenwald' s (1990) indicate that 60 percent of their studied population
identified "external factors" as being barriers that kept students from participating in a OED
program. This was confirmed by Ellsworth, Person, Wellborn and Frost (1991) who classified
their list of external factors into four categories: lack of confidence, family responsibilities,
institutional encouragement, and time. Kist (2005) strengthens this theme by stating that many
of the paliicipants in his study commented on non-academic challenges posed by their family
obligations. He categorizes external factors as: university bureaucracy/logistics, learning to
work with others, and economic and family pressures.
King (2002) conducted a study to determine what barriers to participation in OED
programs existed among high school dropouts. He concluded that detelTents to patiicipation in
OED programs are multidimensional and that an analysis of barriers among subgroups is
necessary to fully comprehend the construct. He did identify family constraints as the primary
, barrier to paliicipating in a OED program.
Economic Effects of Obtaining aGED
19
Caputo (2005) found a significant relationship between educational level and the
correlation to poverty. His study showed that 40.4 percent of high school dropouts who did not
obtain their OED lived in families whose income fell below the poveliy threshold, compared to
22.6 percent of OED recipients and 13.1 percent of conventional high school graduates. In
addition, OED recipients had a higher annual income than high school dropouts by 36 percent
($34, 415 vs. $25, 222). King (2002) identified that 48 percent of the participants in his study
who were without a high school credential repOlied a household income of less than $20,000 per
year.

20
These findings are reinforced in part by Mumane & Tyler (2000) who found that
dropouts with poor academic skills (below 10th grade level) earned 15 percent less than dropouts
with high academic skills (above 10th grade level). They went on to find that when dropouts with
poor academic skills earned their OED, they had the same eaming potential as dropouts without
a OED but left school with high academic skills. Dropouts with high academic skills who
obtained their OED did not demonstrate an improved outcome in the labor market or repolied
income levels (Mumane & Tyler, 2000).
Over the last 20 years, the annual earnings of young adults have declined at rates related
to educational attainment. The high school dropouts, with the least education, are losing ground
most quickly (Boesel, Alsalam, & Smith, 1998). Wages of male OED recipients were 6 to 12
percent higher than male high school dropouts and wages of female OED recipients were up to
13 percent higher than female high school dropouts (Boesel, Alsalam, & Smith, 1998). Mumane
and Tyler (2000) concur with Boesel, Alsalam, & Smith's findings stating that over the last 20
years the economy has been very unfavorable for dropouts. The earnings of male dropouts fell
by 28 percent and the earnings of female dropouts fell by 7 percent in that same timeframe.
Local data indicates that in Wisconsin high school dropouts earn $10,000 less each year
when compared to high school graduates. Dropouts from the class of2008 will cost the state of
Wisconsin almost $3.9 billion in lost wages over their lifespan (Alliance, 2009). It is apparent
that obtaining a OED is financially beneficial; however, all studies indicate a high school
graduate earned more than a OED recipient.

21
Demographics of GED Students
The U.S. Depaliment of Education (2009) repOlied that in the 2005-06 school year, the
United States averaged a high school graduation rate of only 73.2 percent. Fourteen states
achieved graduation rates higher than 80 percent with Wisconsin leading the way at 87.5 percent.
Of those students who did not graduate from high school , but did go on to receive their OED,
49.9 percent of those who were male and 50.1 percent were female. The report also indicates
that the most popular age to complete a OED is between 22-24 years of age. The most
significant statistic is that second generation or higher non-Hispanics are 65 percent more likely
to complete their high school credential than their first generation counterparts.
The U.S. Department of Education's statistics are very similar to King's demographic
findings. King (2002) found that 49 percent of students who obtained their OED were female
while 51 percent was male. He also indicates that the most common age for students to obtain a
OED was 22 years of age with the average age of this population being 18.6. Entwisle,
Alexander, and Olson (2004) also found a nearly 50 to 50 split between males and females.
When broken down by race, they found that African American males were 6 percent more likely
to complete their OED than African American females and nearly the opposite is true with
students who identified themselves as white. White females are 5 percent more likely to
complete their OED than white males.
The Wisconsin Depaliment of Public Instruction (2009), reported that in 2008, 9,660
students completed the entire OED test battery. Unlike the national statistics, only 38 percent of
Wisconsin testers were female and 62 percent male. The repOli also indicated that 26 percent of
the OED testers were white, 10 percent were African American, and 55 percent either refused to

22
specify a race or were not given an appropriate option. In Wisconsin, 20 percent of all recipients
receive their ce11ificate at age 18.
Wisconsin's male dominated GED testing statistics are in direct correlation with the
results Greene and Winters (2006) report that states female students graduate high school at a
higher rate than male students. Nationally, 72 percent of female students graduated, compared
with 65 percent of male students. Interestingly enough, when the data was analyzed by state,
Wisconsin indicated that females are only 5 percent more likely to graduate than their male
counterpat1s.
In 2008, Chippewa Valley Technical College (CVTC) had 229 students completed the
entire GED test battery. Forty-three percent of CVTC' s testers were female and 57 percent were
male. The repo11 also indicates that 67 percent of the examinees were white, less than 1 percent
were African American, and 28 percent either refused to specify a race or weren't given an
appropriate option. At CVTC, the most common age to receive the GED is 18 which constitutes
34 percent of all recipients (Wisconsin, 2009).
Previous Attempts to Improve Retention of GEDIHSED Students
Many different strategies have been used to improve retention of students in GED/HSED
programs with varying success rates. GED preparation courses come in various formats that
include online, open labs, and traditional classes. The studies identified below include
information about retention projects for GED preparation classes that occurred in either the open
lab or traditional classroom format.
Frankenburger (1999) reports that the Pennsylvania Department of Education conducted
a study where students who attended at least one GED class but then stopped attending class

23
were contacted. Students were first contacted by telephone and then through the mail. Students
who were personally contacted had a 25 percent return rate of at least one class
period (Frankenburger, 1999).
Jones (1998) conducted a similar study to increase retention rates by interviewing
students upon entry of the OED program and identifying reasons why they dropped out of high
school and how it had affected them. Instructors had students write essays in hopes to identify
the reasons students had not succeeded academically in the past. Students were then refelTed to
social services who could assist them as well as build a bond between the teacher and the
students. Students who had patiicipated in interviews and the creative writing assignments,
achieved a retention rate of 82 percent compared to students who did not participate in the
interviews and writing assignments. That group of students only managed a retention rate of 40
percent. Retention was defined as either obtaining their OED or advancing at least one or more
grade levels on the Test of Adult Basic Education (TABE) (1998).
In addition, Kelly (1997) conducted a study attempting to improve retention rates of OED
students by utilizing cooperative learning techniques. She tried to atiificially replicate the
behaviors she observed in her most successful OED class, which was students problem solving
with other students, encouraging each other, building self-esteem, and building their own suppOli
system. "If students invested not only their time, but also attempted personal commitments with
other students in the class, the perhaps completion of the 12-week course would be more
realistic" (p. 4). Kelly's study of cooperative learning effects on OED retention demonstrated a
28.4 percent increase. Yet, in the surveys only 50 percent felt that group work was an effective
tool in learning new material and the students with the lowest attendance records liked this
method of learning the least.

Quinsigamond College in Massachusetts attempted to implement a new "persistence
orientation" to improve the retention of their ABE/GED students (Keffallinou, 2009, p.l 06).
24
The new orientation included questions to stimulate lively discussion regarding motivation and
goals as well as realistic expectations. Counselors at the college regularly visit their classes and
meet one-on-one with students to discuss ball'iers the students were facing and ways to overcome
these barriers. Keffalinou's project had a huge impact on students' completion rates improving
them from 46 to 65 percent (Keffalinou, 2009).
Summary
Literature was reviewed on the following topics: (a) reasons why students dropped out of
high school, (b) history of the GED, (c) reasons why students dropped out of high school
equivalency programs, (d) the economic effects of obtaining a GED, (e) demographics ofGED
students, and (f) previous attempts to improve retention of GEDIHSED students.
Studies proved that students drop out of high school and high school equivalency
programs for many of the same reasons and rarely is it just one reason. It tends to be a
com bination of factors that finally push the student into deciding that they can no longer
continue their education. Various attempts have been made to try to retain GED/HSED students
with varying degrees of success but studies have proven that personal contact does make a
difference.
The GED became an option for United States high school dropouts in 1942 and the
number of people taking advantage of this opportunity has increased steadily since that time
(Boesel, Alsalam, & Smith, 1998). Studies have proven that people who obtain their GED make
more money than high school dropouts that do not earn a high school credential.

25
Chapter III: Methodology
This study aspired to identify strategies that positively impact the retention of students
enrolled in the GED/HSED program at Chippewa Valley Technical College. The objectives of
the study are to show the relationship between personal contact by an instructor and retention
rates of GED/HSED students. The research identified why the students dropped out of high
school, why they decided to begin a GED/HSED program, and what factors contributed to
completing or not completing their GED/HSED. Student demographic information was also
analyzed for trends. The collected data will then be compared to the data of a similar group that
attended the GED/HSED orientation in October of 2009 but received no interventions.
The research addressed the following questions:
I. What factors contributed to a CVTC GED/HSED student not earning their high school
credential?
2. What influenced individuals decisions to begin a GED/HSED program at CVTC?
3. What factors contribute to a student's decision to complete their goal of earning a
GED/HSED at CVTC?
4. What factors contribute to a student's decision not to complete their GED/HSED at
CVTC?
5. Are there trends in the demographics of these high school drop outs?
Research Design
This study utilized both qualitative and quantative methods to collect data. The
researcher used a survey, personal interviews, review of personal daily and permanent folders,
and follow-up phone calls to collect data. Demographic information was collected on a standard,
state-approved intake form. The purpose of this study was to determine whether or not personal

26
contact by an instructor will increase retention rates of GED/HSED students at Chippewa Valley
Technical College in Eau Claire, Wisconsin.
Population and Sample
The researcher studied eighteen adult GED/HSED students who attended an orientation
for the program on November 2,2009. The group included ten males and eight females, and the
students ranged in age from 19 to 54. The students did their GED/HSED preparation work in an
open lab setting at CVTC. This open lab setting allowed students to attend when it was
convenient for them. CVTC's Academic Services department in Eau Claire, Wisconsin, was
open Monday through Thursday from 9:00 a.m. to 7:00 p.m. and on Friday from 9:00 a.m. to
3:00 p.m.
The data collected by the researcher will be compared against the retention of a similar
group of students that attended the GED/HSED orientation in October of 2009. The October
group included nineteen students, eleven male and eight female. The age range was from 18 to
42. The group contained five students who were economically disadvantaged, ten who were
single, and two single parents. None of the students identified any physical, mental, or learning
disabilities. The October orientation group included two people who dropped out of high school
after the ninth grade, two that dropped out after the tenth grade, and the rest dropped out after
completing the eleventh grade. The ethnicity of the group was identified as one member being
of Hispanic descent and the rest of the cohort was white. Three of the students had regular class
attendance and the progress of completed GED tests is listed in Table I below. Two GED
completers and the three students who attended class within the last six months provided a
retention rate of five out of nineteen students or 26 percent.

Table 1
Completed GED Tests For The October Orientation Group
Number of students
Completed I Completed 2 Completed 3 Completed 4 GED test GED tests GED tests GED tests
o o
Instrumentation
Completed their GED
2
Have not taken any GED tests
15
27
The researcher collected the initial data through a survey handed out at orientation regarding
why the student did not complete their high school credential and why the student decided to
stat1 a GED/HSED program (See Appendix A). The survey was chosen as a means to collect
data because it not only provided the researcher with needed information, but it also caused the
students to reflect on two things: (a) why they did not complete their high school credential at
the same time as the rest of their classmates, and (b) why they have chosen to change their lives.
The researcher then conducted an interview, either in person or by phone, featuring a series of
open-ended questions that were designed to gather infOlmation about the progress the
GED/HSED student had made and if obstacles slowed or stopped their progress to identify the
obstacles and to discuss ways to overcome them.
The researcher gathered this information by asking the following questions (See Appendix
B):
1. What progress have you made toward earning your GED/HSED?
2. Why have you stopped attending GED/HSED class?
3. What can you do to be sure you reach your goal?

4. What date to you intend to return to class?
*If student was attending class regularly only ask question # 1, encourage student to
continue, and end the call.
*If student was not attending class regularly, ask all four questions, discuss options,
encourage student to return to class, and then end the call.
The questions were read to the student and their responses were collected by the
researcher on individual "Student Contact Forms" (See Appendix B).
The researcher also frequently reviewed each student's daily folder to verify the reported
progress.
Data Collection
28
The data was collected through an initial survey given to students at their orientation on
November 6, 2009. After the initial survey, data was collected through a personal interview or
monthly phone calls to the student. The researcher read the standardized questions to the student
and recorded their responses. The researcher made three attempts per month to contact the
student; if contact was not made a general letter of encouragement was mailed to the student (See
Appendix C). The researcher tracked the students through the end of May 2010, which was six
months from the orientation date.
Data Analysis
Data analysis for this study entailed collecting data regarding why each individual student
dropped out of high school and why they chose to begin a GED/HSED program.
The data that was collected was examined for similarities that could be grouped into categories.

29
The students were T ABE tested to determine their beginning academic levels. Based on
the information provided by the pre-test, students were given appropriate instruction to build
their reading skills to a level so that they could successfully pass the reading OED exam.
Instruction was delivered on an individualized basis in an open lab that was open 46 hours per
week. Students were encouraged to attend on a regular basis and there was not a limit regarding
how often or how much they could attend. Unfoliunately, there was no recourse if students
chose not to attend or did not attend often enough to make academic gains. After completing the
reading OED exam, students worked on the science and social studies exams as they required
significant amounts of reading. The next exam that students were encouraged to attempt was the
writing exam, which has two parts: (a) a multiple-choice section that tested grammatical
awareness, and (b) a second part that required students to write a five paragraph essay. Upon
completion of the writing exam, students are encouraged to attempt the math OED test. The
math test also has two parts: one that allows the use of a calculator and one section that requires
computations to be done manually.
Once a month, the researcher contacted each participant through a face-to-face interview
when students came into the Academic Services lab or by phone. Information regarding
progress and/or lack of progress was collected through a series of standardized questions. The
data that was collected was then examined for similarities that could be grouped into categories.
Demographic information that was collected on a standardized, state-approved intake
form was then reviewed. The information was examined for trends and compared to local, state,
and nation demographic data.
All collected data was then compared to the progress of a similar OED/HSED cohort that
did not receive any interventions to improve retention.

30
Chapter IV: Results
This study aspired to identify strategies that positively impact the retention of students
enrolled in the GED/HSED program at Chippewa Valley Technical College. The objectives of
this study were to show the relationships between personal contact by an instructor and retention
rates of GED/HSED students. The research identified why the students dropped out of high
school, why they decided to begin a GED/HSED program, and what factors contributed to
completing or not completing their GED/HSED. Student demographic information was also
analyzed for trends. The students involved in this study had their progress analyzed for six
months, and each student had a signed consent form on file (See Appendix D).
The subjects in this study were adults who wished to earn either their GED or HSED
from CVTC in Eau Claire, Wisconsin. The eighteen students whose progress was evaluated
range in age from 19 to 54; ten students were male and the other eight participants were female.
All eighteen students attended the orientation for the GED/HSED program in November of2009.
The orientation class held eighteen pmticipants and was conducted on consecutive Monday and
Wednesday evenings from 4:00 to 7:00 p. m. The first session included filling out entrance
paperwork, examination of credential options, development of a Personal Education Plan, tests to
determine appropriate level of T ABE assessments, tour of the facility, and the writing of a letter
to themselves about the importance of earning their high school credential. The first evening
was facilitated by an instructor and, in this instance, the researcher. The second evening
consisted of T ABE tests conducted at the students' individual ability level in the areas of math,
reading, and language. The second session was conducted by an Instructional Assistant (IA)
from the Academic Services department at Chippewa Valley Technical College.

31
Factors that contributed to a student not earning their high school diploma
The first research question that this study addressed dealt with what factors contributed to
the student not completing their high school credential. This data was obtained through a simple
survey that was conducted during the first session of the student orientation. The survey
question was stated, "Why didn't you finish high school?" The survey provided four answers to
this question: (a) No one cared whether or not you finished high school. (b) Academically it was
too difficult. (c) You needed to get a job to earn money to support your family and/or yourself.
(d) Other- Please explain. Students were allowed to select more than one response. The results
are listed in the table below:
Table 2
Survey Re:,ponses Preset responses
No one cared whether or not you finished high school
Academically it was too difficult
You needed to get a j ob to earn money to support your family and/or yourself
Other- Please explain
Number of students selecting each response
2
5
8
13
Grade level equivalency for each of the eighteen students is listed in Table 3 for the areas
of reading, math computation, and language using a random number to anonymously identify
each student. The grade level equivalency was identified by a decimal number where the first
number indicates the grade level equivalency; the number after the decimal lists the months at
that grade level. For example, a 6.7 grade level equivalency represents a student who was
performing at a 6th grade, i h month ability level (McGraw-Hill, 2006).

32
Student's TABE scores and overall averages are listed in the table below.
Table 3
TABE Scores Reading Grade Level Math Computation Grade Language Grade Level
Equivalency Score Level Equivalency Score Equivalency Score Student 1 10.5 8.8 9.9
Student 2 7.4 5.4 5.6
Student 3 12.9 6.7 12.9
Student 4 3.8 5.0 3.0
Student 5 10.9 8.0 9.5
Student 6 5.4 5.0 4.9
Student 7 2.7 4.6 2.8
Student 8 12.9 7.0 12.9
Student 9 12.9 11.0 12.9
Student 10 8.0 4.3 4.7
Student 11 9.0 7.7 7.5
Student 12 9.0 2.7 8.2
Student 13 12.9 5.5 8.4
Student14 12.9 9.2 11.1
Student 15 11.2 9.7 12.7
Student 16 12.9 7.5 12.9
Student 17 10.7 4.5 7.8
Average 9.2 6.3 8.2

The five students who indicated that they dropped out of high school because it was
academically too difficult averaged an 8.5 grade level equivalency for reading, a 7.0 for
language, and a 6.5 for math computation.
The thirteen "other" responses on the survey are verbatim and anonymously repOlted. They
included the following:
• Racial tensions
• Just wanted out of high school, wanted to work
• Started dating an older man and partied a lot, nothing else mattered
• Home schooled
33
• My mother pulled me out of high school and wanted me to do online school, it wasn't my
choice. Online school wasn't for me and I wasn't able to do sPOlts like I wanted.
• I tried for two years in my own country but I couldn't finish my last year.
• Got a job that paid really well so I wanted to put in more hours and make more money.
School got in the way.
• I got kicked out of private school and tried public school but it didn't work out.
• Didn't want to do the work, just wanted to make money
• Family problems, mom was suicidal
• Got pregnant
• My last year my father went to prison, home life wasn't so great.
• Nobody at home would help me.
• I was rebellious and angry. I thought I was hurting my parents when I really just hurt
myself.

34
The table below illustrates these reasons utilizing the following themes: FamilylRelationship
Problems, WantedlNeeded Money, Bullying, Homeschooledl Change in Schoolsl Foreign
Student.
Table 4
"Other" Reasons Students Dropped auf of High School Reasons Family/Relationship WantedlNeeded Bullying Students Problems Money Dropped out of High School Number of Students
6 3
Decisions to Begin a GED/HSED Program
Homeschooledl Change in
Schools
3
Foreign Student
The second research question that this study addressed dealt with the factors that led
students to decide now was the right time to begin the process of obtaining their GED/HSED.
This information was obtained through a simple survey that was conducted during the first
session of the student orientation. The survey question was open-ended and asked, "Why did
you choose to begin the process of obtaining a GED/HSED now?"
Students were identified by an alphabetic letter to ensure anonymity; verbatim responses
demonstrated the writing abilities of the students. The elTors in spelling, capitalization,
punctuation, and sentence structure were indicative of future challenges students had to address
once they were preparing for the writing pOltion of the GED. The writing exam contained two
parts: a mUltiple choice portion and an essay.
Student A responded: I have two young children that are now in school. I want to set a
good example for them and I now have time to do so. Also, I want to obtain a career as a

35
medical assistant.
Student B responded: I want to get a jobs. Also I want to become a medical assistant. Or
work at the hospital.
Student C responded: I see you can't make it in life without a OED or high school
diploma, and I can ' t continue to go on in my life doing nothing.
Student 0 responded: The job I have was supposed to be secure. Layoffs are becoming
an everyday thing. Hopefully I will be able to find a good paying job with a OED
Student E responded: I got into Autobody repaire and refinishing when I was 17. I have
been doing it ever since. I made really good money but now I'm laid off, and I don ' t want to do
cars for the rest of my life. It is helpful that I've been in the Auto industry for so long! But I
need a OED and would like to take some classes to better my education and get a great job.
Student F responded: To better myself, is why I'm here. To help my self confidence.
Hopefully gain more of an education to get a better paying job. My daughter is in sixth grade,
lord if she graduates before me, I would like to be a better role model.
Student 0 responded: My dad died of cancer January 26-09. Brother-in-law died open
day of fishing 09. Lifes to ShOli not to at least try to be somebody who can be better than what I
am.
Student H responded : I am a father now who is doing construction, who needs to take
charge of his life to become a better parent. I would like to have a career I can't be doing
construction my whole life, I have more potential to be someone special and bring something
special to this world whatever it may be.
Student I responded: To get a better life & good job
Student J responded: I have a family now and need a career.

36
Student K responded: It hard to obtain a job without GED and want to go back to school
to become a mechanic. To suppOli my new family with a kid on the way into the world. So
basically I want to be able to support myself and my family.
Student L responded: I was thinking about it for 3 months, then my work aproached me.
They explained that they would love to advance me but they can't turn down people for the job
that have better qualifications than me.
Student M responded: The option for career's are limited without a GED/HSED and I
want to be what I'm capable of achieving without stops.
Student N responded: I chose now cuz I want to get a better job and be able to do
different jobs an tell people I went an got an education.
Student 0 responded: I need some kind of high school education so I can pursue what I
want to be in this life.
Student P responded: Need one for college
Student Q responded: Having a hard time finding work. and I really want to go back to
school to find a career. That I will and can stick with til I can retire.
Student R responded: Family and girlfriend pushed me
Student S responded: Hit rock bottom and trying to make my life better.
The responses were grouped into three categories: (a) family pressures or the desire to be
a good role model and provider for their children, (b) they wanted to either attend college to get a
better job or just find a better job than they currently have, and (c) they wanted to improve their
life. There are duplicated numbers because students whose responses indicated more than one
category were included in all appropriate areas.
37
Table 5
Decisions To Begin A GEDIHSED Program Decisions to Begin a Family GED/HSED Program
Want to attend college/Get a better
job
Want to improve my life
Number of Students 4 13 7
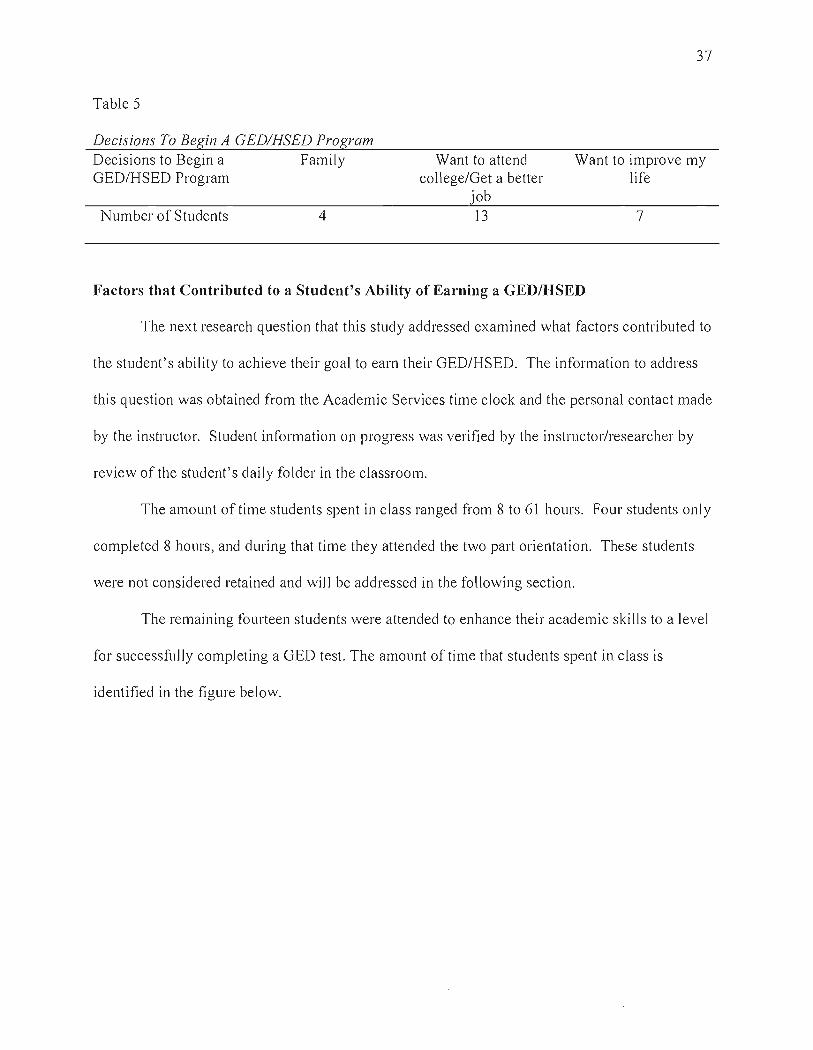
Factors that Contributed to a Student's Ability of Earning a GEDIHSED
The next research question that this study addressed examined what factors contributed to
the student's ability to achieve their goal to earn their GED/HSED. The information to address
this question was obtained from the Academic Services time clock and the personal contact made
by the instructor. Student information on progress was verified by the instructor/researcher by
review of the student's daily folder in the classroom.
The amount of time students spent in class ranged from 8 to 61 hours. Four students only
completed 8 hours, and during that time they attended the two pal1 orientation. These students
were not considered retained and will be addressed in the following section.
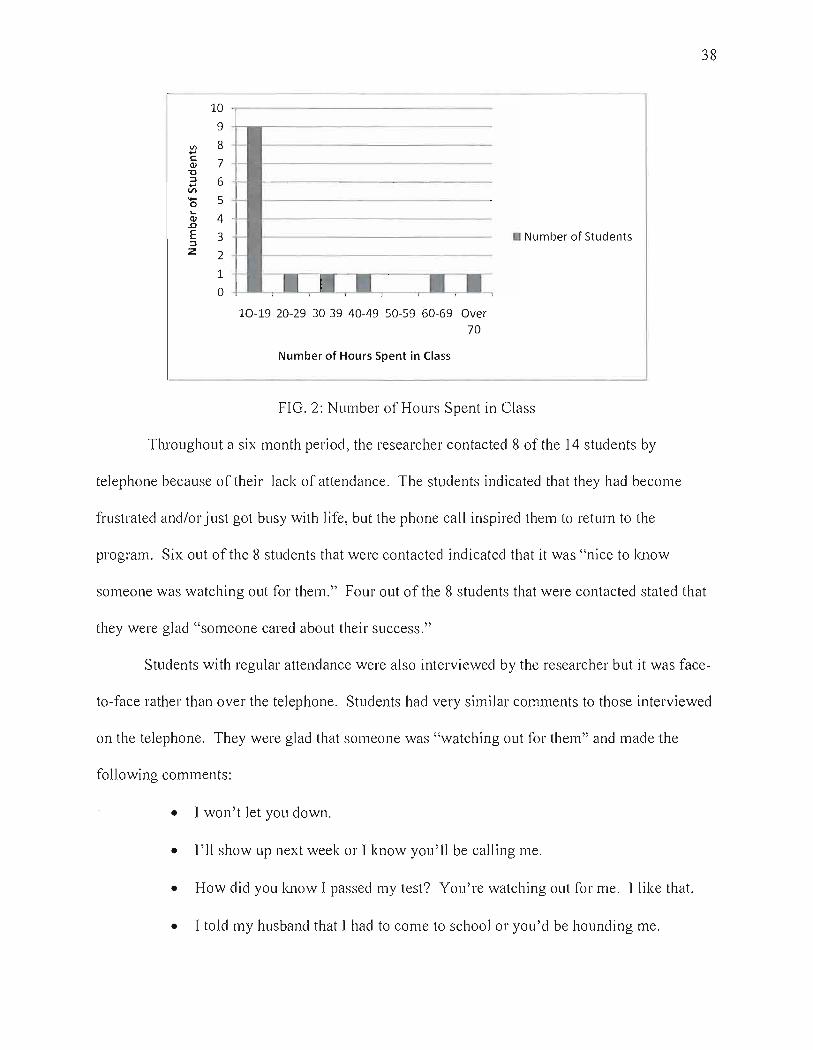
The remaining f01l11een students were attended to enhance their academic skills to a level
for successfully completing a GED test. The amount of time that students spent in class is
identified in the figure below.
Vl .... c: Q) "0 ::J .... Vl .... 0 ..... Q) .!l
E ::J Z
10
9
8
7
6
5
4
3
2
1
0
10-19 20-29 30-39 40-49 50-59 60-69 Over
70
l\Iumber of Hours Spent in Class
Number of Students
FIG. 2: Number of Hours Spent in Class
Tlu'oughout a six month period, the researcher contacted 8 of the 14 students by
telephone because of their lack of attendance. The students indicated that they had become
frustrated andlor just got busy with life, but the phone call inspired them to return to the
program. Six out of the 8 students that were contacted indicated that it was "nice to know
38
someone was watching out for them." Four out of the 8 students that were contacted stated that
they were glad "someone cared about their success."
Students with regular attendance were also interviewed by the researcher but it was face-
to-face rather than over the telephone. Students had very similar comments to those interviewed
on the telephone. They were glad that someone was "watching out for them" and made the
following comments:
• I won ' t let you down.
• I' ll show up next week or I lmow you ' ll be calling me.
• How did you know I passed my test? You're watching out for me. I like that.
• I told my husband that I had to come to school or you'd be hounding me.

39
The researcher also noticed that students were pleased when the instructor/researcher was
present and made it very clear that they wanted to study with the same instructor each week.
They did not work as hard or accomplish as much when a different instructor was scheduled.
The students seemed to form a very strong connection with the instructor who conducted the
orientation.
One student had demonstrated that he or she was both academically and mentally
prepared for several OED tests but had not completed any of the exams. When the researcher
asked about the lack of follow through, the student identified the problem as financial. Each
OED tests costs $15.00 which must be paid prior to taking the exam.
Retention of fourteen out of eighteen students established a 78 percent retention rate.
Table 6 indicates the progress of students who have successfully completed one or more of the
OED tests.
Table 6
Completed GED Tests
Number of students
Completed 1 GED test
Completed 2 GED tests
o
Completed 3 GED tests
3
Completed 4 GED tests
3
Completed their GED
o
Have not taken any GED tests
7
Factol"s that contributed to a Student's Decision Not to Complete their GED/HSED
Four students attended the orientation in November of2009 but have not completed any
coursework to build skills, and they have not completed any of the five OED tests. Attempts
were made to contact each of the four students, and the following information was obtained
through telephone interviews.

40
Student A had only been in the United States for a short period of time (five months) and
even though the ultimate goal was to obtain a GED and then attend college, the student' s English
skills were not at a level where obtaining a GED was a realistic goal. This student was referred
to the English Language Learners (ELL) depaliment at CVTC and had been making steady
progress. For the purposes of this study, Student A was not retained as a GED student but made
significant gains in learning the English language. The student hopes to attempt the GED/HSED
program again in the near future.
Student B achieved very high TABE scores in 2 out of the 3 assessments. UnfOitunately,
all attempted contacts were unsuccessful because the telephone had been disconnected. The
generic form letter (Appendix C) from CVTC's Academic Services department and the personal
letter that this student wrote during orientation had been mailed but no return response was
received.
Student C achieved very high scores on all three T ABE assessments. This student was
homeschooled and had aspirations of attending college upon completion of a GED. During the
telephone contact to this student, the student indicated that he or she had received a new job that
pays well and thus a GED was no longer needed. Student C stated that he or she only wanted to
go to college to get a job that would allow financial independence from parents, and that had
now been achieved. Student C also identified the fact that he or she has no interest in
"pretentious titles or achievements". The student stated that they would not be returning to work
on a GED unless the current job was lost or if obtaining a new one required the credential.
Student D achieved a seventh grade level equivalency or above on all three of the T ABE
assessments, which indicated strong academic skills. This student identified that he or she
wanted to get a GED to prove a point and then to obtain a job. This student also indicated a fear

41
of being laid off from their current position. Upon telephone contact, Student D indicated that he
or she had survived all layoff threats and that business had picked up. The student said this
greatly reduced any determination to obtain a high school credential, but he or she would slowly
continue to work towards the degree. After the student did not return for another month, contact
was again attempted but failed and so the personal letter the student wrote to themselves was
mailed. Telephone contact was again attempted and the student identified that with their current
job, they simply did not have the time to pursue the credential.
The students' responses were grouped into three categories in the table below: (a) The
student is not from this country and did not have the English skills required to pursue a GED, (b)
The student either obtained or retained employment, and (c) The telephone contact information
that the student provided was no longer in service.
Table 7
Decision Not to Complete Their GEDIHSED
Decision Not to Complete their GED/HSED
Number of Students
Demographics
English Language Skills
Obtained or Retained Employment
2
Could Not Contact
Demographic information was obtained through a state approved intake form and was
used in CVTC's client reporting. All information was kept in a personal folder and only CVTC
staff members have access to the information.
The ethnic codes identified in the table were defined by the Wisconsin Technical College
System in the Client Reporting System Users' Guide (2009) as follows :

42
Hispanic-A person of Mexican, Puerto Rican, Cuban, Central or South American, or others
Spanish culture or origin, regardless of race.
American Indian/Alaskan Native- A person having origins in any of the original peoples of
NOlth America, and who maintains cultural identification through tribal affiliation or community
recognition.
Asian- A person having origins in any of the original peoples of the Far East, Southeast Asia or
the Indian subcontinent. This area includes, for example, China, India, Japan, and Korea.
Black- A person having origins in any ofthe black racial groups of Africa.
White- A person having origins in any of the original peoples of Europe, North Africa, or the
Middle East.
Native Hawaiian/Pacific Islander- A person having origins in any of the origins in any of the
original peoples of Hawaii, the Philippine Islands, Guam, Samoa and other Pacific Islands.
The table identified the number of students in the control group that belonged to each
identified category.
Table 8
Ethnicity
Ethnicity Hispanic American Asian Black White Native Client Indian! Alaskan Haw/Pac Refused
Native Islander
Number of 2 0 13 0 1 Students
Students who are unmarried or legally separated and have custody or joint custody of one
or more minor children or who are pregnant may self-identify themselves as a single parent

43
(Client Reporting System Users' Guide, 2009). The table indicates the number of students in the
control group that belong to each identified category.
Table 9
Single Parent Status
Single Parent Yes
Number of Students 4
No
12
Client Refused
2
The table below identifies the last grade each student completed prior to enrolling in
CVTC's GED/HSED pro gram. The 1 i h grade implies successful completion of high school
with the receipt of a diploma (Client Reporting System Users' Guide, 2009).
Table 10
Highest Grade Completed
Highest Grade Below 8th 8th Grade 9th Grade 10th Grade 11 th Grade Completed Grade Number of 0 2 3 12 Students
For both Tables 11 and 12, explanations of the categories are based on the state of
Wisconsin's definitions and are not specifically defined by the Wisconsin Technical College
System. Table 10 indicates the citizenship status and Table 11 identifies the marital status of the
students in the researched group.

44
Table 11
Citizenship Citizenship US Eligible Refugee, Foreign Immigrant Other Client
Citizen Legalized Immigrant Student Refused Alien
Number of 16 1 0 0 0 0 Students
Table 12
Marital Status
Marital Status
Single Married Separated Legally Divorced Widowed Separated
Client Refused
Number of
Students
17 o o o o o
The next table identifies the student ' s employment status at the time of entry into the
GED/HSED program. Employed means that the student is working for compensation and does
not include volunteer activities. Underemployed means that the student is employed either full
or pa11 time but the job duties are materially below his/her qualifications. A dislocated 'rl'orker
was defined as a student who has been terminated or laid off and is eligible for or has exhausted
entitlement to unemployment benefits and the student is unlikely to return to his/her previous
occupation (Client Reporting System Users' Guide, 2009).
45
Table 13
Work Status
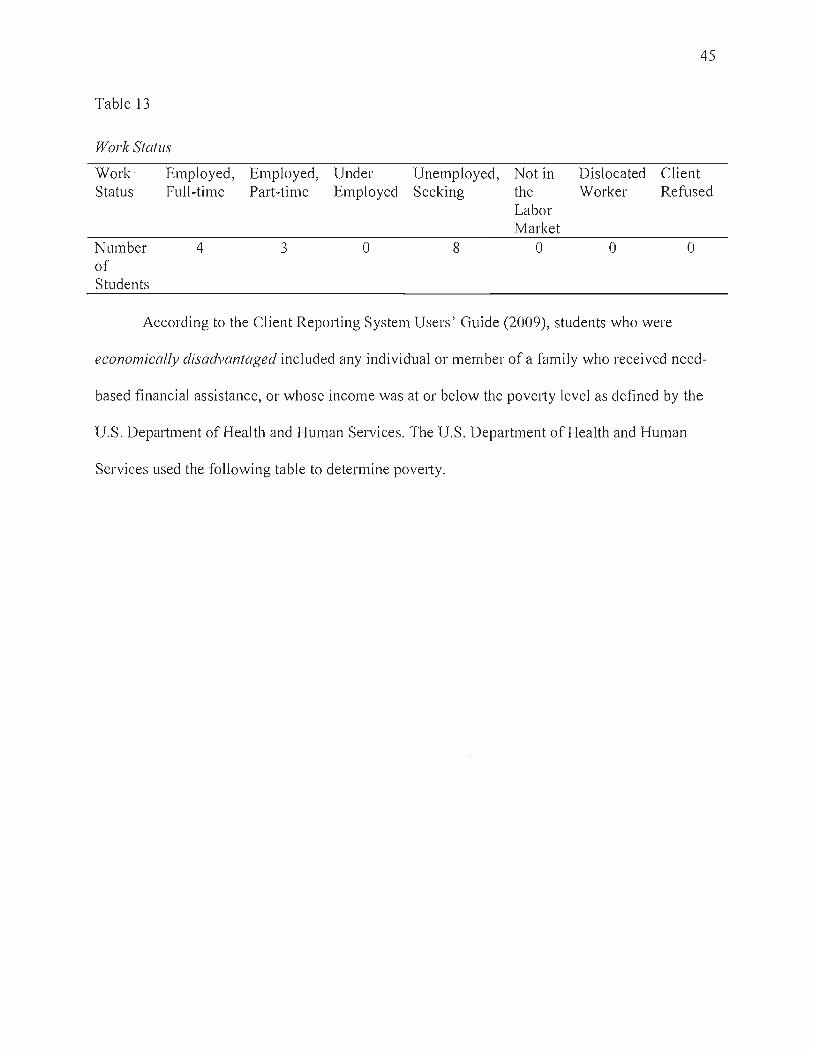
Employed, Employed, Under Unemployed, Not in Dislocated Client Work Status Full-time Part-time Employed Seeking the Worker Refused
Number of Students
4 3 o 8
Labor Market
o o
According to the Client Repol1ing System Users' Guide (2009), students who were
o
economically disadvantaged included any individual or member of a family who received need-
based financial assistance, or whose income was at or below the povel1y level as defined by the
U.S. Department of Health and Human Services. The U.S. Department of Health and Human
Services used the following table to determine povel1y.

46
Table 14
2009 HHS Poverty Guidelines (Annual Income)
Size of Family 48 Contiguous Alaska Hawaii Unit States and D.C.
$10,830 $13,530 $12,460
2 14,570 18,210 16,760
3 18,310 22,890 21,060
4 22,050 27,570 25,360
5 25,790 32,250 29,660
6 29,530 36,930 33,960
7 33,270 41,610 38,260
8 37,0 I 0 46,290 42,560
For each 3,740 4,680 4,300 additional
person, add
Six out of the 18 students (33 percent) who attended the November GED/HSED
orientation of 2009 identified themselves as being economically disadvantaged as defined by the
Depatiment of Health and Human Services. Table 14 indicates the number of students in the
group that are identified as economically disadvantaged.

Table 15
Economically Disadvantaged
Economically Di sadvantaged
Number of Students
Yes
6
No Client Refused
11 1
Students were also asked to identify if they had any documented disabilities such as the
following :
• Deaf
• Deaf-blind
• Hard of Hearing
• Mentally handicapped
• Multi -disabled
• Ol1hopedically impaired
• Other health impaired
• Seriously emotionally disturbed
• Specific learning disability
• Speech or language impaired
• Visually impaired
• Autism
• Traumatic brain injury
47

48
None of the students identified themselves as having any of the above disabilities, and therefore
none of the students were eligible for testing accommodations on their GED/HSED exams.
Comparisons
The demographic makeup of the students who attended the November GED/HSED
orientation was different from the October orientation cohort. The figure below illustrates these
differences in the areas of marital status, economic disadvantage, single parenthood, and sex.
12
III 10 -.... c:: Q)
"C 8 :l .... Vl .... 6 0
-
... Q)
..c 4 E -
:l Z
2 -
1 0
Married
_r
Econ. Disadv.
,-
-L Single Parent
Male
Demographic Categories
• October
November
7'
Female
FIG. 3: Comparison of Demographic Information between October and November GED
Orientation Groups
The two groups varied in age range as well. The October group had members that varied
in age from 18 to 42 providing a 24 year age range. The November group had members that
varied in age from 19 to 54 providing a 35 year range.
The two groups were similar in that the most typical time for a student to drop out of high
school was after completion of the eleventh grade, and the dominant ethnic makeup of both
groups was white. Additionally, none of the students in either group identified any physical,
mental, or learning disabilities.
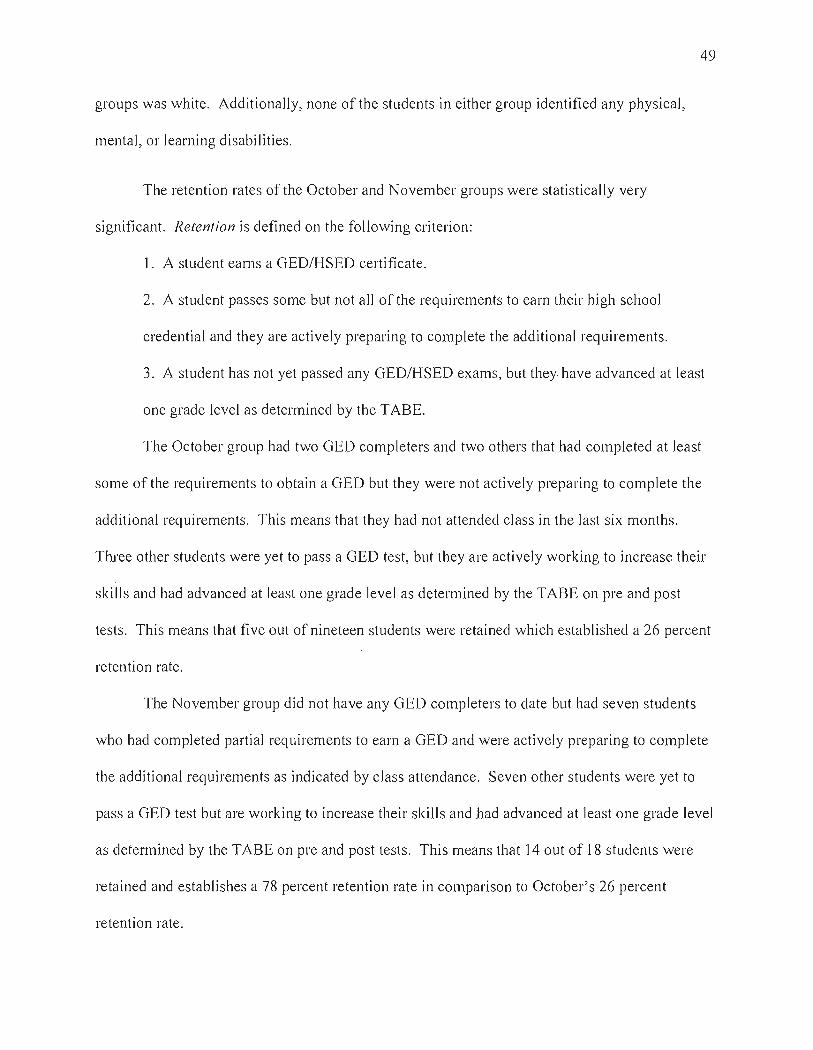
The retention rates of the October and November groups were statistically very
significant. Retention is defined on the following criterion:
1. A student earns a OED/HSED certificate.
2. A student passes some but not all ofthe requirements to earn their high school
credential and they are actively preparing to complete the additional requirements.
49
3. A student has not yet passed any OED/HSED exams, but they have advanced at least
one grade level as determined by the T ABE.
The October group had two OED completers and two others that had completed at least
some of the requirements to obtain a OED but they were not actively preparing to complete the
additional requirements . This means that they had not attended class in the last six months.
Three other students were yet to pass a OED test, but they are actively working to increase their
skills and had advanced at least one grade level as determined by the T ABE on pre and post
tests. This means that five out of nineteen students were retained which established a 26 percent
retention rate.
The November group did not have any OED completers to date but had seven students
who had completed partial requirements to earn a OED and were actively preparing to complete
the additional requirements as indicated by class attendance. Seven other students were yet to
pass a OED test but are working to increase their skills and had advanced at least one grade level
as determined by the T ABE on pre and post tests. This means that 14 out of 18 students were
retained and establishes a 78 percent retention rate in comparison to October's 26 percent
retention rate.

50
The retention rates are statistically very significant and can only be justified through the
success of the interventions, namely the personal contact by the instructor. The groups were
close in number of participants and demographics with the main difference being that he
November group received interventions throughout the six month period of this study and the
October group did not receive any interventions. GED/HSED students are considered an at-risk
group and determination and motivation may get the students to the orientation but persistence
was greatly affected by the contact from the instructor.
Table 16 illustrates the progress of GED test completion between the October and
November orientation groups.
Table 16
Comparison o/Completed GED Tests
Have not Completed Completed 2 Completed Completed Completed taken any 1 GED test GED tests 3 GED tests 4 GED tests their GED GED tests
October 15 0 0 2 Group
November 7 0 3 3 0 Group
Summary
In conclusion, the students dropped out of high school for a variety of reasons that fell
into the following general categories: (a) no one cared about their success, (b) it was
academically too difficult, and/or (c) they needed to earn money to support themselves or their
family. For most students, it wasn't just one of these things but rather a combination of factors
that led them to the decision to drop out of high school. The majority of students dropped out of

51
high school after completing their eleventh grade year and decided it was time to begin a OED
program because of family influences, the desire for a better job, and/or a desire for a better life.
Much like the reasons to drop out of high school, there was rarely one factor that caused students
to try to improve their lives through education.
The students who had decided not to continue the pursuit of their OED had similar
reasons as the students who dropped out of high school with the exception of the foreign student.
The students identified reasons such as the need to work to SUppOit themselves and family. The
foreign student will hopefully attempt to earn a OED after increasing their English language
skills.
The students in the cohort group were very responsive to the personal contact conducted
by the instructor/researcher. The students had much better retention rates than their counterparts
who attended the OED orientation one month prior to the group that received interventions . The
students commented that they felt cared about and wanted to succeed in order to gain favor with
the instructor, leading to a positive educational experience that many of these students have
never experienced.

52
Chapter V: Discussion
The purpose of this study was to identify strategies that positively impact the retention of
students enrolled in the GEDIHSED program at Chippewa Valley Technical College. The
objectives of this study were to show the relationships between personal contact by an instructor
and retention rates of GED/HSED students. The research identified why the students dropped
out of high school, why they decided to begin a GED/HSED program, and what factors
contribute to completing or not completing their GED/HSED. Student demographic information
was also analyzed for trends. The students involved in this study had their progress analyzed for
six months and each student had a signed consent form on file (See Appendix D).
The subjects in this study were adults who wish to earn either their GED or HSED from
CVTC in Eau Claire, Wisconsin. The eighteen students whose progress was evaluated range in
age from 19 to 54, ten students were male and the other eight participants were female. All
eighteen students attended the orientation for the GED/HSED program in November of 2009.
The five research questions this study attempted to answer are the following:
1. What factors contributed to a CVTC GED/HSED student not earning their high school
credential?
2. What influenced individuals decisions to begin a GED/HSED program at CVTC?
3. What factors contribute to a student's decision to complete their goal of earning a
GED/HSED at CVTC?
4. What factors contribute to a student's decision not to complete their GED/HSED at
CVTC?
5. Are there trends in the demographics of these high school drop outs?
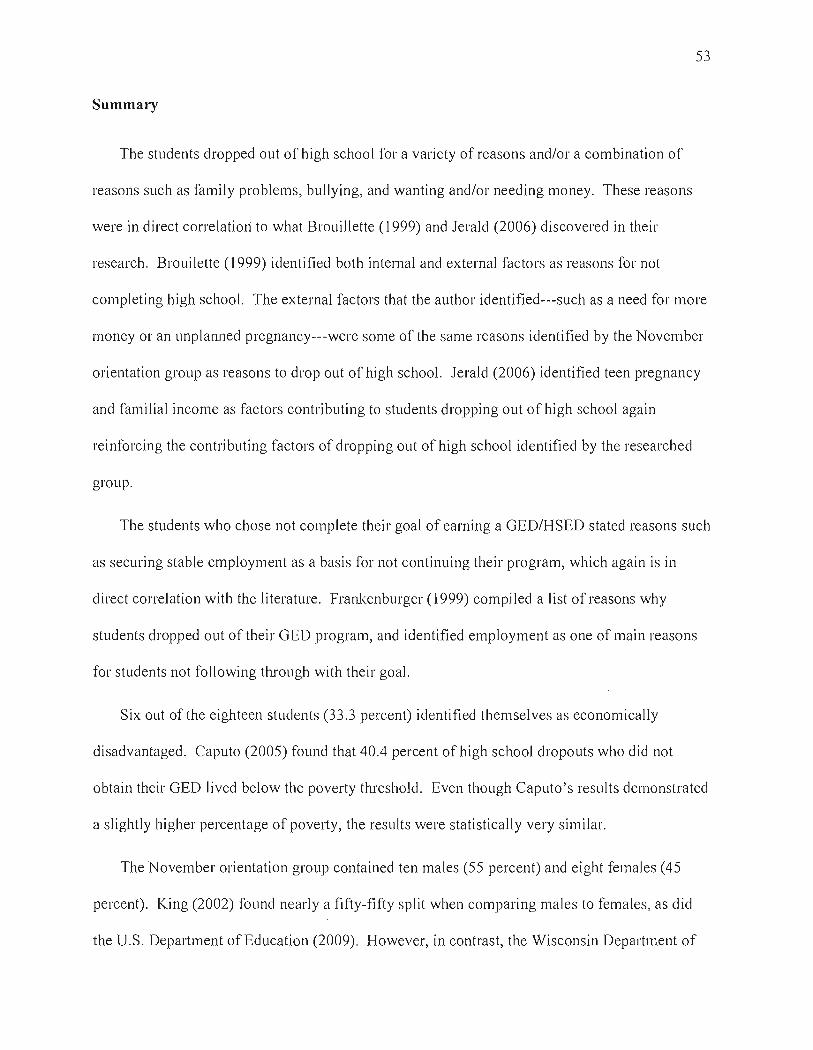
53
Summary
The students dropped out of high school for a variety of reasons and/or a combination of
reasons such as family problems, bullying, and wanting and/or needing money. These reasons
were in direct correlation to what Brouillette (1999) and Jerald (2006) discovered in their
research. Brouilette (1999) identified both internal and external factors as reasons for not
completing high school. The external factors that the author identified---such as a need for more
money or an unplanned pregnancy---were some of the same reasons identified by the November
orientation group as reasons to drop out of high school. Jerald (2006) identified teen pregnancy
and familial income as factors contributing to students dropping out of high school again
reinforcing the contributing factors of dropping out of high school identified by the researched
group.
The students who chose not complete their goal of earning a OED/HSED stated reasons such
as securing stable employment as a basis for not continuing their program, which again is in
direct correlation with the literature. Frankenburger (1999) compiled a list of reasons why
students dropped out of their OED program, and identified employment as one of main reasons
for students not following through with their goal.
Six out of the eighteen students (33.3 percent) identified themselves as economically
disadvantaged. Caputo (2005) found that 40.4 percent of high school dropouts who did not
obtain their OED lived below the povel1y threshold. Even though Caputo 's results demonstrated
a slightly higher percentage of povel1y, the results were statistically very similar.
The November orientation group contained ten males (55 percent) and eight females (45
percent). King (2002) found nearly a fifty-fifty split when comparing males to females , as did
the U.S. Department of Education (2009). However, in contrast, the Wisconsin Department of

54
Public Instruction (2009) reported that in 2008 only 38 percent of the testers were female and 62
percent were male. In 2008 , CVTC repOlied 43 percent of its testers to be female and 57 percent
to be male.
In 2008, CVTC reported that 67 percent of the GED testers were white and thilieen out of
the eighteen (72 percent) researched students identified themselves as white. This is in direct
contrast with state and federal data that repOlied approximately 26 percent white ethnicity. This
makes complete sense when considering that the Eau Claire area is predominately white.
Frankenburger (1999) attempted a similar intervention as this study of contacting students
who stopped attending their GED/HSED preparation courses and found a 25 percent return rate
of students. This study found significantly better results with a retention rate of 78 percent.
Within the last year, CVTC has implemented a much more intense group orientation process
than it had previously utilized. The new orientation is eight hours in length and is spread over
two evenings whereas the previous orientation was approximately three hours in length. We
have found greater dedication and success from our students after implementing this new process .
and this is reinforced by the literature. Keffallinou (2009) implemented a new orientation
process in an attempt to improve retention of G ED students and found that retention rates
increased by 19 percent.
Conclusions
Based on the findings of this study and the alignment with previous studies, the following
conclusions were drawn:
• Students drop out of high school for a variety of reasons that included the following:
family or relationship problems, academically it was too difficult, bullying, wanting

55
or needing money, and not fitting into new school systems.
• Students decided to try to obtain their OED/HSED because of family pressures, they
want to make their life and the lives of their family members better, or they want a
better job.
• Students who did not complete their OED/HSED found stable employment or needed
to improve their English skills.
• Students that are contacted by an instructor have a greater chance of completing their
OED/HSED goals than those that are not contacted.
• Students form an attachment to the instructor that conducts their orientation.
• The typical OED student at CVTC was a single, white person who dropped out of
high school after their eleventh grade year.
Recommendations
Based on the findings and conclusions of this study, the following recommendations are made:
• Students need to have consistent access to the instructor who conducted the
orientation tlu'oughout the program as the student becomes attached to that first
instructor they encounter and want to please them.
• Students need to be contacted on a monthly basis to be sure students know that their
progress is being monitored and that someone cares about their success.
• Attention needs to be paid to bullying at the high school level to reduce the number of
dropouts.
• A mentoring or support program should be developed for high school students to
reduce the number of dropouts due to family and relationship problems.
• A scholarship fund should be developed to assist students in paying for their OED

tests.
• Additional studies should be conducted to determine if open lab or scheduled OED
courses produces higher retention rates.
Dissemination Plan
56
The information gathered from this case study will be shared with other OED preparation
programs within the Wisconsin Technical College System. This information will be distributed
at the beginning of the 2010 school year.
The information from this research will also be shared with CVTC Academic Services
(AS) instructors responsible for helping adults prepare for OED tests. The research-based
interventions described in this research can benefit these students by helping them realize that
their education is important and that people care about their success. This will help them pass
the OED tests, and possibly have the confidence to attempt post-secondary education courses.
Finally, this study will be shared with the Wisconsin DepaJiment of Public Instruction in
hopes to help all Wisconsin citizens in need of a high school credential.

57
References
Boesel , D. , Alsalam, N., & Smith, T. (1998) . Educational and labor market performance of OED
recipients. Retrieved January 27, 2010, from http://www2.ed.gov/PDFDocs/OED/
gedfront.pdf
Burmaster, E. (2004). Opening Doors: High school equivalency Diploma or OED celtificate.
Wisconsin Department of Public Instruction. Retrieved February 1, 2010 from
http://dpi.wi.gov/ged_hsed/pdf/gedhsed.pdf
Brouillette, Liane. (1999). Behind the statistics. Phi Delta Kappan, 81 (4), 313. Retrieved from
Academic Search Premier database.
Caputo, R. (2005). The OED as a predicitor of mid-life health and economic well-being. Journal
of Poverty, 9(4), 73-97.
Cope, O. Ziegler, M., & Brain, D. Tennesse Department of Human Services (2001).
Economic benefits of the OED. Retrieved October 18,2009 from
http://www.c1s.utk.edu/pdf/Economic Beneflts of the OED2.pdf.
CTB/McOraw-Hill. (2009).Tests of adult basic education (TABE). Retrieved March 24, 2010,
from http://www.ctb.com/products/product detail.jsp?FOLDER%3C%3Efolder
id=1408474395247195.
Ellsw011h, P., Pierson, M., Welborn, R., & Frost, C. (1991). Typology of factors that deter
pal1icipation with an educational institution. Journal of Adult Education, 20(1), 15-27.
Entwisle, D., Alexander, K., & Olson, L. (2004). Temporary as compared to permanent high
school dropout. Social Forces, 82(3),1181-1205.
Frankenburger, L. (1999). Contacting GED Students to Raise Retention Rates. N011h East:
Pennsylvania Action Research Network.

GED/HSED Manual (2009). Chippevva Valley Technical College.
General Educational Development (2002). GED examiner's manual for the tests of general
educational development.
Greene, J. & Winters, M.(2006). Leaving boys behind: Public high school graduation
rates. Manhattan Institute for Policy Research. Civic Report, 48.
Golden,S., Kist, W., Trehan, D., & Padak, N. (2005). A teacher's words are tremendously
powerful: Stories from the GED scholars initiatve. Phi Delta Kappa, 87(4), 311-315.
Retrieved from Academic Search Premier database.
Gopalakrishnan, A. (2008). Learner retention in adult secondary education: A
comparative study. Adult Basic Education and Literacy, 2(3), 140-150.
http://search.ebscohosLcom.
Hayes, P. & Darkenwald, G.(1990). Attitudes toward adult education: An empirically
based conceptualization. Adult Education Quarterly, 40 (3), 158-68.
Jerald, C.D. (2006). Identifying potential dropouts: Key lessons for building an early warning
data system. Carnegie Corporation. Retrieved November 22, 2009 from
http://wwvv.achieve.orgifiles/FINAL-dropouts_O.pdf
58
Jones, J. D. (1998). Retention and the GED. National Centerfor the Study of Adult Learning and
Literacy, Volume 2, Issue B.
Kefallinou, M. (2009). The Learner Persistence Project at Quinsigamond. Adult Basic
Education and Literacy Journal, 105-109.
Kelly, M. J. (1997). Will Cooperative Learning Affect GED Retention? North East: Pennsylvania
Action Research Network.

King, Craig. (2002). Barriers affecting OED pmiicipation among recent high school dropouts .
Adult Basic Education, 12 (3), 145-156.
Kist, W. (2005). Non-academic challenges faced by OED scholars: A report of the OED
scholars initiative. Adult Learning, 14(3), 11-13.
Murnane, R., & Tyler, 1. (2000). The increasing role of the OED in American education.
Education Week, 19(34),64. Retrieved January 10,2010, from Academic Search
Premier database.
Schreiner, L. (2009). Linking Student Satisfaction and Retention. Noel-Levitz, Inc. Retrieved
March 20, 2010, from http://www.noellevitz.com
Tyler, 1. (2005). The general education (OED) credential: History, CUlTent research, and
directions for policy and practice. Retrieved April 20, 2010 from
http://www.ncsall.netl?id=778
Wisconsin Department of Public InstlUction (2009). 2008 State"wide and Test Center
Statistical Worksheets.
Wisconsin Technical College System (2009). Client Reporting System Users} Guide.
Understanding High School Graduation Rates in Wisconsin. (2007, July). Retrieved April 18,
2009, from Alliance for Excellent Education:http://www.a1l4ed.org/publications/
wcwclindex
59
Understanding High School Gmduation Rates in Wisconsin. (2009, July). Retrieved November
1,2009, from Alliance for Excellent Education:http://www.a1l4ed.org/files/
Wisconsin_ we.pdf
U.S. Depmiment of Education. National Center for Education Statistics (2009). Dropout rates in
the United States: 2007. Retrieved January 5, 2010, from www.ed.gov/stats.htm

60
Wisconsin Legislature. (n.d.). Retrieved October 27, 2009, from High school equivalency
diploma based on attainment of high school credits. :
http://nxt.legis.state.wi.us/nxt/gateway.dll?f=templates&fn=default.htm&d=code&j d=5.0
6

Name
Appendix A: Initial Survey
This project has been reviewed by the UW-Slout IRI3 as required by Ihe Code of Federal Regulalions Tille 45 Part 46
Initial Survey
Date ------------------------------------- ------------------
Address
61
--------------------------------------------------------------------
Phone ------------------------------ Best time to reach you ____________________ _
Why didn't you finish high school? (Check one)
_____ No one cared whether or not you finished high school
_____ Academically it was too difficult
__ You needed to get a job to earn money to support yourself and/or a family
__ Other-Please explain.
Why did you choose to begin the process of obtaining a GED/HSED now?

62
Appendix B: Student Contact Form
Student Contact Form Name -------------------------
Phone (H) _ ________ _
(C) ________ _
Contact Attempts
Date: Time: ----------------- -------------
Date: Time: ----------------- -------------
Date: Time: ------------------ -------------
Best Time to Call: Letter sent: ----------------- ---------
*If student is attending class regularly, ask question 1, encourage student to continue, and end call.
* If student has not been attending class regularly, ask questions 2-4, encourage student to return, and end call.
Question I: What progress have you made toward earning your OED/HSED?
Question 2: Why have you stopped attending OED classes?
Question 3: What can you change to help you reach your goal?
Question 4: What date do you anticipate returning to OED/HSED class?
Date of first return

Date
Student name Student address Student address
Dear student,
Appendix C: Student Letter
This letter comes to you from your friends in the Academic Services lab. We noticed that you statied the process to earn your GED/HSED within the past year, but have not completed. We would like to invite you to come back to complete this goal.
As you are probably aware, earning your GEDIHSED can open many doors for you. As a GED/HSED recipient you may be eligible to attend a college or university to fUiiher your education. Also, earning your GED/HSED may lead to a better paying job as well as the self satisfaction of knowing you completed something that you statied.
We would welcome the opportunity to once again work with you to achieve your goals . Our spring semester statis on January 16 and our hours will be:
Monday Tuesday Wednesday Thursday Friday
9:00 a.m. to 7:00 p.m. 9:00 a.m. to 7:00 p.m. 9:00 a.m. to 7:00 p.m. 9:00 a.m. to 7:00 p.m. 9:00 a.m. to 3:00 p.m.
63
If you have any questions or your plans have changed, please call us at (715) 833-6400. We look forward to working with you again.
Sincerely,
JIcad'emic Services Staff

Appendix D: Consent to Participate In UW-Stout Approved Research
This projcct has been reviewed by the UW-StoutlRI3 as required by the Code of Federal Regulations Title 45 Pan 46
Title: Identification of key factors of retention of GED/HSED students at Chippewa Valley Technical College
Investigator: Molly Craker Office: BEC 231 Phone: 715-858-1882 [email protected]
Description:
Research Sponsor: Dr. Carol Mooney Phone: 715-232-1444 mooneyc(@,uwstout.edu
64
The study will be conducted on 18 GED/HSED students that attended an orientation at CVTC to begin their program and progress towards their goal of obtaining a high school credential. A survey will be distributed to find out why students dropped out of high school and why they decided now was the time to begin the process of earning their GED/HSED. After the orientation, an instructor will touch base with the student on a monthly basis through personal interviews while the student is in class, phone calls, and/or mail if the student hasn't been attending class. The amount of time each student spends in class as well as student progress will be analyzed to determine why students reach their goal and obtain GED/HSED or what factors attributed to their failure.
Risks and Benefits: The risks involved in this study are very minimal but precautions that will be taken
include: no student names will be used in the report, all data will be presented in aggregate form, all data will be kept in the student's personal folder that is kept in a locked file cabinet, and these students are protected under FERPA. The researcher will provide every reassurance to the students that this study will in no way influence the impression that the instructor has of the student or the education they will receive.
The benefit of this study is that the students will know that their instructor is carefully monitoring their progress and cares about their success.
Time Commitment and Payment: Your progress will be monitored through the end of May 2010 at which time I will use the collected data to create a report. Even though this study will end this in no way will affect the education you will receive.
Confidentiality:

65
Your name will not be included on any documents. We do not believe that you can be identified from any of this information. This informed consent will not be kept with any of the other documents completed with this project in your personal folders that are in a locked file cabinet.
Right to Withdraw: Your participation in this study is entirely voluntary. You may choose not to participate without any adverse consequences to you. Should you choose to pmticipate and later wish to withdraw from the study, you may discontinue your participation at this time without incurring adverse consequences.
IRB Approval: This study has been reviewed and approved by The University of Wisconsin-Stout's Institutional Review Board (IRB). The IRB has determined that this study meets the ethical obligations required by federal law and University policies. If you have questions or concerns regarding this study please contact the Investigator or Advisor. If you have any questions, concerns, or repOlts regarding your rights as a research subject, please contact the IRB Administrator.
Investigator: Molly Craker Office: BEC 231 Phone: 715-858-1882 [email protected]
IRB Administrator Sue Foxwell , Director, Research Services 152 Vocational Rehabilitation Bldg. UW-Stout Menomonie, WI 54751 715-232-2477 [email protected]
Statement of Consent:
Advisor: Dr. Carol Mooney Phone: 715-232-1444 [email protected]
By signing this consent form you agree to paJticipate in the project entitled, Identification of key factors of retention of GED/HSED students at Chippewa Valley Technical College
Signature Date