Embed Size (px)
Citation preview

Final Report
Work Order #10, Contract No. BC-355, UCF acct no. 16-50-7018
IDENTIFICATION OF INTERSECTIONS’ CRASH PROFILES/PATTERNS
Dr. Mohamed Abdel-Aty, PE Associate Professor
Dr. Chris Lee Research Associate
Xuesong Wang Piyush Nawathe Joanne Keller
Smitha Kowdla Hari Prasad
Graduate Students
University of Central Florida Department of Civil & Environmental Engineering
Orlando, FL 32816-2450 (407) 823-5657 SC 345-5657
Fax: (407) 823-3315 email: [email protected]
February 2006

Technical Report Documentation Page 1. Report No.
2. Government Accession No.
3. Recipient's Catalog No. 5. Report Date January 26, 2006
4. Title and Subtitle IDENTIFICATION OF INTERSECTIONS’ CRASH PROFILES/PATTERNS
6. Performing Organization Code
7. Author(s) Abdel-Aty M., Lee C., Wang X., Nawathe P., Keller J., Kowdla S., Prasad H.
8. Performing Organization Report No. 10. Work Unit No. (TRAIS)
9. Performing Organization Name and Address University of Central Florida Department of Civil & Environmental Engineering Orlando, FL 32816
11. Contract or Grant No. 13. Type of Report and Period Covered
12. Sponsoring Agency Name and Address Florida Department of Transportation FDOT Research Center 605 Suwannee Street M.S. 30 Tallahassee, FL 32399-0450
14. Sponsoring Agency Code
15. Supplementary Notes
16. Abstract The approach proposed in this research is to identify the crash profiles for the major intersection types based on geometric/configuration and traffic volume factors combination. In other words, there is a need to first identify the different intersection configurations that are present in Florida. Second, associate these configurations with the different traffic volumes on these intersections. Third, analyze these intersections to identify the crash patterns for each type of intersection. The most extensive data collection effort for signalized intersections in Florida has been conducted as part of this project. Geometric, traffic and crash data were collected for 1562 signalized intersections. Crash profiles for 45 different types of intersections based on configuration and traffic volume have been developed. The 45 intersection crash profiles will be very useful to engineers and would serve as a crash profile manual that could be used as reference values that would assist in identifying intersections with specific problems, e.g., high number of fatal crashes or high number of angle crashes, etc. A practical approach was developed to identify the expected number of crashes based on the total number of lanes which is a surrogate measure for the size of the intersection and volume. This method is simple to apply and could be used in identifying the expected number of crashes by type given that the number of lanes is known.
17. Key Word Signalized intersections, intersection safety, crash profiles, crash patterns, intersection configuration, expected crashes, intersection classification
18. Distribution Statement
19. Security Classif. (of this report)
20. Security Classif. (of this page)
21. No. of Pages 312
22. Price
Form DOT F 1700.7 (8-72) Reproduction of completed page authorized

Disclaimer
"The opinions, findings, and conclusions expressed in this publication are those of the authors and not
necessarily those of the State of Florida Department of Transportation."

- I -
TABLE OF CONTENTS
LIST OF TABLES ..........................................................................................................III
LIST OF FIGURES ........................................................................................................ IV
1 INTRODUCTION..................................................................................................... 1 1.1 BACKGROUND...................................................................................................... 1 1.2 OBJECTIVES AND APPROACH ............................................................................... 2
2 LITERATURE REVIEW ........................................................................................ 4 2.1 INTRODUCTION .................................................................................................... 4 2.2 PREDICTION AND ESTIMATION OF TRAFFIC CRASHES AT INTERSECTIONS ............. 5 2.3 MODELING METHODOLOGIES ............................................................................. 14 2.4 FACTORS INFLUENCING CRASH PATTERNS.......................................................... 21
2.4.1 Red light running behavior ....................................................................... 23 2.4.2 Effect of clearance interval timing and signal phasing ............................ 26
2.5 PEDESTRIAN SAFETY AT SIGNALIZED INTERSECTIONS ........................................ 26 2.6 SUMMARY.......................................................................................................... 28
3 DATA COLLECTION ........................................................................................... 31 3.1 INTRODUCTION .................................................................................................. 31 3.2 DATA COLLECTION............................................................................................ 31
3.2.1 Orange County.......................................................................................... 34 3.2.2 Seminole County ....................................................................................... 37 3.2.3 Hillsborough County................................................................................. 39 3.2.4 City of Orlando ......................................................................................... 41 3.2.5 Brevard County......................................................................................... 42 3.2.6 Miami-Dade County.................................................................................. 43
3.3 SUMMARY OF THE DATABASES.......................................................................... 44
4 CLASSIFICATION ................................................................................................ 47 4.1 CLASSIFICATION OF INTERSECTIONS.................................................................. 47 4.2 SUMMARY.......................................................................................................... 53
5 COMBINING THE DATA .................................................................................... 54
6 TESTS TO COMPARE EACH COUNTY TO THE COMBINED DATABASE 56
7 A SIMPLISTIC PRACTICAL APPROACH TO IDENTIFY TRAFFIC CRASH PROFILES AT SIGNALIZED INTERSECTIONS..................................... 58
7.1 INTRODUCTION .................................................................................................. 58 7.2 DESCRIPTION OF DATA ...................................................................................... 61 7.3 DISCUSSION OF RESULTS ................................................................................... 63
7.3.1 Expected Crash Frequency and Type ....................................................... 63 7.3.2 Injury Severity........................................................................................... 68

- II -
7.4 CONCLUSIONS.................................................................................................... 69
8 NEURAL NETWORK TREES AND SIMULATION DATABASES: NEW APPROACHES FOR SIGNALIZED INTERSECTION CRASH CLASSIFICATION AND PREDICTION.................................................................... 72
8.1 INTRODUCTION .................................................................................................. 72 8.2 LITERATURE REVIEW......................................................................................... 73 8.3 METHODOLOGY ................................................................................................. 75 8.4 USING NEURAL NETWORKS TO IDENTIFY HIGHER RISK INTERSECTIONS........... 79 8.5 CLASSIFICATION OF CRASHES USING NEURAL NETWORK TREES ...................... 86 8.6 CONCLUSIONS.................................................................................................... 91
9 CLASSIFICATION OF INTERSECTIONS INTO 45 CATEGORIES............ 93 9.1 INITIAL CLASSIFICATION INTO 38 CATEGORIES .................................................. 93 9.2 FURTHER CLASSIFICATION INTO 45 CATEGORIES ............................................... 98
9.2.1 Check ‘3x2’ ............................................................................................. 100 9.2.2 Check ‘4x3’, ‘2x4’ and ‘5x2’ ................................................................. 101 9.2.3 Check ‘5x4’ ............................................................................................. 105 9.2.4 Check ‘6x3’ and ‘8x2’............................................................................. 106 9.2.5 Check ‘8x4’ ............................................................................................. 107 9.2.6 Check ‘6x6’ ............................................................................................. 110 9.2.7 Check ‘6xT4’........................................................................................... 111 9.2.8 Summary of suggested added categories ................................................ 113 9.2.9 Remove outlier ........................................................................................ 115
9.3 TABLES FOR THE 45 CATEGORIES..................................................................... 117 9.4 SUMMARY........................................................................................................ 163
10 CONCLUSIONS ............................................................................................... 164
REFERENCES.............................................................................................................. 166
APPENDIX A................................................................................................................ 173
APPENDIX B ................................................................................................................ 188
APPENDIX C................................................................................................................ 204
APPENDIX D................................................................................................................ 223
APPENDIX E ................................................................................................................ 240
APPENDIX F ................................................................................................................ 254
APPENDIX G................................................................................................................ 267
APPENDIX H................................................................................................................ 287

- III -
LIST OF TABLES
Table 3-1 Format of crash database .................................................................................. 33 Table 3-2 Summary of data in all six counties ................................................................. 46 Table 4-1 Classification of intersections into 19 categories ............................................. 50 Table 4-2 Categories of intersections present in each county’s master database ............. 50 Table 4-3 A sample of a classification table for Dade County ......................................... 52 Table 6-1 Comparison of means of each of six counties to the means of the combined six
counties ..................................................................................................................... 57 Table 7-1 Description of crash and intersection data........................................................ 62 Table 8-1 Best neural network models identified for each phase of the analysis method
along with the classification accuracies or the RMSE values................................... 84 Table 8-2 Relationship between the input variables and the frequency of various types of
crashes....................................................................................................................... 86 Table 8-3 List of Significant variables for each branch of the Neural Network Tree ...... 88 Table 9-1 Initial sampling of 2 x 2 intersections based on the AADT/Major Lane values
................................................................................................................................... 94 Table 9-2 Categorizing the intersections based on different AADT/lane for 2x2
intersections .............................................................................................................. 95 Table 9-3 Classification of intersections into 38 types..................................................... 97 Table 9-4 Summary of classifications............................................................................... 98 Table 9-5 Intersection configurations and summary statistics.......................................... 99 Table 9-6 Summary of intersection classification .......................................................... 114 Table 9-7 Summary of intersection classification .......................................................... 116

- IV -
LIST OF FIGURES Figure 4.1 Histogram for Major Roadway AADT Per Lane (vehicles/lane) for 4 x 2
Intersections with a Normal Curve ........................................................................... 47 Figure 4.2 Histogram for Minor Roadway AADT Per Lane (vehicles/lane) for 4 x 2
Intersections with a Normal Curve ........................................................................... 48 Figure 4.3 Histogram for total AADT per lane (vehicles/through lanes) for the entire
intersection for 4 x 2 Intersections with a Normal Curve......................................... 48 Figure 7.1 Relationship between average number of crashes and total number of lanes by
crash types (4-legged two-way intersections)........................................................... 64 Figure 7.2 Relationship between average number of crashes and total number of lanes by
crash types (4-legged one-way intersections) ........................................................... 65 Figure 7.3 Relationship between average number of crashes and total number of lanes by
crash types (3-leggedintersections)........................................................................... 65 Figure 7.4 Comparison of average number of rear-end crashes among the intersection
types .......................................................................................................................... 67 Figure 7.5 Comparison of average number of angle crashes among the intersection types
................................................................................................................................... 67 Figure 7.6 Comparison of injury severity among the intersection types .......................... 68 Figure 8.1 Multi Layer Perceptron Feedforward Network (Christodoulou and
Georgiopoulos, 2001) ............................................................................................... 76 Figure 8.2 Structure of a Probabilistic Neural Network (Chen, 1996) ............................. 78 Figure 8.3 The output for the simulation database indicates that the average number of
crashes per intersection increases with an increase in the number of through lanes on the major roadway..................................................................................................... 85
Figure 8.4 Diagram indicating the prediction accuracies of the Neural Network Tree.... 89 Figure 8.5 Variation of the collision types with Major Speed Limit ................................ 91 Figure 9.1 Crash comparative histograms for intersection type ‘2x2’ and ‘3x2’ ........... 100 Figure 9.2 Crash comparative histograms for intersection type ‘4x2’ and ‘4x3’ ........... 101 Figure 9.3 Crash box plot for intersection type ‘4x2’ and ‘4x3’ .................................... 102 Figure 9.4 Crash comparative histograms for intersection type ‘2x4’ and ‘4x2’ ........... 102 Figure 9.5 Crash box plot for intersection type ‘2x4’ and ‘4x2’ .................................... 103 Figure 9.6 Crash comparative histograms for intersection type ‘4x2’ and ‘5x2’ ........... 104 Figure 9.7 Crash box plot for intersection type ‘4x2’ and ‘5x2’ .................................... 104 Figure 9.8 Crash comparative histograms for intersection type ‘4x4’ and ‘5x4’ ........... 105 Figure 9.9 Crash box plot for intersection type ‘4x4’ and ‘5x4’ .................................... 105 Figure 9.10 Crash comparative histograms for intersection type ‘6x2’, ‘6x3’ and ‘8x2’
................................................................................................................................. 106 Figure 9.11 Crash box plot for intersection type ‘6x2’, ‘6x3’ and ‘8x2’........................ 107 Figure 9.12 Crash comparative histograms for intersection type ‘6x4’ and ‘8x4’ ......... 108 Figure 9.13 Crash box plot for intersection type ‘6x4’ and ‘8x4’ .................................. 108 Figure 9.14 Crash comparative histograms for intersection type ‘8x2’ and ‘8x4’ ......... 109 Figure 9.15 Crash box plot for intersection type ‘8x2’ and ‘8x4’ .................................. 109 Figure 9.16 Crash comparative histograms for intersection type ‘6x4’ and ‘6x6’ ......... 110 Figure 9.17 Crash box plot for intersection type ‘6x4’ and ‘6x6’ .................................. 110 Figure 9.18 Crash comparative histograms for intersection type ‘6xT2’ and ‘6xT4’ .... 111

- V -
Figure 9.19 Crash box plot for intersection type ‘6xT2’ and ‘6xT4’ ............................. 111 Figure 9.20 Scatterplot of crash count vs. major ADT per lane for type ‘6xT2’............ 112 Figure 9.21 Scatterplot of crash count vs. major ADT per lane for type ‘6xT4’............ 112 Figure 9.22 Crash box plot for category 17 and 18 ........................................................ 115

- 1 -
1 INTRODUCTION
1.1 Background
Traffic crashes at intersections result in a huge cost to society in terms of death,
injury, lost productivity, and property damage. It is estimated that close to 40 percent of
crashes occur at intersections or the approach to intersections. In Florida, in 2003, 96,710
crashes occurred at intersections. These intersection crashes resulted in 929 fatalities and
107,429 injuries (extracted from the 2003 Florida crash database). Unfortunately, the
elements that affect the frequency of intersection crashes are not well understood and, as
a consequence, it is difficult to predict the effectiveness of specific intersection
improvements that are aimed at reducing crash occurrence or severity.
Although many studies have addressed the relationship between traffic and
geometric variables and crash frequency or rate, a review of recent literature revealed that
surprisingly few have studied the relationship between approach conditions (geometric
and traffic related) at intersections and crash frequency or rate – with most focusing on
crashes that occur along roadway segments rather than crashes taking place at
intersection approaches. Studies have found that modifications to roadway geometrics are
an important concern because of the strong association between adverse geometric
elements and high-crash locations. Also previous research indicated that the frequency of
collisions is related to the traffic flows to which colliding vehicles belong and not the
sum of the entering flows. However, no studies looked at a specific type of intersections
or related crashes to the traffic flow without considering the different intersection
configuration (geometrics and control). Balancing the competing demands for roadway
improvements is one of the most serious problems facing agencies responsible for

- 2 -
urban/suburban streets. Operating under financial constraints, the traffic engineer is
faced with the problem of choosing between strategies to improve safety or improve on
highway traffic flow. Certain traffic flow improvements may also result in safety
enhancement. Nevertheless, there is little documentation on the interaction between
safety and traffic flow treatments for roadway sections or street intersections.
1.2 Objectives and Approach
From what is presented above, it is clear that roadway geometrics and traffic
volumes are important to assessing crash occurrence at intersections. However, traffic
crashes, particularly at signalized intersection, are very complicated events, and it is
believed that numerous factors affect their occurrence. There is a need to determine
which crash patterns are abnormally high at intersections of different configurations and
traffic levels, and thus effectively develop countermeasures.
It is important before analyzing traffic safety at specific intersections to
understand and define the factors that influence the crash occurrence. This is a difficult
task especially if one considers the large number of different intersection designs. The
problem is even larger if we consider the different levels of traffic volumes that travel
through each identified intersection design. If we add the dimension of different volumes
by maneuver at the intersection (i.e., through, left turn, etc.), this problem would
compound significantly.
Although this is a complicated problem, one has to attempt to understand the
relationship between geometric and traffic characteristics and crashes at intersections.
The objective here is to define the most efficient and realistic approach to address the

- 3 -
problem. Another problem is the lack of understanding of the safety of the different
intersections. In other words, if we have a specific intersection with a certain
configuration and traffic volume, what crash patterns would be considered normal?
Therefore, we can determine which crash patterns are abnormally high at intersections
and thus effectively develop countermeasures. Also, if we propose a change in the
intersection configuration, defined by the number of approach lanes on the intersecting
roadways, e.g., change the intersection from 4x4 to 6x4 (i.e., from 4 lanes on the
approach of the major roadway to 6 lanes), what should we expect from a safety or crash
pattern point of view?
The approach proposed in this research is to identify the crash profiles for the
major intersection types based on geometric/configuration and traffic volume factors
combination. In other words, there is a need to first identify the different intersection
configurations that are present in Florida. Second, associate these configurations with the
different traffic volumes on these intersections, by looking at different volume levels for
the same intersection configuration. Third, analyze these intersections to identify the
crash patterns for each type of intersection.
- 4 -
2 LITERATURE REVIEW
2.1 Introduction A high percentage of highway crashes in the United States occur at intersections.
These crashes result in property damage, lost productivity, injury, and even death.
Identifying intersections with high crash rates is very important to minimize future
crashes. The purpose of most of the studies was to develop efficient means to evaluate
intersections, which may require safety improvements. A comprehensive review of the
literature for intersection crashes is provided here based on five main categories of the
related studies in the past.
Wong and Nicholson (1992) observed that modifications to roadway geometrics
are an important concern because of the strong association between adverse geometric
elements and high-crash locations. Other empirical relationships between vehicle crashes
and highway geometrics have been studied through the use of statistical models to
investigate crash involvement rate, crash probability, geometric design variables critical
to safety, and the crash reduction potential of geometric improvements (Hammerslag et
al., 1982; Okamoto and Koshi, 1989; Shankar et al., 1995). Hauer et al. (1988) estimated
models of safety of intersections based on traffic flow and crash history. A significant
finding of this research was that the frequency of collisions is related to the traffic flows
to which colliding vehicles belong and not the sum of the entering flows. However, this
research as did other research (e.g., Belanger, 1994) first, looked only at a specific type of
intersections, and second related crashes to the traffic flow without considering the
different intersection configuration.

- 5 -
2.2 Prediction and estimation of traffic crashes at intersections
In most of the studies that were conducted, sampling methods were derived and a
sample of each intersection type was taken. Storsteen (1999) located intersections
throughout the state of South Dakota and categorized them by geometric type, stop
control type and traffic volume. The study used crash statistics from 30 intersections for
every type of intersection studied (each type is defined by number of lanes on the
roadway approaches and ADT level below 15,000). Coordinates for the selected
intersections were obtained and crash reports were run. The information was inserted into
a spreadsheet, and the 90th and 95th percentile and mean were calculated. An expected
value analysis table was made for each type of intersection category. There were a total
of 137 intersections for urban, four-leg signalized intersection with volume below 15,000
from this category, and a sample of thirty intersections was taken. The mean and 90th and
95th percentile were calculated and five more intersections were then added and the
calculations were computed again. The difference in the numbers was very insignificant.
This showed that the sampling technique used to create the expected value analysis table
appeared to be a valid and reliable method. The expected value analysis tables would be
very useful in determining if an intersection had an abnormally high number of severe or
fatal crashes. The tables were used in assisting the South Dakota Department of
Transportation in identifying serious safety problems at intersections.
Hall (1992) explored the relationship between roadway congestion and the level
of safety at urban signalized intersections. An extensive study was completed to evaluate
the variation in crash rate that accompanied a change in congestion, as reflected by the
volume/capacity ratio. Approximately 400 signalized intersections in Albuquerque, New

- 6 -
Mexico were selected for analysis. Three years of crash data along with intersection
approach volumes were determined for the identified intersections. In order to determine
the effect of intersection congestion on crash rates, it was deemed necessary to select
solely morning and evening peak-hour crashes for analysis. The first part of the analysis
involved determining the relationship between total entering volume and frequency of
crashes by least-squares regression. The relationship implied that as total entering volume
increased, there was a corresponding increase in crash frequency. When crash rate as a
function of total entering volume was considered, the relationship was weak, but
nevertheless, statistically significantly correlated. Thus it could be concluded that crash
rates increased as the volume of traffic entering the intersection increased. Capacity was
most frequently exceeded for high volume intersections and rarely exceeded for moderate
volume intersections. Also, a relationship between crash rate and congestion, or more
apparently the v/c ratio, was determined. The morning peak hour exhibited a lower crash
rate and v/c ratio than the evening peak. Since this was the case, it was concluded that the
higher v/c ratio of the evening peak hour was directly responsible for an increase in crash
rate. From the developed relationship it was also concluded that minimum intersection
crash rates during peak hour occur for v/c ratios in the range of 0.6 to 0.8.
A study conducted by Brown (1981) also chose a sample size of 30 intersections
to develop a method that would serve as a means of rapidly ascertaining the safety
performance of existing intersections and which, at the same time, was used to predict the
effect of safety performance. From an analysis of the 30 intersections it was found that
over 80% of the crashes that occurred involved two motor vehicles, thus justifying the
restriction of the investigation to this type of crash. The mean crashes per million

- 7 -
entering vehicles was calculated for each conflict point within the 30 intersections. In
order to reduce unnecessary stratification of results and thus produce more values on
which to base the relevant statistics, the conflict points were grouped into similar conflict
types. Thus, based on 120 observations for 30 intersections, the mean value of the crash
rate for each conflict type was estimated, together with the standard deviation and
standard error of the estimated mean. The results indicate that it is possible to predict the
number of two-vehicle crashes at an intersection with a reasonable degree of accuracy. It
would appear that the model would be sensitive to changes in traffic volumes at similar
types of intersections. It is therefore recommended that the crash rates given in the tables
be used to predict crashes at similar types of intersections with similar flow patterns.
Crash rates for similar conflict types at different types of intersection need to be
calculated separately using the same basic model. With these data it would be possible
also to predict the safety ramifications of major traffic management schemes such as
changes in intersection type or alterations in traffic flow, i.e. two-way to one-way
operation.
Hauer et al. (1988) estimated the safety of a signalized intersection on the basis of
traffic flow and crash history. Crashes were divided into collisions involving pedestrians,
single-vehicle, two vehicle, and crashes involving more than two vehicles. Only the two
vehicle crashes were used (81 percent of all the intersection crashes). Patterns in which
two vehicles at a four-legged intersection can collide were classified into 15 types.
Variables were the type of collisions (15 types) and the time of day. They concluded that
Given the traffic flow for a signalized intersection, one can predict how many and what
kinds of accidents should be expected to occur on it.

- 8 -
Sayed and Zein (1999) described the application of the traffic conflict technique
to estimate the traffic safety at intersections. Using the data collected from 94 conflict
surveys, traffic conflict frequency and severity standards for signalized and unsignalized
intersections had been established. An Intersection Conflict Index (ICI) measure was
developed to summarize the conflict risk at intersections. The ICI provides an indication
regarding the relative risk of being involved in a conflict at an intersection. In addition,
regression analysis was used to develop predictive models which relate the number of
traffic conflicts to traffic volume and crashes. The regression analysis results indicated
that: (i) the average hourly conflict rate and the average hourly severe conflict rate
correlated reasonably well with traffic volume for both signalized and unsignalized
intersections, and (ii) strong relationships between crashes and conflicts were obtained
for signalized intersections only.
Weerasuriya and Pietrzyk (1998) developed easy-to-use tables for Florida-based
unsignalized 3-legged intersections. The tables provided mean, variance, and 90th and
95th percentile conflict rates. The number of lanes (instead of traffic volume) was used as
an intersection classification parameter to reduce workloads in field data collection and to
simplify the use of the introduced tables. Three unsignalized 3-legged intersection
categories were identified as a common in the state of Florida. Number of through lanes
of the intersection categories included 2×2, 2×4, and 2×6 (defined by the number of
approach lanes on the two intersecting roadways). Twelve examples of each intersection
type were sampled in five counties (Hillsborough, Manatee, Pasco, Polk, and Sarasota).
After obtaining the list of intersections in the five-county region, using a random sample
technique, 38 intersections were determined. Twelve primary conflict types (11 category

- 9 -
and “other”) were observed and recorded. For the 38 intersections, crashes for the 1992-
94 period were recorded, corresponding to the 12 conflict types. An expected number of
crashes for each conflict type at a given 3-legged intersection type was calculated using
what is called “crash/conflict ratio” and some adjustment factors.
Lau et al. (1988) illustrated an intuitive methodology of developing injury,
property damage only (PDO) and fatal crash models for signalized intersections based on
the Traffic Accident Surveillance and Analysis System (TASAS) in California. They
used classification and regression trees as a building block for developing prediction
models. The proposed methodology included a 3-level prediction procedure with a “tree”
structure for easy interpretations and applications. Macroscopic-type models for injury,
and PDO crashes per year were derived, and the following factors were found to be
significant: traffic intensity, proportion of cross street traffic, intersection type, number of
lanes and left-turn arrangements. Relevant factors for fatal crashes were traffic intensity,
intersection type, and design speed. Based on these results, it was also apparent that the
models derived from the proposed methodology and TASAS provide more intuition and
flexibility than the existing models derived from site observations and crash record
system.
Harris et al. (1968) defined the different types of conflicts at intersections – left
turn conflict, weave conflict, cross traffic conflict, and rear-end conflicts – and presented
a method with which to observe those conflicts at an intersection. At 30 four-way
signalized and unsignalized intersections, three twelve hour observations were taken. The
types of conflicts were identified by means of a break light and weave criterion. The first
two observations were used to observe vehicles, from behind, as they approached the

- 10 -
intersection, in order to observe conflicts defined by the brake light criteria. One
observation was used for each of the two intersecting roads. The third observation was of
vehicles as they entered the intersection, in order to observe conflicts according to the
traffic movement. The observations were made in 15 minute intervals for opposing traffic
directions. The conflict types identified in this study were left-turn, right-turn, through,
weave, rear-end, and red light. This observation technique provided a mean with which to
measure crash potentials at intersections and also to understand the causes of crashes.
Jia and Parsonson (1995) provided a quick and easy-to-use method of identifying
intersections experiencing abnormally high number of crashes. Expected value analysis is
a statistically based method in which the mean and variance of historical crash data were
calculated and used to derive tables of “expected values” of crashes for various types of
intersections. Once the average number of crashes had been established, 90th and 95th
percentiles of crashes were calculated under the assumption that crashes were normally
distributed. If an intersection of interest exhibited crashes greater than the 90th or 95th
percentiles, then the intersection was identified to be experiencing an excessive number
of crashes. Expected value tables for four counties in the Atlanta area were developed.
The analysis included the grouping of intersections into categories based on traffic
control type (signalized or unsignalized), number of approach legs (three or four), and
total entering volume thresholds. As a result of grouping, a total of 17 categories were
developed. In addition, expected values were calculated for collision type, severity,
lighting condition, surface condition, season of the year, day of week, and hour of day.
Wolverton and Mounce (1996) assimilated crash trend characteristics and
established variables of influence and determined significant casual patterns. Crash trend

- 11 -
characteristics were assimilated for the 3-year period of 1992-1994. Crash trends between
Montana’s six largest cities were also investigated. Crash type percentages were similar
for those cities. Crash rates were calculated along the State Primary routes in Montana to
establish variables of influence and significant casual patterns. Twenty-five intersections
were selected for further study, in which crash report files were obtained and collision
diagrams were constructed. From these collision diagrams, relationships were
investigated to determine trends for Montana’s signalized intersections. The variables
that were considered for this study included type of crash, severity, alcohol involvement,
roadway surface conditions, age of drivers and contributing factors. It was found that the
high traffic volume and the population were contributing factors for the crashes. The
largest percentages of crashes were found to be angle and rear-ends, and they were found
to be similar for the six cities.
Najafi et al. (1998) defined a framework to identify the intersection characteristics
so as to develop crash frequency tables with associated statistical qualifiers for the
identification of abnormal crash patterns at various intersection types in Florida. As a
result of the extensive literature search, one final matrix summary was prepared that
included potential crash profile variables. Several factors were used to classify the
different types of intersections: rural/urban, traffic volume, traffic control, intersection
configuration defined by the number of approach lanes on the two intersecting roadways
(e.g., 3 v/s 4 legged, 2×2, 2×4 or larger), protected v/s permitted, number of left-turn
lanes, etc. The variable ‘Design’ was divided into two groups: signalized and
unsignalized. For each of these groups, further divisions were made based on the number
of intersection legs, 4-leg and 3-leg. Next, the variables considering land use (urban and
- 12 -
rural) were considered for each group. The resulting products of this stage were 4
intersection groups that were categorized for both rural and urban design: (i) signalized 4-
leg intersection, (ii) signalized 3-leg intersection, (iii) unsignalized 4-leg intersection, and
(iv) unsignalized 3-leg intersection. The total intersection types turned out to be 76. Fifty
intersections of each type were proposed to be sampled and therefore data was needed for
3,800 intersections. Three years worth of crash data was therefore needed for each of
11,400 intersections. While the framework developed in this study was ambitious, it was
unrealistic to actually collect data for this number of intersection types.
PAB Consultants, Inc. (1997) documented a study that was performed to develop
expected value tables for crash statistics at intersections in Dade County. The resulting
tables provided an “expected value” (or expected value range) for the number of crashes
expected to occur along the State Highway System at an intersection in a year. In this
study, expected values were developed for 13 different intersection types then expected
values for numerous crash statistics were developed. Traffic engineers could use these
values as a “measuring stick” against which to compare a particular intersection’s crash
statistics, to ascertain whether a particular crash statistic appeared likely to be higher than
an expected value, and therefore warranted the investigation of corrective actions. Each
intersection type (of the 13) included 30 intersections, with the exception of three (3). A
spreadsheet template was developed to produce crash statistics for each intersection. The
spreadsheet calculated the mean, standard deviation, and the 90th and 95th percentiles for
each crash statistic contained in the intersection spreadsheets.
These values were calculated assuming that the occurrence of crashes is
reasonably approximated by the normal distribution. The average annual number of right-

- 13 -
angle crashes for 4-legged intersections with total entering volume between 20,000 and
30,000 per day expected was 4.0. The 90th percentile value was seen to be 9.4, which
means that only 10% of such sites had more than 9.4 right-angle crashes per year.
Similarly, only 5% had more than the 95th percentile of 11.7 crashes. An intersection,
with 13 such crashes, was above the 90th percentile and 95th percentile. It stood out
abnormally high, particularly if the 13 crashes were an average of several years of data.
The 13 crashes were so high that it probably could not be attributed to the normal
variation that would be found from intersection to intersection in that volume range.
Instead, it could have been due to an intersection specific problem that might be
correctable. They concluded that additional studies had to be conducted at the
intersection to determine probable causes of the right-angle crash problem and to identify
appropriate countermeasures. The intersection classifications that were used in this study
were:
4 Lane x 2 Lane, Signalized, with Turn Lanes, T-Intersection
4 Lane x 2 Lane, Signalized, with Turn Lanes, 4 Leg Intersection
4 Lane x 2 Lane, Unsignalized, T-Intersection
4 Lane x 2 Lane, Unsignalized, 4-Leg Intersection
4 Lane x 4 Lane, Signalized, with Turn Lanes, T-Intersection
4 Lane x 4 Lane, Signalized, with Turn Lanes, 4 Leg Intersection
4 Lane x 2 Lane, Signalized, with Turn Lanes, 4 Leg Intersection
6 Lane x 2 Lane, Signalized with Turn Lanes, T-Intersection
6 Lane x 2 Lane, Signalized with Turn Lanes, 4 Leg Intersection
6 Lane x 2 Lane, Unsignalized, T-Intersection

- 14 -
6 Lane x 2 Lane, Unsignalized, 4 Leg Intersection
6 Lane x 4 Lane, Signalized, with Turn Lanes, T-Intersection
6 Lane x 2 Lane, Signalized, with Turn Lanes, 4 Leg Intersection
6 Lane x 6 Lane, Signalized, with Turn Lanes, 4 Leg Intersection
2.3 Modeling methodologies
Chin and Abddul-Quddus (2001) examined the relationship between crash
frequencies and the geometric, traffic and regulatory control characteristics of signalized
intersections. A total of 52 four-legged intersections in the southwestern part of
Singapore were used. Crash data from the years 1992 through 1999 (a total of 832
observations - 8yrs * 52 intersections * 2 approaches) were used in the analysis. They
accounted for about 3000 crashes in which 3% were fatal, 5% resulted in serious injuries,
and the rest minor injuries. The random effect negative binomial model was used to
examine a total of 32 possible explanatory variables. Traffic volumes, geometric
elements (approach curvature, sight distance to intersection, road width, median width,
left-turn length on slip roads, distances of up stream and down stream bus stops from
intersection, uncontrolled left-turn lane, exclusive right-turn lane, acceleration section
and the presence of overhead bridge near intersection), and regulatory control measures
(existence of surveillance camera, signal control types and signal timing plan). The
results showed that 11 variables significantly affected the safety at the intersections. The
total approach volumes, the numbers of phases per cycle, the uncontrolled left-turn lane
and the presence of a surveillance camera are among the variables that are the highly
significant (mostly at the 95th significance level). On the other hand, the presence of an
acceleration section and the provision of bus bays as well as the use of adaptive signal
- 15 -
control tend to point to lower total crash occurrence. These findings might, however, be
limited by the relatively small sample size used.
Persaud and Nguyen (1998) supplemented the previous models to estimate safety
performance for signalized intersections. A total of 270 signalized intersections (40 3-
legged, 230 4-legged) maintained by the central and southwestern regions of Ontario
were used in this study. Actual layouts and directional traffic flows were obtained. Ramp
intersections that carry one-way traffic were excluded from the study. Two levels of
models were developed in level 1, equations were calibrated for 3- and 4-legged
intersections by crash severity (injury and PDO) for all impact types combined together
and individually for the three prominent impact types (angle, rear-end, and turning
movement). Models were further disaggregated by time period (daily, weekday morning
peak, and weekday afternoon peak and for 4-legged intersections by environment class
i.e. semi urban, and rural). In level 2, models were estimated for 4-legged intersections
for 12 prominent multi-vehicle and 3 single-vehicle crash patterns defined by the
movements of involved vehicles before collision. Only daily models were calibrated, but
separate models were estimated for the two environment classes. The final models were:
Level 1 and single-vehicle level 2, P = α Sβ
Level 2 multi-vehicle, P = α S1β1 S2
β2
where P is the expected number of crashes of a given type and α and β’s are regression
parameters to be estimated. For level 1, S is the sum of all entering flows for the
corresponding time period. For level 2 single-vehicle, S is the sum of the daily flows, as
appropriate to the crash pattern of interest. For level 2 multi-vehicles, S1 and S2 are
AADT for the smaller and larger conflict flows, respectively.

- 16 -
Vogt and Bared (1998) used Poisson and negative binomial models to study the 3-
legged and 4-legged intersections’ crashes. The data were obtained from Highway Safety
Information System (HSIS) files for the states of Minnesota and Washington. Minnesota
files were for the time period 1985 to 1989 and Washington files for the period 1993 to
1995. Intersections in Minnesota were selected from a population of HSIS observations
divided into four bins, with random selection from each bin. The bins were defined by
median values of mainline traffic and minor road traffic. In the case of Washington, no
HSIS intersection file was available, but an intersection database was developed through
combining video-log information with data provided by the State of Washington. The
results showed that right-turn lanes on the mainline increase the likelihood of crashes at
3-legged intersections. For the 4-legged intersections, fewer crashes result at right-angled
intersections. The worst case was at α = 15 degrees.
Al-Turk and Moussavi (1996) developed a series of regression equations that
could be used to predict the effects of changes in the volume-to-capacity ratio and traffic
volumes on the average number of crashes. This study tried to determine the nature of the
relationship between the degree of congestion, as reflected by the traffic volume to road
capacity ratio, and level of safety at signalized intersections. Variables were crash
frequency, crash type (rear end, left-turn leaving, left-turn entering, cross traffic
collision), volume to capacity ratio, and time of day (a.m., p.m., off peak). Negative
Binomial probability distribution was used since the crash variance was greater than
crash mean for all three crashes categories.
Poch and Mannering (1996) studied the relationship between roadway
geometric/traffic-related elements and crash frequencies at intersections. Four different

- 17 -
crash frequencies were estimated; (i) total crash frequency, (ii) rear-end crash frequency,
(iii) angle crash frequency, and (iv) approach-turn crash frequency. Variables were
traffic volumes (total entering, left, right, opposing), number of lanes (through, through-
right, right turn), signal control (two phase signal, eight phase signal, protected left turn),
and approach speed limit. The analysis uncovered important interactions between
geometric and traffic-related elements and accident frequencies.
King and Goldblatt (1975) established the relationship between crash patterns and
intersection control. The change in crash patterns corresponding to a change in
intersection control was investigated by means of previous studies, before and after
analysis, and statistical analysis of nationwide crash data. The comprehensive database
used in the project was created by the distribution of data forms to traffic engineers
throughout the country. In order to evaluate the impact of intersection control on crash
patterns, they developed ten measures of effectiveness: crash evaluation index, injury and
fatality ratio, rear-end ratio, severity index, right angle ratio, normalized crash total,
volume crash rate, crash disutility, right angle frequency, and right angle crash rate. The
statistical tests performed on the crash data included analysis of variance, multiple linear
regression and hypothesis testing. It was found that intersection signalization reduced the
number of right-angle crashes but increased rear-end crashes.
Yiu-Kuen and May (1987) developed crash prediction models for signalized
intersections on the basis of intersection characteristics (geometric design elements,
traffic control measures, traffic demand patterns, environmental factors, and crash
history). The data used was derived from the Traffic Crash Surveillance and Analysis
System of California. Only injury crashes were addressed because of the different

- 18 -
reporting levels of property damage crashes and rarity of fatal crashes. In order to find an
appropriate derivative of injury crashes for comparison, the data was normalized by time.
A base model was developed, with injury crashes per year as the response variable and
traffic intensity as the predictor variable. The intersections were grouped in order of crash
risk. Three levels of prediction were developed from these models. The power and
logarithm transformation was used to fit the data, and a straight-line relationship was
selected for analysis purposes. Variables were injury crashes, entering traffic, intersection
type, number of lanes, and control type. It was concluded that the proposed methodology
was very suitable for the development of macroscopic models.
Rodriguez and Sayed (1999) developed crash prediction models for estimating the
safety performance of urban unsignalized intersections. The models are developed using
the generalized linear modeling (GLIM) approach that addresses and overcomes the
shortcomings associated with conventional linear regression. The safety predictions
obtained from the models are refined using the empirical Bayes approach to provide more
accurate, site-specific safety estimates. The study made use of sample crash and traffic
volume data corresponding to unsignalized (both 3- and 4-legged) intersections located in
urban areas of the Greater Vancouver Regional District (GVRD) and Vancouver Island,
British Columbia. Four applications of the models are described: identification of crash-
prone locations, developing critical crash frequency curves, ranking the identified crash-
prone location, and before and after safety evaluation. These applications showed the
importance of using crash prediction models to reliably assess the safety of unsignalized
intersections.

- 19 -
Bonneson et al (1993) used a generalized linear modeling approach to develop a
model that links intersection traffic demands and crash frequency. To do this, the SAS
program’s nonlinear regression procedure (NLIN) was applied. Various procedures for
evaluating model fit were used, and the most trust was placed on the prediction ratio
versus expected number of crashes plot. Variables were time period, average daily traffic
(major/minor), environmental (urban/rural), traffic control (signal/sign), intersection
geometry (number of legs, two-lane major Roads with/without median). The models
developed in this study were fit using prediction ratios. The plotted prediction ratio
versus expected number of crashes indicated the amount of dispersion in the models. The
two-way stop-controlled intersections were analyzed, and the form of this model
suggested that the mean crash frequency increases in a nonlinear fashion with increasing
major or minor road demand. The results indicated that a negative binomial distribution
could explain the distribution of the crash counts. Also, the mean crash frequency for the
assembly of similar intersections was found to be gamma distributed.
Worsey (1985) established whether the different crash patterns observed on many
roadway elements comprising two urban routes could be explained, in statistical terms,
by relationships between road and traffic variables. From these relationships regression
equations were developed that could be used to predict crash rates. For the purpose of
distinguishing intersection crash rates, crashes occurring within 20 meters of an
intersection were analyzed. The multiple regression equations obtained in this study were
derived in a stepwise manner, in which an independent variable was added or removed at
each step until addition of further variables gave no improvement in the explanation of
the model. The variables used in this study were the number of legal maneuvers at

- 20 -
intersection, the total number of conflict points at intersection, the number of vehicle
conflict points at intersections, the number of pedestrian/vehicle conflict points at
intersection, the number of lanes entering intersection, and the number of branches at
intersection. It was found that stratifying the intersection crashes first by form of
intersection control and second by intersection alignment, a fairly good statistical
explanation of crashes per vehicle throughout was obtained. The final outcome of this
research was 15 multiple regression equations, which may be used to predict urban crash
rates.
Turner (1998) reviewed models used in practice to relate crashes to traffic flow
with particular emphasis on the appropriateness of the model form and the statistical
analysis technique employed for parameter estimation. The development of generalized
linear models for predicting individual crash types at intersections in New Zealand was
then described. The use of covariate analysis to identify the effect of intersection
location, an investigation of the effect of non-collision flows, and the use of the models
for predicting intersection crashes in three networks were also described. It was
concluded that generalized linear models for estimating different crash types (based on
the conflicting flows) were better than models for estimating total crashes (based on the
approach flows), especially when the cost of different crash types was known. It was also
found that intersection location affects the number of different crash types. It was
important to consider the interactions between turning flows (to take better account of the
mechanisms of crash occurrence) as well as non-collision flows. Comparison of the
predicted and observed numbers of crashes showed that there was poor agreement for
individual intersections, but fairly good agreement for networks.
- 21 -
2.4 Factors influencing crash patterns
Ogden et al. (1997) conducted a study of signalized intersections in Melbourne,
Australia, focusing on the differences in site and operational characteristics between sites
with a "high", "normal" and "low" crash frequency over a 5 year period, 1987-91 based
upon an analysis of crash data and entering traffic volumes. The study indicated that the
majority of the variation in crashes was not explained by traffic volumes, but by other
factors. While no single factor was identified which would lead to a dramatic
improvement in safety at signalized intersections, a range of measures were identified
which would likely contribute to improved safety, if applied at specific sites where
relevant.
Hoque and Anderson (1986) identified the predominant crash types occurring on
the road network in Victoria, Australia. Their study focused on vehicle crashes from
streets and the intersections they occurred at, since they were so prevalent. They
classified intersections into four classes as primary/secondary, primary/local,
secondary/local, and local/local. They used Metro Melbourne data to demonstrate a
technique for determining the performance of road networks by using road class and
crash types. The predominant crash types in the whole network were identified and the
type with the greatest frequency was used to show the phenomenon of clustering at
intersections along the various road classes. The study showed that the higher-level class
of intersections had the higher crash rate. The most frequent crash type was “vehicles
from two streets” which comprised of 17.5% of all crashes and 30% of intersection
crashes. The average number of these crashes at intersections varied according to road
- 22 -
class as follows: primary arterials 1.6, secondary arterials 1.5, collector roads 1.4 and
local streets 1.2 with a network average of 1.5.
Bhesania (1991) summarized the crash statistics and characteristics observed in
Kansas City, Missouri. Intersection crashes, pedestrian crashes, and midblock crashes
were the main focus in this study. Information such as type of collision, severity, and date
and time of occurrence was entered into the database. A total of 11,451 crashes at 3,137
intersections were reported. It was determined that signalized locations experienced the
largest number of crashes when compared to other forms of traffic control. In Kansas
City, the average number of crashes occurring at signalized intersections was 9.6
compared to an average of 2 per year at stop sign or yield-sign locations. The most
frequent type of collision was the right-angle followed by rear-end and left-turn crashes.
It was noted that implementing mast-mounted signal indication, 12-inch signal lenses and
all-red clearance intervals could reduce right-angle crashes at signalized intersections.
Overall, it was suggested that using the crash rate method (physically collecting approach
volume information) and the database method to arrive at a list of high crash locations. A
cut-off point in the number of crashes was then established to identify high-crash
locations requiring further study.
Datta et al. (1990) studied how the installation of traffic signals had been found to
influence crash patterns at intersections. Their paper focused on different studies
conducted at signalized intersections in urban and rural areas. A 1959 study performed at
29 intersections in Michigan demonstrated that the total number of crashes increased by
23%, whereas injuries and fatalities decreased by 20% and 50% respectively. A 1964
study by Clyde analyzed 52 intersections in Michigan. Right-angle crashes decreased by

- 23 -
45% while rear-end, left-turn and other type crashes increased by 98%, 66%, and 46%
respectively. Overall, crashes increased by 33%. In a 1976 Virginia study of 2,301
intersection crashes, rear-end and total crashes also increased as a result of traffic signals.
In general, signalized intersections were found to have higher crash rates, but these were
usually offset by less severity per crash. In all cases, mean crash rates were significantly
different before and after signal installations for all locations.
2.4.1 Red light running behavior
The study of red light running continues to need theoretical and conceptual effort.
It is a behavior that occurs in a very complex environment of an intersection. Many
factors play a role in drivers' decisions to run red or stop at a light, complicating efforts to
increase intersection safety. Even with the need for additional research, it seems clear
from this literature that red light running interventions must increase consequences for
violations. Whether it is with photo enforcement cameras or consistent police
enforcement, programs must find ways to teach drivers that red light running will not be
accepted. Perhaps such programs would also reduce the level of urban-driving frustration.
Without increasing negative consequences, there is no reason to expect red light running
rates will decrease at most intersections in the near future. The dangers of red light
running have led to an increasing interest in understanding people who run red lights
(Porter and Berry, 2000), where and when red light running occurs (Retting et al., 1995),
and what interventions exist to reduce this risky driving behavior (Retting et al., 1999 b,
c). These studies found that red light runners did more than run red lights. They are less
likely to wear safety belts and tend to have more driving violations on their records
(Porter and Berry, 2000).

- 24 -
Retting and Greene (1997) demonstrated that the red-light compliance could be
increased by lengthening yellow signals, and the safety benefits associated with longer
change intervals could be sustained. The results of this study also suggested that
increasing yellow signal length might decrease late exits (vehicles existing the
intersection after the onset of a conflicting green signal). Retting et al. (1999 a) also
found that 3% of all fatal crashes in the US between 1992 and 1996 involved red light
running. Red light running related fatalities increased approximately 15% during this
time period (from 702 in 1992 to 809 in 1996). Perhaps not surprisingly, urban areas are
at greater risk for red light running crashes. Retting et al. (1995) reported that 56% of
urban crashes occurred at intersections and running traffic controls accounted for 22% of
urban crashes. Red-light running is particularly relevant to urban crashes, presumably
because urban areas are more dominated by signal light intersections than other localities.
Retting and Williams (1996) studied the actual driver behaviors at intersections. They
collected demographic data as well. In an eight-week field study at one intersection in
Arlington County, Virginia, They found that 33.6% of 1,373 light-cycle observations
included at least one red-light runner (i.e., defined as entering the intersection after the
light turned red). Violators were more likely to be under 30 years of age with poorer
driving histories than drivers who stopped. The observations also indicated that there
were as many as two red-light runners per hour. Unbuckled drivers were more likely to
run red lights.
Porter and England (2000) extended the previous effort to observe actual driving
behaviors at intersections. The authors provided a study with 5,112 observations of
drivers entering six traffic-controlled intersections in three Southeast Virginia cities.

- 25 -
Overall, 35.2% of observed light cycles had at least one red-light runner prior to the onset
of opposing traffic. This rate represented approximately 10 violators per observation
hour. City differences emerged as important for predicting red-light runners. Higher red-
light running rates were observed in cities with larger intersections and higher traffic
volumes. After controlling for city and time differences, adjusted odds ratio revealed that
drivers who were unbuckled were 1.32 times as likely as those who were buckled to run
the red light. Unlike the Retting and Williams (1996) study, this study failed to find
support for age as a red-light running predictor.
Porter and Berry (2001) through a nationwide telephone survey of 880 self
reported red light running concluded that almost a fifth (19.4%) had run a red light when
entering the previous ten signalized intersections. Analyses of age group revealed that the
36¯45, 46¯55, and 56+ age groups were less likely than 18¯25-year-olds to report recent
red light running. Drivers aged 56 and older were only 0.30 times as likely as the
youngest age group to report recent red light running. Drivers with 26¯35 years of age
were not significantly different from the youngest group. This study showed also that
passengers reduced drivers' tendencies to run red lights. When alone, 25.6% of drivers
reported being at least somewhat likely to run a red light. This percentage drops sharply
when passengers are in the vehicle. Only 15.8% of respondents reported being at least
somewhat likely to run red lights when one adult passenger was present and only 4.8%
admitted being likely when there were children in the car. Respondents of this study
agreed that increased law enforcement was important for reducing red light running;
providing cameras, giving the public more education about red light running were the
most repeated suggestions of the respondents.

- 26 -
2.4.2 Effect of clearance interval timing and signal phasing
A study by Zador et al. (1985) analyzed traffic flow and crash data from 91
intersections in eight metropolitan areas throughout the United States to assess the effect
caused by departures from the recommended signal-timing practice, on the rate of
intersection crashes. The interpretation of the overall pattern of association between
intersection characteristics, clearance intervals, traffic flow and crash rates was that the
increasing deficiency of clearance interval timing sharply increased the proportion of
drivers who entered intersections and did not clear them during the clearance interval.
Stamatiadis et al. (1997) studied the safety of left-turning vehicles at signalized
intersections and developed guidelines for the installation of left-turn phasing. The
guidelines were based on crash data collected for 408 approaches in Kentucky and delay
data simulated for a variety of intersection characteristics. The recommendations made
take into account many variables, including left turn volumes, crash rates, product of
opposing and left-turn volumes, and left-turn delays.
2.5 Pedestrian safety at signalized intersections
Andersen (2001) established goals to double the percentage of total trips made by
bicycling and walking and to reduce the number of bicyclists and pedestrians killed or
injured in traffic crashes by ten percent. Kentucky Uniform Police Traffic Collision
Reports were obtained for all traffic collisions involving bicycles and pedestrians during
2000 and 2001 in the city of Louisville, Kentucky. These collisions were entered into a
database, Pedestrian and Bicycle Crash Analysis Tool (PBCAT), developed by the
Federal Highway Administration and the University of North Carolina Highway Safety

- 27 -
Research Center. The first step in reducing deaths and injuries to pedestrians and
bicyclists is to analyze the situations where these deaths and injuries occur so specific
countermeasures can be developed. According to police collision reports, there were 484
traffic collisions involving one or more pedestrians. Pedestrian collisions were most
likely to occur between 4:00 PM and 6:00 PM. Ninety-two pedestrian collisions (or 19%)
occurred during these two hours. Thirty-nine percent of all the pedestrian collisions
occurred between 2:00 PM and 7:00 PM. Also most collisions occurred on or near
roadways with one or two lanes in a travel direction. The analysis provided insight for
establishing a community program to address education on behaviors that promote safety
for bicyclists and pedestrians, enforcement of traffic rules, and engineering improvements
that promote safe cycling and walking.
Leden (2002) studied the safety of pedestrians at signalized intersections using a
unique database provided information on pedestrian crashes, intersection geometry and
estimates of pedestrian and vehicle flows for the years 1983¯1986 for approximately 300
signalized intersections in Hamilton, Ont., Canada. Pedestrian safety at semi-protected
schemes, where left-turning vehicles face no opposing traffic but have potential conflicts
with pedestrians, were compared with pedestrian safety at normal non-channelized
signalized approaches, where right-turning vehicles have potential conflicts with
pedestrians. Four different ways of estimating hourly flows for left- and right-turning
vehicles were explored. Hourly flows were estimated for periods of 15 min, hours, two
periods a day (a.m. and p.m.) and the daily period (7 h). The situation for left- and right-
turning traffic was similar (no opposing traffic, no advanced green or other separate
phases and no channelization). A multiple regression analysis was used after

- 28 -
transforming the pedestrian and vehicle flows and the observed number of pedestrian-
vehicle crashes into logarithmic values. Left-turning vehicles caused higher risks for
pedestrians than right-turning vehicles. At low vehicular flows right turns and semi-
protected left turns seemed to be equally safe for pedestrians. When risks for pedestrians
were calculated as the expected number of reported pedestrian crashes, risk decreased
with increasing pedestrian flows and increased with increasing vehicle flow. Leden
concluded that promoting walking will have a positive effect on pedestrian risk at
signalized intersections.
2.6 Summary
Developed through an extensive literature search, the findings can be summarized
as follows:
• A sample size of 30 pertaining to each intersection type was found to be most
appropriate size. Sample sizes of 30 or larger generally assured an accurate estimate
of the population standard deviation and provided a sample mean closely
approximating the population mean.
• The traffic related and geometric variables that were most significant for modeling
intersection crashes were traffic volume (ADT), land use (urban/rural), traffic control
(signalized in our case), and number of intersection legs (4-leg or T), collision type,
number of lanes, left-turn arrangements and time of day.
• The standard models for modeling crash rate or crash frequency are mostly regression
analysis, negative binomial, and Poisson models. The empirical Bayesian framework
was generally adopted to estimate the safety of an individual intersection.

- 29 -
• Tables were developed to produce crash statistics for each intersection and the 90th
and 95th percentile and mean were calculated to evaluate the relative safety and
operational problems at intersections.
• The number of lanes or traffic volume (ADT) was used as an intersection
classification parameter, ADT being the most often used.
• The various conflict types identified were left-turn, right-turn, through, weave, and
rear-end. These, along with monitoring of Red Light Running, were used as a means
to measure crash potentials at intersections and also to understand the causes of
crashes.
• High traffic volume and the population were contributing factors for the crashes.
Right-angled crashes, left-turn crashes and rear-end crashes accounted for the largest
percentages, with a high ratio of rear-end crashes and comparatively low ratios of
right-angled crashes that were mostly observed at signalized intersections.
• The interpretation of the overall pattern of association between intersection
characteristics, clearance intervals, traffic flow and crash rates was that the increasing
deficiency of clearance interval timing sharply increased the proportion of drivers
who entered intersections and did not clear them during the clearance interval.
• When risks for pedestrians were calculated as the number of reported pedestrian
crashes, risk decreased with increasing pedestrian flows and increased with increasing
vehicle flow.
• Right-turn lanes on the mainline increased the likelihood of crashes at three-legged
intersections.

- 30 -
The literature review presented in this section investigated all the factors that contribute
to crash occurrence at signalized intersections. Based on this literature we can proceed
with our data collection effort, and provide a more structured approach to classifying
intersections into distinct types. These studies have repeatedly pointed to traffic volume
and some of the geometric factors as the most important in crash occurrence. Therefore,
this confirms our scope and objectives in this study, and our plan to classify intersections
mainly based on configuration and traffic volume (although other factors have been also
used in some cases as will be shown in the next chapters).

- 31 -
3 DATA COLLECTION
3.1 Introduction The analysis and results of any project are a reflection of the type of the data used
in that project. The data collected should be appropriate and abundant so as to meet both
the qualitative and quantitative requirements of a project. This means that efforts have to
be made to collect as much quality data as possible, and this data should be useful in a
variety of ways to the project. This has been carefully considered while collecting data
for the present project, and this chapter describes the various types of data collected and
the efforts put in to collect the data.
3.2 Data Collection
Data was collected from five counties and one city: Brevard, Hillsborough,
Miami-Dade, Orange and Seminole counties, and the City of Orlando. Data pertaining to
various intersections and crashes occurring at these intersections were collected in
different formats from each county.
Data collected for the counties were divided into two parts: the geometry database
containing all the intersection characteristics, and the crash database containing the
details about crashes. To develop the geometry database, CAD files or aerial photos of
the intersections were obtained from each county so as to identify the intersections’
configuration. Not all of these files were clear, and so a field visit was needed in many
cases to identify their configuration. The data collected pertaining to the geometric
characteristics of the intersections includes number of through, left, and right lanes for
each approach, presence of channelization at each approach and the presence of median

- 32 -
for each approach. Also, the data on the speed limit, traffic volume (AADT) and K-
factors for each approach was incorporated in this database.
Different sources were used for developing the crash database, namely the county
mailed/handed files, county websites, Department of Highway Safety & Motor Vehicles
(DHSMV) data, photocopied crash reports, and F-DOT websites that included the SSO
Online Document Retrieval System and the Crash Analysis and Reporting (CAR)
database in the FDOT Mainframe. It is important to note that every county saves their
data in different ways. There is inconsistency among counties in the way they keep data,
which posed a challenge to obtain complete data from each county and maintain
uniformity among counties as much as possible. The contents of the crash database have
been listed in Table 3-1. Most of these data was available for all counties.
In the crash database, the crashes were sometimes labeled as occurring at an
intersection when they actually occurred a mile away from the intersection. To be
consistent with the FDOT’s definition of an intersection related crash, only the crashes
occurring at a radius of 250ft around the intersection were selected as intersection related
crashes.
Although efforts were made to collect the maximum amount of data possible for
signalized intersections from all counties being considered in this study, not all of the
data could be collected for all of the counties. The data collection efforts from each of the
counties have been described in the following subsections.

- 33 -
Table 3-1 Format of crash database
Field # Field Caption
1 Crash report number 2 Node number 3 Intersection (routes names) 4 AADT 5 Type 6 Category 7 Speed Limit In
ters
ectio
n D
ata
8 K-Factor 9 Crash date
10 Time of crash 11 County code 12 City code 13 Number of lanes 14 Divided/undivided highway 15 Total property damage 16 Investigating department 17 Fist harmful event 18 Subsequent harmful event 19 Road system identifier 20 Location type 21 Lighting condition 22 Road surface condition 23 Weather 24 Road surface type 25 1st contributing cause-road 26 2nd contributing cause-road 27 1st contributing cause-environment 28 2nd contributing cause-environment 29 1st traffic control 30 2nd traffic control 31 Site location 32 Trafficway character 33 Type of shoulder 34 State road crash 35 Day of week 36 Rural/urban 37 Crash injury severity 38 Alcohol/drugs 39 Total number of vehicles 40 Total number of fatalities
Cra
sh D
ata
41 Total number of injuries
- 34 -
3.2.1 Orange County
Data was first collected for Orange County. Signalized intersection drawings were
obtained from the county’s traffic engineering department. From these drawings, a
geometry database was created that contained intersection characteristics. In addition,
several other geometric characteristics were collected from these drawings and input into
the database. Due to the fact that the drawings were not always consistent, Orange
County was contacted again for more information. Through their help, complete
geometric characteristics were obtained for the signalized intersections in Orange
County. Information received included intersection drawings and several signal time
sheets and turning volumes.
While continuing the efforts on building the geometry database, new intersections
were identified based on the level of service report published by the county in an effort to
collect AADT volumes and k-factors for the new intersections. Next, available turning
volumes and signal timings were associated with the appropriate intersections. Finally, a
new geometry database was created reflecting the most complete data.
As a next step, efforts were made to identify all intersections that underwent
construction during the years 1999 and 2000. If an intersection was under construction
during a year it would be excluded from analysis for that particular year.
Based on the available information, the intersections were classified based on the
number of lanes on the major and minor road (i.e. 2x2, 4x2, 4x4, 6x2, 6x4, and 6x6).
Some intersections contained TWLTL, and were represented as 3x2, 4x3, 5x2, 5x3, 5x5,
etc. These intersections were considered in lane configurations without the TWLTL, i.e.,
3x2 was considered in 2x2, 4x3 was considered in 4x2, 5x5 was considered in 4x4, etc.

- 35 -
Since there were a significant number of T-intersections, they were further divided as per
lane configuration into 2xT2, 4xT2, 4xT4, 6xT2, etc.
The crash database for Orange County was developed for the years 1999 and
2000. It was not possible to retrieve records from 2001 onwards because the county
began coding their records in a manner different from that of FDOT crash database, while
using a numbering system different from the crash report numbering. As Orange County
does not keep a record of the short form crash reports, only the long form crashes were
collected.
In the crash database developed for the years 1999 and 2000, several crash
records were found missing. In order to remedy this problem, our team visited the Orange
County Public Works department for a total of four days and was able to make
photocopies of about 500 crash records from 1999 and 2000. This ensured that the
database was complete.
Another database was then created in Access to input the data from the crash
reports as well as all roadway geometry from the previous database. An Access program
was written to collect the required information from the crash reports. In an effort to
account for all crashes and to ensure that the final crash database was as accurate and
complete as possible, the county, FDOT and DHMSV databases were cross-checked.
This ensured the completeness of our data as each of the databases was found to be
missing some crash reports.
A SAS program was written to match the crash report number in the crash
database to the crash report number in the DHSMV database, and then to extract the
information on the hour of the day, day of the week, month, light conditions, surface
- 36 -
conditions, severity and collision type of the crash. Collision type was categorized into
rear end, head on, angle, left turn, right turn, sideswipe, pedestrian, fixed object and other
collisions. Injury severity was subcategorized into property damage, possible injury, non-
incapacitating injury, incapacitating injury and fatal injury. Light condition was branched
off to daylight, dusk, dawn, dark (with street lights), dark (without street lights) and
unknown. Weather condition was sub divided into dry, cloudy, rain, fog, others and
unknown. The fifth category, Surface conditions, was separated into dry, wet, other and
unknown. Months of the year consisted of months January through December. Each day
of the week was a separate category and time of the day was divided into seven groups.
The groups consists of 00:00-06:00, 06:01-09:00, 09:01-11:00, 11:01-13:00, 13:01-15:00,
15:01-18:00, and 18:01-24:00. Using this method, a large amount of the data related to
the crash was collected. Similar methods were adopted to extract these variables for the
crashes in the other five counties.
After collecting the data, the traffic and geometric characteristics of every
intersection were combined along with the information of all the crashes that had
occurred at or influenced by that intersection. The following steps were followed during
this process:
1. The database containing the crashes contained the Crash Report Numbers (CRN)
of the long form crashes for the years 1999 and 2000. The names of the
intersecting roads are available, no node number is provided for the intersection.
2. The DHSMV databases for the years 1999 and 2000 were used to extract the
information of the above crashes. The CRN was used to link the Orange county
Excel spreadsheet with the DHSMV databases.

- 37 -
3. All these missing CRNs were photocopied from the original crash reports to
complete the DHSMV databases for Orange County.
4. The crash data developed in this phase was crosschecked with the FDOT
Mainframe’s CAR database and the missing crashes were added.
5. A unique node number for every intersection was generated for further use.
6. Using CAD drawings for every intersection, the research team developed a
database that has the geometric characteristics of each intersection and its unique
node number. This job was done manually for each intersection.
7. Using the Orange county traffic reports posted on their website, a database was
developed that had the traffic characteristics of each intersection and its unique
node number.
8. A SAS code was written to read the above databases and combine them in the
master database of Orange county;
a. The CRN was used to link Orange county Excel spreadsheet with
DHSMV databases to produce a dummy database.
b. The intersecting street names were used to link the dummy database to the
geometric and traffic databases to produce the final master database of
Orange County.
3.2.2 Seminole County
The website of Seminole County was first reviewed for information such as traffic
counts based on the type of roadways. The county was then contacted directly to get
additional information. The County provided a list of signalized intersections as well as a
CD containing partial intersection geometry and signal details. A geometry database was

- 38 -
built for Seminole County where each intersection was classified based upon the number
of through lanes. Other geometric information was also available and inputed into the
database as well. Using electronic drawings on Excel spreadsheets for the intersections, a
database was developed containing all the geometric characteristics of each intersection
and its unique node number. This job was done manually for each intersection.
A unique node number was assigned to every intersection for further use. Using
the Seminole county traffic reports posted on their website, a database was developed that
contained the traffic characteristics of each intersection and its unique node number.
Approach speed limits at the intersections were obtained from the CD. For the
intersections for which these values were unavailable, they were obtained by driving on
the roadways and noting the speed limits manually.
The K-factor values were searched for Seminole County also to make it
compatible to Orange County data. Seminole County K-factors were found on the
Florida Department of Transportation’s website for state roads only and this information
was then input into the geometry database.
Next, crash records were obtained for the county. The database contained the
following data:
1. The Crash Report Number (CRN) for both long- and short-form crashes for the
years 1999, 2000, and 2001.
2. The crash information, similar to DHSMV data and format.
3. The names of the intersecting roads.
4. No node number was provided for the intersection.

- 39 -
For crashes reported on long forms, a program was written to extract the
necessary records from the FDOT and DHSMV databases and input them into a database
for Seminole County to serve as a crosscheck for the records provided by the county.
A SAS code was written to read the above databases and fuse them in the master
database of Seminole county. The intersecting street names were used to link the Access
database to the geometric and traffic databases to produce the final master database of
Seminole county.
3.2.3 Hillsborough County
Hillsborough County officials provided a CD containing aerial photographs and
field drawings for some of the signalized intersections in the county. Again, the
intersections were classified by lanes and included any other information that could be
gathered in the geometry database. During the process of collecting the county’s
information, several items were found missing and it became necessary to meet with the
county officials directly. One member of the research team traveled to the main office in
Tampa for two days in an effort to retrieve all the possible data.
Hillsborough County did not provide any AADT counts, so they were located on
the website in the form of a spreadsheet. The format made the extrapolation of the
necessary information very difficult. In order to use this spreadsheet, all intersections
had to be located on a map of the county and their location was found relative to the
locations where AADT counts were measured. It took several weeks to complete this
process. When finished, these AADT values were compared to the AADT values at
comparable intersections in both Orange and Seminole counties. It was then evident that
the AADT values reported on the Hillsborough spreadsheet were an inaccurate

- 40 -
representation of the actual street volumes because the Hillsborough AADTs were
considerably lower than those in Orange and Seminole counties. It was decided that a
more credible source was needed for these counts. After searching the Internet, an up-to-
date level of service report was found that not only included the AADT and level of
service but also the number of lanes on the roadway as well as whether it was divided or
not. Upon comparison of the previously used spreadsheet, these numbers were found to
be more accurate especially since roadways with relatively low AADT were graded with
a better level of service. In addition to replacing the erroneous AADT values in the
geometry database, all of the streets were checked to ensure that they were consistent in
the number of lanes and roadway division with the official level of service report.
Another task for Hillsborough County included identifying all intersections that
went under construction during our data period, 1999, 2000, and/or 2001. If an
intersection was under construction between 1999 and 2001 it would be excluded from
analysis for that particular timeframe. Modification information was received in
spreadsheet form from the county. There were a total of 12 intersections that were to be
excluded from at least one year’s analysis.
The crash data was then downloaded from the county’s ftp site, which included
both long and short forms for years 1999 to 2001. Another code was written to extract
each crash individually into an Excel spreadsheet, which would allow for much easier
manipulations. When this task was finished, each intersection listed in the crash file was
manually reviewed and the unique county number was attached to the ones that had been
included in the geometry database.

- 41 -
The next step taken was to associate the available intersections with their
respective crashes occurring between 1999 and 2001. Crash information was downloaded
from the county’s FTP site and included both long and short forms with the type clearly
stated. To link these crashes, an Excel spreadsheet was created with the different
spellings of each intersection as well as the intersection’s unique county number that was
assigned to the intersection. Then a SAS code was written to perform two tasks; first, to
associate the crashes with the link from the Excel spreadsheet and, second, to use the link
again to associate crashes with their respective geometry information. Upon completion,
a master database was created for Hillsborough County and was crosschecked with the
FDOT Mainframe and DHSMV database to ensure completeness.
3.2.4 City of Orlando
Two CD-ROMs were obtained from the City of Orlando; one containing
intersection geometry and signal timing details for 355 intersections in the City of
Orlando, and the other containing the crash specifications of each city intersection. About
one-third of the intersections in the database involved one-way streets.
Of the 355 intersections in the City of Orlando that were received in the drawings
from city officials, geometry characteristics could be collected for most of them. The
speed limit values for the approach roadways were collected from Internet sources.
However, of those the AADT values were known for only 171 intersections. Due to the
fact that most of City of Orlando’s intersections are nearby at least one other intersection,
AADTs for intersections missing this information was interpolated using the two nearest
intersections. If the nearby intersections both had AADT counts, then the missing
intersection’s AADT would be the average of these actual AADTs. This process turned

- 42 -
out to be particularly tedious but worthwhile because AADT could be identified for 124
more intersections, increasing the number of intersections for the City of Orlando to 295.
A geometry spreadsheet was created for the city and the intersections were
classified in the same way as for the aforementioned counties.
The crash details for the City of Orlando were obtained in the form of an Access
database, in a similar format as for Seminole County. This database contained crashes for
the years 2000, 2001 and 2002. The crash list included both long and short forms for the
years 2000 to 2002. A SAS code was written to match crashes with the intersection’s
characteristics by way of a unique number that was assigned to each intersection. This
database generated was crosschecked for completeness and accuracy.
3.2.5 Brevard County
Brevard County was originally contacted for cooperation and was able to provide
hand-drawings for about 150 signalized intersections. Each drawing was categorized and
information was recorded into a geometry database showing each intersection. When this
was complete, intersection AADT information was found from the Internet and the
database was updated.
After completing the geometry database for the intersections, Brevard County was
contacted again for a crash list. The county provided an Excel spreadsheet listing each
long and short-form crash for the years 2000 to 2002. A code was written to extract
crashes and the unique county numbers were attached to all of their locations. Some
additional crashes were added to the database obtained from the FDOT Mainframe’s
CAR database. The next step was to use the county numbers attached to the crashes to
match them individually to the intersection where the crash occurred based on the

- 43 -
geometry database and create another master county database as was done in other
counties.
3.2.6 Miami-Dade County
Several CDs were obtained from the county containing geometric information for
a total of 3200 intersections. Upon looking into these, it was found that many
intersections were not signalized, some were signalized pedestrian crosswalks, and others
were mechanical bridges. Also, crash records could not be retrieved from the county.
Therefore all crashes had to be downloaded from the FDOT Mainframe’s CAR database.
The FDOT database reports long-form crashes from state roads only. Hence 1501 state
road drawings were identified from the 3200 that the county had sent. Of these
intersections the geometric information was recorded for 580 state-road intersections.
This information only included size of the intersection, e.g., number of left turn lanes,
roadway median type and whether the right turn was channelized. The database contained
no information on AADT, k-factors or speed limits. The county was unable to provide
any more information. Since the roads in the database were only state road intersections,
the AADT and k-factors were extracted from the FTI2003 CD-ROM from FDOT.
The crash list was obtained from the FDOT mainframe database by specifying the
intersection in the mainframe and specifying the time period for which the crashes had to
be downloaded. This procedure proved to be time consuming but worthwhile because
28,380 (of which 21,176 were unique crashes that were related to the intersections)
crashes were downloaded for 413 intersections in Miami-Dade County for the years
1999, 2000, 2001 and 2002. These crashes extracted from the FDOT crash database were
crosschecked with the DHSMV database to make sure that the database was consistent.

- 44 -
The final step was to link the crashes to their respective intersections and
geometry information. This was done by writing a SAS program to join the intersections
to the crashes by the intersection ID common to both the geometry and crash databases.
The method was similar to the one used in the joining the geometry and crash files in the
other counties. Thus the master database developed included crash and geometric
information for 413 intersections in Dade County.
3.3 Summary of the Databases
The data collected for each of the six counties consisted of geometry and crash
databases in different formats. These databases were combined to form a Master
Database that contained all the characteristics of a particular crash as found in the crash
database, and also the intersection characteristics as found in the geometry database. This
step provided one final database for each county.
One important aspect that came up while building the Master Database was
whether to include short form crashes in the database. A database of both long and short
form crashes was developed for City of Orlando, Brevard, Hillsborough and Seminole
counties. Although the Orange County crash databases were obtained from the county,
Orange County does not keep a record of short forms. As for Miami-Dade, the county
was unable to provide the crash database and thus the crash database was downloaded
from the FDOT sources that contained only long form crash records for intersections with
at least one road being a State Road. Therefore, except for Orange and Miami-Dade
Counties, all other counties contained crash databases consisting of both long and short
forms. It was decided upon to include these crashes, because, there will be a consistent
under reporting some types of crashes (such as PDO crashes, which tend to be rear-end in
- 45 -
many cases) if they are not accounted for. Hence the Master Databases contained both
long and short form crashes for the four counties: Brevard, City of Orlando, Hillsborough
and Seminole, while they contained only long form crashes for Miami-Dade and Orange
counties. Since FDOT was only interested in long-form reported crashes, the focus of the
project has been on these crashes. But detailed records of all types of crashes were
included.
The complete summary of the Master Databases of all six counties has been
tabulated in Table 3-2.

- 46 -
Table 3-2 Summary of data in all six counties
8 x 6 1 1
8 x 4 5 2 7
6 x 6 1 4 1 1 5 12
6 x 5 1 1 2
6 x 4 2 8 24 5 6 23 68
6 x 3 5 3 9 17
7 x 3 1 1
8 x 2 6 2 2 10
6 x 2 7 16 27 14 19 47 130
5 x 4 1 1 1 6 9
4 x 4 11 16 40 23 18 41 149
4 x 3 2 1 14 6 6 29
5 x 2 1 3 4 8
4 x 2 76 50 109 90 60 119 504
3 x 3 1 1
3 x 2 4 1 5
2 x 2 17 40 36 33 30 13 169
115 144 261 185 139 278
24 32 36 41 55 61 249 249
12 15 15 69 6 74 191 191
151 191 312 295 200 413
Yes Yes Yes Yes Yes Yes
No Yes Yes No No Yes
Yes Yes Yes Yes Yes Yes
23 sites only No Yes No No No
No No Yes No No No
No Yes Yes No Yes No
Both Forms Both Forms Long Only Both Forms Both Forms Long Only
00,01,02 99,00,01 99,00 00,01,02 99,00,01 99,00,01,02
Excel file from County FTP County, FDOT CD from the city Access file FDOT Site
County Site Site & Copies for the 3 years from County
4297 7422 3616 11267 5461 21176
1183 / 3114 3706 / 3716 3616 / - 4534 / 6733 2107 / 3354 21176 / -
Done Done Done Done Done Done
36322 / 16917
1562
541
2 x 2 175
SubTotal 1122
One Ways/Ramps
Cla
ssifi
catio
n
6 x 4 90
6 x 2 158
4 x 4 158
4 x 2
Miami-Dade Sub-total TotalCity of Orlando Seminole
3-Legged
Brevard HillsboroughIntersection Type
Includes Types: Orange
Turning Volumes
Total
AADT
k Factor
Speed Limit
53239Number of crashes
Long/Short Crashes
Dat
a A
vaila
bilit
y an
d so
urce
s
Crash Years
Crash Source(s)
Master-Database
Long vs. Short Forms
Signal Timings
Modification dates

- 47 -
4 CLASSIFICATION
4.1 Classification of Intersections
The intersections were classified into various groups in order to study the crash
patterns. In order to identify the best AADT values to classify intersections of a particular
configuration, the AADT/major-lane values were tabulated for the intersections of
Orange County. Orange County was chosen for the analysis because it was the first
county to have a complete database. Histograms can be used to display either the
frequency or relative frequency of the measurements falling into specific intervals. They
are useful in checking the distribution visually. The tabulated AADT/lane values were
plotted as relative frequency histograms, as shown in Figure 4.1 for 4 x 2 intersections.
Figure 4.1 Histogram for Major Roadway AADT Per Lane (vehicles/lane) for 4 x 2 Intersections with a Normal Curve

- 48 -
Similarly, histograms were plotted for each type of intersection for AADT/lane
for minor roads and total AADT for the entire intersection. Figure 4.2 and Figure 4.3
show such relative frequency plots for 4 x 2 intersections.
Figure 4.2 Histogram for Minor Roadway AADT Per Lane (vehicles/lane) for 4 x 2
Intersections with a Normal Curve
Figure 4.3 Histogram for total AADT per lane (vehicles/through lanes) for the entire
intersection for 4 x 2 Intersections with a Normal Curve

- 49 -
Looking at the histograms, it was fairly reasonable to deduce that AADT/lane for
the major road followed a somewhat normal distribution and therefore it was decided to
use it to classify intersections based on traffic volume. After deciding on using
AADT/lane for major road for classification of the intersections, the intersections were
further categorized based on AADT/lane.
In case of classifying each intersection configuration into high/low traffic volume,
a cut-off AADT/lane had to be identified. The cumulative frequency plots for each type
of intersection were carefully analyzed and the 50th percentile volumes were estimated
for this purpose. It was checked if a balance was maintained after each type of
intersection was classified as per average AADT per lane, i.e. if more or less, equal
number of intersections fell in the below and above cut-off points. For example, the cut-
off point for 2x2 intersections was set at 5,000 as this resulted in the distribution of
intersections below and above 5,000 equally. 4x2 intersections were further classified
based on the total number of left-turn lanes (i.e. ≤ 2 or > 2) for all approaches. The
complete summary of the categories is listed in Table 4-1. Table 4-2 indicates the
category of intersections present in each county.

- 50 -
Table 4-1 Classification of intersections into 19 categories
Size MJ AADT/ MJ Lane Category≥5,000 1 2 x 2 <5,000 2
≥7,000 (Total LTL ≤ 2) 3 ≥7,000 (Total LTL > 2) 4 <7,000 (Total LTL ≤ 2) 5
4 x 2
<7,000 (Total LTL > 2) 6 ≥7,500 7 4 x 4 <7,500 8 ≥7,500 9 6 x 2 <7,500 10
6 x 4 and 6 x 6 - 11 ≥7,500 12 3-Legged
(T-intersections) <7,500 13 One Way Major - 14 One Way Minor - 15
Both Major and Minor One-Way - 16 ≥7,500 17 Ramp Intersections <7,500 18
3-Legged Intersection with at least one One-Way Street 19
Table 4-2 Categories of intersections present in each county’s master database County Categories Present Brevard 1 to 8, 10 to 13, 17, 18
City of Orlando 1 to 4, 6 to 16 Miami-Dade 1, 3 to 19 Hillsborough 1 to 14, 17, 18
Orange 1 to 13 Seminole 1, 2, 4 to 13
Once the intersections were broken down according to type, we began the process
of determining means, standard deviations and percentiles for each category. Tables were
made to incorporate all the data related to eight (8) different divisions, which consisted of
collision type, severity class, light conditions, weather, surface conditions, month of the
year, day of the week and hour of the day. A versatile code was written in SAS to

- 51 -
compute crash statistics like mean, standard deviation and the 85th, 90th and 95th
percentiles for all the nineteen classification tables that contained the above mentioned
categories and their respective crash summary. Table 4-3 gives a sample of the table
developed. The top header of the table indicates the category (10) and configuration (6x2)
of the intersections used to develop the table, and the number of intersections (16) present
in this category. The numbers in the first column indicate the total number of crashes
pertaining to their respective crash criteria (Collision type, Severity etc.) averaged over
the years 1999, 2000, 2001 and 2002 for Miami-Dade County. The numbers in the
second column represent the average crashes per intersection per year. The rest of the
columns indicate the mean crashes per intersection per year, the standard deviations for
every category, and the 85th, 90th and 95th percentile of crashes.
Similar tables were developed for the 19 categories of intersections in all six
counties. The tables for Brevard County can be found in Appendix A, City of Orlando in
Appendix B, Miami-Dade County in Appendix C, Hillsborough County in Appendix D,
Orange County in Appendix E, and Seminole County in Appendix F.

- 52 -
Table 4-3 A sample of a classification table for Dade County
Average Number Mean Crashes Per Standard 85th 90th 95thCrashes Per Year* Year Per Intersection Deviation** Percentile Percentile Percentile
Collision Type Rear End 59 3.69 2.87 7 7 7Head On 2 0.11 0.20 0 0 0Angle 45 2.81 2.47 6 6 6Left Turn 30 1.84 1.79 4 5 5Right Turn 4 0.22 0.29 1 1 1Sideswipe 16 0.97 0.75 2 2 2Pedestrian/Bicycle 4 0.22 0.26 0 1 1Other/Unknown 17 1.05 1.06 2 2 2
Severity No Injury 66 4.09 2.56 7 8 8Possible Injury 35 2.16 1.85 4 4 4Non-Incapacitating Injury 18 1.11 1.22 2 3 3Incapacitating Injury 6 0.39 0.57 1 1 1Fatal Injury 1 0.06 0.11 0 0 0
Light Conditions Daylight 124 7.73 5.38 14 15 15Dusk 5 0.30 0.31 1 1 1Dawn 3 0.17 0.31 0 1 1Dark (w/street lights) 43 2.67 1.97 5 5 5Dark (w/o street lights) 1 0.03 0.09 0 0 0
Surface Conditions Dry 146 9.14 6.44 17 18 18Wet 26 1.63 1.21 3 3 3Others 2 0.14 0.22 0 0 0
Month of Year January 18 1.14 0.82 2 2 2February 14 0.84 0.65 2 2 2March 17 1.06 0.70 2 2 2April 14 0.89 0.72 2 2 2May 17 1.06 0.85 2 2 2June 14 0.86 0.61 2 2 2July 16 0.98 1.11 2 3 3August 18 1.11 0.96 2 3 3September 13 0.78 0.55 1 1 1October 13 0.78 0.68 2 2 2November 11 0.69 0.57 1 2 2December 11 0.70 0.61 1 2 2
Day of Week Monday 20 1.22 1.02 2 3 3Tuesday 24 1.48 0.95 2 3 3Wednesday 27 1.69 1.34 2 3 3Thursday 27 1.70 1.19 3 3 3Friday 29 1.80 1.46 3 4 4Saturday 27 1.69 1.35 3 4 4Sunday 21 1.33 0.83 2 2 2
Hour of Day*** 00:00 - 06:00 14 0.86 0.79 2 2 206:01 - 09:00 14 0.86 0.81 2 2 209:01 - 11:00 11 0.66 0.51 1 1 111:01 - 13:00 11 0.66 0.76 1 2 213:01 - 15:00 12 0.77 0.78 1 2 215:01 - 18:00 31 1.92 1.32 3 4 418:01 - 24:00 34 2.09 1.34 4 4 4
* Crashes extracted for years 1999, 2000, 2001and 2002 for long forms only.** Standard Deviation column represents the standard deviation for mean crashes per year per intersection.*** Hour of Day statistics are based upon a portion of the crashes with time information available.
EXPECTED ANNUAL ACCIDENT TABLE - DADE COUNTY
TYPE 10 - 6 LANE x 2 LANE SIGNALIZED INTERSECTION, AADT PER LANE ON MAJOR ROAD < 7,500
TOTAL NUMBER OF INTERSECTIONS - 16

- 53 -
4.2 Summary
This section illustrated the method that was utilized in classifying intersections in
each county into 19 categories. AADT per lane on the Major roadway was found to be
the best variable using which the classification based on traffic volume was performed.
The tables developed for the six counties are helpful in obtaining the average crash
frequency in these counties. Depending on the configuration and AADT at the
intersection, the tables provide a simplistic method of estimating the average crash
frequency at the intersection per year. The tables also provide the crash frequencies at the
intersections based on the collision type, severity, light and surface conditions, time, days
and months.

- 54 -
5 COMBINING THE DATA
The previous chapters have described the process of building the crash databases
of each of the six counties. These crash databases were combined to form a complete
database in order to study the crash characteristics for the overall state (represented by the
6 jurisdictions from which data were collected). The database was developed for the
years 2000 and 2001 for all counties (except for Orange County for which the 1999 and
2000 year database was used because the 2001 database was not available). This database
consisted of 20948 crashes for 1562 intersections for two years. The database consisted
of the following fields:
1. Crash Number
2. Intersection ID of the intersection at which the crash occurred
3. Major and Minor roadways of the intersection
4. Traffic Volume (AADT) on the major and minor roadways
5. Speed Limits on the major and minor roadways
6. K-factors for the major and minor roadways
7. Number of through lanes on the major and minor roadways
8. Protected, exclusive and total left turning lanes on the major and minor
roadways
9. Channelized right running lanes on the major and minor roadways
10. Divided or undivided roadway segments on all approaches
11. Collision type of the crash
12. Severity of the crash
13. Light conditions at the time of the crash

- 55 -
14. Surface conditions at the time of the crash
15. Date and time of the crash
Tables for the expected number of crashes for the 19 categories were developed
for this database. These tables have been listed in Appendix G.

- 56 -
6 TESTS TO COMPARE EACH COUNTY TO THE COMBINED DATABASE
Since the tables for the expected number of crashes on long forms for each county
as well as for the combined database were prepared for the 19 categories, statistical tests
were conducted to find out if there was a significant difference between the tables for
each county and the tables for the combined six counties. This could be used in
determining if the tables for the combined database can be referred to for finding the
crash characteristics of a county, rather than referring to each county’s tables. For
example, this analysis would enable us to see if the mean number of sideswipe crashes
for a 6 x 2 intersection in Brevard County is any different from the sideswipe crashes for
a 6 x 2 intersection for the combined six counties. If they are the same, the characteristics
for the sideswipe crashes for the 6 x 2 intersections in Brevard County tables for expected
number of crashes would be similar to those in the combined database tables. Hence the
tables for the combined database can be used in such a case instead of referring to each of
the county tables.
This analysis was completed by conducting a Student’s t-test to compare the mean
number of crashes of each county to the means of the combined database. The results
were tabulated and a sample is shown in Table 6-1. The mark “√” in the table indicates
that the mean number of crashes for a particular county is not statistically different at the
95 confidence level to the mean number of crashes in the combined database, indicating
that the data from the combined database can be used for these counties and categories
(not significantly different). BC denotes Brevard County, CO denotes City of Orlando,
HC denotes Hillsborough County, OC denotes Orange County, SC represents Seminole
County and DC denotes Dade County. Category 19 was not included because this

- 57 -
category has been assigned only in Dade County. Appendix H includes all the 18
comparison tables.
Table 6-1 Comparison of means of each of six counties to the means of the combined six counties
BC CO HC OC SC DCCollision Type Rear End √ √ √ √
Head On √ √ √ √ √Angle √ √Left Turn √ √Right Turn √ √ √ √Sideswipe √ √ √ √ √Pedestrian/Bicycle √ √ √ √ √ √Other √ √ √ √
Severity No Injury √ √Possible Injury √ √ √ √Non-Incapacitating Injury √ √ √ √Capacitating Injury √ √ √ √ √Fatal Crashes √ √ √ √ √ √
Light Conditions Daylight √ √ √Dusk √ √ √ √ √ √Dawn √ √ √ √ √Dark (w/street lights) √ √Dark (wo/street lights) √ √ √ √ √
Surface Condition DryWet √ √ √ √ √Others √ √ √ √
Month of year January √ √ √ √ √February √ √ √ √ √March √ √ √ √ √April √ √ √ √ √May √ √ √ √ √June √ √ √ √ √July √ √ √ √August √ √ √ √September √ √ √ √October √ √ √ √ √November √ √ √ √ √December √ √ √ √ √
Day of week Monday √ √ √Tuesday √ √ √Wednesday √ √ √Thursday √ √ √Friday √ √Saturday √ √ √Sunday √ √ √ √
Hour of day 00:00 - 06:00 √ √ √ √ √06:01 - 09:00 √ √ √ √ √09:01 - 11:00 √ √ √ √ √11:01 - 13:00 √ √ √ √ √ √13:01 - 15:00 √ √ √ √ √15:01 - 18:00 √ √ √ √ √18:01 - 24:00 √
Type 44 Lane x 2 Lane Intersection, Signalized, AADT/lane for Major Road ≥ 7000 (LT lanes > 2)
- 58 -
7 A SIMPLISTIC PRACTICAL APPROACH TO IDENTIFY TRAFFIC CRASH PROFILES AT SIGNALIZED
INTERSECTIONS
7.1 Introduction It is generally believed that increasing the size of intersections increases capacity
and thereby alleviates congestion and improves safety. In fact, the number of lanes is
closely associated with capacity and average traffic volume at intersections. Mucsi and
Khan (2003) demonstrated that increasing the number of lanes has some marginal effects
on increasing capacity and reducing delay at signalized intersections. However, the effect
of increasing the number of lanes on crash risk is more complex. For instance, additional
lanes may potentially reduce the risk of head-on crashes at intersections but may also
result in many drivers traveling at higher speeds, leading to more rear-end crashes. Also,
other intersection characteristics may influence driver behavior and cause different crash
patterns at different types of intersections.
Many studies on crashes at intersections have examined the effect of the size of
intersections on crash risk. Pernia et al. (2002) examined the relationship between the
average number of crashes at intersections and the number of lanes. They observed that
the average number of crashes increased as the number of lanes on major roads increased.
Bauer and Harwood (1996) found contradictory results that the expected number of
crashes at the four-legged unsignalized intersections decreases as the number of lanes on
the major road increases using a negative binomial regression model. Huang et al. (2000)
described the intersection characteristics in more detail. This research examined the
impact of the total number of lanes including left-turn and right-turn lanes and the
directions of travel (one-way or two-way) on pedestrian crashes at intersections.

- 59 -
However, these studies only considered the number of lanes on major roads or the
number of approach lanes, without simultaneously considering the number of lanes on
minor roads or the number of crossing lanes.
On the other hand, some studies took into account the number of lanes on both
major and minor roads at intersections and its impact on crash risk. Porter and England
(2000) concluded that more red-light running tended to occur at intersections with more
lanes on both approaches, which could imply that the likelihood of a crash at larger
intersections is greater. However, their results are based on the crashes at only six
intersections and they did not clearly define the size of intersections in terms of the
number of lanes. Therefore, they failed to extensively show the trend of crash risk with
an increase in the number of lanes. Mohamedshah et al. (2000) explicitly considered the
total number of lanes including turning lanes to examine the effects of number of lanes
on red-light running crashes at signalized intersections. They used the total number of
lanes on major and minor roads separately as a surrogate measure of intersection width
and found that the number of crashes on minor roads increased with each additional lane
on major roads. Hill and Lindly (2003) considered both the number of approach lanes and
crossing lanes to account for the impact of the size of intersections on crashes. However,
the number of approach lanes does not include the number of lanes on the opposite
approach. Clearly, these studies focused on the relationship between crashes and the
number of lanes in particular directions of travel, rather than the general relationship in
all directions of travel.
The limitations with the past studies are summarized as follows. First, since they
only considered the number of lanes in the road where crashes occurred, they failed to

- 60 -
take into account the effect of traffic approaching from opposite directions or crossroads
at the same intersection. Second, the studies tend to rely on police crash reports which
normally include through lanes only in the total number of lanes. However, the number of
exclusive left-turn and right-turn lanes increases capacity of intersections and the
likelihood of crashes in turning movement. Thus, the turning lanes must be included in
the total number of lanes. Third, the studies mainly focus on the number of lanes without
distinguishing the different types of intersections. For instance, although total number of
lanes may be the same for the four-legged intersections and the three-legged
intersections, the crash patterns may be different between the two intersection types.
To overcome these limitations in the past studies, and to account for the
intersection types, geometric and traffic characteristics on both major and minor roads,
the size of the intersection is used. The size is represented by the sum of the total number
of lanes at all approaches including the through, left and right turning lanes. Using this
simple and easy to identify measure, the size of the intersection, we can also capture
many geometric and traffic features of the intersection, since the number of lanes (size)
could be a surrogate to the traffic volume, crossing width, signal cycle length, phasing,
etc. While this study investigates the effects of type of intersections and the number of
lanes (size of intersection) on the expected number of crashes per intersection per year
(crash frequency) by type and severity, in addition a simplistic method is developed to
assist traffic engineers in identifying the expected crash patterns at intersection and
therefore conduct a quick and efficient safety evaluation of signalized intersections.

- 61 -
7.2 Description of Data This study used the records of crashes at signalized intersections in Brevard,
Seminole, Dade, Orange, and Hillsborough Counties and the City of Orlando, Florida.
Each county provided a database of crash reports for three years (except Orange County).
There were a total of 26,603 crashes at 1,335 intersections in the six counties over 3
years. The crash database includes information on crash type, severity, month, day and
time, average daily traffic (ADT) on the major roadway and the K-factor. Crashes are
categorized into the following eight types: rear-end, sideswipe, head-on, angle, left-turn,
right-turn, pedestrian-bicycle and other crashes. Injury severity of crashes is categorized
into fatal, incapacitating, non-incapacitating evident, possible, and no injuries. Detailed
CAD drawings of the intersections were also obtained from the respective counties/city.
From the drawings of intersections, the detailed road geometric features (such as the
number of through lanes, exclusive left-turn lanes and channelized right-turn lanes, the
presence of medians, and the speed limits) were identified.
Intersections were classified into different types. The classification is typically
based on the number of lanes on major and minor roads. For example, if the numbers of
lanes on major and minor roadways of one intersection are 4 and 2, respectively, the
intersection is classified as “4 × 2”. However, this way of classification cannot clearly
distinguish if one or both roadways are one or two-way roads, or the exact configuration
of the intersection based on the number of exclusive left and right turn lanes. Therefore, it
is a non-consistent way to identify the size and configuration of the intersection since, for
example, a 4x2 intersection with one exclusive left turn lane at all approaches would be
comparable to a 4x2 without any left turn lanes, although the first has a total of 10 lanes

- 62 -
(4 +2 + 4 left turn lanes) and the second has only 6 lanes (4 + 2). Although the
intersection classifications of these intersections would be the same (4x2), the size and
expected crash patterns would be different.
Thus, intersections were classified into the following three types – 1) four-legged
two-way intersections; 2) four-legged one-way intersections; and 3) T-intersections (i.e.
the three-legged intersections). The four-legged two-way intersections include only
intersections where both the major and minor roads are two-way. The four-legged one-
way intersections are those intersections where either major, minor or both roadways are
one-way. The T-Intersections are those intersections with two-way major and minor
roads. Among 1,335 intersections, there are 1,001 four-legged two-way intersections, 132
four-legged one-way intersections, and 202 T-intersections. The summary of the data is
shown in Table 7-1.
Table 7-1 Description of crash and intersection data
Type of intersection
Number of intersections
Number of crashes
Average number of crashes per intersection
Range of total number of lanes at intersections
Four-legged two-way
intersections 1,001 21,406 21.4 4~21
Four-legged one-way
intersections 132 2,495 18.9 3~12
T-intersections 202 2,702 13.4 4~16
In the determination of size of intersections, the total number of lanes, was
calculated as the sum of the number of lanes for through, exclusive left-turn, and
channelized right-turn lanes. The larger the total number of lanes, the larger the size of

- 63 -
intersections. The range of the total number of lanes for each intersection type is also
presented in Table 7-1.
7.3 Discussion of Results The relationships among the expected crash frequency, type and severity and the
total number of lanes were observed and compared across the size and type of
intersections. In this study, the expected crash frequency is defined as the total number of
crashes per year for each intersection type divided by the number of intersections for
corresponding intersection type.
7.3.1 Expected Crash Frequency and Type It was found that the average number of crashes per intersection per year
increased as the total number of lanes increased for all types of intersections. However,
the rates of increase differed for each crash type and intersection type. In comparing
intersection types, crash frequency varies exponentially with the total number of lanes at
the four-legged two-way intersections whereas the frequency varies in the function of a
second-order polynomial at the four-legged one-way intersections and T-intersections as
shown in Figures 7.1 to 7.3. An equation was fitted for the total average crash rate and all
crash types. For space limitation, Figures 7.1 to 7.3 presents the equations for the
expected total number of crashes (y_tot) and the most dominant type (rear-end, y_re or
angle, y_a), as a function of the total number of lanes (x). The R-squared values indicate
a good fit of the models particularly for the 4-leg two-way intersections (the most
dominant type). In comparing the types of crashes that occurred in each intersection type,
a rear-end crash was the dominant type of crashes followed by angle, left-turn, sideswipe,

- 64 -
right-turn, pedestrian/bicycle, and head-on crashes at the four-legged two-way
intersections (Figure 7.1). At the four-legged one-way intersections, the angle crash was
the dominant type of crashes followed by rear-end, sideswipe, left-turn,
pedestrian/bicycle, right-turn, and head-on crashes (Figure 7.2). At the 3-legged
intersections, the rear-end crash was dominant similar to the four-legged two-way
intersections (Figure 7.3). The R-squared in Figures 7.2 and 7.3 are not as good as those
in Figure 7.1, however the values are reasonable and there is a clear upward trend.
y_tot = 5.2289e0.1075x
(R2 = 0.8931)
y_re = 1.4652e0.1533x
(R2 = 0.948)
0
5
10
15
20
25
30
<=5 6 7 8 9 10 11 12 13 14 15 16 17 18 19 >=20Total number of Lanes at an Intersection
Ave
rage
Num
ber o
f Cra
shes
per
inte
rsec
tion
per y
ear
Total
Rear End
Angle
Left TurnT
Side Swipe
Figure 7.1 Relationship between average number of crashes and total number of lanes by
crash types (4-legged two-way intersections)

- 65 -
Totaly_tot = 0.1407x2 - 0.1973x + 7.2178
(R2 = 0.4745)
Angley_a = 0.0114x2 + 0.3275x + 1.6237
(R2 = 0.4135)
0
5
10
15
20
25
30
<=4 5 6 7 8 9 10 >=11
Total Number of Lanes at an Intersection
Ave
rage
Num
ber o
f Cra
shes
per
inte
rsec
tion
per y
ear
Rear End
Angle
Left Turn
Side Swipe
Total
Figure 7.2 Relationship between average number of crashes and total number of lanes by
crash types (4-legged one-way intersections)
Total y_tot= 0.1374x2 - 0.8612x + 6.7224
(R2 = 0.5151)
y_re = 0.0319x2 + 0.0056x + 2.0266(R2 = 0.4997)
0
5
10
15
20
25
30
<=5 6 7 8 9 10 11 12 13 14 >=15Total Number of Lanes at an Intersection
Ave
rage
Num
ber o
f cra
shes
per
inte
rsec
tion
per
yea
r
TotalRear EndAngleLeft TurnSide Swipe
Figure 7.3 Relationship between average number of crashes and total number of lanes by
crash types (3-leggedintersections)

- 66 -
These results are useful since they indicate that knowing the intersection’s size
makes it possible to predict the expected number of crashes and their type. It is important
to note that this simplistic but new way of representing the intersection size is powerful.
The number of lanes at any intersection is easy to observe and therefore applying the
simple equations estimated in this work. Also the size used here represents implicitly
many factors including the traffic volume, crossing width (for vehicles and pedestrians),
and signal cycle and phasing.
The exponential increase of crash frequency with the total number of lanes at the
four-legged two-way intersections implies higher crash risk with the increased size of
intersections at this intersection type compared to the other intersection types. This may
be because more directions of travel and vehicle movement at the four-legged two-way
intersections increased the number of conflict points and consequently, the likelihood of
crash occurrence.
It is interesting to note that the dominant type of crashes at the four-legged one-
way intersections is the angle crashes unlike the other types of intersections where the
dominant type of crashes is the rear-end crashes as shown in Figures 7.4 and 7.5. To
investigate the cause of this result, the first contributing causes for the crashes were
analyzed. A majority of the first contributing cause for the crashes at all intersection
types was “careless driving”. However, it was found that the percentage of “disregarded
traffic signal” was relatively higher (15.5%) at the four-legged one-way intersections than
the other intersection types (8.1% at the four-legged two-way intersections and 6.94% at
the T-intersections). Also, there is a possibility that drivers make improper turns to one-
way street by misjudging the direction of travel. Therefore, we can speculate that higher
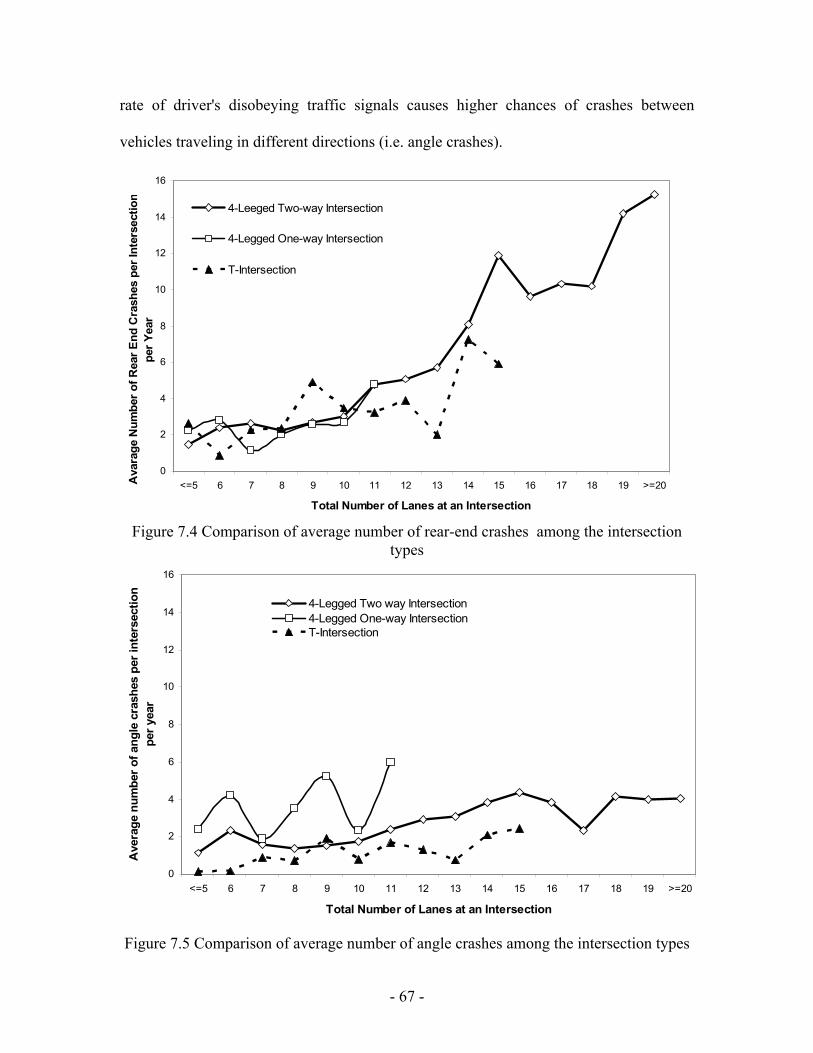
- 67 -
rate of driver's disobeying traffic signals causes higher chances of crashes between
vehicles traveling in different directions (i.e. angle crashes).
0
2
4
6
8
10
12
14
16
<=5 6 7 8 9 10 11 12 13 14 15 16 17 18 19 >=20
Total Number of Lanes at an Intersection
Ava
rage
Num
ber o
f Rea
r End
Cra
shes
per
Inte
rsec
tion
per Y
ear
4-Leeged Two-way Intersection
4-Legged One-way Intersection
T-Intersection
Figure 7.4 Comparison of average number of rear-end crashes among the intersection
types
0
2
4
6
8
10
12
14
16
<=5 6 7 8 9 10 11 12 13 14 15 16 17 18 19 >=20
Total Number of Lanes at an Intersection
Ave
rage
num
ber o
f ang
le c
rash
es p
er in
ters
ectio
n pe
r yea
r
4-Legged Two way Intersection4-Legged One-way IntersectionT-Intersection
Figure 7.5 Comparison of average number of angle crashes among the intersection types

- 68 -
7.3.2 Injury Severity In comparing injury severity of crashes by intersection types, the percentage of
high injury crashes (i.e. fatal, incapacitating and non-incapacitating evident injuries) in
total crashes was higher at the four-legged two-way intersections than the four-legged
one-way intersections as shown in Figure 7.6. This is mainly due to more conflict points
and the increased chances of higher impact of collisions.
60.2
21.218.6
14.910.4
58.6
22.219.1
74.5
0
10
20
30
40
50
60
70
80
No Injury Possible Injury Fatal/Severe InjuryLevels of injury severity
Ave
rage
per
cent
age
4-Legged Two-way Intersection4-Legged One-way IntersectionT-Intersection
Figure 7.6 Comparison of injury severity among the intersection types
On the other hand, the proportion of high injury (incapacitating and fatal injuries)
crashes was higher at the 3-legged-intersections (T-intersections) than the four-legged
one-way intersections in spite of less conflict points as shown in Figure 7.6. At the 3-
legged-intersections, a priority (e.g. higher speed limit, longer green-time) is usually
given to major roads with higher traffic volume. To verify this characteristic, the average

- 69 -
difference in speed limits between major and minor roads per intersection was calculated
at the intersections in all counties except Dade and Brevard counties where the speed
limit data were not available for the minor roadways. It was found that the average speed
limit difference was relatively higher at the T-Intersections (12.55 mph) than the four-
legged two-way intersections (10.57 mph) and the 4-legged one-way intersections (6.7
mph). Thus, higher severity at the T-intersections may be because i) large speed
difference between the major and minor roads caused higher impact of crashes when
vehicles from different roads collide; and/or ii) the duration of red-light phase for minor
roads is generally longer than major roads at the T-intersections and drivers on minor
roads tend to be more impatient and rush into major roads. Such sudden movement is
likely to reduce the amount of time to accelerate to meet the large increase in speed limit
on the crossroad. For the same reason, smaller speed limit difference between major and
minor roads at the four-legged one-way intersections resulted in relatively lower injury
crashes compared to the other intersection types.
7.4 Conclusions This study examined the variation of crash frequency and severity with the size
and type of intersections. The size of intersections was represented by the total number of
lanes on all roads including left-turn and right-turn lanes. The type of intersections was
classified based on the directions of travel and the connection between major and minor
roads. The results showed that the expected crash frequency expressed as the average
number of crashes per intersection per year generally increased as the total number of
lanes increased at all types of intersections. However, the rates of increase were different
- crash frequency increased with the size of intersections at higher rate at the four-legged

- 70 -
two-way intersections than the other intersection types. This result suggests that as the
intersection geometry becomes more complex, increasing the size of intersections has
more impact on increasing the number of crashes. The result also showed that the
dominant crash types were different at different intersection types. An angle crash was
dominant at the four-legged one-way intersections unlike the other intersection types
where a rear-end crash was dominant. On the other hand, higher severity was observed at
the four–legged two-way intersections than the four-legged one-way intersections due to
more conflict points. Contradicting results were also observed at the T-intersections
where injury severity was higher in spite of less conflict points. This may be because
large difference in speed limits between major and minor roads contributed to higher
impact when two vehicles from different roads collide.
The findings in this study provide strong evidences that the patterns of crashes by
type and severity vary with the size and type of intersections. This indicates that the
characteristics of intersections not only change traffic patterns and driver behavior but
also the patterns of crash occurrence. Thus, in the future analysis of crashes at
intersections, we recommend that the size and type of intersections be considered to
account for the effects of intersection characteristics on crash risk.
The appeal of using the approach developed in this research to use the intersection
size represented by the total number of lanes from all approaches is the simplicity to
apply and therefore identify the crash profile by type and severity. It would be easy for a
traffic engineer to apply the simple equations developed here by knowing only the
number of lanes, x in the equations shown in Figures 7.1 to 7.3 (an approach similar to
the ITE trip generation manual). The engineer can simply calculate the expected crash

- 71 -
profiles (by type and severity), and therefore determine if a specific type or severity at a
specific intersection is above these expected profiles and hence warrant a treatment. The
attractiveness of using the intersection size is that it represents various traffic and
geometric features of the intersection including both major and minor roadways, traffic
volume, cycle length, number of phases, pedestrian crossing width, among other factors
(i.e., larger intersections are expected to have more traffic, longer cycles and more
phases).

- 72 -
8 NEURAL NETWORK TREES AND SIMULATION DATABASES: NEW APPROACHES FOR SIGNALIZED INTERSECTION
CRASH CLASSIFICATION AND PREDICTION
8.1 Introduction
According to the Federal Highway Administration (FHWA) (2002), more than 2.8
million intersection-related crashes occurred in the United States in the year 2000, which
represented 44% of the total crashes reported. Around 8,500 fatalities, representing 23%
of the total fatalities, and almost one million injury crashes had occurred at intersections.
FHWA also states that more than half of all rear-end crashes occur at or near
intersections and more than one-third of all deaths to vehicle occupants occur in angle
crashes. Both human and property damage losses from rear-end crashes cost the United
States billions of dollars each year in medical expenses, lost productive time and
numerous property insurance claims. The cost to society for intersection-related crashes
is approximately $40 billion a year. According to the Bureau of Transportation Statistics,
6,328,000 crashes were estimated to have occurred in the year 2003, of which there were
42,643 fatalities and approximately 3 million injuries. Of these fatalities, 21% were
reported as intersection fatalities. Therefore there is a need to analyze the crash patterns
at various intersections and come up with models that can make the intersections safer.
Therefore, the main objective of this analysis is to analyze the crash characteristics at
signalized intersections and to develop models that will be helpful in increasing safety at
intersections. This will be accomplished by estimating the frequency of crashes at
signalized intersections using various geometric and traffic characteristics of the
intersections.

- 73 -
8.2 Literature Review Various analysis methods have been used in the past to study the safety of
highways and intersections. Poch and Mannering (1996) presented a negative binomial
analysis to study the relationship between road geometrics/traffic related elements and
crash frequencies at intersections. Four different models were developed that predicted
total crash frequency, rear-end crash frequency, angle crash frequency and approach turn
crash frequency. The models are able to identify the factors that tend to increase/decrease
the crash frequencies for various collision types. Hence the authors conclude that the
negative binomial regression model can be satisfactorily used in identifying the
significant traffic and geometric elements that tend to increase or decrease the crash
frequency.
Another study to formulate practicable crash prediction models that would
describe the expected number of crashes at junctions and road links in urban areas was
conducted by Greibe (2003). A Poisson distribution model was used to identify factors
affecting safety, geometry, land use, etc. The results for both roadway segments and
intersections indicated that ADT contributed the most to crash frequency.
Abdel-Aty et al. (2005) used the HTBR (Hierarchical Tree Based Regression)
model developed to predict the frequency of crashes in each collision type and to
determine if there was a difference between models based on complete and restricted
datasets. These models clearly indicated the factors that lead to increased crashes at
signalized intersections.
Abdelwahab and Abdel-Aty (2001) discuss the classification of injury severities
of crashes at signalized intersections into three levels (no injury, possible/evident injury,

- 74 -
and disabling injury/fatality) using Artificial Neural Networks (ANNs). MLP Neural
Network and Fuzzy ARTMAP Neural Network are the two ANN models that have been
used to classify the injury severities. The MLP neural network indicated a better
classification accuracy.
The main objective of the work carried out by Abdelwahab and Abdel-Aty (2002)
was to investigate the use of fuzzy Adaptive Resonance Theory MAP (ARTMAP) neural
networks to analyze and predict injury severity of drivers involved in traffic crashes. The
authors also carried out a simulation experiment to extract knowledge from the trained
network. Simulated input patterns were created using all possible combinations of input
variables. The variables were plotted and the relationships between them were identified.
Then these results were transformed into marginal effects to show the significance of an
input variable on driver injury severity.
A more recent publication by Abdelwahab and Abdel-Aty (2004) compares the
injury severity level prediction capability of a Multilayer Perceptron (MLP) Neural
Network to the prediction capability of a fuzzy Adaptive Resonance Theory (ARTMAP)
neural network and an Ordered Probit Model. MLP was found to be a promising model in
modeling injury severity.
Liu and Young (2004) developed models using back propagation MLP neural
networks to study the effect of intersection characteristics on intersection related traffic
crashes. The output obtained was very accurate for the test data. A sensibility study was
conducted to find the variables that had a greater influence on the crashes. A scheme for
improvement of intersection deficiencies was proposed using the generated model.

- 75 -
8.3 Methodology
Artificial Neural Networks (ANN) have been used in this study to analyze the
safety of signalized intersections because of their strong advantages, like their ability to
perform massive computations through their massively parallel distributed structure and
their ability to learn and generalize (Christodoulou and Georgiopoulos, 2001).
MLP neural networks are an important class of neural networks and are very
widely used. Typically, an MLP neural network consists of a set of source nodes that
constitute the input layer, one or more hidden layers of computation nodes, and an output
layer of computation nodes. A descriptive diagram of the MLP neural network is given in
Figure 8.1. The input signal propagates through the network in a forward direction on a
layer-by-layer basis.
The aim of the training phase of the MLP neural network is to map a given set of
inputs in the training data, say x(1), x(2)…. x(PT), to the output values in the training
data, say d(1), d(2),… d(PT) respectively. Hence the input x(p) has to be mapped to the
output d(p). For this purpose, the following error function is constructed:
2 2 2
1
1( ) [ ( ) ( )]2 i
Ip
ii
E w d p y p=
= −∑
The objective is to change the weights w so that the error function is minimized,
which means that the actual output is being made as close as possible to the desired
output. The error is back-propagated through the neural network to adjust for the weights
between the layers. The error function is minimized using the gradient descent procedure
that changes the weight vector w by an amount proportional to the negative gradient of
the function E(w). Using detailed calculations, Christodoulou and Georgiopoulos (2001)

- 76 -
determine the amount by which the weights in each layer can be changed so as to
minimize the weight functions.
Figure 8.1 Multi Layer Perceptron Feedforward Network (Christodoulou and Georgiopoulos, 2001)
Input Layer K Input Nodes
Hidden Layer J Hidden Nodes
Output Layer I Output Nodes
X1(p) X2(p) XK(p)
Y1(p) Yi(p) YI(p)
Output Values
Input Values

- 77 -
The error is minimized until a stopping criterion is met. The stopping conditions
usually set are that the number of epochs (or presentations of the inputs) does not exceed
a certain value, or the error function becomes sufficiently small (Christodoulou and
Georgiopoulos, 2001).
The probabilistic neural network (PNN) was developed by Donald Specht. This
network provides a general solution to pattern classification problems by following an
approach of the Bayesian classifiers. The network paradigm also uses Parzen Estimators
which were developed to construct the probability density functions required by Bayes
theory.
The structure of the PNN has been shown in Figure 8.2. The input nodes provide
the same input values to the nodes in the pattern layer. Each pattern unit forms a dot
product of the input vector X with the weight vector Wi: Zi = X * Wi, and then performs
a nonlinear operation on Zi before outputting its activation level to the summation unit
(10). Instead of a sigmoid function commonly used for backpropagation, the nonlinear
operation used in PNN is exp[(Zi -1)/σ2]. Both X and Wi are normalized to unit length
which is equivalent to using the probability density function:
F(X) = exp( -(Wi - X)t(Wi - X)/2σ2)
Where i is the pattern number, X is the training pattern and σ is the smoothing
parameter or the spread. The network is trained by setting the Wi weight vector in one of
the pattern units equal to each of the X patterns in the training set and then connecting the
pattern unit's output to the appropriate summation unit. A separate neuron (also called
pattern unit) is required for every training pattern. The same pattern units can be grouped

- 78 -
by different summation units to provide additional pairs of categories and additional bits
of information to form the output vector.
Figure 8.2 Structure of a Probabilistic Neural Network (Chen, 1996)
A GRNN provides estimates of continuous variables and converges smoothly to
underlying linear or nonlinear regression surface (Chen, 1996). Like PNN, a GRNN
features instant learning and a highly parallel structure. GRNN provides smooth
transition from one observed value to another even with sparse data in multidimensional
measurement space. The GRNN can also be used for regression problems where an
X1 Xj Xp
fA(X) fB(X)
Output Layer
A1 Am B1 Bn
Input Layer
Summation Layer
Pattern Layer

- 79 -
assumption of linearity is not justified. GRNN uses Parzen’s estimators along with a joint
continuous probability density function.
8.4 Using Neural Networks to Identify Higher Risk Intersections Initially, an analysis was carried out to predict the frequency of crashes at various
intersections using different neural network models and identifying the geometric and
traffic characteristics at intersections that affect particular types of crashes. If the analysis
models predict that an intersection incurs a considerable number of crashes, the
characteristics of the intersection can be changed so as to make the intersection safer.
In order to accomplish this, a database was developed that contained the
geometric and traffic characteristics of the 1562 intersections, which would act as an
input to the neural network models predicting the crash frequency, and the frequency of
crashes occurring at each intersection averaged per year. Therefore the input database
consisted of number of through lanes on the major road and minor roadways, Total Left
Turning Lanes (LTL) at the intersection, number of Protected Left Turning Lanes on the
major (LTPMJ) and minor (LTPMN) roadways, number of channelized right turning
lanes on the major (RTCMJ) and minor (RTCMN) roadways, Speed Limit and AADT on
the major road (The speed limit and AADT were not used for the minor roadway as this
data was not available for all intersections).
Then the GRNN and MLP neural network models were used to predict the crash
frequency at these intersections using “MATLAB”. The essential steps in developing the
MLP neural network model were:
1. Normalizing the input database with unit variance.

- 80 -
2. Randomizing the input data and take the first 75% of the data for training and
the rest 25% for testing.
3. The Resilient Back Propagation (rprop) neural network was used in the
training.
4. The activation functions that proved to be the best for the hidden and output
layers were hyperbolic tangent sigmoid and pure linear respectively.
5. The maximum number of epochs used was 3000. The learning rate was 0.05.
6. The number of nodes in the hidden layer were varied from 1-15.
7. The Root Mean Squared Error (RMSE) was calculated for the test database
for each different number of hidden nodes.
8. The process was repeated for 5 times and the results were averaged.
For the GRNN model, steps 3 to 6 were replaced by a single step where the
spread was varied from 0.01 to 4.99 with increments of 0.02. However, the least average
RMSE obtained for the GRNN and MLP neural network models was 9.44 and 9.02
crashes/year respectively. Hence this model was not considered suitable for predicting the
crash frequencies at signalized intersections.
The possible reason because of which the errors were so large was that the crash
frequency per intersection ranged from 0 to 113, and the models were unable to perform
well when the intersections had high crash frequencies. A very small percentage of
intersections have a very high number of crashes, and the models developed cannot
predict these crash frequencies correctly leading to a large error. Hence an appropriate

- 81 -
method was sought after that could accurately predict crashes for all range of crash
frequencies.
A new methodology was devised to predict the crash frequencies more precisely
at signalized intersections. First, the total number of lanes at each intersection was
calculated by summing up the number of through lanes, exclusive left turning lanes and
channelized right turning lanes on the major and minor roads. Since this number indicates
the total number of lanes at the intersection, it is a representation of the size of the
intersection. Then a graph was drawn to observe the variation of the average number of
crashes per intersection with the total number of lanes at the intersections. The graph
clearly showed an increasing trend of total crashes per intersection as the total lanes at the
intersections increase. Thus it can be concluded that the number of crashes at an
intersection increase as the size of the intersection increases. Therefore, any intersection
can be classified into one of the following types: (a) the intersection has more crashes
than the average number of crashes for intersections with the same number of total lanes;
(b) the intersection has less than or equal number of crashes than the average number of
crashes for the intersections with the same number of total lanes. The intersections in the
former category can be considered as “higher risk intersections” while the rest can be
considered as “lower risk intersections”. Therefore, intersections can be categorized into
higher risk or lower risk intersections based on the total crashes it has incurred and the
total number of lanes it has. In order to predict the crash frequencies, a model can first be
developed that easily and efficiently classifies intersections into higher risk or lower risk
categories. Then the frequency of crashes can be predicted for the higher risk or lower
risk intersections by developing separate models for the two types. This method develops

- 82 -
models for separate data ranges, and can thus be expected to reduce the error in crash
frequency prediction. In order to classify intersections into higher risk or lower risk
intersections first, the intersections with total lanes between 3 to 5, 6 to 10, 11 to 15, and
16 and above were grouped together and the average crashes per intersection were found
for these groups. If an intersection incurred more crashes than the average number of
crashes for its total number of lanes, the intersection was categorized as a higher risk
intersection. If not, it was categorized as a lower risk intersection. The neural network
models used for this classification were the MLP and PNN models. Separate GRNN and
MLP neural network models were developed to predict the number of crashes at higher
risk or lower risk intersections. The models that worked the best were used as the final
models for predicting the frequency of crashes at the intersections.
The MLP neural network model was developed as was discussed earlier. PNN
and GRNN models were developed in a manner similar to the GRNN model developed
earlier. The classification accuracy was estimated for the test database in the
classification phase. The MLP and PNN models showed a classification accuracy of
64.66% and 65% respectively. The RMSE for the MLP and GRNN models used in the
prediction of higher risk or lower risk intersections was 2.75 and 2.79 crashes per year
respectively, and the same for higher risk intersections was 5.76 and 5.88 crashes per
year. Therefore, the models displayed reasonable accuracies that were better than the
error previously obtained.
The significant variables were identified using a Forward Sequential Selection
method. According to this method, just one input variable is used at a time to train and
test the databases. Once all the inputs have been used individually, the test accuracies are

- 83 -
compared. The variable that gives the maximum accuracy is chosen as the most
significant variable. Then training and testing of databases is carried out by using this
variable along with the other input variables one at a time. The variable whose
combination with the first significant variable gives the highest accuracy is chosen as the
next significant variable. This process is repeated till there is no further increase in
accuracy by addition of any of the variables. All the variables selected in this process are
determined to be the significant variables in the model.
The neural network model that displayed the least error was used for identifying
the significant variables in each step of the analysis. For example, the PNN model was
used to identify the significant variables in the classification phase, and the significant
variables obtained were AADT, speed limit, LTPMJ, LTL and RTCMN. This is a
reasonable result because an increase in these factors can be expected to increase the
crash frequencies at intersections, thus making them risky. The test accuracy of the model
increased to 67.6%. Similarly, LTPMN, AADT and RTCMN were found to be significant
in predicting the frequency of crashes at lower risk intersections, and the number of
through lanes on the minor roadway, total left turning lanes and through lanes on the
major roadway were determined to be significant for predicting the frequency of crashes
for higher risk intersections.
Similar models were developed to predict the frequency of rear end, angle,
sideswipe and turn crashes. Left turning and right turning crashes were combined into
one category as the right turning crashes were very small in number. The summary of
results displaying the best neural network models found for each phase and the accuracy
of the neural network models have been shown in Table 8.1.

- 84 -
Table 8-1 Best neural network models identified for each phase of the analysis method along with the classification accuracies or the RMSE values
Total Crashes Rear End Angle Turn Sideswipe
Classification Model/Accuracy PNN/67.6% PNN/68.22% PNN/68.24% PNN/64.43% PNN/71.6%
Crashes: Lower Risk Model/RMSE MLP/2.62 GRNN/1.37 MLP/0.78 GRNN/0.61 GRNN/0.45
Crashes: Higher Risk Model/RMSE MLP/5.35 MLP/4.3 GRNN/2.65 GRNN/2.3 GRNN/2.3
Identifying the significant variables is the first step in predicting how the input
variables affect the output. The affect of a change in input on the output has to be found.
The factors that tend to increase the crash frequency at an intersection can be checked
and controlled if an intersection is found to have a large number of crashes and hence is
risky for travel. For this purpose, a “simulation” database was created that contained all
possible combinations of the original 9 input variables. This database contained all
possible intersection types that could be generated with the input variables. For example,
the AADT was varied from 10000 to 80000 with increments of 10000, speed limit was
varied from 30 to 55 mph with increments of 5 mph, and so on. To make the database
realistic some constraints were placed. For example, the minor lanes were always set to
be equal to or less than the number of major lanes, the number of left turning lanes was
always equal to or lower than the sum of major and minor lanes at the intersection, but
never exceeding 8, and so on. The total number of intersections obtained using this
method was 98928. The frequency of different types of crashes was estimated for all of
the intersections by initially identifying if each intersection was higher risk or lower risk
and then predicting the frequency of crashes for higher risk and lower risk intersections
separately. This was carried out using the models developed earlier. Therefore, the
expected frequency of crashes was determined for each intersection in the simulation

- 85 -
database. The number of crashes occurring at intersections with each value of the input
variable was found out. For example, the number of crashes occurring at different values
of AADT were found and plotted. This plot establishes a trend of variation of the number
of crashes occurring at the intersection with a change in AADT. Similar plots were drawn
for all input variables and their affect on the output variable was established. One such
graph is shown in Figure 8.3, where the increase in the number of through lanes on the
major roadway leads to an increase in the frequency of crashes occurring at the
intersections. The frequency of rear end, angle, turn and sideswipe crashes was also
estimated for the intersections in the simulation database. The effect of the significant
input variables on the output was determined. Table 8.2 illustrates the results of testing
the models on the simulation database. The cells show the type of pattern each input
variable shows for predicting the frequency of different types of crashes. “Increase”
means that crashes increase with an increase in the input variable. “-“ means that the
variable was not found to be significant in predicting the frequency of crashes. Most of
the variations obtained are reasonable and comparable to ones obtained by Abdel-Aty et
al (2005), Poch and Mannering (1996) and Greibe (2003).
6.66
14.49
11.75
6.00
8.00
10.00
12.00
14.00
16.00
2 4 6
Number of Through Lanes on the Major Roadway
Cra
shes
per
Inte
rsec
tion
Figure 8.3 The output for the simulation database indicates that the average number of
crashes per intersection increases with an increase in the number of through lanes on the major roadway

- 86 -
Table 8-2 Relationship between the input variables and the frequency of various types of crashes
Total Crashes Rear End Angle Turn Sideswipe
MJ Lanes Increase Increase Increase Increase Increase MN Lanes Increase Increase Increase Increase Increase Total LTL Increase - - - - MJ LTP Decrease Increase Decrease Decrease Increase MN LTP Increase Increase Increase Increase - MJ RTC - - - Increase Increase MN RTC Decrease Increase - - - MJ Speed - Increase - - - MJ AADT Increase Increase Increase Increase Increase
8.5 Classification of Crashes Using Neural Network Trees
Since the output of the previous analysis only indicated if an increase or decrease
in an input variable leads to an increase or decrease in the frequency of crashes, it had to
be determined the crash type that will be most probable to occur with a change in the
input variable. This could be determined by classifying crashes into their individual crash
types. An analysis was conducted to estimate the collision type of a crash based on the
intersection properties, traffic characteristics and conditions prevalent at the time of the
crash. Given any of these characteristics and given the criterion that a crash will occur,
the models formed in the analysis would predict the type of collision the crash will be
subjected to.
The input variables consisted of the nine input variables used in the previous
analysis, along with the light and surface conditions at the time of the crash, month, day
and time category of the crash, and the speed limit and AADT on the minor roadway of
the intersections at which the crash occurred. Initially, the rear end, angle, turn (right +
left turning) and sideswipe crash types were classified into their individual types using

- 87 -
MLP and PNN models. But the test classification accuracies obtained were 50.3% and
39.4%. Since the MLP and PNN performed below expectation to predict the collision
type of the crashes, they could not be used to satisfy our objectives. The neural networks
were not able to perform well with four output types. Therefore a new strategy had to be
used that could deal with this problem and also make the model significantly better. We
developed a new idea to use a Neural Network Tree.
In a Neural Network Tree, the classes of collision type could be wisely combined
together to obtain two classes instead of four. It was perceived that more often than not,
rear-end and sideswipe crashes occur along the same direction. Hence they usually have
the same characteristics. On the other hand, angle and turn crashes usually occur because
of the interference of traffic from one direction with the other. Therefore, they have a
similar pattern. This resulted in a method in which the rear-end and sideswipe crashes
together were combined into one category and angle and turn crashes into another
category. Thus a neural network model was first developed to classify a crash into these
two categories based on the 16 variables identified in the earlier sections. This
classification would form the first branch of the neural network tree. The next branch
would classify rear-end and sideswipe crashes and the third branch would classify the
angle and turn crashes. Then the models could be used to identify the significant
variables and identify their effect on the crashes. Overall, the tree structure will be
constructed in the following pattern:
1. In the database used for prediction of the collision types, the rear end and sideswipe
crashes will be combined to form category 1 and angle and turning crashes will be
combined to form category 2.

- 88 -
2. MLP and PNN models will be used to classify the two categories.
3. The model with higher classification accuracy will be identified.
4. Significant variables will be identified for the models.
5. This model will be used on a test database to check how the variation of input affects
the output.
6. The previous steps will be repeated to develop the other two branches of the neural
network tree.
7. The Neural network tree will be formed with a neural network model at each node.
The MLP and PNN models were developed for each branch using the same
method discussed in the previous section. The only difference being that the crash
database for the year 2000 was used as the training database, and the crash database for
2001 was used as test database. The results obtained using the Neural Network Tree were
considerably better than the previous results, and have been shown in Figure 8.4. The
significant variables were identified for all the branches using the Forward Sequential
Selection method, and have been listed in Table 8.3.
Table 8-3 List of Significant variables for each branch of the Neural Network Tree
Branch 1 Branch 2 Branch 3 AADT Major # through Minor lanes AADT Minor AADT Minor LTPMN LTPMN
Speed Limit Minor # through Major lanes Surface Conditions Surface Conditions LTPMJ LTPMJ Light Conditions Speed Limit Major AADT Major
# through Major lanes LTL Speed Limit Major
LTL RTCMN LTPMN RTCMJ

- 89 -
Figure 8.4 Diagram indicating the prediction accuracies of the Neural Network Tree
In order to obtain the exact effect of the input variables on the different types of
crashes simulation databases were built for each branch of the Neural Network Tree
using the significant variables identified for that particular branch, and the classification
was carried out for all the data in this database. To establish a relationship between the
input variables and the type of collision for branch 1 of the Tree, the number of rear end
and sideswipe crashes was determined for each value of the input variables. This was
divided by the total number of crashes in the simulation database with the respective
values of input variables to obtain the percentage of rear end and sideswipe crashes. For
example, the number of rear end and sideswipe crashes classified by the MLP neural
RE & SS vs
Angle & Turn (MLP)
60.59% 55%
RE vs SS (PNN)
Angle vs Turn (MLP)
55.37% 54.73%
Angle Turn
57.81%
55.05%
48.52% 67.42%
RE SS
58%
Branch 1
Branch 2 Branch 3

- 90 -
network model for the value of Major AADT = 10000 was found. This value was divided
by the total crashes in the simulation database having Major AADT of 10000 to obtain
the percentage of rear end and sideswipe crashes for this value of Major AADT. This
percentage signifies a value where if 100 crashes have occurred at different intersections
with AADT of 10000 (or any other input value), this percentage of crashes are most
probably to be of the rear end or sideswipe collision type. The percentages were similarly
found for the other Major AADT values (20000 to 80000). These values were plotted on
a graph to obtain the variation of rear end and sideswipe crashes with Major AADT. The
same graph contained the variation for angle and turn crashes. Similar graphs were
plotted for each branch of the Tree. A sample of such graphs is shown in Figure 8.5. This
graph indicates that if a crash occurs at a major roadway with lower speed limit, it is
more probable to be an angle or turn crash. But at a higher speed limit it is more probable
to be a rear or a sideswipe crash. The study in the previous section found the major speed
limit to be significant in predicting the rear end crashes. Therefore, the increase in speed
limit can be expected to increase the rear end crash and sideswipe crashes more than the
angle and turn crashes. However, at lower speed limits, the rear end and sideswipe
crashes are less likely to occur because a vehicle traveling at such speeds can stop easily
to prevent such crashes. Therefore, if there is a crash at lower speed limits, it is more
likely to be an angle or turn crash. Such graphs were plotted for the significant variables
identified for each branch of the Neural Network tree. They were compared to the results
from other studies as well as the results obtained in the previous section, and were found
to explain the crash phenomenon satisfactorily. Thus the Neural Network Tree can be
used as an effective method in classifying various collision types.

- 91 -
Figure 8.5 Variation of the collision types with Major Speed Limit
8.6 Conclusions This study has put forth innovative studies that predict the frequency of crashes
and also classify crashes into rear end, angle, turn or sideswipe crash types. While
predicting the frequency of crashes, the intersections were classified into higher risk or
lower risk intersections and the frequency was predicted for each type of intersections
separately. This method reduced the error in the crash prediction significantly, when
compared to the models where the crash frequency is estimated directly. The advantage
of using this method is that the crash frequency is predicted along with an accurate
identification of higher risk intersections. The crash frequency and the identification of
higher risk intersections was carried for a large simulation database containing all
possible combinations of signalized intersections. This database can be used directly for
Speed Limit on the Major Road vs Percentage of Collision Types
0
10
20
30
40
50
60
70
80
25 30 35 40 45 50
Speed Limit on the Major Road
Per
cent
age
of C
ollis
ion
Type
s
Rear End and SideswipeAngle and Turn Crashes

- 92 -
determining the crash frequency at any intersection, thus eliminating the need for a reuse
of the model. The trends derived from the output of the simulation database for the affect
of the intersection characteristics on the frequency of crashes was comparable to the
results obtained in other studies. The Neural Network Trees demonstrate the flexibility of
the neural network methods, and generated output with a satisfactory efficiency. The
output for the simulation databases developed was comparable to the output obtained in
other studies. On comparison of the MLP and PNN neural networks, both were found to
perform better in different cases. But for classifying intersections into higher risk or
lower risk with respect to different collision types, PNN always performed better. PNN
was faster in training databases compared to MLP. PNN also demonstrated its advantages
by not being trapped in local minima and has only one parameter that has to be varied in
order to obtain optimum results. The only disadvantage found for PNN was that it takes a
long time and consumes a lot of memory in simulating the results of a test database.
Therefore large databases had to be split up into parts in order to make the process faster
and less taxing on the computer. But on the whole, PNN can be considered as a better
method for classification. The GRNN and MLP neural networks showed similar
performances and hence can be considered equally efficient in predicting values.

- 93 -
9 CLASSIFICATION OF INTERSECTIONS INTO 45 CATEGORIES
9.1 Initial Classification into 38 categories
As the combined database had larger number of intersections, they could be
divided into a larger number of categories. Hence an analysis was conducted to increase
the number of categories of intersections in the combined database. All intersections from
the six counties were categorized into various types. The first step was to combine the
geometry files of all six counties. The geometry files were sorted based on the field
“int_id”, which is the unique ID assigned to each intersection. Intersections were filtered
out from this database based on the lane configuration of each intersection (2x2, 4x2,
etc). Separate tables were made for intersections of the same type. As AADT is one of the
most important factors affecting the crash frequency, the crashes were categorized based
on AADT/number of approach lanes on the major road. For each type of intersection the
median value of AADT was noted. The number of intersections for every 1000 AADT
values for each configuration of intersection was listed. A sample of such a list is shown
for the 2x2 intersections in Table 9-1.
In order to form categories for a particular type, the range of AADT was widened
and the number of intersections under each range was noted. Table 9-2 shows this
method for 2x2 intersections. The table first shows the initial splits made in AADT/lane,
and the intersections present in each of the splits (indicated in brackets). Then the range
of AADT/lane was widened to make six categories of intersections of the type 2x2. This
range was further increased to form three, and later two categories. It was decided to split

- 94 -
the intersection into three categories (shown in bold) because the split of the intersections
was even and each category had sufficient number of intersections.
Table 9-1 Initial sampling of 2 x 2 intersections based on the AADT/Major Lane values
2 x 2 Total number of intersections = 175 Median = 5874 = approximate by 5900 or 6000
Split Number AADT Range Number of Intersections 1 =< 3000 11 2 > 3000 and =< 4000 12 3 > 4000 and =< 5000 38 4 > 5000 and =< 6000 31 5 > 6000 and =< 7000 20 6 > 7000 and =< 8000 14 7 > 8000 and =< 9000 15 8 > 9000 and =< 10000 7 9 > 10000 and =< 11000 10 10 > 11000 17
At the end of this process, there were various combinations of categories for each
type of intersection. The optimum number of categories for each type was obtained by
making sure that (a) the number of intersections in each category was almost the same,
(b) adequate sample size is achieved, and, (c) the cutoff AADT/lane values were similar.
Categories were formed based on this range so that the number of intersections in all
categories was as close as possible. Various combinations of categories were formed for
each type of intersection with different range of AADT values.

- 95 -
Table 9-2 Categorizing the intersections based on different AADT/lane for 2x2 intersections
Total number of intersections = 175 Median = 5874 = 6000 (approx) splits: ≤ 3000 (11)
> 3000 and ≤ 4000 (12) > 4000 and ≤ 5000 (38)
> 5000 and ≤ 6000 (31) > 6000 and ≤ 7000 (20) > 7000 and ≤ 8000 (14) > 8000 and ≤ 9000 (15) > 9000 and ≤ 10000 (7) > 10000 and ≤ 11000 (10) > 11000 (17)
6 Categories: ≤ 4000 (23)
> 4000 and ≤ 5000 (38)
> 5000 and ≤ 6000 (31)
> 6000 and ≤ 8000 (34) > 8000 and ≤ 11000 (32) > 11000 (17)
3 Categories: ≤ 5000 (61)
> 5000 and ≤ 9000 (80) > 9000 (34)
2 Categories: ≤ 6000 (92) > 6000 (113)

- 96 -
All the types were categorized based on the AADT values. Since the intersections
of type 4x2 were very large in number (541), they were subcategorized based on a new
variable. First the intersections were subcategorized based on the number of left-turning
lanes. But a majority of the intersections had 4 left-turning lanes. Hence the sub-
classification of intersections based on left-turning lanes was not considered appropriate.
Thus this variable was discarded for the purpose of sub-classification. Next, the
intersections were subcategorized based on the speed limit on the major road. The median
speed was 40mph, and sub-classification based on this speed produced satisfactory
results. Therefore the 4 x 2 intersections were classified first by AADT and then by the
speed limit on the major road.
This method was adapted to develop classifications for all types of intersections.
After completing the classification, 38 categories of intersections were developed. These
have been tabulated in Table 9-3. Then a summary of intersections was developed
indicating the number of categories formed for each type of intersection. This has been
shown in Table 9-4.

- 97 -
Table 9-3 Classification of intersections into 38 types
S.No Type Condition for AADT/Lane of Major Road # Intersections
1 =< 5000 61 2 > 5000 and =< 9000 80 3
2 x 2
> 9000 34 4 =< 5000 and MJ speed =< 40 41 5 =< 5000 and MJ speed > 40 37 6 > 5000 and =< 7000 and MJ speed =< 40 48 7 > 5000 and =< 7000 and MJ speed > 40 65 8 > 7000 and =< 9000 and MJ speed =< 40 99 9 > 7000 and =< 9000 and MJ speed > 40 63 10 > 9000 and =< 11000 and MJ speed =< 40 41 11 > 9000 and =< 11000 and MJ speed > 40 42 12 > 11000 and MJ speed =< 40 32 13
4 x 2
> 11000 and MJ speed > 40 73 14 =< 5000 21 15 > 5000 and =< 7000 36 16 > 7000 and =< 9000 35 17 > 9000 and =< 11000 35 18
4 x 4
> 11000 31 19 =< 7000 44 20 > 7000 and =< 9000 49 21 > 9000 and =< 11000 37 22
6 x 2
> 11000 27 23 =< 9000 50 24
6 x 4 > 9000 40
25 =< 8000 26 26
2 x T2 > 8000 20
27 =< 7000 44 28
4 x T2 > 7000 69
29 4 x T4 28 30 6 x T2 42 31 6 x T4 14 32 One Way Major =< 7000 45 33 > 7000 40 34 One Way Minor 36 35 Both One way 13 36 One way and T 14 37 =< 7000 24 38
Ramps > 7000 26

- 98 -
Table 9-4 Summary of classifications
S.No Type Number of Categories
1 2 x 2 3 2 4 x 2 10 3 4 x 4 5 4 6 x 2 4 5 6 x 4 2 6 2 x T2 2 7 4 x T2 2 8 4 x T4 1 9 6 x T2 1 10 6 x T4 1 11 One Way Major 2 12 One Way Minor 1 13 Both One Ways 1 14 One way and T 1 15 Ramps 2 Total 38
9.2 Further Classification into 45 categories
The next step was to check if any further classifications in the categories were
needed and possible. The number of intersections and the crash statistics for each type
were summarized in Table 9-5. Twenty types which have few cases were not enough for
separate categories. In addition, these intersections cannot be combined with other types
since their mean crashes do not follow similar trends. These abnormal types were
highlighted in bold font in Table 9-5 and were removed from further consideration.

- 99 -
Table 9-5 Intersection configurations and summary statistics
Intersection
Configurations Number of
Intersections Mean of Crashes
Standard Deviation
Minimum Number of Crashes
Maximum Number
2x2 169 6.11 7.677302 0 583x2 5 6.80 4.604346 1 123x3 1 27.00 - 27 274x2 496 11.46 12.59878 0 944x3 28 17.93 15.30657 0 435x2 6 15.50 19.15985 0 445x3 2 53.50 45.96194 21 862x4 9 14.78 21.08778 0 673x4 1 88.00 - 88 884x4 149 23.09 20.92565 0 1305x4 8 31.50 23.07132 0 726x2 133 16.77 12.35069 0 556x3 17 32.76 23.28231 3 817x3 1 6.00 - 6 6 8x2 9 11.78 14.45491 0 358x3 1 40.00 - 40 406x4 69 33.78 22.60978 0 916x5 2 73.00 12.72792 64 828x4 7 37.43 25.56597 9 866x6 12 45.25 24.57317 0 858x6 1 64.00 - 64 64
2xT2 43 2.72 3.111619 0 153xT2 3 6.00 9.539392 0 174xT2 103 5.99 6.272403 0 292xT4 2 4.00 2.828427 2 6 4xT3 1 0.00 - 0 0 5xT2 4 23.50 30.44667 6 694xT4 26 11.81 15.05993 0 623xT4 1 0.00 - 0 0 5xT4 1 1.00 - 1 1 T5x4 1 6.00 - 6 6 6xT2 40 11.18 11.47994 0 536xT3 1 0.00 - 0 0 8xT2 3 24.33 11.59023 11 326xT4 9 11.11 11.63448 0 396xT6 1 40.00 - 40 407xT4 1 8.00 - 8 8 8xT4 1 1.00 - 1 1 T6x4 1 1.00 - 1 1
Both One Way 13 10.92 14.25051 0 54Major One Way 85 13.67 16.91533 0 106
Minor One 36 15.31 14.79154 0 65One Way & T 12 12.08 7.844608 3 29
Ramps 48 5.98 8.22681 0 35Total Number
of Intersections
1562 - - - -

- 100 -
There were 10 intersection types which have moderate cases as shown in Table 9-
5, e.g. ‘3x2’, ‘4x3’, ‘2x4’, ‘5x2’, ‘5x4’, ‘6x3’, ‘8x2’, ‘8x4’, ‘6x6’ and ‘6xT4’. We need to
check whether these types should be included into main types or put into new categories.
The graphical methods like histogram, box plot, or scatterplot were used and the simple
statistics for different intersection types will be calculated for comparison.
9.2.1 Check ‘3x2’
Type ‘3x2’ might be included into main type ‘2x2’. The crash distributions for
intersection type ‘2x2’ and ‘3x2’ were compared using histogram as shown in Figure 9.1.
The comparative histograms are displayed in two rows per type with the descriptive
statistics containing the sample mean, standard deviation, maximum, minimum, and
sample size for each type in the corresponding tile.
Figure 9.1 Crash comparative histograms for intersection type ‘2x2’ and ‘3x2’
Figure 9.1 shows that the crash distributions for type ‘2x2’ and ‘3x2’ are similar
and that the spread for type ‘2x2’ is larger than that for type ‘3x2’. Type ‘2x2’ and ‘3x2’

- 101 -
have similar crash means, and type ‘3x2’ have few cases; therefore, type ‘3x2’ is
suggested to being combined into main type ‘2x2’ when creating crash tables.
9.2.2 Check ‘4x3’, ‘2x4’ and ‘5x2’
Type ‘4x3’, ‘2x4’ and ‘5x2’ might be included into main type ‘4x2’. First we
compare the crash distributions for intersection type ‘4x3’ and ‘4x2’ using comparative
histogram.
Figure 9.2 Crash comparative histograms for intersection type ‘4x2’ and ‘4x3’
Figure 9.2 shows that the spread for type ‘4x2’ is larger than that for type ‘4x3’,
and type ‘4x3’ have a larger percent of higher crash frequencies compared with type
‘4x2’. Type ‘4x2’ and ‘4x3’ have different crash means. A box plot was produced in
Figure 9.3 and shows the difference of crash distribution for these two types. Bar width
varies with number of observations for different types. It is suggested creating a separate
category for type ‘4x3’ when creating crash tables.

- 102 -
Figure 9.3 Crash box plot for intersection type ‘4x2’ and ‘4x3’
Second we compare the crash distribution for intersection type ‘2x4’ and ‘4x2’
using comparative histogram and box plot as shown in Figure 9.4 and 9.5, respectively.
Figure 9.4 Crash comparative histograms for intersection type ‘2x4’ and ‘4x2’

- 103 -
Figure 9.5 Crash box plot for intersection type ‘2x4’ and ‘4x2’
Type ‘2x4’ and ‘4x2’ have the same configuration but different type of major
approaches. Later the main type ‘4x2’ will be classified into 10 categories based on major
ADT per lane and major road speed limit. As shown in Figure 9.4 and 9.5, type ‘2x4’ and
‘4x2’ have similar crash distributions. It is suggested including type ‘2x4’ into the main
type ‘4x2’ when creating crash tables.
Finally, we compare the crash distribution for intersection type ‘5x2’ and ‘4x2’.
The crash comparative histogram and box plot for two types were produced in Figure 9.6
and 9.7, respectively.

- 104 -
Figure 9.6 Crash comparative histograms for intersection type ‘4x2’ and ‘5x2’
Figure 9.7 Crash box plot for intersection type ‘4x2’ and ‘5x2’
As shown in Figures 9.6 and 9.7, type ‘5x2’ and ‘4x2’ have different crash
distributions and crash mean. It is suggested creating a separate category for type ‘5x2’
when creating crash tables, but note that type ‘5x2’ have only 6 cases. As a summary, it
was suggested creating separate types for type ‘4x3’ and ‘5x2’ and including type ‘2x4’
into the main type ‘4x2’ when creating crash tables.

- 105 -
9.2.3 Check ‘5x4’
Type ‘5x4’ might be included into main type ‘4x4’. The crash distributions for
intersection type ‘4x4’ and ‘5x4’ were compared using histogram and box plot as shown
in Figure 9.8 and 9.9, respectively.
Figure 9.8 Crash comparative histograms for intersection type ‘4x4’ and ‘5x4’
Figure 9.9 Crash box plot for intersection type ‘4x4’ and ‘5x4’

- 106 -
From the above plots and statistics, it seems that both crash means and crash
distribution for intersection type ‘4x4’ and ‘5x4’ are different. It is better to separate
them.
9.2.4 Check ‘6x3’ and ‘8x2’
Intersections type ‘6x3’ and ‘8x2’ might be included into main type ‘6x2’. We
compare the crash distributions for intersection type ‘6x2’, ‘6x3’ and ‘8x2’ using
comparative histogram and box plot as shown in Figure 9.10 and 9.11, respectively. The
comparative histograms are displayed in three rows per type with the descriptive statistics
for each type in the corresponding tile.
Figure 9.10 Crash comparative histograms for intersection type ‘6x2’, ‘6x3’ and ‘8x2’

- 107 -
Figure 9.11 Crash box plot for intersection type ‘6x2’, ‘6x3’ and ‘8x2’
From the above plots and statistics, the crash means and distributions for type
‘6x2’ and ‘6x3’ are different. For type ‘8x2’, although it has the similar mean with type
‘6x2’, they have different distribution. It is better to separate them and create two
separate categories for ‘6x2’ and ‘8x2’ when creating crash tables.
9.2.5 Check ‘8x4’
Type ‘8x4’ might be included into main type ‘6x4’. We compare the crash
distribution for intersection type ‘6x4’ and ‘8x4’ using comparative histogram and box
plot as shown in Figure 9.12 and 9.13, respectively.

- 108 -
Figure 9.12 Crash comparative histograms for intersection type ‘6x4’ and ‘8x4’
Figure 9.13 Crash box plot for intersection type ‘6x4’ and ‘8x4’
From the above plots and statistics, the crash means and distributions for type
‘8x4’ and ‘6x4’ are different. It is better to separate them and create a separate category
for ‘8x4’ when creating crash tables, but note that type ‘8x4’ has only 7 cases.

- 109 -
Type ‘8x4’ might be combined with type ‘8x2’. We compare the crash
distribution for intersection type ‘8x2’ and ‘8x4’ using comparative histogram and box
plot as shown in Figure 9.14 and 9.15, respectively.
Figure 9.14 Crash comparative histograms for intersection type ‘8x2’ and ‘8x4’
Figure 9.15 Crash box plot for intersection type ‘8x2’ and ‘8x4’
From the above plots and statistics, the crash means and distributions for type
‘8x2’ and ‘8x4’ are different. So, it is better to separate them into two categories.

- 110 -
9.2.6 Check ‘6x6’
Type ‘6x6’ has 12 cases and they might be included into main type ‘6x4’. We
compare the crash distribution for intersection type ‘6x4’ and ‘6x6’ using comparative
histogram and box plot as shown in Figure 9.16 and 9.17, respectively.
Figure 9.16 Crash comparative histograms for intersection type ‘6x4’ and ‘6x6’
Figure 9.17 Crash box plot for intersection type ‘6x4’ and ‘6x6’
As shown in Figures 9.16 and 9.17, intersection type ‘6x4’ and ‘6x6’ have
different crash means; therefore, it is better to separate them.

- 111 -
9.2.7 Check ‘6xT4’
Type ‘6xT4’ has 9 cases and they might be included into main type ‘6xT2’. We
compare the crash distribution for intersection type ‘6xT2’ and ‘6xT4’ using comparative
histogram and box plot as shown in Figure 9.18 and 9.19, respectively.
Figure 9.18 Crash comparative histograms for intersection type ‘6xT2’ and ‘6xT4’
Figure 9.19 Crash box plot for intersection type ‘6xT2’ and ‘6xT4’
In Figures 9.18 and 9.19, the crash distributions and means for type ‘6xT2’ and
‘6xT4’ are similar, while the scatterplots of crash count vs. major ADT per lane for type

- 112 -
‘6xT2’ and ‘6xT4’ are different as shown in Figure 20 and 21; therefore, it is suggested
putting type ‘6xT4’ into a separate type when creating crash tables, but noted that type
‘6xT4’ have only 9 cases.
Figure 9.20 Scatterplot of crash count vs. major ADT per lane for type ‘6xT2’
Figure 9.21 Scatterplot of crash count vs. major ADT per lane for type ‘6xT4’

- 113 -
9.2.8 Summary of suggested added categories
There are 10 abnormal intersection types which have moderate cases. After we check
these types using graphical and statistical methods, we have several suggestions for
creating crash tables:
Combine type ‘3x2’ into main type ‘2x2’;
Combine type ‘2x4’ into the main type ‘4x2’; and,
Create a separate type for type ‘4x3’, ‘5x2’, ‘5x4’, ‘6x3’, ‘8x2’, ‘8x4’, ‘6x6’ and
‘6xT4’.
Twenty abnormal intersection types that have 30 intersections were removed at the
first step. Based on the above suggestions and previous analysis, the remaining 1532
intersections were classified into 45 categories for creating crash tables. See the Table 9-6
in the following page for the summary of intersection classification.

- 114 -
Table 9-6 Summary of intersection classification
Category Main Types Conditions Num of
Intersections Mean
of CrashesStd Dev Minimum Maximum
1 2 x 2 ≤ 5000 61 3.6 4.16 0 16 2 > 5000 and ≤ 9000 79 6.7 6.61 0 29 3 > 9000 34 9.4 12.02 0 58 4 4 x 2 ≤ 5000 and MJ speed ≤ 40 39 7.5 8.03 0 38 5 ≤ 5000 and MJ speed > 40 32 7.0 7.24 0 26 6 > 5000 and ≤ 7000 and MJ speed ≤ 40 45 9.1 14.45 0 94 7 > 5000 and ≤ 7000 and MJ speed > 40 59 7.0 7.80 0 41 8 > 7000 and ≤ 9000 and MJ speed ≤ 40 97 12.0 12.94 0 56 9 > 7000 and ≤ 9000 and MJ speed > 40 60 9.4 8.87 0 48 10 > 9000 and ≤ 11000 and MJ speed ≤ 40 40 15.4 13.90 0 66 11 > 9000 and ≤ 11000 and MJ speed > 40 39 14.1 13.38 0 49 12 > 11000 and MJ speed ≤ 40 29 23.5 18.91 0 73 13 > 11000 and MJ speed > 40 65 13.9 13.66 0 69 15 5 x 2 - 6 15.5 19.16 0 44 14 4 x 3 - 28 17.9 15.31 0 43 16 4 x 4 ≤ 5000 15 11.8 10.35 0 39 17 > 5000 and ≤ 7000 35 19.3 25.54 0 130 18 > 7000 and ≤ 9000 35 17.5 15.55 0 63 19 > 9000 and ≤ 11000 33 30.8 17.56 0 72 20 > 11000 31 30.9 22.87 0 79 21 5 x 4 - 8 31.5 23.07 0 72 22 6 x 2 ≤ 7000 41 14.5 13.94 0 53 23 > 7000 and ≤ 9000 37 15.6 9.80 0 37 24 > 9000 and ≤ 11000 33 18.5 12.27 0 54 25 > 11000 22 20.3 12.80 3 55 26 6 x 3 - 17 32.8 23.28 3 81 27 8 x 2 - 9 11.8 14.45 0 35 28 6 x 4 ≤ 9000 40 29.2 19.94 0 63 29 > 9000 29 40.2 24.79 0 91 30 8 x 4 - 7 37.4 25.57 9 86 31 6 x 6 - 12 45.3 24.57 0 85 32 2 x T2 ≤ 8000 24 2.5 2.67 0 10 33 > 8000 19 3.0 3.65 0 15 34 4 x T2 ≤ 7000 42 4.1 4.38 0 18 35 > 7000 61 7.3 7.04 0 29 36 4 x T4 - 26 11.8 15.06 0 62 37 6 x T2 - 40 11.2 11.48 0 53 38 6 x T4 - 9 11.1 11.63 0 39 39 Major 1 Way ≤ 7000 45 8.7 7.34 0 29 40 > 7000 40 19.3 22.23 0 106 41 Minor 1 Way - 36 15.3 14.79 0 65 42 Both 1 Way - 13 10.9 14.25 0 54 43 One Way & T - 12 12.1 7.84 3 29 44 Ramps ≤ 7000 20 5.1 6.77 0 22 45 > 7000 28 6.6 9.20 0 35 Total Intersections - 1532 - - - -
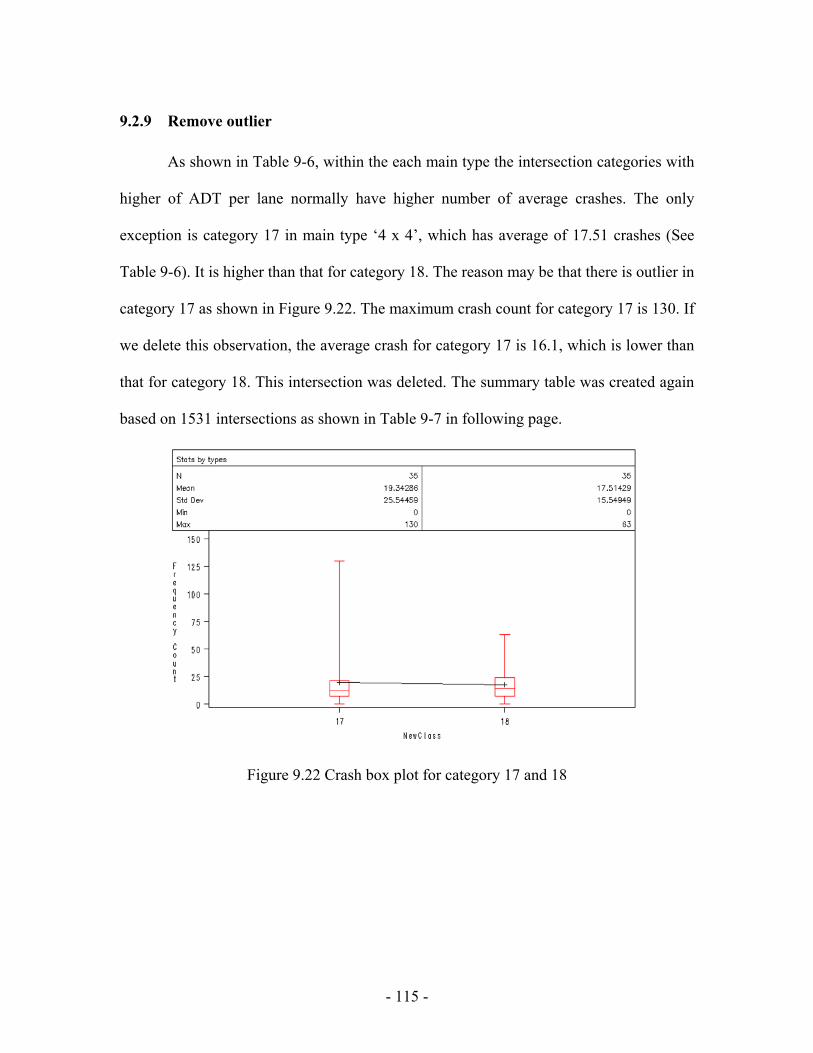
- 115 -
9.2.9 Remove outlier
As shown in Table 9-6, within the each main type the intersection categories with
higher of ADT per lane normally have higher number of average crashes. The only
exception is category 17 in main type ‘4 x 4’, which has average of 17.51 crashes (See
Table 9-6). It is higher than that for category 18. The reason may be that there is outlier in
category 17 as shown in Figure 9.22. The maximum crash count for category 17 is 130. If
we delete this observation, the average crash for category 17 is 16.1, which is lower than
that for category 18. This intersection was deleted. The summary table was created again
based on 1531 intersections as shown in Table 9-7 in following page.
Figure 9.22 Crash box plot for category 17 and 18

- 116 -
Table 9-7 Summary of intersection classification
Category Main Types Conditions Num of
Intersections Mean
of Crash Std Dev Minimum Maximum
1 2 x 2 ≤ 5000 61 3.6 4.16 0 16 2 > 5000 and ≤ 9000 79 6.7 6.61 0 29 3 > 9000 34 9.4 12.02 0 58 4 4 x 2 ≤ 5000 and MJ speed ≤ 40 39 7.5 8.03 0 38 5 ≤ 5000 and MJ speed > 40 32 7.0 7.24 0 26 6 > 5000 and ≤ 7000 and MJ speed ≤ 40 45 9.1 14.45 0 94 7 > 5000 and ≤ 7000 and MJ speed > 40 59 7.0 7.80 0 41 8 > 7000 and ≤ 9000 and MJ speed ≤ 40 97 12.0 12.94 0 56 9 > 7000 and ≤ 9000 and MJ speed > 40 60 9.4 8.87 0 48
10 > 9000 and ≤ 11000 and MJ speed ≤ 40 40 15.4 13.90 0 66 11 > 9000 and ≤ 11000 and MJ speed > 40 39 14.1 13.38 0 49 12 > 11000 and MJ speed ≤ 40 29 23.5 18.91 0 73 13 > 11000 and MJ speed > 40 65 13.9 13.66 0 69 14 4 x 3 - 28 17.9 15.31 0 43 15∗ 5 x 2 - 6 15.5 19.16 0 44 16 4 x 4 ≤ 5000 15 11.8 10.35 0 39 17 > 5000 and ≤ 7000 34 16.1 17.04 0 90 18 > 7000 and ≤ 9000 35 17.5 15.55 0 63 19 > 9000 and ≤ 11000 33 30.8 17.56 0 72 20 > 11000 31 30.9 22.87 0 79 21∗ 5 x 4 - 8 31.5 23.07 0 72 22 6 x 2 ≤ 7000 41 14.5 13.94 0 53 23 > 7000 and ≤ 9000 37 15.6 9.80 0 37 24 > 9000 and ≤ 11000 33 18.5 12.27 0 54 25 > 11000 22 20.3 12.80 3 55 26∗ 6 x 3 - 17 32.8 23.28 3 81 27∗ 8 x 2 - 9 11.8 14.45 0 35 28 6 x 4 ≤ 9000 40 29.2 19.94 0 63 29 > 9000 29 40.2 24.79 0 91 30∗ 8 x 4 - 7 37.4 25.57 9 86 31∗ 6 x 6 - 12 45.3 24.57 0 85 32 2 x T2 ≤ 8000 24 2.5 2.67 0 10 33 > 8000 19 3.0 3.65 0 15 34 4 x T2 ≤ 7000 42 4.1 4.38 0 18 35 > 7000 61 7.3 7.04 0 29 36 4 x T4 - 26 11.8 15.06 0 62 37 6 x T2 - 40 11.2 11.48 0 53 38∗ 6 x T4 - 9 11.1 11.63 0 39 39 Major 1 Way ≤ 7000 45 8.7 7.34 0 29 40 > 7000 40 19.3 22.23 0 106 41 Minor 1 Way - 36 15.3 14.79 0 65 42∗ Both 1 Way - 13 10.9 14.25 0 54 43∗ One Way & T - 12 12.1 7.84 3 29 44 Ramps ≤ 7000 20 5.1 6.77 0 22 45 > 7000 28 6.6 9.20 0 35 Total Intersections - 1531 - - - -
∗ These intersection types have no sufficient samples. If the number of intersections for a certain type is less than 20, the mean of crashes in the table is just an indication of average crashes for this type based on the current limited cases.

- 117 -
9.3 Tables for the 45 categories
Tables were developed for the expected crash frequencies for the 45 category
intersections. These 45 tables are shown in the following pages.
It is worth mentioning that some of the intersection types had relatively small sample
sizes due to data availability (a total of 9 out of the 45 types, and are indicated below
Table 9-7). Therefore, we advise caution in accepting the significance of the results.
Some of the intersection types (e.g., type 21) are rare, e.g., 5x4. In section 9.2, we have
investigated whether we should combine them with the 4x4 or treat them separately. In
case these types (e.g., 5x4) vary significantly from the main type (i.e., 4x4), we opted to
separate them, however their sample size was relatively small. Using them separately to
generate the crash profiles is better than including them as outliers with the other main
types.

118
110 1.80 2.08 4.00 5.00 6.00Collision Type Rear End 33 0.54 0.87 1.00 2.00 2.00
Head On 3 0.05 0.18 0.00 0.00 0.50Angle 34 0.56 0.76 1.00 1.50 2.00Left Turn 25 0.40 0.79 1.00 1.50 2.00Right Turn 2 0.03 0.12 0.00 0.00 0.50Sideswipe 3 0.05 0.18 0.00 0.00 0.50Pedestrian/Bicycle 3 0.04 0.14 0.00 0.00 0.50Other 8 0.13 0.34 0.50 0.50 0.50
Severity PDO Crashes 62 1.01 1.43 3.00 3.50 4.00Possible Injury 20 0.33 0.50 1.00 1.00 1.50Non-Incapacitating Injury 24 0.39 0.48 1.00 1.00 1.00Incapacitating Injury 5 0.07 0.20 0.00 0.50 0.50Fatal Crashes 1 0.01 0.06 0.00 0.00 0.00
Light Conditions Daylight 74 1.21 1.50 3.00 3.50 4.50Dusk 3 0.04 0.14 0.00 0.00 0.50Dawn 2 0.03 0.12 0.00 0.00 0.50Dark (w/street lights) 23 0.37 0.64 1.00 1.50 1.50Dark (wo/street lights) 9 0.15 0.32 0.50 0.50 1.00
Surface Condition Dry 95 1.56 1.83 3.50 4.00 6.00Wet 14 0.22 0.37 0.50 1.00 1.00Slippery 2 0.02 0.11 0.00 0.00 0.00Others 0 0.00 0.00 0.00 0.00 0.00
Month of year January 12 0.19 0.36 0.50 0.50 0.50February 9 0.14 0.28 0.50 0.50 0.50March 8 0.13 0.30 0.50 0.50 0.50April 9 0.14 0.32 0.50 0.50 0.50May 12 0.19 0.36 0.50 0.50 1.00June 9 0.14 0.28 0.50 0.50 0.50July 6 0.09 0.21 0.50 0.50 0.50August 17 0.27 0.47 1.00 1.00 1.50September 10 0.16 0.32 0.50 0.50 1.00October 9 0.15 0.32 0.50 0.50 0.50November 6 0.09 0.23 0.00 0.50 0.50December 8 0.12 0.30 0.50 0.50 0.50
Day of week Monday 16 0.26 0.50 0.50 1.00 1.50Tuesday 16 0.26 0.45 0.50 1.00 1.00Wednesday 16 0.25 0.39 0.50 1.00 1.00Thursday 18 0.30 0.43 0.50 1.00 1.00Friday 14 0.23 0.41 0.50 1.00 1.00Saturday 12 0.19 0.37 0.50 0.50 1.00Sunday 19 0.31 0.48 0.50 1.00 1.00
Hour of day 00:00 - 06:00 9 0.14 0.38 0.50 0.50 0.5006:01 - 09:00 11 0.18 0.33 0.50 0.50 1.0009:01 - 11:00 9 0.14 0.34 0.50 0.50 0.5011:01 - 13:00 9 0.14 0.34 0.50 0.50 0.5013:01 - 15:00 18 0.30 0.50 0.50 1.00 1.5015:01 - 18:00 25 0.40 0.62 1.00 1.50 1.5018:01 - 24:00 31 0.51 0.72 1.00 1.50 2.00
Note: 1. Crashes extracted from years 2000 and 2001 for Brevard, City of Orlando, Hillsborough, Miami-Dade, and Seminole, and years 1999 and 2000 for Orange County. 2. Crashes represent only long forms. 3. Standard Deviation, 85th, 90th, and 95th Percentiles represent crash statistics per year per intersection.
CATEGORY 1EXPECTED ANNUAL CRASH VALUE TABLE - 6 COUNTIES
2 Lane x 2 Lane Intersection, Signalized, AADT/lane for Major Road ≤ 5,000 Total Number of Intersections Included - 61
Total number of crashes per year
Mean crashes per intersection
per year
Standard Deviation 85th Percentile 90th Percentile 95th Percentile
Entire Category

119
263 3.33 3.30 6.50 7.70 9.55Collision Type Rear End 94 1.18 1.47 2.50 3.10 4.00
Head On 6 0.08 0.21 0.00 0.50 0.50Angle 58 0.73 0.95 1.50 2.10 3.00Left Turn 54 0.68 0.88 1.50 2.00 2.50Right Turn 6 0.08 0.18 0.15 0.50 0.50Sideswipe 16 0.20 0.56 0.50 0.50 1.00Pedestrian/Bicycle 6 0.07 0.17 0.00 0.50 0.50Other 24 0.30 0.69 0.50 0.60 1.50
Severity PDO Crashes 155 1.96 2.50 4.00 5.00 7.05Possible Injury 55 0.69 0.72 1.50 2.00 2.00Non-Incapacitating Injury 41 0.52 0.70 1.50 1.50 2.00Incapacitating Injury 12 0.15 0.28 0.50 0.50 0.55Fatal Crashes 1 0.01 0.08 0.00 0.00 0.00
Light Conditions Daylight 176 2.22 2.18 4.65 5.50 6.50Dusk 5 0.06 0.19 0.00 0.50 0.50Dawn 4 0.05 0.15 0.00 0.10 0.50Dark (w/street lights) 59 0.75 1.32 1.50 2.00 3.10Dark (wo/street lights) 20 0.25 0.47 0.50 1.00 1.05
Surface Condition Dry 229 2.89 2.85 5.50 6.60 7.20Wet 32 0.41 0.59 1.00 1.10 1.50Slippery 2 0.03 0.11 0.00 0.00 0.05Others 1 0.01 0.06 0.00 0.00 0.00
Month of year January 21 0.26 0.48 0.50 0.50 1.00February 20 0.25 0.47 0.50 0.50 1.05March 26 0.32 0.48 0.65 1.00 1.50April 21 0.27 0.48 0.50 0.50 1.50May 22 0.28 0.47 0.50 1.00 1.00June 21 0.26 0.50 0.50 0.50 1.00July 21 0.27 0.49 0.65 1.00 1.50August 32 0.40 0.57 1.00 1.00 1.50September 20 0.25 0.34 0.50 0.50 1.00October 19 0.23 0.37 0.50 0.50 1.00November 19 0.24 0.43 0.50 0.60 1.05December 25 0.31 0.49 1.00 1.00 1.05
Day of week Monday 34 0.43 0.56 1.00 1.00 1.50Tuesday 41 0.51 0.63 1.50 1.50 1.50Wednesday 38 0.47 0.55 1.00 1.50 1.50Thursday 38 0.48 0.70 1.15 1.50 2.00Friday 33 0.42 0.56 1.00 1.10 1.50Saturday 35 0.44 0.73 1.00 1.00 2.05Sunday 46 0.58 0.84 1.50 1.60 2.05
Hour of day 00:00 - 06:00 24 0.30 0.69 0.50 0.50 1.0506:01 - 09:00 33 0.42 0.61 1.00 1.00 1.0509:01 - 11:00 21 0.27 0.36 0.50 0.60 1.0011:01 - 13:00 28 0.35 0.57 1.00 1.00 1.5013:01 - 15:00 29 0.37 0.50 0.65 1.00 1.5015:01 - 18:00 56 0.71 0.78 1.50 1.50 2.0018:01 - 24:00 72 0.91 1.16 2.15 2.50 3.05
Note: 1. Crashes extracted from years 2000 and 2001 for Brevard, City of Orlando, Hillsborough, Miami-Dade, and Seminole, and years 1999 and 2000 for Orange County. 2. Crashes represent only long forms. 3. Standard Deviation, 85th, 90th, and 95th Percentiles represent crash statistics per year per intersection.
Standard Deviation 85th Percentile 90th Percentile 95th Percentile
CATEGORY 2EXPECTED ANNUAL CRASH VALUE TABLE - 6 COUNTIES
2 Lane x 2 Lane Intersection, Signalized, AADT/lane for Major Road > 5,000 and ≤ 9,000 Total Number of Intersections Included - 79
Entire Category
Total number of crashes per year
Mean crashes per intersection
per year

120
160 4.71 6.01 10.10 12.70 13.35Collision Type Rear End 64 1.87 3.23 3.50 3.50 4.00
Head On 4 0.10 0.24 0.50 0.50 0.50Angle 23 0.68 1.02 1.50 1.50 2.68Left Turn 37 1.07 1.61 2.03 2.85 4.70Right Turn 7 0.19 0.35 0.50 0.50 0.67Sideswipe 10 0.29 0.64 0.50 0.85 1.35Pedestrian/Bicycle 2 0.06 0.20 0.00 0.00 0.50Other 15 0.44 0.82 1.00 1.00 1.18
Severity PDO Crashes 102 2.99 4.32 5.53 8.80 11.68Possible Injury 36 1.06 1.34 2.00 2.35 3.85Non-Incapacitating Injury 17 0.50 0.75 1.00 1.35 2.18Incapacitating Injury 5 0.15 0.40 0.50 0.50 0.67Fatal Crashes 1 0.01 0.09 0.00 0.00 0.00
Light Conditions Daylight 104 3.04 3.98 6.53 7.00 8.70Dusk 7 0.19 0.37 0.50 0.50 1.00Dawn 2 0.06 0.20 0.00 0.00 0.50Dark (wo/street lights) 5 0.15 0.34 0.50 0.85 1.00
Surface Condition Dry 136 4.00 4.97 8.53 10.75 12.50Wet 22 0.65 1.14 1.00 1.35 2.52Slippery 1 0.03 0.12 0.00 0.00 0.17
Month of year January 15 0.43 0.58 1.00 1.00 1.68February 9 0.26 0.39 1.00 1.00 1.00March 15 0.43 0.83 0.53 1.00 1.85April 16 0.46 0.64 1.00 1.00 1.35May 10 0.28 0.46 0.53 1.00 1.00June 15 0.44 0.57 1.00 1.00 1.50July 13 0.38 0.70 1.00 1.35 1.68August 13 0.38 0.77 0.53 1.00 1.50September 14 0.40 0.62 1.00 1.00 1.18October 12 0.34 0.68 0.50 0.50 2.00November 15 0.43 0.79 1.50 1.50 2.50December 17 0.49 0.66 1.00 1.00 2.00
Day of week Monday 19 0.54 0.80 1.50 1.50 2.00Tuesday 22 0.65 0.82 1.50 1.50 2.18Wednesday 23 0.68 1.00 1.50 1.50 2.18Thursday 19 0.54 0.96 1.00 1.35 2.68Friday 33 0.96 1.36 2.03 2.50 3.35Saturday 29 0.85 1.23 2.03 2.50 3.52Sunday 17 0.49 0.85 1.03 1.85 2.50
Hour of day 00:00 - 06:00 18 0.51 0.78 1.50 1.50 1.6806:01 - 09:00 14 0.41 0.65 1.00 1.35 1.6809:01 - 11:00 9 0.25 0.59 0.50 0.50 1.1811:01 - 13:00 17 0.50 0.77 1.03 1.50 2.1813:01 - 15:00 17 0.50 0.81 1.00 1.35 2.3515:01 - 18:00 43 1.26 1.62 3.00 3.00 3.6818:01 - 24:00 43 1.26 1.81 2.50 3.20 4.35
Note: 1. Crashes extracted from years 2000 and 2001 for Brevard, City of Orlando, Hillsborough, Miami-Dade, and Seminole, and years 1999 and 2000 for Orange County. 2. Crashes represent only long forms. 3. Standard Deviation, 85th, 90th, and 95th Percentiles represent crash statistics per year per intersection.
CATEGORY 3EXPECTED ANNUAL CRASH VALUE TABLE - 6 COUNTIES
2 Lane x 2 Lane Intersection, Signalized, AADT/lane for Major Road > 9,000Total Number of Intersections Included - 34
85th Percentile 90th Percentile 95th Percentile
Entire Category
Total number of crashes per year
Mean crashes per intersection
per year
Standard Deviation

121
146 3.73 4.01 5.50 7.60 9.15Collision Type Rear End 36 0.91 1.01 2.00 2.50 2.50
Head On 4 0.10 0.31 0.00 0.50 0.55Angle 49 1.24 1.85 2.00 2.60 4.15Left Turn 27 0.69 0.88 1.00 1.60 2.50Right Turn 3 0.08 0.27 0.00 0.10 0.50Sideswipe 14 0.36 0.72 0.50 1.10 1.55Pedestrian/Bicycle 3 0.06 0.20 0.00 0.10 0.50Other 11 0.28 0.58 0.50 1.00 1.55
Severity PDO Crashes 83 2.13 3.00 4.00 5.10 6.45Possible Injury 34 0.86 1.05 1.20 2.50 3.05Non-Incapacitating Injury 22 0.56 0.59 1.00 1.50 1.55Incapacitating Injury 7 0.18 0.31 0.50 0.50 1.00Fatal Crashes 0 0.00 0.00 0.00 0.00 0.00
Light Conditions Daylight 95 2.42 2.57 5.00 5.00 7.20Dusk 9 0.22 0.28 0.50 0.50 0.50Dawn 2 0.04 0.13 0.00 0.00 0.50Dark (w/street lights) 37 0.95 1.61 1.50 2.20 4.10Dark (wo/street lights) 4 0.10 0.20 0.20 0.50 0.50
Surface Condition Dry 126 3.22 3.47 5.65 6.50 7.95Wet 17 0.44 0.55 1.00 1.00 1.55Slippery 1 0.03 0.11 0.00 0.00 0.05Others 2 0.05 0.19 0.00 0.00 0.50
Month of year January 16 0.40 0.62 1.00 1.10 1.55February 13 0.32 0.35 0.50 1.00 1.00March 15 0.37 0.65 0.50 1.00 1.55April 9 0.23 0.36 0.50 1.00 1.00May 13 0.32 0.67 0.50 0.70 1.50June 14 0.35 0.50 1.00 1.00 1.05July 8 0.21 0.38 0.50 0.60 1.00August 10 0.24 0.41 0.50 1.00 1.00September 12 0.31 0.42 0.50 1.00 1.00October 15 0.37 0.53 1.00 1.00 1.05November 12 0.29 0.45 0.50 1.00 1.05December 13 0.32 0.45 0.50 1.00 1.05
Day of week Monday 24 0.62 0.74 1.50 1.60 2.05Tuesday 19 0.49 0.81 0.50 1.50 2.50Wednesday 20 0.50 0.60 1.00 1.50 1.55Thursday 15 0.38 0.53 1.00 1.00 1.50Friday 21 0.53 0.63 1.00 1.50 1.55Saturday 21 0.53 0.94 0.70 1.50 2.00Sunday 27 0.69 1.07 1.50 1.50 2.65
Hour of day 00:00 - 06:00 14 0.36 0.95 0.50 1.00 3.5006:01 - 09:00 15 0.38 0.45 0.50 1.00 1.5009:01 - 11:00 8 0.21 0.38 0.50 0.60 1.0011:01 - 13:00 16 0.40 0.50 1.00 1.00 1.5013:01 - 15:00 19 0.49 0.66 1.20 1.50 1.5515:01 - 18:00 31 0.78 0.89 1.50 2.00 2.0518:01 - 24:00 44 1.12 1.53 1.50 2.50 3.05
Note: 1. Crashes extracted from years 2000 and 2001 for Brevard, City of Orlando, Hillsborough, Miami-Dade, and Seminole, and years 1999 and 2000 for Orange County. 2. Crashes represent only long forms. 3. Standard Deviation, 85th, 90th, and 95th Percentiles represent crash statistics per year per intersection.
85th Percentile 90th Percentile 95th Percentile
Entire Category
CATEGORY 4EXPECTED ANNUAL CRASH VALUE TABLE - 6 COUNTIES
4 Lane x 2 Lane Intersection, Signalized, AADT/lane for Major Road ≤ 5,000 and Major Road Speed Limit ≤ 40 mph
Total Number of Intersections Included - 39
Total number of crashes per year
Mean crashes per intersection
per year
Standard Deviation

122
113 3.52 3.62 6.35 10.60 11.00Collision Type Rear End 37 1.14 1.35 2.50 3.40 3.73
Head On 4 0.13 0.31 0.50 0.50 0.50Angle 26 0.80 1.03 1.85 2.50 3.00Left Turn 29 0.89 1.00 1.68 2.45 3.00Right Turn 2 0.06 0.21 0.00 0.00 0.50Sideswipe 5 0.16 0.41 0.17 0.50 1.23Pedestrian/Bicycle 1 0.02 0.09 0.00 0.00 0.00Other 11 0.33 0.60 0.67 1.00 1.00
Severity PDO Crashes 68 2.11 2.97 5.00 6.35 8.95Possible Injury 23 0.72 0.67 1.50 1.50 1.73Non-Incapacitating Injury 17 0.52 0.59 1.00 1.00 1.50Incapacitating Injury 6 0.17 0.41 0.50 0.50 0.73Fatal Crashes 0 0.00 0.00 0.00 0.00 0.00
Light Conditions Daylight 78 2.44 2.56 4.68 6.35 8.00Dusk 3 0.09 0.24 0.17 0.50 0.50Dawn 2 0.05 0.15 0.00 0.00 0.50Dark (w/street lights) 20 0.63 0.92 1.18 1.50 2.00Dark (wo/street lights) 10 0.31 0.56 0.50 0.95 1.73
Surface Condition Dry 98 3.06 3.14 6.35 8.80 9.50Wet 14 0.42 0.76 0.67 1.45 1.73Slippery 1 0.02 0.09 0.00 0.00 0.00Others 1 0.02 0.09 0.00 0.00 0.00
Month of year January 11 0.34 0.69 1.00 1.00 1.00February 9 0.27 0.57 0.50 0.50 1.18March 11 0.33 0.43 1.00 1.00 1.00April 9 0.28 0.49 0.50 0.95 1.23May 8 0.25 0.40 0.50 0.95 1.00June 10 0.31 0.52 1.00 1.00 1.23July 10 0.31 0.56 1.00 1.00 1.00August 8 0.25 0.44 0.50 0.50 1.00September 9 0.27 0.40 0.50 0.95 1.00October 9 0.28 0.40 0.50 0.95 1.00November 10 0.31 0.42 0.67 1.00 1.00December 10 0.31 0.45 0.50 0.95 1.00
Day of week Monday 19 0.59 0.63 1.00 1.00 2.00Tuesday 14 0.42 0.58 1.00 1.00 1.50Wednesday 13 0.39 0.50 1.00 1.00 1.50Thursday 17 0.53 0.68 1.00 1.45 1.50Friday 20 0.63 0.86 1.50 1.95 2.50Saturday 14 0.42 0.62 1.00 1.45 1.73Sunday 17 0.53 0.87 1.00 1.45 2.18
Hour of day 00:00 - 06:00 12 0.36 0.61 1.00 1.45 1.7306:01 - 09:00 15 0.45 0.66 1.50 1.50 1.7309:01 - 11:00 8 0.23 0.40 0.50 0.95 1.0011:01 - 13:00 10 0.30 0.51 0.50 0.50 1.1813:01 - 15:00 10 0.31 0.49 0.67 1.00 1.5015:01 - 18:00 29 0.91 0.94 2.00 2.00 3.0018:01 - 24:00 31 0.95 1.09 1.68 2.45 3.23
Note: 1. Crashes extracted from years 2000 and 2001 for Brevard, City of Orlando, Hillsborough, Miami-Dade, and Seminole, and years 1999 and 2000 for Orange County. 2. Crashes represent only long forms. 3. Standard Deviation, 85th, 90th, and 95th Percentiles represent crash statistics per year per intersection.
85th Percentile 90th Percentile 95th Percentile
Entire Category
CATEGORY 5EXPECTED ANNUAL CRASH VALUE TABLE - 6 COUNTIES
4 Lane x 2 Lane Intersection, Signalized, AADT/lane for Major Road ≤ 5,000 and Major Road Speed Limit > 40 mph
Total Number of Intersections Included - 32
Total number of crashes per year
Mean crashes per intersection
per year
Standard Deviation
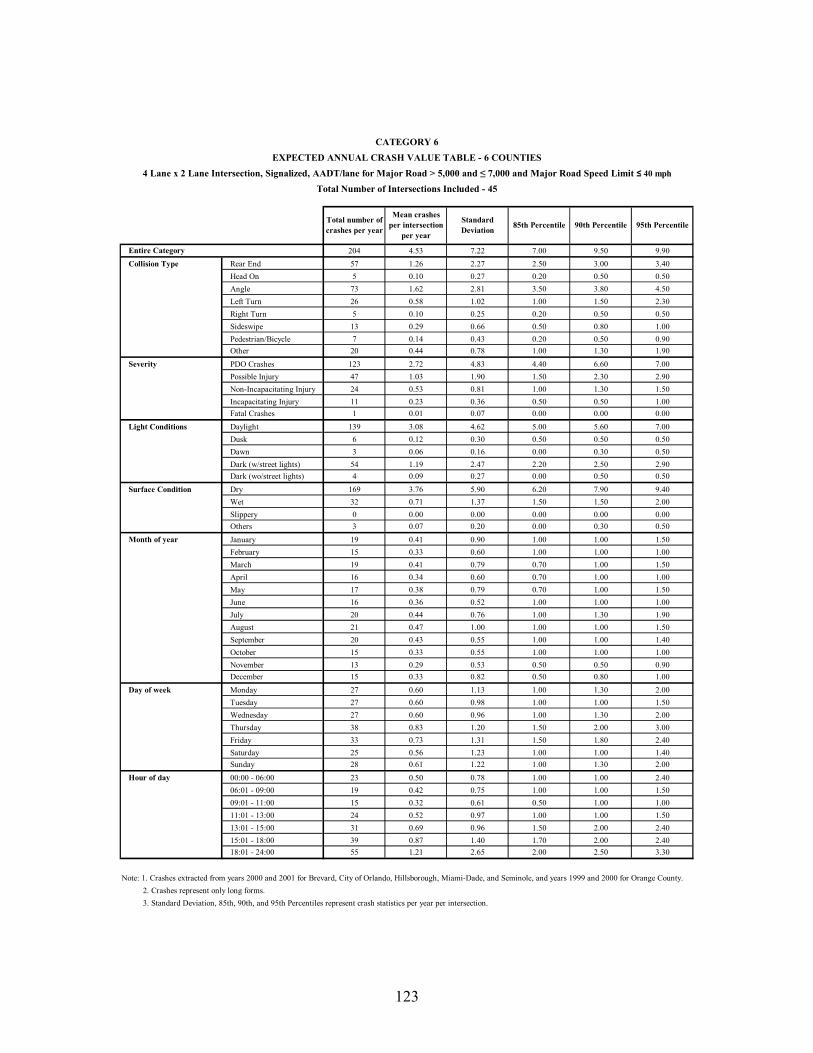
123
204 4.53 7.22 7.00 9.50 9.90Collision Type Rear End 57 1.26 2.27 2.50 3.00 3.40
Head On 5 0.10 0.27 0.20 0.50 0.50Angle 73 1.62 2.81 3.50 3.80 4.50Left Turn 26 0.58 1.02 1.00 1.50 2.30Right Turn 5 0.10 0.25 0.20 0.50 0.50Sideswipe 13 0.29 0.66 0.50 0.80 1.00Pedestrian/Bicycle 7 0.14 0.43 0.20 0.50 0.90Other 20 0.44 0.78 1.00 1.30 1.90
Severity PDO Crashes 123 2.72 4.83 4.40 6.60 7.00Possible Injury 47 1.03 1.90 1.50 2.30 2.90Non-Incapacitating Injury 24 0.53 0.81 1.00 1.30 1.50Incapacitating Injury 11 0.23 0.36 0.50 0.50 1.00Fatal Crashes 1 0.01 0.07 0.00 0.00 0.00
Light Conditions Daylight 139 3.08 4.62 5.00 5.60 7.00Dusk 6 0.12 0.30 0.50 0.50 0.50Dawn 3 0.06 0.16 0.00 0.30 0.50Dark (w/street lights) 54 1.19 2.47 2.20 2.50 2.90Dark (wo/street lights) 4 0.09 0.27 0.00 0.50 0.50
Surface Condition Dry 169 3.76 5.90 6.20 7.90 9.40Wet 32 0.71 1.37 1.50 1.50 2.00Slippery 0 0.00 0.00 0.00 0.00 0.00Others 3 0.07 0.20 0.00 0.30 0.50
Month of year January 19 0.41 0.90 1.00 1.00 1.50February 15 0.33 0.60 1.00 1.00 1.00March 19 0.41 0.79 0.70 1.00 1.50April 16 0.34 0.60 0.70 1.00 1.00May 17 0.38 0.79 0.70 1.00 1.50June 16 0.36 0.52 1.00 1.00 1.00July 20 0.44 0.76 1.00 1.30 1.90August 21 0.47 1.00 1.00 1.00 1.50September 20 0.43 0.55 1.00 1.00 1.40October 15 0.33 0.55 1.00 1.00 1.00November 13 0.29 0.53 0.50 0.50 0.90December 15 0.33 0.82 0.50 0.80 1.00
Day of week Monday 27 0.60 1.13 1.00 1.30 2.00Tuesday 27 0.60 0.98 1.00 1.00 1.50Wednesday 27 0.60 0.96 1.00 1.30 2.00Thursday 38 0.83 1.20 1.50 2.00 3.00Friday 33 0.73 1.31 1.50 1.80 2.40Saturday 25 0.56 1.23 1.00 1.00 1.40Sunday 28 0.61 1.22 1.00 1.30 2.00
Hour of day 00:00 - 06:00 23 0.50 0.78 1.00 1.00 2.4006:01 - 09:00 19 0.42 0.75 1.00 1.00 1.5009:01 - 11:00 15 0.32 0.61 0.50 1.00 1.0011:01 - 13:00 24 0.52 0.97 1.00 1.00 1.5013:01 - 15:00 31 0.69 0.96 1.50 2.00 2.4015:01 - 18:00 39 0.87 1.40 1.70 2.00 2.4018:01 - 24:00 55 1.21 2.65 2.00 2.50 3.30
Note: 1. Crashes extracted from years 2000 and 2001 for Brevard, City of Orlando, Hillsborough, Miami-Dade, and Seminole, and years 1999 and 2000 for Orange County. 2. Crashes represent only long forms. 3. Standard Deviation, 85th, 90th, and 95th Percentiles represent crash statistics per year per intersection.
85th Percentile 90th Percentile 95th Percentile
Entire Category
CATEGORY 6EXPECTED ANNUAL CRASH VALUE TABLE - 6 COUNTIES
4 Lane x 2 Lane Intersection, Signalized, AADT/lane for Major Road > 5,000 and ≤ 7,000 and Major Road Speed Limit ≤ 40 mph
Total Number of Intersections Included - 45
Total number of crashes per year
Mean crashes per intersection
per year
Standard Deviation

124
206 3.49 3.90 6.30 9.00 10.55Collision Type Rear End 81 1.37 1.54 2.65 3.60 5.05
Head On 3 0.04 0.14 0.00 0.00 0.50Angle 51 0.86 1.06 1.50 2.00 2.65Left Turn 45 0.75 1.41 1.50 2.00 3.05Right Turn 3 0.04 0.17 0.00 0.00 0.50Sideswipe 7 0.11 0.21 0.50 0.50 0.50Pedestrian/Bicycle 4 0.07 0.17 0.00 0.50 0.50Other 14 0.24 0.39 0.50 0.50 1.00
Severity PDO Crashes 94 1.59 2.63 2.15 3.80 7.70Possible Injury 56 0.94 1.00 2.00 2.60 3.00Non-Incapacitating Injury 44 0.75 0.91 1.50 1.60 2.05Incapacitating Injury 12 0.19 0.45 0.50 0.50 1.00Fatal Crashes 1 0.02 0.09 0.00 0.00 0.00
Light Conditions Daylight 137 2.32 2.72 4.50 5.20 6.55Dusk 7 0.11 0.26 0.50 0.50 0.50Dawn 4 0.06 0.19 0.00 0.10 0.50Dark (w/street lights) 41 0.69 1.08 1.15 2.00 2.50Dark (wo/street lights) 19 0.31 0.62 0.50 1.00 1.05
Surface Condition Dry 165 2.80 2.97 4.65 6.50 9.05Wet 36 0.60 1.07 1.00 2.00 3.00Slippery 2 0.03 0.16 0.00 0.00 0.05Others 4 0.06 0.25 0.00 0.00 0.50
Month of year January 21 0.36 0.57 0.65 1.00 1.50February 13 0.21 0.36 0.50 0.60 1.00March 17 0.29 0.50 1.00 1.00 1.05April 13 0.22 0.53 0.50 0.50 1.05May 17 0.28 0.51 0.50 1.00 1.50June 16 0.26 0.38 0.50 0.50 1.00July 19 0.31 0.52 1.00 1.00 1.50August 20 0.34 0.42 0.65 1.00 1.00September 16 0.26 0.49 0.50 1.00 1.00October 20 0.34 0.47 0.65 1.00 1.50November 21 0.35 0.64 1.00 1.00 1.05December 16 0.27 0.74 0.50 0.50 1.50
Day of week Monday 23 0.38 0.50 0.65 1.00 1.50Tuesday 27 0.45 0.67 1.00 1.10 2.00Wednesday 31 0.52 0.73 1.00 1.50 2.00Thursday 30 0.51 0.71 1.00 1.50 2.00Friday 27 0.46 0.62 1.00 1.10 2.00Saturday 34 0.58 0.81 1.00 1.60 2.50Sunday 36 0.60 0.99 1.00 1.50 3.00
Hour of day 00:00 - 06:00 14 0.23 0.36 0.50 0.60 1.0006:01 - 09:00 28 0.47 0.76 1.00 1.50 2.0509:01 - 11:00 22 0.37 0.59 0.65 1.00 2.0011:01 - 13:00 19 0.31 0.63 0.50 1.00 1.0513:01 - 15:00 20 0.34 0.47 0.50 0.60 1.0515:01 - 18:00 46 0.78 0.89 1.50 2.00 2.5018:01 - 24:00 59 0.99 1.37 1.50 2.50 3.65
Note: 1. Crashes extracted from years 2000 and 2001 for Brevard, City of Orlando, Hillsborough, Miami-Dade, and Seminole, and years 1999 and 2000 for Orange County. 2. Crashes represent only long forms. 3. Standard Deviation, 85th, 90th, and 95th Percentiles represent crash statistics per year per intersection.
85th Percentile 90th Percentile 95th Percentile
Entire Category
CATEGORY 7EXPECTED ANNUAL CRASH VALUE TABLE - 6 COUNTIES
4 Lane x 2 Lane Intersection, Signalized, AADT/lane for Major Road > 5,000 and ≤ 7,000 and Major Road Speed Limit > 40 mph
Total Number of Intersections Included - 59
Total number of crashes per year
Mean crashes per intersection
per year
Standard Deviation

125
584 6.02 6.47 12.40 16.00 20.60Collision Type Rear End 194 2.00 2.48 4.50 5.20 7.50
Head On 7 0.07 0.19 0.00 0.50 0.50Angle 142 1.46 1.78 3.00 3.50 6.00Left Turn 81 0.84 1.12 1.50 2.20 3.00Right Turn 16 0.16 0.44 0.50 0.50 1.00Sideswipe 52 0.53 0.83 1.30 1.70 2.50Pedestrian/Bicycle 23 0.24 0.49 0.50 1.00 1.10Other 70 0.72 1.26 1.50 2.00 3.50
Severity PDO Crashes 403 4.15 5.51 10.80 12.00 15.90Possible Injury 97 0.99 1.19 1.80 2.20 3.60Non-Incapacitating Injury 66 0.68 0.83 1.50 2.00 2.00Incapacitating Injury 19 0.19 0.35 0.50 1.00 1.00Fatal Crashes 0 0.00 0.00 0.00 0.00 0.00
Light Conditions Daylight 423 4.36 4.83 8.80 12.40 15.50Dusk 15 0.15 0.31 0.50 0.50 0.50Dawn 3 0.03 0.12 0.00 0.00 0.50Dark (w/street lights) 137 1.41 1.85 3.00 4.00 5.00Dark (wo/street lights) 7 0.07 0.31 0.00 0.00 0.50
Surface Condition Dry 505 5.21 5.54 10.80 13.70 17.60Wet 74 0.76 1.09 1.80 2.20 2.60Slippery 1 0.01 0.05 0.00 0.00 0.00Others 5 0.05 0.16 0.00 0.00 0.50
Month of year January 38 0.39 0.59 1.00 1.50 1.50February 41 0.42 0.67 1.00 1.50 2.00March 47 0.48 0.74 1.00 1.50 2.00April 52 0.54 0.73 1.50 1.50 2.00May 55 0.56 0.84 1.50 1.50 2.10June 48 0.49 0.70 1.00 1.50 2.00July 55 0.57 0.94 1.50 1.70 2.50August 60 0.61 0.86 1.50 1.70 2.50September 44 0.45 0.73 1.00 1.50 2.00October 44 0.45 0.61 1.00 1.20 1.50November 48 0.49 0.67 1.30 1.50 2.00December 55 0.56 0.80 1.00 1.50 2.00
Day of week Monday 79 0.81 1.15 2.00 2.50 3.10Tuesday 95 0.97 1.03 2.00 2.50 3.00Wednesday 71 0.73 1.12 1.50 2.00 2.60Thursday 78 0.80 0.96 1.80 2.00 3.00Friday 96 0.98 1.27 2.00 2.50 3.50Saturday 92 0.94 1.22 2.30 3.00 3.50Sunday 76 0.78 0.96 1.50 2.00 3.00
Hour of day 00:00 - 06:00 54 0.56 0.98 1.30 2.00 2.6006:01 - 09:00 70 0.72 0.99 1.50 2.50 3.0009:01 - 11:00 45 0.46 0.66 1.00 1.50 1.6011:01 - 13:00 65 0.67 0.87 1.50 2.00 2.6013:01 - 15:00 74 0.76 1.05 1.50 1.70 2.6015:01 - 18:00 144 1.48 1.81 3.00 3.50 5.0018:01 - 24:00 132 1.36 1.71 3.30 4.20 5.00
Note: 1. Crashes extracted from years 2000 and 2001 for Brevard, City of Orlando, Hillsborough, Miami-Dade, and Seminole, and years 1999 and 2000 for Orange County. 2. Crashes represent only long forms. 3. Standard Deviation, 85th, 90th, and 95th Percentiles represent crash statistics per year per intersection.
85th Percentile 90th Percentile 95th Percentile
Entire Category
CATEGORY 8EXPECTED ANNUAL CRASH VALUE TABLE - 6 COUNTIES
4 Lane x 2 Lane Intersection, Signalized, AADT/lane for Major Road > 7,000 and ≤ 9,000 and Major Road Speed Limit ≤ 40 mphTotal Number of Intersections Included - 97
Total number of crashes per year
Mean crashes per intersection
per year
Standard Deviation
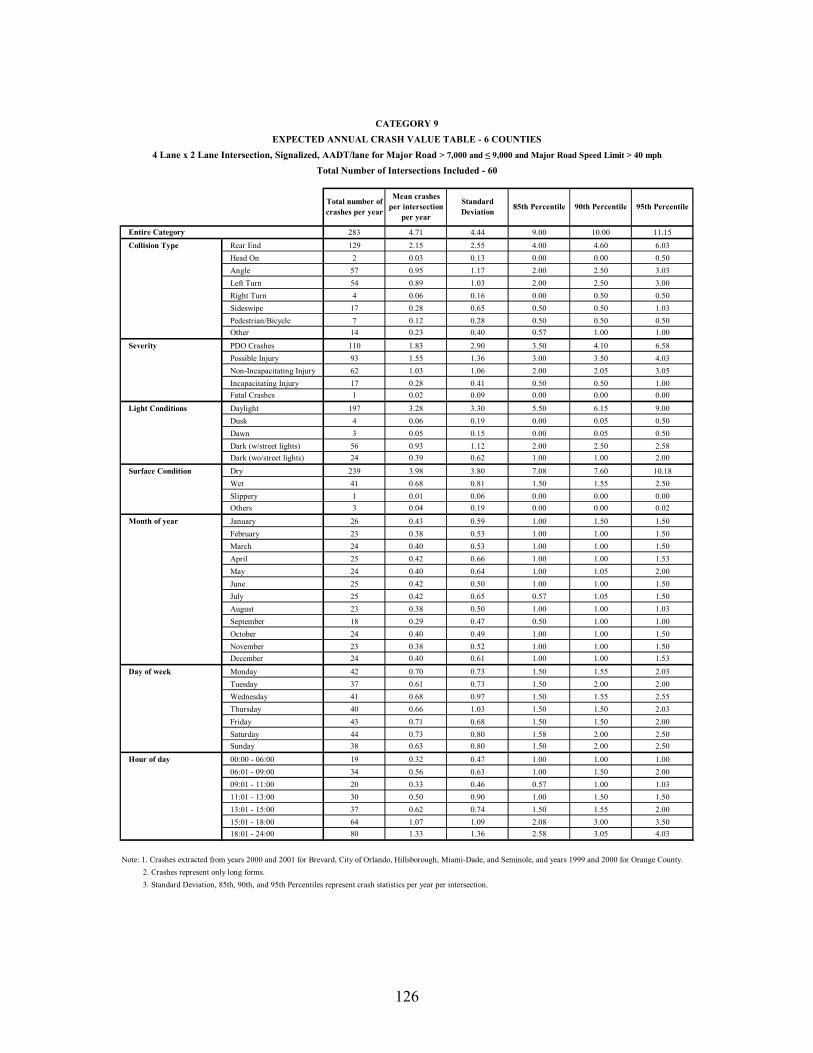
126
283 4.71 4.44 9.00 10.00 11.15Collision Type Rear End 129 2.15 2.55 4.00 4.60 6.03
Head On 2 0.03 0.13 0.00 0.00 0.50Angle 57 0.95 1.17 2.00 2.50 3.03Left Turn 54 0.89 1.03 2.00 2.50 3.00Right Turn 4 0.06 0.16 0.00 0.50 0.50Sideswipe 17 0.28 0.65 0.50 0.50 1.03Pedestrian/Bicycle 7 0.12 0.28 0.50 0.50 0.50Other 14 0.23 0.40 0.57 1.00 1.00
Severity PDO Crashes 110 1.83 2.90 3.50 4.10 6.58Possible Injury 93 1.55 1.36 3.00 3.50 4.03Non-Incapacitating Injury 62 1.03 1.06 2.00 2.05 3.05Incapacitating Injury 17 0.28 0.41 0.50 0.50 1.00Fatal Crashes 1 0.02 0.09 0.00 0.00 0.00
Light Conditions Daylight 197 3.28 3.30 5.50 6.15 9.00Dusk 4 0.06 0.19 0.00 0.05 0.50Dawn 3 0.05 0.15 0.00 0.05 0.50Dark (w/street lights) 56 0.93 1.12 2.00 2.50 2.58Dark (wo/street lights) 24 0.39 0.62 1.00 1.00 2.00
Surface Condition Dry 239 3.98 3.80 7.08 7.60 10.18Wet 41 0.68 0.81 1.50 1.55 2.50Slippery 1 0.01 0.06 0.00 0.00 0.00Others 3 0.04 0.19 0.00 0.00 0.02
Month of year January 26 0.43 0.59 1.00 1.50 1.50February 23 0.38 0.53 1.00 1.00 1.50March 24 0.40 0.53 1.00 1.00 1.50April 25 0.42 0.66 1.00 1.00 1.53May 24 0.40 0.64 1.00 1.05 2.00June 25 0.42 0.50 1.00 1.00 1.50July 25 0.42 0.65 0.57 1.05 1.50August 23 0.38 0.50 1.00 1.00 1.03September 18 0.29 0.47 0.50 1.00 1.00October 24 0.40 0.49 1.00 1.00 1.50November 23 0.38 0.52 1.00 1.00 1.50December 24 0.40 0.61 1.00 1.00 1.53
Day of week Monday 42 0.70 0.73 1.50 1.55 2.03Tuesday 37 0.61 0.73 1.50 2.00 2.00Wednesday 41 0.68 0.97 1.50 1.55 2.55Thursday 40 0.66 1.03 1.50 1.50 2.03Friday 43 0.71 0.68 1.50 1.50 2.00Saturday 44 0.73 0.80 1.58 2.00 2.50Sunday 38 0.63 0.80 1.50 2.00 2.50
Hour of day 00:00 - 06:00 19 0.32 0.47 1.00 1.00 1.0006:01 - 09:00 34 0.56 0.63 1.00 1.50 2.0009:01 - 11:00 20 0.33 0.46 0.57 1.00 1.0311:01 - 13:00 30 0.50 0.90 1.00 1.50 1.5013:01 - 15:00 37 0.62 0.74 1.50 1.55 2.0015:01 - 18:00 64 1.07 1.09 2.08 3.00 3.5018:01 - 24:00 80 1.33 1.36 2.58 3.05 4.03
Note: 1. Crashes extracted from years 2000 and 2001 for Brevard, City of Orlando, Hillsborough, Miami-Dade, and Seminole, and years 1999 and 2000 for Orange County. 2. Crashes represent only long forms. 3. Standard Deviation, 85th, 90th, and 95th Percentiles represent crash statistics per year per intersection.
85th Percentile 90th Percentile 95th Percentile
Entire Category
CATEGORY 9EXPECTED ANNUAL CRASH VALUE TABLE - 6 COUNTIES
4 Lane x 2 Lane Intersection, Signalized, AADT/lane for Major Road > 7,000 and ≤ 9,000 and Major Road Speed Limit > 40 mph
Total Number of Intersections Included - 60
Total number of crashes per year
Mean crashes per intersection
per year
Standard Deviation

127
307 7.68 6.95 14.38 17.10 18.63Collision Type Rear End 104 2.60 2.89 5.00 6.05 7.00
Head On 7 0.18 0.33 0.50 0.50 0.52Angle 80 2.00 1.98 4.50 5.05 5.58Left Turn 57 1.43 1.66 3.58 4.00 4.50Right Turn 8 0.19 0.33 0.50 0.50 0.52Sideswipe 20 0.49 0.59 1.00 1.05 1.50Pedestrian/Bicycle 6 0.14 0.30 0.50 0.50 1.00Other 27 0.66 0.76 1.50 1.55 2.50
Severity PDO Crashes 200 4.99 5.50 10.50 11.35 14.55Possible Injury 61 1.51 1.35 2.58 3.55 4.03Non-Incapacitating Injury 36 0.90 0.94 1.58 2.50 3.00Incapacitating Injury 11 0.28 0.61 0.50 0.50 1.53Fatal Crashes 0 0.00 0.00 0.00 0.00 0.00
Light Conditions Daylight 194 4.85 4.39 9.50 12.10 13.08Dusk 10 0.24 0.39 0.50 0.50 1.03Dawn 5 0.13 0.27 0.50 0.50 0.52Dark (w/street lights) 85 2.13 2.78 3.58 4.05 5.65Dark (wo/street lights) 14 0.34 0.60 0.57 1.00 1.50
Surface Condition Dry 255 6.38 5.45 10.88 15.50 16.58Wet 45 1.11 1.76 1.58 2.50 3.03Slippery 1 0.01 0.08 0.00 0.00 0.00Others 7 0.18 0.35 0.50 1.00 1.00
Month of year January 22 0.55 0.70 1.00 1.55 2.03February 24 0.60 0.63 1.50 1.50 1.53March 22 0.55 0.58 1.00 1.05 1.53April 25 0.61 0.83 1.08 1.50 2.50May 25 0.63 0.85 1.08 1.55 2.53June 23 0.56 0.57 1.08 1.50 1.50July 32 0.79 0.85 1.50 2.00 2.50August 25 0.61 0.91 1.08 1.55 2.03September 25 0.61 0.69 1.08 1.50 2.00October 34 0.84 1.11 2.08 2.55 3.03November 28 0.70 0.89 1.08 2.00 3.00December 25 0.63 0.69 1.08 1.50 2.03
Day of week Monday 47 1.18 1.36 2.50 3.00 3.10Tuesday 40 0.99 0.98 1.58 2.00 2.58Wednesday 42 1.04 1.04 2.50 2.50 3.00Thursday 54 1.35 1.22 2.50 3.00 3.53Friday 45 1.11 1.09 2.08 2.50 3.03Saturday 48 1.20 1.56 2.00 2.55 3.00Sunday 33 0.81 0.99 1.50 1.60 3.00
Hour of day 00:00 - 06:00 36 0.90 0.98 2.00 2.00 2.5506:01 - 09:00 24 0.59 0.62 1.50 1.50 1.5309:01 - 11:00 24 0.59 0.76 1.08 2.00 2.5011:01 - 13:00 28 0.69 0.66 1.50 1.55 2.0013:01 - 15:00 39 0.98 1.07 1.50 2.05 2.5515:01 - 18:00 56 1.40 1.32 2.58 3.55 4.0318:01 - 24:00 102 2.54 2.95 5.50 6.05 6.50
Note: 1. Crashes extracted from years 2000 and 2001 for Brevard, City of Orlando, Hillsborough, Miami-Dade, and Seminole, and years 1999 and 2000 for Orange County. 2. Crashes represent only long forms. 3. Standard Deviation, 85th, 90th, and 95th Percentiles represent crash statistics per year per intersection.
85th Percentile 90th Percentile 95th Percentile
Entire Category
CATEGORY 10EXPECTED ANNUAL CRASH VALUE TABLE - 6 COUNTIES
4 Lane x 2 Lane Intersection, Signalized, AADT/lane for Major Road > 9,000 and ≤ 11,000 and Major Road Speed Limit ≤ 40 mphTotal Number of Intersections Included - 40
Total number of crashes per year
Mean crashes per intersection
per year
Standard Deviation

128
276 7.06 6.69 13.50 15.50 19.95Collision Type Rear End 127 3.26 3.25 6.00 7.60 9.70
Head On 4 0.09 0.23 0.15 0.50 0.50Angle 59 1.50 1.77 2.80 3.60 5.10Left Turn 49 1.24 1.49 2.65 3.20 4.00Right Turn 4 0.09 0.23 0.15 0.50 0.50Sideswipe 16 0.41 0.66 1.15 1.50 1.55Pedestrian/Bicycle 5 0.12 0.27 0.50 0.50 0.55Other 14 0.36 0.46 1.00 1.00 1.00
Severity PDO Crashes 129 3.29 3.43 7.50 7.60 9.10Possible Injury 78 1.99 2.35 3.15 4.10 5.50Non-Incapacitating Injury 60 1.53 2.13 3.15 5.10 6.50Incapacitating Injury 10 0.24 0.38 0.50 0.60 1.00Fatal Crashes 1 0.01 0.08 0.00 0.00 0.00
Light Conditions Daylight 180 4.60 4.45 7.95 10.10 12.05Dusk 7 0.18 0.31 0.50 0.50 1.00Dawn 3 0.08 0.22 0.00 0.50 0.50Dark (w/street lights) 61 1.56 1.87 2.80 4.10 6.00Dark (wo/street lights) 25 0.64 1.29 1.00 1.80 3.65
Surface Condition Dry 242 6.19 5.90 11.65 13.60 18.70Wet 31 0.78 0.95 2.15 2.50 2.55Slippery 2 0.05 0.19 0.00 0.00 0.50Others 2 0.04 0.13 0.00 0.00 0.50
Month of year January 23 0.58 0.63 1.00 1.60 2.00February 29 0.73 0.88 2.00 2.00 2.05March 23 0.58 0.79 1.65 2.00 2.00April 24 0.60 0.70 1.00 1.60 2.00May 19 0.49 0.59 1.00 1.10 1.50June 21 0.54 0.73 1.15 1.50 2.00July 22 0.56 0.84 1.15 1.50 1.50August 23 0.59 0.87 1.50 1.50 2.55September 25 0.63 0.70 1.50 1.50 2.00October 25 0.64 0.71 1.50 1.50 2.00November 21 0.54 0.76 1.00 1.10 2.05December 23 0.59 1.02 1.50 1.50 2.00
Day of week Monday 41 1.05 1.06 2.50 2.60 3.00Tuesday 35 0.90 1.06 1.50 2.00 3.55Wednesday 33 0.83 1.05 1.65 2.00 3.00Thursday 45 1.14 1.15 2.00 2.60 3.50Friday 46 1.17 1.30 2.00 3.20 4.00Saturday 40 1.03 1.20 2.50 2.60 3.05Sunday 37 0.95 1.30 2.15 2.60 4.05
Hour of day 00:00 - 06:00 26 0.67 1.13 1.15 1.70 3.0006:01 - 09:00 24 0.62 0.68 1.50 1.50 1.5509:01 - 11:00 20 0.50 0.71 1.15 1.50 1.5511:01 - 13:00 23 0.58 0.79 1.15 2.00 2.0513:01 - 15:00 35 0.88 0.98 2.00 2.10 3.0015:01 - 18:00 61 1.56 1.72 3.00 3.70 5.0518:01 - 24:00 88 2.26 2.42 5.30 6.50 7.10
Note: 1. Crashes extracted from years 2000 and 2001 for Brevard, City of Orlando, Hillsborough, Miami-Dade, and Seminole, and years 1999 and 2000 for Orange County. 2. Crashes represent only long forms. 3. Standard Deviation, 85th, 90th, and 95th Percentiles represent crash statistics per year per intersection.
85th Percentile 90th Percentile 95th Percentile
Entire Category
CATEGORY 11EXPECTED ANNUAL CRASH VALUE TABLE - 6 COUNTIES
4 Lane x 2 Lane Intersection, Signalized, AADT/lane for Major Road > 9,000 and ≤ 11,000 and Major Road Speed Limit > 40 mphTotal Number of Intersections Included - 39
Total number of crashes per year
Mean crashes per intersection
per year
Standard Deviation

129
341 11.74 9.46 18.70 24.50 32.30Collision Type Rear End 139 4.78 3.94 8.30 10.60 11.30
Head On 5 0.17 0.43 0.50 0.50 0.80Angle 76 2.60 3.09 4.90 6.30 7.80Left Turn 52 1.78 1.74 3.90 4.20 5.00Right Turn 5 0.16 0.42 0.40 0.50 0.80Sideswipe 28 0.95 1.11 2.00 2.10 2.50Pedestrian/Bicycle 9 0.29 0.43 0.90 1.00 1.00Other 30 1.02 1.11 1.90 2.20 3.30
Severity PDO Crashes 253 8.71 7.62 14.80 18.30 25.60Possible Injury 52 1.78 1.53 3.40 3.50 3.80Non-Incapacitating Injury 30 1.03 0.92 1.90 2.60 3.00Incapacitating Injury 5 0.17 0.31 0.50 0.50 0.80Fatal Crashes 2 0.05 0.15 0.00 0.10 0.50
Light Conditions Daylight 229 7.88 6.38 11.80 17.90 21.50Dusk 10 0.34 0.57 1.00 1.00 1.00Dawn 4 0.14 0.23 0.50 0.50 0.50Dark (w/street lights) 96 3.31 3.19 6.00 6.20 8.20Dark (wo/street lights) 2 0.07 0.22 0.00 0.10 0.50
Surface Condition Dry 288 9.93 7.88 14.50 20.50 27.70Wet 46 1.57 1.70 3.30 3.80 5.30Slippery 1 0.02 0.09 0.00 0.00 0.00Others 7 0.22 0.43 0.50 0.60 1.30
Month of year January 29 1.00 0.92 2.00 2.10 2.80February 21 0.71 0.76 1.50 1.60 2.30March 27 0.91 1.04 2.00 2.10 2.80April 30 1.03 1.18 1.90 2.60 3.60May 28 0.95 0.94 2.00 2.10 2.50June 29 0.98 1.33 1.90 2.70 3.50July 31 1.07 1.02 2.00 2.60 3.00August 31 1.05 0.95 2.00 2.20 3.00September 34 1.16 1.24 2.50 3.10 3.50October 35 1.19 1.18 2.50 2.60 3.00November 25 0.86 0.94 1.90 2.10 2.50December 24 0.83 0.85 2.00 2.00 2.30
Day of week Monday 42 1.45 1.35 2.90 3.00 3.90Tuesday 51 1.76 1.41 2.90 4.00 4.00Wednesday 51 1.76 1.68 2.90 5.00 5.30Thursday 51 1.76 1.62 3.00 4.10 5.40Friday 56 1.93 1.73 3.50 4.00 4.90Saturday 41 1.41 1.46 3.00 3.50 4.40Sunday 49 1.67 1.67 3.80 4.00 4.00
Hour of day 00:00 - 06:00 35 1.19 1.45 2.90 3.60 4.0006:01 - 09:00 36 1.22 1.41 2.90 3.10 4.1009:01 - 11:00 28 0.95 0.95 2.00 2.10 2.8011:01 - 13:00 34 1.16 0.94 2.00 2.10 2.5013:01 - 15:00 42 1.45 1.11 2.90 3.00 3.0015:01 - 18:00 69 2.38 2.14 4.00 4.10 6.6018:01 - 24:00 99 3.40 3.14 6.80 8.10 8.80
Note: 1. Crashes extracted from years 2000 and 2001 for Brevard, City of Orlando, Hillsborough, Miami-Dade, and Seminole, and years 1999 and 2000 for Orange County. 2. Crashes represent only long forms. 3. Standard Deviation, 85th, 90th, and 95th Percentiles represent crash statistics per year per intersection.
85th Percentile 90th Percentile 95th Percentile
Entire Category
CATEGORY 12EXPECTED ANNUAL CRASH VALUE TABLE - 6 COUNTIES
4 Lane x 2 Lane Intersection, Signalized, AADT/lane for Major Road > 11,000 and Major Road Speed Limit ≤ 40 mph
Total Number of Intersections Included - 29
Total number of crashes per year
Mean crashes per intersection
per year
Standard Deviation

130
452 6.95 6.82 11.00 14.30 19.90Collision Type Rear End 222 3.42 3.56 5.50 6.50 9.30
Head On 6 0.08 0.23 0.00 0.50 0.50Angle 87 1.33 1.84 2.50 3.00 5.50Left Turn 77 1.18 1.60 2.50 3.00 4.30Right Turn 5 0.08 0.22 0.00 0.50 0.50Sideswipe 23 0.35 0.63 1.00 1.00 1.50Pedestrian/Bicycle 9 0.14 0.27 0.50 0.50 0.50Other 25 0.38 0.47 1.00 1.00 1.40
Severity PDO Crashes 199 3.06 4.50 6.00 6.00 8.80Possible Injury 139 2.13 2.17 5.00 5.80 7.00Non-Incapacitating Injury 92 1.42 1.57 2.50 3.30 4.40Incapacitating Injury 20 0.31 0.47 1.00 1.00 1.00Fatal Crashes 2 0.03 0.15 0.00 0.00 0.00
Light Conditions Daylight 300 4.62 4.37 7.50 9.30 12.80Dusk 12 0.18 0.31 0.50 0.50 1.00Dawn 2 0.03 0.12 0.00 0.00 0.40Dark (w/street lights) 106 1.63 2.64 4.00 4.00 5.50Dark (wo/street lights) 32 0.49 0.84 1.20 1.50 2.40
Surface Condition Dry 376 5.78 5.50 9.50 12.40 17.10Wet 68 1.05 1.55 2.00 2.50 3.00Slippery 7 0.11 0.29 0.20 0.50 0.50Others 1 0.02 0.09 0.00 0.00 0.00
Month of year January 26 0.39 0.53 1.00 1.30 1.50February 37 0.57 0.83 1.00 1.50 2.00March 34 0.52 0.60 1.20 1.50 1.50April 48 0.73 0.91 1.50 1.80 2.00May 41 0.63 0.80 1.00 1.50 2.00June 31 0.47 0.65 1.00 1.00 1.80July 37 0.56 0.69 1.20 1.50 1.90August 42 0.64 0.84 1.00 1.50 2.40September 41 0.62 0.88 1.50 1.50 2.00October 43 0.66 0.82 1.00 1.50 2.00November 40 0.62 0.72 1.50 1.50 1.50December 35 0.54 0.75 1.00 1.50 1.90
Day of week Monday 51 0.78 0.85 1.50 1.80 2.40Tuesday 67 1.02 1.23 1.70 2.50 3.40Wednesday 68 1.05 1.15 2.00 2.30 2.90Thursday 60 0.92 0.96 1.70 2.30 2.90Friday 73 1.12 1.34 2.00 2.50 3.00Saturday 80 1.22 1.54 2.50 2.80 4.30Sunday 54 0.83 1.15 1.50 1.80 2.90
Hour of day 00:00 - 06:00 37 0.56 0.76 1.20 1.50 1.5006:01 - 09:00 49 0.75 0.84 1.70 2.00 2.4009:01 - 11:00 32 0.48 0.63 1.00 1.50 1.9011:01 - 13:00 39 0.59 0.73 1.00 1.50 2.0013:01 - 15:00 65 1.00 1.17 1.70 2.00 3.0015:01 - 18:00 99 1.52 1.86 2.70 3.50 6.0018:01 - 24:00 133 2.04 2.35 3.50 5.00 6.40
Note: 1. Crashes extracted from years 2000 and 2001 for Brevard, City of Orlando, Hillsborough, Miami-Dade, and Seminole, and years 1999 and 2000 for Orange County. 2. Crashes represent only long forms. 3. Standard Deviation, 85th, 90th, and 95th Percentiles represent crash statistics per year per intersection.
85th Percentile 90th Percentile 95th Percentile
Entire Category
CATEGORY 13EXPECTED ANNUAL CRASH VALUE TABLE - 6 COUNTIES
4 Lane x 2 Lane Intersection, Signalized, AADT/lane for Major Road > 11,000 and Major Road Speed Limit > 40 mphTotal Number of Intersections Included - 65
Total number of crashes per year
Mean crashes per intersection
per year
Standard Deviation

131
251 8.96 7.65 18.98 20.15 20.83Collision Type Rear End 122 4.36 4.63 9.98 10.65 12.30
Head On 2 0.05 0.16 0.00 0.15 0.50Angle 53 1.89 1.79 3.50 4.00 4.98Left Turn 31 1.09 1.10 2.00 2.15 2.83Right Turn 4 0.14 0.33 0.50 0.50 0.50Sideswipe 22 0.79 0.89 1.50 1.50 2.15Pedestrian/Bicycle 3 0.09 0.31 0.00 0.15 0.50Other 16 0.55 0.77 1.00 1.50 2.15
Severity PDO Crashes 128 4.55 4.96 10.95 12.00 14.28Possible Injury 66 2.36 2.51 4.50 6.00 6.33Non-Incapacitating Injury 50 1.77 1.75 4.00 4.65 5.00Incapacitating Injury 8 0.27 0.37 0.50 1.00 1.00Fatal Crashes 1 0.02 0.09 0.00 0.00 0.00
Light Conditions Daylight 153 5.45 4.81 11.50 11.50 12.15Dusk 7 0.25 0.42 0.50 1.00 1.00Dawn 2 0.05 0.16 0.00 0.15 0.50Dark (w/street lights) 70 2.50 2.80 6.48 6.80 7.83Dark (wo/street lights) 20 0.71 0.98 2.00 2.15 2.50
Surface Condition Dry 221 7.88 6.87 16.93 17.15 19.13Wet 29 1.04 1.02 1.50 2.65 3.33Slippery 1 0.02 0.09 0.00 0.00 0.00Others 1 0.04 0.19 0.00 0.00 0.00
Month of year January 16 0.55 0.66 1.00 1.65 2.00February 22 0.79 0.87 1.50 2.00 2.33March 31 1.09 1.03 2.48 2.50 2.50April 21 0.73 0.87 1.50 2.00 2.33May 17 0.59 0.71 1.48 2.00 2.00June 24 0.84 0.99 2.00 2.00 2.00July 14 0.48 0.71 1.48 1.50 1.83August 18 0.64 0.83 1.00 1.65 2.00September 22 0.77 0.89 1.98 2.00 2.00October 22 0.79 0.81 1.50 1.65 2.33November 23 0.82 0.90 1.50 2.00 2.00December 25 0.88 0.86 1.98 2.00 2.33
Day of week Monday 37 1.30 1.24 2.98 3.00 3.33Tuesday 33 1.18 1.23 2.48 3.15 3.50Wednesday 37 1.32 1.44 2.50 3.65 4.00Thursday 45 1.61 1.60 3.95 4.15 4.50Friday 36 1.27 1.24 2.50 3.00 3.33Saturday 36 1.27 1.19 2.50 3.00 3.33Sunday 29 1.02 1.19 1.98 2.30 3.65
Hour of day 00:00 - 06:00 29 1.02 1.24 2.50 3.00 3.3306:01 - 09:00 21 0.75 0.92 1.98 2.00 2.3309:01 - 11:00 14 0.50 0.59 1.00 1.15 1.8311:01 - 13:00 20 0.70 0.70 1.50 1.65 2.0013:01 - 15:00 28 1.00 0.94 2.00 2.15 2.5015:01 - 18:00 53 1.88 2.14 3.98 5.00 5.3318:01 - 24:00 88 3.13 2.79 6.43 6.65 8.30
Note: 1. Crashes extracted from years 2000 and 2001 for Brevard, City of Orlando, Hillsborough, Miami-Dade, and Seminole, and years 1999 and 2000 for Orange County. 2. Crashes represent only long forms. 3. Standard Deviation, 85th, 90th, and 95th Percentiles represent crash statistics per year per intersection.
85th Percentile 90th Percentile 95th Percentile
Entire Category
CATEGORY 14EXPECTED ANNUAL CRASH VALUE TABLE - 6 COUNTIES
4 Lane x 3 Lane Intersection, SignalizedTotal Number of Intersections Included - 28
Total number of crashes per year
Mean crashes per intersection
per year
Standard Deviation

132
47 7.75 9.58 18.63 19.75 20.88Collision Type Rear End 16 2.58 3.11 6.25 6.50 6.75
Head On 1 0.17 0.26 0.50 0.50 0.50Angle 16 2.58 2.78 5.63 5.75 5.88Left Turn 8 1.33 2.16 3.50 4.00 4.50Right Turn 2 0.25 0.61 0.38 0.75 1.13Sideswipe 3 0.42 0.80 0.88 1.25 1.63Pedestrian/Bicycle 1 0.17 0.41 0.25 0.50 0.75Other 2 0.25 0.27 0.50 0.50 0.50
Severity PDO Crashes 32 5.33 7.74 14.63 15.25 15.88Possible Injury 11 1.75 1.78 3.25 3.50 3.75Non-Incapacitating Injury 4 0.58 0.74 1.50 1.50 1.50Incapacitating Injury 1 0.08 0.20 0.13 0.25 0.38Fatal Crashes 0 0.00 0.00 0.00 0.00 0.00
Light Conditions Daylight 33 5.42 7.00 11.25 13.50 15.75Dusk 1 0.08 0.20 0.13 0.25 0.38Dawn 0 0.00 0.00 0.00 0.00 0.00Wet 11 1.83 2.11 4.50 4.50 4.50Slippery 0 0.00 0.00 0.00 0.00 0.00
Month of year January 3 0.50 0.45 1.00 1.00 1.00March 2 0.33 0.82 0.50 1.00 1.50May 2 0.33 0.41 0.63 0.75 0.88June 4 0.58 1.02 1.38 1.75 2.13July 8 1.25 1.47 2.38 2.75 3.13August 3 0.42 0.58 0.75 1.00 1.25September 5 0.83 1.03 1.75 2.00 2.25October 6 0.92 1.36 1.63 2.25 2.88November 4 0.67 0.98 1.38 1.75 2.13December 7 1.08 1.69 3.13 3.25 3.38
Day of week Monday 6 1.00 1.22 2.50 2.50 2.50Tuesday 5 0.83 0.98 1.75 2.00 2.25Wednesday 9 1.50 2.07 3.50 4.00 4.50Thursday 6 1.00 1.30 1.63 2.25 2.88Friday 6 1.00 1.38 2.63 2.75 2.88Saturday 8 1.25 1.64 2.88 3.25 3.63Sunday 7 1.17 1.47 3.00 3.00 3.00
Hour of day 00:00 - 06:00 6 1.00 1.67 2.50 3.00 3.5006:01 - 09:00 5 0.83 1.03 1.75 2.00 2.2509:01 - 11:00 6 0.92 1.39 2.00 2.50 3.0011:01 - 13:00 3 0.42 0.49 1.00 1.00 1.0013:01 - 15:00 9 1.42 1.99 3.13 3.75 4.3815:01 - 18:00 9 1.50 1.73 3.50 3.50 3.5018:01 - 24:00 10 1.67 2.14 3.88 4.25 4.63
Note: 1. Crashes extracted from years 2000 and 2001 for Brevard, City of Orlando, Hillsborough, Miami-Dade, and Seminole, and years 1999 and 2000 for Orange County. 2. Crashes represent only long forms. 3. Standard Deviation, 85th, 90th, and 95th Percentiles represent crash statistics per year per intersection.
85th Percentile 90th Percentile 95th Percentile
Entire Category
CATEGORY 15EXPECTED ANNUAL CRASH VALUE TABLE - 6 COUNTIES
5 Lane x 2 Lane Intersection, SignalizedTotal Number of Intersections Included - 6
Total number of crashes per year
Mean crashes per intersection
per year
Standard Deviation

133
89 5.90 5.18 8.80 12.30 16.00Collision Type Rear End 36 2.37 2.82 3.95 4.30 6.45
Head On 0 0.00 0.00 0.00 0.00 0.00Angle 26 1.73 1.36 2.95 3.60 4.15Left Turn 12 0.80 1.07 2.40 2.50 2.65Right Turn 1 0.03 0.13 0.00 0.00 0.15Sideswipe 7 0.43 0.56 0.95 1.00 1.30Pedestrian/Bicycle 3 0.20 0.32 0.50 0.50 0.65Other 5 0.33 0.62 0.50 1.10 1.65
Severity PDO Crashes 43 2.87 3.73 6.30 7.70 9.70Possible Injury 25 1.63 1.54 2.45 3.10 4.25Non-Incapacitating Injury 19 1.23 1.33 2.50 2.50 3.10Incapacitating Injury 2 0.13 0.30 0.45 0.50 0.65Fatal Crashes 1 0.03 0.13 0.00 0.00 0.15
Light Conditions Daylight 65 4.33 4.05 5.45 8.80 12.35Dusk 1 0.07 0.18 0.00 0.30 0.50Dawn 2 0.10 0.28 0.00 0.30 0.65Dark (w/street lights) 17 1.10 1.24 2.45 3.10 3.50Dark (wo/street lights) 5 0.30 0.49 0.95 1.00 1.15
Surface Condition Dry 75 4.97 4.48 7.75 10.40 13.50Wet 12 0.80 0.73 1.45 1.80 2.15Slippery 1 0.07 0.26 0.00 0.00 0.30Others 1 0.07 0.18 0.00 0.30 0.50
Month of year January 7 0.47 0.64 1.00 1.30 1.65February 6 0.40 0.69 0.95 1.00 1.45March 8 0.53 0.55 1.00 1.00 1.30April 11 0.70 0.70 1.45 1.50 1.80May 9 0.57 0.65 1.45 1.50 1.65June 7 0.43 0.46 0.95 1.00 1.15July 5 0.30 0.37 0.50 0.80 1.00August 9 0.57 0.70 1.50 1.50 1.65September 12 0.80 0.77 1.50 1.80 2.15October 8 0.50 0.53 1.00 1.00 1.15November 4 0.23 0.37 0.50 0.80 1.00December 6 0.40 0.81 0.95 1.00 1.60
Day of week Monday 14 0.90 0.78 1.45 2.10 2.50Tuesday 12 0.80 0.94 1.95 2.00 2.30Wednesday 13 0.87 0.90 1.45 2.10 2.65Thursday 16 1.07 1.53 1.95 2.60 3.75Friday 12 0.80 0.82 1.50 1.50 1.80Saturday 11 0.73 0.73 1.50 1.80 2.00Sunday 11 0.73 0.98 1.00 1.00 1.90
Hour of day 00:00 - 06:00 6 0.37 0.61 0.50 1.10 1.6506:01 - 09:00 13 0.83 1.16 1.90 2.30 2.9509:01 - 11:00 3 0.20 0.37 0.50 0.80 1.0011:01 - 13:00 10 0.63 0.67 1.45 1.50 1.6513:01 - 15:00 10 0.67 1.25 0.95 1.00 2.2015:01 - 18:00 23 1.53 1.17 2.45 3.10 3.6518:01 - 24:00 25 1.67 1.36 2.90 3.30 3.95
Note: 1. Crashes extracted from years 2000 and 2001 for Brevard, City of Orlando, Hillsborough, Miami-Dade, and Seminole, and years 1999 and 2000 for Orange County. 2. Crashes represent only long forms. 3. Standard Deviation, 85th, 90th, and 95th Percentiles represent crash statistics per year per intersection.
85th Percentile 90th Percentile 95th Percentile
Entire Category
CATEGORY 16EXPECTED ANNUAL CRASH VALUE TABLE - 6 COUNTIES
4 Lane x 4 Lane Intersection, Signalized, AADT/lane for Major Road ≤ 5,000 Total Number of Intersections Included - 15
Total number of crashes per year
Mean crashes per intersection
per year
Standard Deviation

134
274 8.04 8.52 11.53 15.15 20.80Collision Type Rear End 94 2.76 3.26 3.60 5.50 6.50
Head On 7 0.19 0.41 0.50 0.50 0.67Angle 78 2.28 2.76 4.50 4.50 7.10Left Turn 41 1.21 1.61 3.00 3.35 4.52Right Turn 6 0.16 0.38 0.50 0.50 0.85Sideswipe 17 0.50 0.90 1.03 1.85 2.18Pedestrian/Bicycle 7 0.19 0.43 0.50 0.85 1.18Other 26 0.75 0.72 1.50 1.50 1.85
Severity PDO Crashes 162 4.75 6.78 9.50 12.30 18.60Possible Injury 64 1.87 2.04 3.03 3.50 4.18Non-Incapacitating Injury 35 1.03 0.97 2.00 2.00 2.68Incapacitating Injury 14 0.40 0.52 1.00 1.35 1.50Fatal Crashes 0 0.00 0.00 0.00 0.00 0.00
Light Conditions Daylight 189 5.54 5.50 9.50 12.30 15.88Dusk 5 0.15 0.36 0.50 0.50 1.00Dawn 2 0.06 0.16 0.00 0.35 0.50Dark (w/street lights) 69 2.01 3.05 3.03 3.50 5.52Dark (wo/street lights) 10 0.28 0.43 1.00 1.00 1.00
Surface Condition Dry 225 6.60 6.52 9.58 13.10 16.88Wet 43 1.26 1.96 1.53 2.00 3.72Slippery 1 0.01 0.09 0.00 0.00 0.00Others 6 0.16 0.40 0.50 0.50 1.18
Month of year January 21 0.62 0.70 1.00 1.35 1.68February 19 0.54 0.66 1.00 1.00 1.18March 17 0.50 0.86 1.00 1.00 1.68April 27 0.79 0.80 1.53 2.00 2.00May 21 0.60 0.68 1.03 1.50 1.68June 22 0.65 0.74 1.03 1.85 2.00July 23 0.66 1.11 1.03 1.50 2.20August 30 0.88 1.08 2.00 2.00 2.18September 23 0.68 1.09 1.03 1.50 2.35October 27 0.79 0.95 2.00 2.35 2.50November 18 0.53 0.74 1.03 1.50 1.85December 27 0.79 0.94 1.50 1.85 3.00
Day of week Monday 36 1.06 1.47 2.00 2.35 2.68Tuesday 40 1.18 1.71 2.50 2.50 4.85Wednesday 41 1.19 1.32 2.05 3.00 3.18Thursday 43 1.26 1.26 2.00 2.35 3.35Friday 41 1.21 1.26 2.03 2.85 3.85Saturday 42 1.22 1.67 2.03 2.85 4.02Sunday 32 0.93 1.17 1.50 1.50 2.52
Hour of day 00:00 - 06:00 22 0.65 0.79 1.03 1.50 2.1806:01 - 09:00 29 0.85 1.00 1.53 2.35 2.6809:01 - 11:00 24 0.71 0.89 1.03 1.50 2.3511:01 - 13:00 32 0.93 0.95 2.00 2.00 2.5013:01 - 15:00 28 0.82 0.98 2.00 2.35 2.6815:01 - 18:00 61 1.78 2.07 3.03 3.85 5.7018:01 - 24:00 79 2.31 3.12 3.53 4.00 5.20
Note: 1. Crashes extracted from years 2000 and 2001 for Brevard, City of Orlando, Hillsborough, Miami-Dade, and Seminole, and years 1999 and 2000 for Orange County. 2. Crashes represent only long forms. 3. Standard Deviation, 85th, 90th, and 95th Percentiles represent crash statistics per year per intersection.
85th Percentile 90th Percentile 95th Percentile
Entire Category
CATEGORY 17EXPECTED ANNUAL CRASH VALUE TABLE - 6 COUNTIES
4 Lane x 4 Lane Intersection, Signalized, AADT/lane for Major Road > 5,000 and ≤ 7,000 Total Number of Intersections Included - 34
Total number of crashes per year
Mean crashes per intersection
per year
Standard Deviation

135
307 8.76 7.77 17.20 20.30 23.20Collision Type Rear End 137 3.90 4.07 7.45 8.80 12.65
Head On 4 0.10 0.32 0.00 0.30 0.65Angle 62 1.76 1.83 3.50 4.60 5.50Left Turn 45 1.27 1.44 2.50 3.00 3.80Right Turn 6 0.16 0.34 0.50 0.50 0.65Sideswipe 25 0.71 1.01 1.50 2.00 3.15Pedestrian/Bicycle 7 0.19 0.34 0.50 0.50 0.65Other 24 0.67 1.39 1.45 1.80 3.15
Severity PDO Crashes 185 5.29 6.28 10.40 14.60 19.60Possible Injury 69 1.96 1.66 3.50 4.00 4.65Non-Incapacitating Injury 40 1.14 1.01 2.00 2.30 3.15Incapacitating Injury 12 0.34 0.58 0.50 1.00 1.30Fatal Crashes 1 0.03 0.12 0.00 0.00 0.15
Light Conditions Daylight 207 5.91 5.85 10.00 14.90 19.10Dusk 8 0.21 0.41 0.50 0.50 0.65Dawn 4 0.10 0.27 0.00 0.50 0.65Dark (w/street lights) 75 2.13 2.46 5.30 6.10 6.65Dark (wo/street lights) 14 0.40 0.72 1.00 1.50 1.80
Surface Condition Dry 252 7.20 6.31 13.90 15.80 18.60Wet 48 1.36 1.32 3.00 3.50 4.00Slippery 2 0.06 0.20 0.00 0.00 0.50Others 5 0.14 0.39 0.00 0.50 1.15
Month of year January 21 0.59 0.71 1.45 1.50 1.65February 21 0.59 0.71 1.45 1.50 2.00March 28 0.80 0.93 1.50 2.00 2.30April 21 0.60 0.60 1.00 1.50 1.50May 22 0.61 0.80 1.00 1.80 2.00June 27 0.77 0.89 1.95 2.30 2.65July 32 0.90 1.08 2.00 2.50 2.95August 37 1.06 1.21 2.45 2.50 3.30September 31 0.89 1.09 1.50 2.00 2.95October 27 0.76 0.93 2.00 2.00 2.50November 25 0.70 0.77 1.50 1.50 2.00December 18 0.50 0.65 1.50 1.50 1.65
Day of week Monday 40 1.13 1.27 2.50 2.80 3.30Tuesday 51 1.44 1.46 2.50 3.30 3.80Wednesday 45 1.29 1.35 2.50 2.80 3.60Thursday 44 1.24 1.32 2.95 3.30 3.65Friday 42 1.20 1.36 2.00 2.50 3.15Saturday 44 1.26 1.49 2.50 2.50 3.80Sunday 42 1.20 1.35 2.95 3.30 3.65
Hour of day 00:00 - 06:00 32 0.90 1.12 1.50 2.60 3.3006:01 - 09:00 41 1.16 1.45 2.00 2.30 3.7509:01 - 11:00 25 0.71 0.85 1.00 1.80 2.3011:01 - 13:00 32 0.91 1.22 1.95 2.60 3.5013:01 - 15:00 36 1.03 1.12 2.00 2.30 3.1515:01 - 18:00 63 1.79 1.74 3.00 4.30 5.6518:01 - 24:00 79 2.26 2.20 4.40 5.70 6.80
Note: 1. Crashes extracted from years 2000 and 2001 for Brevard, City of Orlando, Hillsborough, Miami-Dade, and Seminole, and years 1999 and 2000 for Orange County. 2. Crashes represent only long forms. 3. Standard Deviation, 85th, 90th, and 95th Percentiles represent crash statistics per year per intersection.
85th Percentile 90th Percentile 95th Percentile
Entire Category
CATEGORY 18EXPECTED ANNUAL CRASH VALUE TABLE - 6 COUNTIES
4 Lane x 4 Lane Intersection, Signalized, AADT/lane for Major Road > 7,000 and ≤ 9,000Total Number of Intersections Included - 35
Total number of crashes per year
Mean crashes per intersection
per year
Standard Deviation

136
508 15.38 8.78 25.50 29.50 32.50Collision Type Rear End 212 6.41 4.31 9.70 10.90 11.90
Head On 6 0.17 0.30 0.50 0.50 0.70Angle 116 3.50 2.98 6.20 7.80 8.90Left Turn 94 2.85 2.42 3.60 5.60 7.40Right Turn 6 0.18 0.33 0.50 0.50 1.00Sideswipe 37 1.11 1.18 2.50 2.50 3.10Pedestrian/Bicycle 10 0.30 0.47 0.60 1.00 1.00Other 29 0.86 0.78 1.60 2.00 2.20
Severity PDO Crashes 266 8.06 6.40 14.40 16.40 21.30Possible Injury 138 4.18 3.39 6.60 7.00 8.50Non-Incapacitating Injury 73 2.21 1.93 4.50 4.90 5.70Incapacitating Injury 29 0.88 0.76 1.50 1.50 2.00Fatal Crashes 2 0.05 0.15 0.00 0.00 0.50
Light Conditions Daylight 328 9.92 6.18 18.60 20.20 22.40Dusk 12 0.36 0.50 1.00 1.00 1.20Dawn 7 0.20 0.33 0.50 0.50 0.50Dark (w/street lights) 142 4.29 2.87 7.50 8.30 9.90Dark (wo/street lights) 20 0.61 1.07 1.50 1.50 2.40
Surface Condition Dry 436 13.20 7.80 22.80 26.40 28.30Wet 66 1.98 1.37 3.10 3.50 4.10Slippery 2 0.06 0.17 0.00 0.40 0.50Others 5 0.14 0.36 0.10 0.50 1.00
Month of year January 32 0.97 0.96 1.50 2.30 3.20February 39 1.18 0.98 1.60 2.40 2.90March 34 1.03 0.93 2.00 2.40 2.70April 46 1.38 1.03 2.00 2.40 3.40May 49 1.48 1.11 2.50 2.50 3.60June 42 1.27 1.26 2.10 2.90 3.70July 44 1.32 0.85 2.10 2.90 3.00August 48 1.44 1.17 2.60 3.00 3.50September 40 1.20 0.91 2.00 2.00 2.20October 40 1.21 0.86 2.10 2.50 2.50November 42 1.26 1.02 2.20 3.00 3.00December 54 1.64 1.08 2.50 2.90 3.20
Day of week Monday 72 2.17 1.70 3.50 3.50 6.20Tuesday 70 2.11 1.64 4.00 4.00 5.20Wednesday 74 2.24 1.40 3.60 4.00 4.90Thursday 74 2.23 1.38 3.10 4.30 4.50Friday 92 2.79 1.92 4.50 5.30 6.20Saturday 69 2.08 1.56 3.60 4.00 4.90Sunday 59 1.77 1.43 3.00 3.00 4.10
Hour of day 00:00 - 06:00 57 1.73 1.52 2.70 3.90 4.2006:01 - 09:00 61 1.83 1.87 3.50 4.30 5.5009:01 - 11:00 44 1.32 1.00 2.00 2.40 2.7011:01 - 13:00 49 1.47 1.22 2.50 3.70 4.0013:01 - 15:00 62 1.88 1.52 3.60 4.00 4.0015:01 - 18:00 93 2.80 1.99 4.80 6.40 6.7018:01 - 24:00 144 4.35 2.38 6.60 7.00 9.00
Note: 1. Crashes extracted from years 2000 and 2001 for Brevard, City of Orlando, Hillsborough, Miami-Dade, and Seminole, and years 1999 and 2000 for Orange County. 2. Crashes represent only long forms. 3. Standard Deviation, 85th, 90th, and 95th Percentiles represent crash statistics per year per intersection.
85th Percentile 90th Percentile 95th Percentile
Entire Category
CATEGORY 19EXPECTED ANNUAL CRASH VALUE TABLE - 6 COUNTIES
4 Lane x 4 Lane Intersection, Signalized, AADT/lane for Major Road > 9,000 and ≤ 11,000Total Number of Intersections Included - 33
Total number of crashes per year
Mean crashes per intersection
per year
Standard Deviation

137
480 15.47 11.44 27.50 29.00 34.50Collision Type Rear End 208 6.69 5.90 12.25 13.50 19.00
Head On 7 0.23 0.50 0.50 0.50 0.75Angle 108 3.48 2.97 6.50 7.50 8.25Left Turn 62 2.00 1.97 4.00 4.50 5.00Right Turn 6 0.18 0.30 0.50 0.50 0.75Sideswipe 43 1.37 1.45 3.00 3.50 4.00Pedestrian/Bicycle 14 0.45 0.57 1.00 1.00 1.00Other 33 1.06 1.12 2.50 2.50 2.75
Severity PDO Crashes 309 9.97 9.07 21.25 23.50 24.50Possible Injury 86 2.76 2.21 5.50 6.00 6.75Non-Incapacitating Injury 71 2.27 2.48 5.25 7.00 7.50Incapacitating Injury 15 0.47 0.60 1.00 1.00 2.00Fatal Crashes 0 0.00 0.00 0.00 0.00 0.00
Light Conditions Daylight 285 9.18 6.57 16.25 18.50 21.00Dusk 9 0.29 0.46 1.00 1.00 1.00Dawn 9 0.27 0.38 0.50 0.50 1.00Dark (w/street lights) 161 5.19 5.03 10.00 12.50 14.00Dark (wo/street lights) 17 0.53 0.95 1.25 2.00 2.25
Surface Condition Dry 410 13.21 9.85 23.00 24.50 30.25Wet 61 1.97 1.77 3.50 4.00 5.00Slippery 2 0.05 0.20 0.00 0.00 0.25Others 8 0.24 0.58 0.50 1.00 1.75
Month of year January 32 1.02 0.94 2.00 2.50 2.75February 36 1.15 1.30 2.00 3.00 4.00March 39 1.24 1.22 2.75 3.00 3.00April 35 1.13 1.12 2.25 2.50 2.75May 39 1.26 1.24 2.50 3.00 3.00June 42 1.35 1.19 2.25 3.00 3.50July 33 1.05 1.21 2.00 2.50 3.00August 57 1.84 1.72 3.50 4.50 5.25September 42 1.35 1.14 2.50 3.00 3.00October 50 1.61 1.43 3.25 3.50 4.25November 41 1.32 1.29 2.75 3.00 3.75December 36 1.15 1.11 2.50 3.00 3.00
Day of week Monday 79 2.55 1.89 4.50 4.50 5.50Tuesday 68 2.19 1.79 4.00 5.00 5.50Wednesday 64 2.06 1.90 4.00 5.50 5.75Thursday 58 1.85 1.47 3.50 4.00 4.25Friday 65 2.10 2.01 4.75 5.00 5.50Saturday 68 2.18 2.04 4.25 4.50 6.00Sunday 79 2.53 1.95 4.25 5.00 5.50
Hour of day 00:00 - 06:00 79 2.53 2.23 4.50 5.00 6.2506:01 - 09:00 47 1.50 1.28 2.75 3.50 3.5009:01 - 11:00 36 1.15 1.23 2.25 3.00 3.7511:01 - 13:00 47 1.52 1.17 2.50 2.50 3.2513:01 - 15:00 41 1.31 1.10 2.50 2.50 3.0015:01 - 18:00 90 2.89 2.50 5.25 6.00 8.0018:01 - 24:00 142 4.58 4.11 7.50 10.00 12.00
Note: 1. Crashes extracted from years 2000 and 2001 for Brevard, City of Orlando, Hillsborough, Miami-Dade, and Seminole, and years 1999 and 2000 for Orange County. 2. Crashes represent only long forms. 3. Standard Deviation, 85th, 90th, and 95th Percentiles represent crash statistics per year per intersection.
85th Percentile 90th Percentile 95th Percentile
Entire Category
CATEGORY 20EXPECTED ANNUAL CRASH VALUE TABLE - 6 COUNTIES
4 Lane x 4 Lane Intersection, Signalized, AADT/lane for Major Road > 11,000Total Number of Intersections included - 31
Total number of crashes per year
Mean crashes per intersection
per year
Standard Deviation

138
126 15.75 11.54 19.98 24.80 30.40Collision Type Rear End 34 4.19 3.39 7.43 7.80 8.15
Head On 3 0.31 0.46 0.98 1.00 1.00Angle 43 5.31 5.25 8.83 11.10 13.55Left Turn 24 2.94 3.78 3.98 6.25 8.88Right Turn 3 0.38 0.58 0.98 1.15 1.33Sideswipe 11 1.31 1.60 2.48 3.10 3.80Pedestrian/Bicycle 1 0.13 0.23 0.48 0.50 0.50Other 10 1.19 1.10 2.45 2.65 2.83
Severity PDO Crashes 88 11.00 10.52 14.50 19.75 25.88Possible Injury 18 2.19 1.87 3.98 4.00 4.00Non-Incapacitating Injury 17 2.06 3.99 3.38 5.90 8.70Incapacitating Injury 4 0.50 0.53 0.98 1.15 1.33Fatal Crashes 0 0.00 0.00 0.00 0.00 0.00
Light Conditions Daylight 81 10.06 8.42 13.48 17.10 21.30Dusk 2 0.25 0.38 0.50 0.65 0.83Dawn 2 0.19 0.26 0.50 0.50 0.50Dark (w/street lights) 30 3.75 2.99 5.48 6.55 7.78Dark (wo/street lights) 12 1.50 4.24 0.00 3.60 7.80
Surface Condition Dry 106 13.25 9.90 17.48 21.55 26.28Wet 16 1.94 1.45 3.45 3.65 3.83Slippery 0 0.00 0.00 0.00 0.00 0.00Others 5 0.56 0.42 1.00 1.00 1.00
Month of year January 10 1.19 1.03 1.98 2.30 2.65February 12 1.44 1.12 2.48 2.65 2.83March 11 1.31 1.25 2.50 2.65 2.83April 11 1.31 0.84 2.00 2.15 2.33May 6 0.69 0.75 1.48 1.65 1.83June 10 1.19 1.03 1.98 2.30 2.65July 12 1.50 1.54 2.93 3.45 3.98August 13 1.56 1.43 2.98 3.15 3.33September 13 1.56 1.72 1.50 2.70 4.10October 10 1.19 1.22 1.98 2.45 2.98November 11 1.38 1.22 2.48 2.65 2.83December 12 1.44 1.66 3.45 3.65 3.83
Day of week Monday 17 2.06 1.50 3.48 3.65 3.83Tuesday 14 1.69 1.89 1.98 3.20 4.60Wednesday 17 2.13 1.66 3.95 4.15 4.33Thursday 22 2.69 2.39 5.88 6.00 6.00Friday 22 2.69 2.20 3.98 4.90 5.95Saturday 22 2.75 2.71 5.90 6.30 6.65Sunday 14 1.75 1.36 3.00 3.15 3.33
Hour of day 00:00 - 06:00 12 1.44 1.82 1.98 3.05 4.2806:01 - 09:00 14 1.75 1.79 2.98 3.60 4.3009:01 - 11:00 13 1.56 1.29 3.00 3.00 3.0011:01 - 13:00 13 1.56 1.61 2.98 3.45 3.9813:01 - 15:00 10 1.25 1.31 2.48 2.80 3.1515:01 - 18:00 28 3.50 2.93 5.48 6.40 7.4518:01 - 24:00 38 4.69 4.77 6.98 9.25 11.88
Note: 1. Crashes extracted from years 2000 and 2001 for Brevard, City of Orlando, Hillsborough, Miami-Dade, and Seminole, and years 1999 and 2000 for Orange County. 2. Crashes represent only long forms. 3. Standard Deviation, 85th, 90th, and 95th Percentiles represent crash statistics per year per intersection.
85th Percentile 90th Percentile 95th Percentile
Entire Category
CATEGORY 21EXPECTED ANNUAL CRASH VALUE TABLE - 6 COUNTIES
5 Lane x 4 Lane Intersection, SignalizedTotal Number of Intersections Included - 8
Total number of crashes per year
Mean crashes per intersection
per year
Standard Deviation

139
298 7.26 6.95 17.00 17.50 20.00Collision Type Rear End 111 2.71 3.09 6.00 6.50 7.50
Head On 4 0.10 0.26 0.00 0.50 0.50Angle 82 2.00 2.45 4.50 5.50 6.00Left Turn 51 1.24 1.53 3.00 4.00 4.50Right Turn 5 0.11 0.26 0.50 0.50 0.50Sideswipe 19 0.46 0.71 1.00 1.50 2.00Pedestrian/Bicycle 7 0.16 0.28 0.50 0.50 0.50Other 20 0.48 0.59 1.00 1.50 1.50
Severity PDO Crashes 180 4.39 5.16 11.00 13.00 13.50Possible Injury 54 1.32 1.35 2.50 3.00 3.50Non-Incapacitating Injury 49 1.20 1.47 3.00 3.50 4.00Incapacitating Injury 14 0.34 0.48 1.00 1.00 1.00Fatal Crashes 1 0.01 0.08 0.00 0.00 0.00
Light Conditions Daylight 199 4.85 4.70 9.00 12.50 14.00Dusk 11 0.27 0.40 0.50 1.00 1.00Dawn 3 0.07 0.21 0.00 0.50 0.50Dark (w/street lights) 73 1.77 2.13 4.00 5.50 6.00Dark (wo/street lights) 12 0.29 0.58 0.50 1.00 1.50
Surface Condition Dry 250 6.10 5.89 13.50 14.50 18.00Wet 45 1.09 1.19 2.50 3.00 3.00Slippery 1 0.01 0.08 0.00 0.00 0.00Others 3 0.06 0.20 0.00 0.00 0.50
Month of year January 29 0.70 0.89 1.50 2.00 2.50February 27 0.65 0.78 1.50 1.50 2.50March 26 0.63 0.78 1.50 1.50 2.00April 25 0.61 0.68 1.50 1.50 1.50May 32 0.78 1.04 1.50 2.00 3.00June 24 0.57 0.68 1.00 1.50 2.00July 22 0.54 0.86 1.00 2.00 2.00August 32 0.78 1.01 2.00 2.50 2.50September 22 0.52 0.57 1.00 1.50 1.50October 17 0.41 0.67 1.00 1.50 1.50November 20 0.48 0.62 1.00 1.00 1.50December 24 0.59 0.84 1.50 1.50 2.50
Day of week Monday 35 0.84 0.90 2.00 2.00 2.00Tuesday 44 1.07 1.03 2.00 2.50 2.50Wednesday 38 0.93 1.29 1.50 1.50 2.50Thursday 49 1.18 1.48 2.50 3.50 4.00Friday 53 1.29 1.35 2.50 3.00 4.00Saturday 40 0.98 1.27 2.00 2.50 4.00Sunday 40 0.96 0.96 2.00 2.50 3.00
Hour of day 00:00 - 06:00 26 0.62 0.85 1.50 1.50 2.5006:01 - 09:00 34 0.82 1.08 1.50 2.00 3.0009:01 - 11:00 21 0.51 0.64 1.00 1.50 1.5011:01 - 13:00 28 0.67 0.93 1.50 1.50 2.0013:01 - 15:00 32 0.78 0.87 2.00 2.00 2.5015:01 - 18:00 70 1.70 1.81 3.50 3.50 5.0018:01 - 24:00 89 2.16 2.22 4.50 6.50 6.50
Note: 1. Crashes extracted from years 2000 and 2001 for Brevard, City of Orlando, Hillsborough, Miami-Dade, and Seminole, and years 1999 and 2000 for Orange County. 2. Crashes represent only long forms. 3. Standard Deviation, 85th, 90th, and 95th Percentiles represent crash statistics per year per intersection.
85th Percentile 90th Percentile 95th Percentile
Entire Category
CATEGORY 22EXPECTED ANNUAL CRASH VALUE TABLE - 6 COUNTIES
6 Lane x 2 Lane Intersection, Signalized, AADT/lane for Major Road ≤ 7,000Total Number of Intersections Included - 41
Total number of crashes per year
Mean crashes per intersection
per year
Standard Deviation

140
290 7.82 4.90 13.00 15.70 18.00Collision Type Rear End 143 3.85 3.34 7.00 9.40 10.80
Head On 2 0.04 0.14 0.00 0.00 0.50Angle 55 1.49 1.34 2.50 2.70 3.10Left Turn 42 1.14 1.11 2.30 2.70 3.10Right Turn 5 0.12 0.25 0.50 0.50 0.50Sideswipe 18 0.47 0.62 1.30 1.50 1.60Pedestrian/Bicycle 11 0.28 0.38 0.50 0.70 1.00Other 16 0.43 0.58 1.00 1.00 1.20
Severity PDO Crashes 154 4.16 3.18 7.50 8.70 10.20Possible Injury 66 1.77 1.39 3.00 3.50 4.50Non-Incapacitating Injury 53 1.43 1.09 2.00 2.70 3.60Incapacitating Injury 16 0.43 0.57 1.00 1.00 1.60Fatal Crashes 1 0.03 0.11 0.00 0.00 0.10
Light Conditions Daylight 211 5.69 3.94 9.60 11.20 12.80Dusk 4 0.09 0.26 0.00 0.50 0.60Dawn 2 0.05 0.16 0.00 0.20 0.50Dark (w/street lights) 53 1.43 1.36 2.50 2.70 3.50Dark (wo/street lights) 21 0.55 1.03 1.30 2.00 2.30
Surface Condition Dry 252 6.81 4.31 11.40 12.90 14.60Wet 35 0.95 0.98 1.80 2.20 3.10Slippery 1 0.03 0.11 0.00 0.00 0.10Others 2 0.04 0.14 0.00 0.00 0.50
Month of year January 22 0.59 0.62 1.00 1.20 1.50February 22 0.58 0.60 1.00 1.50 1.50March 28 0.76 0.72 1.50 1.70 2.00April 32 0.85 0.94 1.50 2.00 2.60May 24 0.65 0.70 1.30 1.50 2.10June 25 0.66 0.72 1.50 1.70 2.10July 26 0.69 0.72 1.30 1.70 2.00August 22 0.59 0.59 1.00 1.20 1.60September 26 0.69 0.66 1.30 1.50 2.10October 21 0.55 0.62 1.30 1.50 1.50November 25 0.68 0.61 1.50 1.50 1.60December 20 0.53 0.70 1.00 1.20 1.50
Day of week Monday 40 1.07 0.87 2.00 2.00 2.50Tuesday 43 1.16 0.89 2.50 2.50 2.50Wednesday 45 1.22 1.16 2.50 2.70 3.30Thursday 44 1.18 1.19 2.30 2.70 4.00Friday 40 1.08 1.10 2.50 2.50 3.10Saturday 44 1.18 0.95 2.00 2.50 2.60Sunday 35 0.95 0.73 1.50 1.50 2.00
Hour of day 00:00 - 06:00 27 0.73 0.88 1.50 2.00 2.1006:01 - 09:00 36 0.96 0.97 1.50 2.00 2.3009:01 - 11:00 25 0.66 0.82 1.00 1.70 2.5011:01 - 13:00 33 0.89 0.80 1.50 1.70 2.0013:01 - 15:00 37 1.00 1.38 2.00 2.70 3.2015:01 - 18:00 67 1.80 1.33 3.00 3.20 4.1018:01 - 24:00 66 1.78 1.49 3.00 3.70 4.20
Note: 1. Crashes extracted from years 2000 and 2001 for Brevard, City of Orlando, Hillsborough, Miami-Dade, and Seminole, and years 1999 and 2000 for Orange County. 2. Crashes represent only long forms. 3. Standard Deviation, 85th, 90th, and 95th Percentiles represent crash statistics per year per intersection.
85th Percentile 90th Percentile 95th Percentile
Entire Category
CATEGORY 23EXPECTED ANNUAL CRASH VALUE TABLE - 6 COUNTIES
6 Lane x 2 Lane Intersection, Signalized, AADT/lane for Major Road > 7,000 and ≤ 9,000Total Number of Intersections Included - 37
Total number of crashes per year
Mean crashes per intersection
per year
Standard Deviation

141
306 9.27 6.14 14.70 15.90 19.70Collision Type Rear End 141 4.27 3.06 7.60 9.20 10.00
Head On 3 0.08 0.22 0.00 0.40 0.50Angle 60 1.80 1.57 3.50 3.90 4.50Left Turn 44 1.32 1.50 2.50 3.30 4.90Right Turn 4 0.11 0.24 0.50 0.50 0.50Sideswipe 32 0.97 0.98 2.00 2.00 2.90Pedestrian/Bicycle 8 0.24 0.42 0.60 1.00 1.00Other 16 0.48 0.49 1.00 1.00 1.50
Severity PDO Crashes 169 5.12 4.52 9.20 10.80 12.60Possible Injury 72 2.18 1.55 3.60 4.00 5.20Non-Incapacitating Injury 52 1.56 1.21 2.60 3.40 3.70Incapacitating Injury 13 0.39 0.46 1.00 1.00 1.00Fatal Crashes 1 0.02 0.09 0.00 0.00 0.00
Light Conditions Daylight 216 6.53 4.31 10.60 11.40 13.70Dusk 4 0.11 0.24 0.50 0.50 0.50Dawn 2 0.06 0.17 0.00 0.40 0.50Dark (w/street lights) 79 2.38 1.98 5.00 5.00 5.20Dark (wo/street lights) 7 0.20 0.41 0.50 0.50 1.20
Surface Condition Dry 262 7.92 5.36 12.00 14.40 15.90Wet 41 1.24 1.34 2.60 3.00 3.70Slippery 3 0.08 0.22 0.00 0.40 0.50Others 1 0.03 0.17 0.00 0.00 0.00
Month of year January 28 0.85 0.72 2.00 2.00 2.00February 21 0.62 0.61 1.00 1.40 1.50March 27 0.80 0.87 1.60 2.00 2.20April 30 0.89 0.75 1.50 1.90 2.20May 22 0.67 0.74 1.50 1.50 2.20June 27 0.82 0.76 1.50 1.50 2.20July 26 0.77 0.76 1.50 1.90 2.50August 26 0.77 0.72 1.00 1.40 2.50September 20 0.59 0.83 1.10 1.50 1.70October 29 0.86 0.77 2.00 2.00 2.00November 28 0.83 0.99 1.60 2.00 2.90December 26 0.79 0.71 1.50 1.50 2.00
Day of week Monday 47 1.42 1.15 2.50 2.90 3.20Tuesday 41 1.24 1.12 2.00 2.80 3.50Wednesday 41 1.24 1.19 2.50 2.90 3.40Thursday 47 1.42 1.47 2.60 3.40 3.70Friday 43 1.29 1.10 2.50 2.90 3.00Saturday 45 1.36 1.05 2.50 2.90 3.50Sunday 43 1.29 1.08 2.50 2.90 3.00
Hour of day 00:00 - 06:00 31 0.92 0.77 2.00 2.00 2.2006:01 - 09:00 30 0.89 0.92 1.60 2.00 2.0009:01 - 11:00 33 0.98 0.81 1.60 2.00 2.2011:01 - 13:00 39 1.17 1.31 2.60 3.40 3.7013:01 - 15:00 36 1.09 1.02 2.00 2.40 3.0015:01 - 18:00 59 1.79 1.64 3.00 3.40 4.7018:01 - 24:00 80 2.42 1.85 4.50 4.50 5.60
Note: 1. Crashes extracted from years 2000 and 2001 for Brevard, City of Orlando, Hillsborough, Miami-Dade, and Seminole, and years 1999 and 2000 for Orange County. 2. Crashes represent only long forms. 3. Standard Deviation, 85th, 90th, and 95th Percentiles represent crash statistics per year per intersection.
85th Percentile 90th Percentile 95th Percentile
Entire Category
CATEGORY 24EXPECTED ANNUAL CRASH VALUE TABLE - 6 COUNTIES
6 Lane x 2 Lane Intersection, Signalized, AADT/lane for Major Road > 9,000 and ≤ 11,000Total Number of Intersections Included - 33
Total number of crashes per year
Mean crashes per intersection
per year
Standard Deviation

142
224 10.16 6.40 15.50 17.30 18.93Collision Type Rear End 108 4.91 3.40 8.93 9.45 9.50
Head On 3 0.14 0.44 0.00 0.45 0.50Angle 34 1.55 1.36 2.93 3.00 3.00Left Turn 34 1.52 1.63 2.93 3.00 3.48Right Turn 3 0.14 0.28 0.50 0.50 0.50Sideswipe 20 0.91 0.91 1.93 2.00 2.48Pedestrian/Bicycle 2 0.09 0.20 0.42 0.50 0.50Other 20 0.91 0.75 1.50 1.50 2.45
Severity PDO Crashes 130 5.91 4.76 10.43 10.50 13.83Possible Injury 53 2.41 1.44 3.50 4.40 4.98Non-Incapacitating Injury 27 1.23 1.08 2.00 2.00 3.43Incapacitating Injury 10 0.45 0.53 1.00 1.45 1.50Fatal Crashes 4 0.16 0.28 0.50 0.50 0.50
Light Conditions Daylight 150 6.80 4.61 10.28 10.50 15.25Dusk 4 0.18 0.25 0.50 0.50 0.50Dawn 3 0.14 0.23 0.50 0.50 0.50Dark (w/street lights) 65 2.93 2.33 5.50 5.95 6.95Dark (wo/street lights) 3 0.11 0.26 0.42 0.50 0.50
Surface Condition Dry 181 8.23 5.42 12.35 13.40 15.40Wet 39 1.77 1.29 3.35 3.95 4.00Slippery 1 0.05 0.21 0.00 0.00 0.00Others 3 0.11 0.31 0.00 0.45 0.98
Month of year January 14 0.64 0.54 1.00 1.00 1.48February 13 0.57 0.70 1.00 1.45 1.50March 16 0.70 0.59 1.43 1.50 1.50April 22 0.98 1.06 1.50 1.50 1.98May 21 0.95 0.79 1.50 1.50 2.45June 16 0.70 0.78 1.00 1.00 2.43July 26 1.16 1.10 2.50 2.95 3.00August 21 0.93 0.70 1.50 1.95 2.00September 17 0.75 0.63 1.50 1.50 1.50October 25 1.14 1.15 2.00 2.45 3.45November 17 0.75 0.88 1.50 1.50 2.45December 20 0.89 0.75 1.93 2.00 2.00
Day of week Monday 26 1.18 1.18 1.93 2.00 2.48Tuesday 36 1.64 1.16 2.93 3.00 3.00Wednesday 34 1.55 1.38 2.43 3.40 3.98Thursday 28 1.25 0.84 2.00 2.00 2.00Friday 39 1.77 1.08 2.93 3.00 3.00Saturday 36 1.64 1.42 2.93 3.45 4.45Sunday 25 1.14 0.99 2.43 2.50 2.98
Hour of day 00:00 - 06:00 20 0.91 1.17 1.50 2.40 3.4506:01 - 09:00 15 0.66 0.75 1.00 1.45 2.4509:01 - 11:00 15 0.68 0.61 1.00 1.45 1.9811:01 - 13:00 24 1.07 0.73 1.50 1.95 2.0013:01 - 15:00 28 1.25 0.95 2.50 2.50 2.5015:01 - 18:00 54 2.45 1.85 3.50 4.40 4.5018:01 - 24:00 69 3.14 2.51 5.85 7.35 7.50
Note: 1. Crashes extracted from years 2000 and 2001 for Brevard, City of Orlando, Hillsborough, Miami-Dade, and Seminole, and years 1999 and 2000 for Orange County. 2. Crashes represent only long forms. 3. Standard Deviation, 85th, 90th, and 95th Percentiles represent crash statistics per year per intersection.
CATEGORY 25EXPECTED ANNUAL CRASH VALUE TABLE - 6 COUNTIES
6 Lane x 2 Lane Intersection, Signalized, AADT/lane for Major Road >11,000Total Number of Intersections Included - 22
85th Percentile 90th Percentile 95th Percentile
Entire Category
Total number of crashes per year
Mean crashes per intersection
per year
Standard Deviation

143
279 16.38 11.64 28.60 33.00 38.10Collision Type Rear End 125 7.32 6.51 11.80 14.40 18.30
Head On 3 0.18 0.39 0.50 0.50 0.70Angle 60 3.53 2.65 6.20 7.60 8.70Left Turn 37 2.18 2.23 3.30 4.90 7.10Right Turn 4 0.21 0.44 0.50 0.70 1.10Sideswipe 23 1.35 1.57 2.80 3.20 3.90Pedestrian/Bicycle 8 0.44 0.66 1.30 1.50 1.60Other 20 1.18 1.22 2.00 2.60 3.70
Severity PDO Crashes 168 9.88 8.82 19.90 23.90 26.30Possible Injury 64 3.74 2.44 5.00 5.60 7.40Non-Incapacitating Injury 35 2.06 1.58 3.60 4.20 4.80Incapacitating Injury 10 0.59 0.54 1.00 1.00 1.20Fatal Crashes 2 0.12 0.22 0.50 0.50 0.50
Light Conditions Daylight 187 11.00 8.58 18.60 24.80 29.30Dusk 8 0.47 0.70 1.00 1.20 1.70Dawn 1 0.06 0.24 0.00 0.00 0.20Dark (w/street lights) 79 4.62 3.64 8.60 9.20 9.70Dark (wo/street lights) 4 0.24 0.40 0.80 1.00 1.00
Surface Condition Dry 234 13.76 9.91 25.70 28.30 31.20Wet 43 2.50 2.38 4.00 4.60 6.30Slippery 1 0.06 0.24 0.00 0.00 0.20Others 1 0.06 0.17 0.00 0.20 0.50
Month of year January 25 1.47 1.17 2.50 2.90 3.60February 19 1.09 1.12 2.10 2.90 3.50March 21 1.21 0.95 2.30 2.50 2.60April 18 1.06 1.47 2.50 2.90 3.80May 25 1.44 1.26 2.80 3.20 3.60June 22 1.29 1.21 2.30 2.90 3.60July 20 1.18 1.17 2.30 2.50 2.80August 28 1.62 1.92 2.80 4.00 5.70September 31 1.82 1.30 3.30 3.50 3.70October 26 1.50 1.37 3.10 3.50 3.80November 24 1.41 1.14 2.60 3.20 3.60December 22 1.29 1.12 2.80 3.00 3.00
Day of week Monday 39 2.26 2.17 4.80 5.60 6.60Tuesday 42 2.47 1.59 3.50 3.90 4.90Wednesday 45 2.62 2.18 4.60 5.60 6.70Thursday 35 2.06 1.61 3.70 4.70 5.10Friday 47 2.76 2.24 5.00 5.40 6.30Saturday 39 2.29 1.98 4.20 5.20 5.90Sunday 33 1.91 1.73 4.00 4.20 4.60
Hour of day 00:00 - 06:00 24 1.41 1.28 3.00 3.00 3.0006:01 - 09:00 30 1.76 1.47 3.60 4.00 4.2009:01 - 11:00 26 1.53 1.37 2.80 3.40 4.2011:01 - 13:00 31 1.82 1.63 3.80 4.20 4.7013:01 - 15:00 36 2.12 2.25 5.10 5.70 6.3015:01 - 18:00 56 3.26 2.40 5.60 6.60 7.7018:01 - 24:00 76 4.47 3.00 7.70 8.50 8.80
Note: 1. Crashes extracted from years 2000 and 2001 for Brevard, City of Orlando, Hillsborough, Miami-Dade, and Seminole, and years 1999 and 2000 for Orange County. 2. Crashes represent only long forms. 3. Standard Deviation, 85th, 90th, and 95th Percentiles represent crash statistics per year per intersection.
Entire Category
Standard Deviation
Mean crashes per intersection
per year
Total number of crashes per year
CATEGORY 26EXPECTED ANNUAL CRASH VALUE TABLE - 6 COUNTIES
6 Lane x 3 Lane Intersection, SignalizedTotal Number of Intersections Included - 17
85th Percentile 90th Percentile 95th Percentile

144
53 5.89 7.23 14.50 15.90 16.70Collision Type Rear End 19 2.11 2.67 5.50 6.10 6.30
Head On 1 0.06 0.17 0.00 0.10 0.30Angle 16 1.72 2.20 4.40 4.60 4.80Left Turn 10 1.06 1.49 2.70 3.20 3.60Right Turn 3 0.28 0.51 0.50 0.70 1.10Sideswipe 3 0.28 0.57 0.80 1.10 1.30Pedestrian/Bicycle 1 0.11 0.22 0.40 0.50 0.50Other 3 0.28 0.36 0.50 0.60 0.80
Severity PDO Crashes 35 3.83 4.99 10.00 11.20 11.60Possible Injury 11 1.22 1.33 2.40 2.70 3.10Non-Incapacitating Injury 7 0.72 0.91 1.90 2.00 2.00Incapacitating Injury 1 0.11 0.33 0.00 0.20 0.60Fatal Crashes 0 0.00 0.00 0.00 0.00 0.00
Light Conditions Daylight 39 4.33 5.37 9.20 10.40 12.20Dusk 1 0.06 0.17 0.00 0.10 0.30Dawn 1 0.06 0.17 0.00 0.10 0.30Dark (w/street lights) 13 1.44 2.13 3.50 3.90 4.70Dark (wo/street lights) 0 0.00 0.00 0.00 0.00 0.00
Surface Condition Dry 47 5.17 6.16 12.40 13.30 13.90Wet 7 0.72 1.18 2.10 2.60 2.80Slippery 0 0.00 0.00 0.00 0.00 0.00Others 0 0.00 0.00 0.00 0.00 0.00
Month of year January 6 0.61 1.08 2.10 2.50 2.50February 4 0.44 0.46 1.00 1.00 1.00March 6 0.61 0.96 1.70 2.10 2.30April 3 0.33 0.50 1.00 1.00 1.00May 4 0.44 0.58 1.00 1.10 1.30June 6 0.61 0.78 1.40 1.60 1.80July 4 0.39 0.55 0.90 1.10 1.30August 5 0.56 0.88 1.30 1.70 2.10September 3 0.28 0.44 0.90 1.00 1.00October 7 0.72 0.97 2.00 2.00 2.00November 3 0.33 0.56 0.90 1.10 1.30December 5 0.56 0.68 1.40 1.50 1.50
Day of week Monday 6 0.67 1.03 1.40 1.80 2.40Tuesday 8 0.89 1.14 2.00 2.20 2.60Wednesday 7 0.72 0.91 1.90 2.00 2.00Thursday 12 1.28 1.66 3.30 3.60 3.80Friday 10 1.06 1.29 2.80 3.00 3.00Saturday 7 0.72 0.97 1.80 2.10 2.30Sunday 5 0.56 0.92 1.40 1.70 2.10
Hour of day 00:00 - 06:00 2 0.17 0.50 0.00 0.30 0.9006:01 - 09:00 8 0.83 1.20 2.30 2.60 2.8009:01 - 11:00 5 0.56 0.68 1.40 1.50 1.5011:01 - 13:00 5 0.56 0.68 1.00 1.20 1.6013:01 - 15:00 7 0.72 0.97 1.80 2.10 2.3015:01 - 18:00 12 1.33 2.14 2.00 2.90 4.7018:01 - 24:00 16 1.72 2.15 4.40 4.60 4.80
Note: 1. Crashes extracted from years 2000 and 2001 for Brevard, City of Orlando, Hillsborough, Miami-Dade, and Seminole, and years 1999 and 2000 for Orange County. 2. Crashes represent only long forms. 3. Standard Deviation, 85th, 90th, and 95th Percentiles represent crash statistics per year per intersection.
85th Percentile 90th Percentile 95th Percentile
Entire Category
CATEGORY 27EXPECTED ANNUAL CRASH VALUE TABLE - 6 COUNTIES
8 Lane x 2 Lane Intersection, SignalizedTotal Number of Intersections Included - 9
Total number of crashes per year
Mean crashes per intersection
per year
Standard Deviation

145
583 14.58 9.97 26.23 27.70 30.05Collision Type Rear End 273 6.83 5.19 12.23 13.55 14.65
Head On 6 0.15 0.28 0.50 0.50 0.52Angle 114 2.84 2.62 5.15 7.10 8.08Left Turn 100 2.49 2.62 5.58 6.50 7.03Right Turn 13 0.31 0.48 0.57 1.00 1.03Sideswipe 39 0.96 1.24 2.08 2.55 3.53Pedestrian/Bicycle 10 0.25 0.51 0.50 0.55 1.03Other 30 0.75 0.78 2.00 2.00 2.00
Severity PDO Crashes 344 8.59 7.31 16.80 19.15 21.58Possible Injury 130 3.24 2.32 6.08 6.50 8.00Non-Incapacitating Injury 86 2.15 2.27 3.58 4.65 7.05Incapacitating Injury 22 0.54 0.61 1.00 1.50 1.53Fatal Crashes 3 0.06 0.17 0.00 0.50 0.50
Light Conditions Daylight 365 9.13 6.20 16.15 17.05 18.53Dusk 19 0.46 0.58 1.50 1.50 1.50Dawn 8 0.19 0.39 0.50 1.00 1.00Dark (w/street lights) 154 3.85 3.65 7.58 8.50 9.67Dark (wo/street lights) 38 0.95 1.54 1.58 2.50 3.60
Surface Condition Dry 503 12.56 8.58 22.15 24.25 26.53Wet 73 1.83 1.50 3.50 3.55 4.53Slippery 3 0.08 0.21 0.00 0.50 0.50Others 5 0.11 0.42 0.00 0.50 0.50
Month of year January 45 1.11 1.05 2.00 2.55 3.03February 48 1.20 1.08 2.50 2.50 2.55March 56 1.40 1.28 2.58 3.00 3.53April 45 1.13 1.10 2.50 3.00 3.00May 54 1.34 1.35 3.00 3.10 4.00June 49 1.23 1.17 2.08 2.55 4.00July 43 1.08 1.04 2.50 2.55 3.00August 55 1.36 1.25 2.50 3.05 3.53September 49 1.23 1.24 2.50 3.00 3.53October 49 1.21 1.23 2.58 3.05 3.53November 42 1.05 0.99 2.08 2.55 3.00December 50 1.25 1.15 2.50 2.55 3.05
Day of week Monday 81 2.03 1.73 4.00 4.00 4.50Tuesday 86 2.15 1.69 3.58 4.55 5.50Wednesday 92 2.30 1.84 4.08 4.55 5.53Thursday 80 1.99 1.64 3.58 4.50 5.00Friday 86 2.14 1.94 4.50 5.00 6.00Saturday 82 2.05 1.76 4.08 5.00 5.50Sunday 77 1.93 1.62 3.58 4.00 4.55
Hour of day 00:00 - 06:00 61 1.53 1.60 3.50 4.00 4.5306:01 - 09:00 56 1.40 1.09 2.58 3.00 3.0309:01 - 11:00 47 1.18 1.03 2.00 2.05 3.0311:01 - 13:00 60 1.49 1.12 2.50 3.00 3.5513:01 - 15:00 62 1.54 1.31 3.00 3.05 4.0315:01 - 18:00 120 3.00 2.38 5.58 6.50 6.5818:01 - 24:00 178 4.45 3.47 8.50 9.00 10.08
Note: 1. Crashes extracted from years 2000 and 2001 for Brevard, City of Orlando, Hillsborough, Miami-Dade, and Seminole, and years 1999 and 2000 for Orange County. 2. Crashes represent only long forms. 3. Standard Deviation, 85th, 90th, and 95th Percentiles represent crash statistics per year per intersection.
85th Percentile 90th Percentile 95th Percentile
Entire Category
CATEGORY 28EXPECTED ANNUAL CRASH VALUE TABLE - 6 COUNTIES
6 Lane x 4 Lane Intersection, Signalized, AADT/lane for Major Road ≤ 9,000Total Number of Intersections Included - 40
Total number of crashes per year
Mean crashes per intersection
per year
Standard Deviation

146
583 20.09 12.39 33.70 37.60 40.70Collision Type Rear End 296 10.21 6.33 16.80 19.70 20.50
Head On 7 0.22 0.32 0.50 0.50 0.80Angle 98 3.38 3.07 6.80 7.70 9.40Left Turn 76 2.60 3.25 4.90 5.40 7.30Right Turn 12 0.40 0.59 0.90 1.10 1.80Sideswipe 49 1.67 1.57 3.00 3.20 4.30Pedestrian/Bicycle 6 0.21 0.31 0.50 0.50 0.80Other 41 1.40 1.31 2.40 2.60 3.60
Severity PDO Crashes 347 11.95 10.11 20.50 20.90 30.00Possible Injury 141 4.84 4.12 7.30 9.10 15.00Non-Incapacitating Injury 79 2.71 2.38 4.00 5.60 7.20Incapacitating Injury 16 0.55 0.56 1.00 1.00 1.00Fatal Crashes 1 0.03 0.13 0.00 0.00 0.30
Light Conditions Daylight 365 12.59 7.66 20.40 21.90 24.10Dusk 8 0.28 0.47 0.50 1.00 1.00Dawn 8 0.26 0.54 0.50 0.50 1.10Dark (w/street lights) 170 5.86 4.48 10.30 11.30 14.60Dark (wo/street lights) 32 1.10 2.39 1.80 3.80 7.00
Surface Condition Dry 482 16.62 10.27 29.40 32.70 33.50Wet 85 2.91 2.07 5.00 5.50 6.40Slippery 1 0.03 0.13 0.00 0.00 0.30Others 15 0.52 0.98 0.50 1.30 2.80
Month of year January 44 1.50 1.13 2.50 2.70 3.50February 47 1.62 1.27 2.90 3.60 4.30March 54 1.84 1.20 3.00 3.60 4.00April 40 1.36 1.13 2.50 2.60 3.00May 44 1.50 1.25 2.50 3.10 3.80June 42 1.43 1.24 2.50 3.10 3.50July 50 1.72 1.51 3.00 3.60 4.30August 57 1.97 1.48 3.50 3.60 4.30September 46 1.59 1.49 2.90 3.70 4.80October 55 1.88 1.66 3.40 3.60 4.30November 55 1.88 1.44 3.00 3.60 4.60December 52 1.79 1.60 3.40 3.70 4.80
Day of week Monday 78 2.69 1.70 4.50 5.00 5.60Tuesday 89 3.05 2.11 5.00 5.60 6.30Wednesday 89 3.07 2.06 4.90 5.70 6.80Thursday 68 2.33 2.10 4.90 5.60 6.00Friday 107 3.69 2.69 7.00 7.50 8.10Saturday 91 3.12 2.21 5.00 5.60 6.00Sunday 62 2.14 1.70 3.50 4.60 5.00
Hour of day 00:00 - 06:00 78 2.69 2.17 5.00 5.50 6.4006:01 - 09:00 64 2.19 1.56 3.50 4.00 4.3009:01 - 11:00 41 1.40 1.12 2.80 3.10 3.5011:01 - 13:00 54 1.86 1.43 3.50 4.00 4.0013:01 - 15:00 70 2.40 1.73 4.40 4.60 5.3015:01 - 18:00 116 3.98 2.66 7.20 8.00 8.3018:01 - 24:00 162 5.57 4.14 9.40 11.70 12.50
Note: 1. Crashes extracted from years 2000 and 2001 for Brevard, City of Orlando, Hillsborough, Miami-Dade, and Seminole, and years 1999 and 2000 for Orange County. 2. Crashes represent only long forms. 3. Standard Deviation, 85th, 90th, and 95th Percentiles represent crash statistics per year per intersection.
85th Percentile 90th Percentile 95th Percentile
Entire Category
CATEGORY 29EXPECTED ANNUAL CRASH VALUE TABLE - 6 COUNTIES
6 Lane x 4 Lane Intersection, Signalized, AADT/lane for Major Road > 9,000Total Number of Intersections Included - 29
Total number of crashes per year
Mean crashes per intersection
per year
Standard Deviation
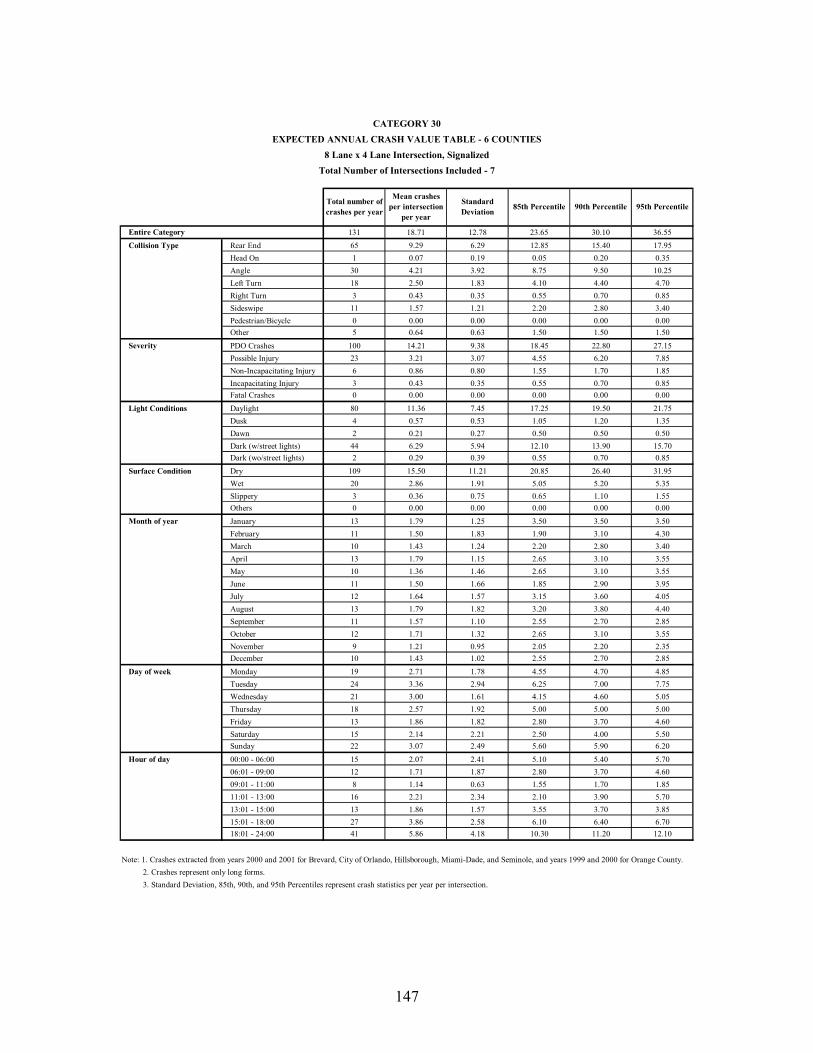
147
131 18.71 12.78 23.65 30.10 36.55Collision Type Rear End 65 9.29 6.29 12.85 15.40 17.95
Head On 1 0.07 0.19 0.05 0.20 0.35Angle 30 4.21 3.92 8.75 9.50 10.25Left Turn 18 2.50 1.83 4.10 4.40 4.70Right Turn 3 0.43 0.35 0.55 0.70 0.85Sideswipe 11 1.57 1.21 2.20 2.80 3.40Pedestrian/Bicycle 0 0.00 0.00 0.00 0.00 0.00Other 5 0.64 0.63 1.50 1.50 1.50
Severity PDO Crashes 100 14.21 9.38 18.45 22.80 27.15Possible Injury 23 3.21 3.07 4.55 6.20 7.85Non-Incapacitating Injury 6 0.86 0.80 1.55 1.70 1.85Incapacitating Injury 3 0.43 0.35 0.55 0.70 0.85Fatal Crashes 0 0.00 0.00 0.00 0.00 0.00
Light Conditions Daylight 80 11.36 7.45 17.25 19.50 21.75Dusk 4 0.57 0.53 1.05 1.20 1.35Dawn 2 0.21 0.27 0.50 0.50 0.50Dark (w/street lights) 44 6.29 5.94 12.10 13.90 15.70Dark (wo/street lights) 2 0.29 0.39 0.55 0.70 0.85
Surface Condition Dry 109 15.50 11.21 20.85 26.40 31.95Wet 20 2.86 1.91 5.05 5.20 5.35Slippery 3 0.36 0.75 0.65 1.10 1.55Others 0 0.00 0.00 0.00 0.00 0.00
Month of year January 13 1.79 1.25 3.50 3.50 3.50February 11 1.50 1.83 1.90 3.10 4.30March 10 1.43 1.24 2.20 2.80 3.40April 13 1.79 1.15 2.65 3.10 3.55May 10 1.36 1.46 2.65 3.10 3.55June 11 1.50 1.66 1.85 2.90 3.95July 12 1.64 1.57 3.15 3.60 4.05August 13 1.79 1.82 3.20 3.80 4.40September 11 1.57 1.10 2.55 2.70 2.85October 12 1.71 1.32 2.65 3.10 3.55November 9 1.21 0.95 2.05 2.20 2.35December 10 1.43 1.02 2.55 2.70 2.85
Day of week Monday 19 2.71 1.78 4.55 4.70 4.85Tuesday 24 3.36 2.94 6.25 7.00 7.75Wednesday 21 3.00 1.61 4.15 4.60 5.05Thursday 18 2.57 1.92 5.00 5.00 5.00Friday 13 1.86 1.82 2.80 3.70 4.60Saturday 15 2.14 2.21 2.50 4.00 5.50Sunday 22 3.07 2.49 5.60 5.90 6.20
Hour of day 00:00 - 06:00 15 2.07 2.41 5.10 5.40 5.7006:01 - 09:00 12 1.71 1.87 2.80 3.70 4.6009:01 - 11:00 8 1.14 0.63 1.55 1.70 1.8511:01 - 13:00 16 2.21 2.34 2.10 3.90 5.7013:01 - 15:00 13 1.86 1.57 3.55 3.70 3.8515:01 - 18:00 27 3.86 2.58 6.10 6.40 6.7018:01 - 24:00 41 5.86 4.18 10.30 11.20 12.10
Note: 1. Crashes extracted from years 2000 and 2001 for Brevard, City of Orlando, Hillsborough, Miami-Dade, and Seminole, and years 1999 and 2000 for Orange County. 2. Crashes represent only long forms. 3. Standard Deviation, 85th, 90th, and 95th Percentiles represent crash statistics per year per intersection.
85th Percentile 90th Percentile 95th Percentile
Entire Category
CATEGORY 30EXPECTED ANNUAL CRASH VALUE TABLE - 6 COUNTIES
8 Lane x 4 Lane Intersection, SignalizedTotal Number of Intersections Included - 7
Total number of crashes per year
Mean crashes per intersection
per year
Standard Deviation
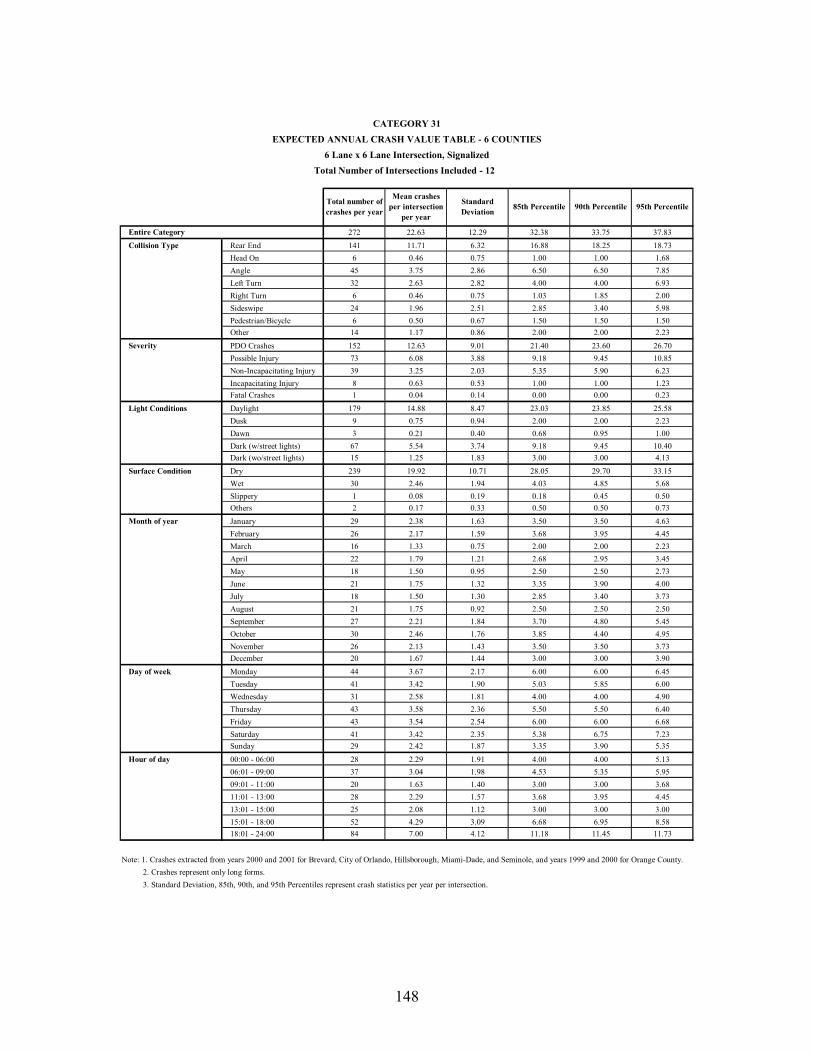
148
272 22.63 12.29 32.38 33.75 37.83Collision Type Rear End 141 11.71 6.32 16.88 18.25 18.73
Head On 6 0.46 0.75 1.00 1.00 1.68Angle 45 3.75 2.86 6.50 6.50 7.85Left Turn 32 2.63 2.82 4.00 4.00 6.93Right Turn 6 0.46 0.75 1.03 1.85 2.00Sideswipe 24 1.96 2.51 2.85 3.40 5.98Pedestrian/Bicycle 6 0.50 0.67 1.50 1.50 1.50Other 14 1.17 0.86 2.00 2.00 2.23
Severity PDO Crashes 152 12.63 9.01 21.40 23.60 26.70Possible Injury 73 6.08 3.88 9.18 9.45 10.85Non-Incapacitating Injury 39 3.25 2.03 5.35 5.90 6.23Incapacitating Injury 8 0.63 0.53 1.00 1.00 1.23Fatal Crashes 1 0.04 0.14 0.00 0.00 0.23
Light Conditions Daylight 179 14.88 8.47 23.03 23.85 25.58Dusk 9 0.75 0.94 2.00 2.00 2.23Dawn 3 0.21 0.40 0.68 0.95 1.00Dark (w/street lights) 67 5.54 3.74 9.18 9.45 10.40Dark (wo/street lights) 15 1.25 1.83 3.00 3.00 4.13
Surface Condition Dry 239 19.92 10.71 28.05 29.70 33.15Wet 30 2.46 1.94 4.03 4.85 5.68Slippery 1 0.08 0.19 0.18 0.45 0.50Others 2 0.17 0.33 0.50 0.50 0.73
Month of year January 29 2.38 1.63 3.50 3.50 4.63February 26 2.17 1.59 3.68 3.95 4.45March 16 1.33 0.75 2.00 2.00 2.23April 22 1.79 1.21 2.68 2.95 3.45May 18 1.50 0.95 2.50 2.50 2.73June 21 1.75 1.32 3.35 3.90 4.00July 18 1.50 1.30 2.85 3.40 3.73August 21 1.75 0.92 2.50 2.50 2.50September 27 2.21 1.84 3.70 4.80 5.45October 30 2.46 1.76 3.85 4.40 4.95November 26 2.13 1.43 3.50 3.50 3.73December 20 1.67 1.44 3.00 3.00 3.90
Day of week Monday 44 3.67 2.17 6.00 6.00 6.45Tuesday 41 3.42 1.90 5.03 5.85 6.00Wednesday 31 2.58 1.81 4.00 4.00 4.90Thursday 43 3.58 2.36 5.50 5.50 6.40Friday 43 3.54 2.54 6.00 6.00 6.68Saturday 41 3.42 2.35 5.38 6.75 7.23Sunday 29 2.42 1.87 3.35 3.90 5.35
Hour of day 00:00 - 06:00 28 2.29 1.91 4.00 4.00 5.1306:01 - 09:00 37 3.04 1.98 4.53 5.35 5.9509:01 - 11:00 20 1.63 1.40 3.00 3.00 3.6811:01 - 13:00 28 2.29 1.57 3.68 3.95 4.4513:01 - 15:00 25 2.08 1.12 3.00 3.00 3.0015:01 - 18:00 52 4.29 3.09 6.68 6.95 8.5818:01 - 24:00 84 7.00 4.12 11.18 11.45 11.73
Note: 1. Crashes extracted from years 2000 and 2001 for Brevard, City of Orlando, Hillsborough, Miami-Dade, and Seminole, and years 1999 and 2000 for Orange County. 2. Crashes represent only long forms. 3. Standard Deviation, 85th, 90th, and 95th Percentiles represent crash statistics per year per intersection.
85th Percentile 90th Percentile 95th Percentile
Entire Category
CATEGORY 31EXPECTED ANNUAL CRASH VALUE TABLE - 6 COUNTIES
6 Lane x 6 Lane Intersection, SignalizedTotal Number of Intersections Included - 12
Total number of crashes per year
Mean crashes per intersection
per year
Standard Deviation

149
30 1.25 1.34 1.78 3.05 4.35Collision Type Rear End 13 0.54 0.74 1.28 1.50 1.50
Head On 1 0.02 0.10 0.00 0.00 0.00Angle 3 0.13 0.27 0.50 0.50 0.50Left Turn 7 0.27 0.36 0.50 0.85 1.00Right Turn 0 0.00 0.00 0.00 0.00 0.00Sideswipe 2 0.06 0.22 0.00 0.00 0.42Pedestrian/Bicycle 0 0.00 0.00 0.00 0.00 0.00Other 6 0.23 0.25 0.50 0.50 0.50
Severity PDO Crashes 18 0.73 0.66 1.50 1.50 1.93Possible Injury 7 0.27 0.44 0.50 0.50 1.35Non-Incapacitating Injury 5 0.21 0.46 0.50 0.50 0.92Incapacitating Injury 1 0.04 0.14 0.00 0.00 0.42Fatal Crashes 0 0.00 0.00 0.00 0.00 0.00
Light Conditions Daylight 14 0.58 0.80 1.00 1.00 1.85Dusk 3 0.10 0.25 0.28 0.50 0.50Dawn 0 0.00 0.00 0.00 0.00 0.00Dark (w/street lights) 8 0.33 0.55 0.50 0.50 0.92Dark (wo/street lights) 6 0.23 0.36 0.50 0.85 1.00
Surface Condition Dry 24 1.00 1.04 1.50 2.20 3.35Wet 6 0.23 0.36 0.50 0.85 1.00Slippery 1 0.02 0.10 0.00 0.00 0.00Others 0 0.00 0.00 0.00 0.00 0.00
Month of year January 4 0.17 0.24 0.50 0.50 0.50February 2 0.08 0.19 0.28 0.50 0.50March 3 0.13 0.34 0.28 0.50 0.50April 2 0.08 0.24 0.00 0.35 0.50May 3 0.13 0.27 0.50 0.50 0.50June 1 0.04 0.14 0.00 0.00 0.42July 3 0.10 0.21 0.50 0.50 0.50August 4 0.15 0.35 0.50 0.50 0.50September 2 0.08 0.24 0.00 0.35 0.50October 2 0.06 0.17 0.00 0.35 0.50November 1 0.04 0.14 0.00 0.00 0.42December 5 0.19 0.29 0.50 0.50 0.50
Day of week Monday 2 0.08 0.19 0.28 0.50 0.50Tuesday 6 0.23 0.39 0.50 0.50 0.92Wednesday 5 0.19 0.32 0.50 0.50 0.92Thursday 5 0.21 0.36 0.50 0.85 1.00Friday 5 0.19 0.46 0.50 0.50 0.92Saturday 4 0.15 0.23 0.50 0.50 0.50Sunday 5 0.21 0.36 0.50 0.85 1.00
Hour of day 00:00 - 06:00 3 0.10 0.25 0.28 0.50 0.5006:01 - 09:00 6 0.23 0.55 0.50 0.50 0.9209:01 - 11:00 2 0.06 0.17 0.00 0.35 0.5011:01 - 13:00 2 0.06 0.17 0.00 0.35 0.5013:01 - 15:00 3 0.10 0.21 0.50 0.50 0.5015:01 - 18:00 5 0.19 0.29 0.50 0.50 0.5018:01 - 24:00 12 0.50 0.55 1.00 1.35 1.50
Note: 1. Crashes extracted from years 2000 and 2001 for Brevard, City of Orlando, Hillsborough, Miami-Dade, and Seminole, and years 1999 and 2000 for Orange County. 2. Crashes represent only long forms. 3. Standard Deviation, 85th, 90th, and 95th Percentiles represent crash statistics per year per intersection.
85th Percentile 90th Percentile 95th Percentile
Entire Category
CATEGORY 32EXPECTED ANNUAL CRASH VALUE TABLE - 6 COUNTIES
2 Lane x T2 Lane Intersection, Signalized, AADT/lane for Major Road ≤ 8,000
Total Number of Intersections Included - 24
Total number of crashes per year
Mean crashes per intersection
per year
Standard Deviation

150
29 1.50 1.83 3.00 3.10 3.90Collision Type Rear End 14 0.71 0.93 1.30 2.00 2.15
Head On 1 0.03 0.11 0.00 0.00 0.05Angle 3 0.13 0.33 0.15 0.60 1.00Left Turn 5 0.26 0.59 0.50 0.50 0.70Right Turn 1 0.03 0.11 0.00 0.00 0.05Sideswipe 2 0.08 0.25 0.00 0.10 0.55Pedestrian/Bicycle 0 0.00 0.00 0.00 0.00 0.00Other 5 0.26 0.42 0.50 0.60 1.05
Severity PDO Crashes 15 0.76 1.36 1.15 1.50 1.95Possible Injury 8 0.39 0.43 0.65 1.00 1.05Non-Incapacitating Injury 6 0.29 0.54 0.65 1.00 1.10Incapacitating Injury 1 0.05 0.16 0.00 0.10 0.50Fatal Crashes 0 0.00 0.00 0.00 0.00 0.00
Light Conditions Daylight 20 1.03 1.44 2.00 2.10 2.85Dusk 2 0.11 0.27 0.15 0.50 0.55Dawn 0 0.00 0.00 0.00 0.00 0.00Dark (w/street lights) 4 0.18 0.30 0.50 0.50 0.55Dark (wo/street lights) 4 0.18 0.30 0.50 0.50 0.55
Surface Condition Dry 24 1.24 1.67 2.15 2.60 3.40Wet 3 0.13 0.23 0.50 0.50 0.50Slippery 3 0.13 0.37 0.15 0.50 0.60Others 0 0.00 0.00 0.00 0.00 0.00
Month of year January 5 0.26 0.39 0.50 0.50 0.60February 3 0.16 0.37 0.50 0.50 0.60March 2 0.11 0.27 0.15 0.50 0.55April 1 0.05 0.16 0.00 0.10 0.50May 3 0.13 0.23 0.50 0.50 0.50June 2 0.08 0.25 0.00 0.10 0.55July 1 0.05 0.16 0.00 0.10 0.50August 2 0.08 0.25 0.00 0.10 0.55September 3 0.13 0.23 0.50 0.50 0.50October 1 0.03 0.11 0.00 0.00 0.05November 5 0.24 0.51 0.65 1.10 1.50December 4 0.18 0.38 0.65 1.00 1.00
Day of week Monday 6 0.29 0.51 0.50 0.60 1.10Tuesday 5 0.24 0.39 0.65 1.00 1.00Wednesday 5 0.26 0.45 0.65 1.00 1.05Thursday 5 0.24 0.42 0.50 0.60 1.05Friday 5 0.26 0.39 0.65 1.00 1.00Saturday 2 0.11 0.21 0.50 0.50 0.50Sunday 2 0.11 0.21 0.50 0.50 0.50
Hour of day 00:00 - 06:00 1 0.05 0.16 0.00 0.10 0.5006:01 - 09:00 3 0.16 0.29 0.50 0.50 0.5509:01 - 11:00 4 0.18 0.34 0.50 0.60 1.0011:01 - 13:00 2 0.08 0.34 0.00 0.00 0.1513:01 - 15:00 4 0.18 0.34 0.50 0.60 1.0015:01 - 18:00 9 0.47 0.86 1.00 1.10 1.7018:01 - 24:00 7 0.37 0.50 1.00 1.00 1.05
Note: 1. Crashes extracted from years 2000 and 2001 for Brevard, City of Orlando, Hillsborough, Miami-Dade, and Seminole, and years 1999 and 2000 for Orange County. 2. Crashes represent only long forms. 3. Standard Deviation, 85th, 90th, and 95th Percentiles represent crash statistics per year per intersection.
85th Percentile 90th Percentile 95th Percentile
Entire Category
CATEGORY 33EXPECTED ANNUAL CRASH VALUE TABLE - 6 COUNTIES
2 Lane x T2 lane Intersection, Signalized, AADT/lane for Major Road > 8,000Total Number of Intersections Included - 19
Total number of crashes per year
Mean crashes per intersection
per year
Standard Deviation

151
86 2.05 2.19 4.00 4.50 6.48Collision Type Rear End 38 0.89 1.13 2.00 2.00 2.48
Head On 2 0.04 0.13 0.00 0.00 0.47Angle 19 0.45 0.73 1.00 1.00 2.00Left Turn 17 0.40 0.63 1.00 1.00 1.50Right Turn 3 0.06 0.25 0.00 0.00 0.47Sideswipe 3 0.06 0.16 0.00 0.45 0.50Pedestrian/Bicycle 2 0.04 0.13 0.00 0.00 0.47Other 5 0.11 0.24 0.50 0.50 0.50
Severity PDO Crashes 40 0.94 1.45 1.50 2.00 2.98Possible Injury 23 0.54 0.65 1.00 1.50 1.98Non-Incapacitating Injury 19 0.44 0.53 1.00 1.00 1.50Incapacitating Injury 6 0.13 0.27 0.50 0.50 0.50Fatal Crashes 0 0.00 0.00 0.00 0.00 0.00
Light Conditions Daylight 58 1.38 1.65 3.35 3.50 4.45Dusk 2 0.05 0.15 0.00 0.00 0.50Dawn 1 0.02 0.11 0.00 0.00 0.00Dark (w/street lights) 18 0.43 0.64 1.00 1.00 1.00Dark (wo/street lights) 7 0.17 0.34 0.50 0.50 0.97
Surface Condition Dry 73 1.74 1.87 3.50 3.50 5.45Wet 13 0.30 0.51 0.93 1.00 1.48Slippery 1 0.01 0.08 0.00 0.00 0.00Others 0 0.00 0.00 0.00 0.00 0.00
Month of year January 11 0.25 0.45 0.50 1.00 1.00February 8 0.19 0.33 0.50 0.50 1.00March 8 0.19 0.37 0.50 0.50 1.00April 6 0.13 0.27 0.50 0.50 0.50May 5 0.12 0.27 0.50 0.50 0.50June 11 0.25 0.47 0.50 0.50 1.48July 4 0.08 0.22 0.00 0.50 0.50August 6 0.14 0.28 0.50 0.50 0.50September 9 0.20 0.33 0.50 0.50 1.00October 5 0.12 0.27 0.50 0.50 0.50November 11 0.25 0.50 0.50 0.50 1.00December 5 0.12 0.24 0.50 0.50 0.50
Day of week Monday 16 0.38 0.56 1.00 1.45 1.50Tuesday 13 0.30 0.44 0.93 1.00 1.00Wednesday 13 0.31 0.65 0.50 1.00 1.48Thursday 13 0.31 0.49 0.50 1.00 1.48Friday 13 0.30 0.43 0.50 1.00 1.00Saturday 9 0.21 0.40 0.50 0.50 1.00Sunday 10 0.24 0.51 0.50 0.50 0.50
Hour of day 00:00 - 06:00 5 0.11 0.30 0.00 0.50 0.5006:01 - 09:00 11 0.25 0.42 0.50 0.95 1.0009:01 - 11:00 6 0.14 0.28 0.50 0.50 0.5011:01 - 13:00 8 0.18 0.33 0.50 0.50 1.0013:01 - 15:00 12 0.27 0.54 0.93 1.00 1.4815:01 - 18:00 22 0.52 0.68 1.00 1.50 1.9818:01 - 24:00 24 0.57 0.84 1.00 1.90 2.00
Note: 1. Crashes extracted from years 2000 and 2001 for Brevard, City of Orlando, Hillsborough, Miami-Dade, and Seminole, and years 1999 and 2000 for Orange County. 2. Crashes represent only long forms. 3. Standard Deviation, 85th, 90th, and 95th Percentiles represent crash statistics per year per intersection.
85th Percentile 90th Percentile 95th Percentile
Entire Category
CATEGORY 34EXPECTED ANNUAL CRASH VALUE TABLE - 6 COUNTIES
4 Lane x T2 Lane Intersection, Signalized, AADT/lane for Major Road ≤ 7,000
Total Number of Intersections Included - 42
Total number of crashes per year
Mean crashes per intersection
per year
Standard Deviation

152
223 3.65 3.52 6.50 9.00 10.00Collision Type Rear End 103 1.69 1.92 3.00 3.50 4.50
Head On 1 0.02 0.09 0.00 0.00 0.00Angle 33 0.54 0.84 1.00 1.50 2.50Left Turn 38 0.62 0.78 1.50 1.50 2.00Right Turn 3 0.04 0.14 0.00 0.00 0.50Sideswipe 20 0.33 0.61 1.00 1.00 1.50Pedestrian/Bicycle 4 0.06 0.16 0.00 0.50 0.50Other 22 0.35 0.60 1.00 1.00 1.50
Severity PDO Crashes 126 2.07 2.48 4.00 5.00 8.00Possible Injury 50 0.82 0.97 2.00 2.00 3.00Non-Incapacitating Injury 37 0.60 0.83 1.50 2.00 2.50Incapacitating Injury 9 0.15 0.29 0.50 0.50 0.50Fatal Crashes 1 0.02 0.09 0.00 0.00 0.00
Light Conditions Daylight 148 2.42 2.33 5.00 5.00 6.00Dusk 8 0.12 0.27 0.50 0.50 0.50Dawn 3 0.04 0.14 0.00 0.00 0.50Dark (w/street lights) 52 0.84 1.40 1.50 2.50 3.50Dark (wo/street lights) 14 0.22 0.44 0.50 1.00 1.00
Surface Condition Dry 183 3.00 2.75 6.00 7.00 8.50Wet 36 0.59 1.05 1.50 1.50 2.00Slippery 3 0.04 0.17 0.00 0.00 0.50Others 1 0.02 0.09 0.00 0.00 0.00
Month of year January 19 0.30 0.46 0.50 1.00 1.00February 16 0.25 0.43 0.50 1.00 1.00March 16 0.25 0.38 0.50 1.00 1.00April 17 0.27 0.44 0.50 1.00 1.50May 21 0.34 0.49 1.00 1.00 1.00June 15 0.25 0.41 0.50 0.50 1.00July 19 0.31 0.50 0.50 1.00 1.50August 22 0.36 0.60 1.00 1.00 1.50September 22 0.35 0.51 1.00 1.00 1.50October 21 0.34 0.44 1.00 1.00 1.00November 21 0.34 0.51 1.00 1.00 1.00December 17 0.27 0.43 1.00 1.00 1.00
Day of week Monday 26 0.43 0.64 1.00 1.00 2.00Tuesday 33 0.53 0.64 1.00 1.50 2.00Wednesday 30 0.49 0.67 1.00 1.50 1.50Thursday 38 0.61 0.88 1.50 2.00 2.50Friday 36 0.59 0.69 1.50 1.50 2.00Saturday 32 0.52 0.67 1.50 1.50 1.50Sunday 29 0.48 0.78 1.00 1.00 1.50
Hour of day 00:00 - 06:00 21 0.34 0.77 0.50 1.00 1.5006:01 - 09:00 21 0.34 0.54 0.50 1.00 1.5009:01 - 11:00 17 0.27 0.43 0.50 1.00 1.0011:01 - 13:00 17 0.27 0.42 0.50 1.00 1.0013:01 - 15:00 29 0.47 0.66 1.00 1.50 2.0015:01 - 18:00 55 0.90 0.94 2.00 2.00 2.5018:01 - 24:00 64 1.05 1.24 2.00 3.00 3.50
Note: 1. Crashes extracted from years 2000 and 2001 for Brevard, City of Orlando, Hillsborough, Miami-Dade, and Seminole, and years 1999 and 2000 for Orange County. 2. Crashes represent only long forms. 3. Standard Deviation, 85th, 90th, and 95th Percentiles represent crash statistics per year per intersection.
85th Percentile 90th Percentile 95th Percentile
Entire Category
CATEGORY 35EXPECTED ANNUAL CRASH VALUE TABLE - 6 COUNTIES
4 Lane x T2 Lane Intersection, Signalized, AADT/lane for Major Road > 7,000Total Number of Intersections Included - 61
Total number of crashes per year
Mean crashes per intersection
per year
Standard Deviation

153
154 5.90 7.53 13.13 15.50 20.13Collision Type Rear End 74 2.85 3.37 7.25 8.00 9.88
Head On 1 0.04 0.14 0.00 0.00 0.38Angle 36 1.37 2.91 1.63 2.00 4.63Left Turn 15 0.58 0.92 1.00 1.75 2.88Right Turn 2 0.06 0.22 0.00 0.00 0.38Sideswipe 14 0.54 1.13 0.75 1.75 3.50Pedestrian/Bicycle 2 0.08 0.18 0.13 0.50 0.50Other 11 0.40 0.63 1.00 1.25 1.50
Severity PDO Crashes 95 3.63 5.78 6.75 10.00 15.88Possible Injury 40 1.52 1.58 3.00 3.25 5.00Non-Incapacitating Injury 16 0.60 1.03 1.13 1.50 2.25Incapacitating Injury 4 0.15 0.27 0.50 0.50 0.50Fatal Crashes 0 0.00 0.00 0.00 0.00 0.00
Light Conditions Daylight 98 3.77 5.48 7.75 10.50 13.63Dusk 7 0.27 0.47 0.50 0.75 1.00Dawn 2 0.06 0.22 0.00 0.00 0.38Dark (w/street lights) 41 1.56 1.84 3.25 4.50 5.00Dark (wo/street lights) 7 0.25 0.59 0.50 0.75 1.38
Surface Condition Dry 132 5.06 6.47 11.50 14.00 17.25Wet 18 0.69 1.05 1.13 1.50 1.88Slippery 1 0.02 0.10 0.00 0.00 0.00Others 4 0.13 0.39 0.00 0.50 1.00
Month of year January 14 0.52 0.73 1.50 1.50 1.88February 14 0.52 0.87 1.13 1.75 2.00March 13 0.48 0.67 1.00 1.25 1.88April 11 0.42 0.73 1.00 1.25 2.25May 13 0.50 0.73 1.00 1.25 1.88June 14 0.52 0.83 0.63 1.25 2.25July 10 0.38 0.50 1.00 1.00 1.38August 18 0.67 1.05 1.63 2.00 2.75September 11 0.42 0.70 1.00 1.00 1.38October 14 0.54 0.93 1.25 2.00 2.38November 9 0.35 0.58 0.63 1.00 1.75December 15 0.58 0.86 1.50 1.75 2.38
Day of week Monday 19 0.71 1.06 1.13 1.75 2.00Tuesday 19 0.73 1.46 1.50 1.75 2.38Wednesday 31 1.19 1.68 1.88 3.50 4.38Thursday 23 0.87 0.98 1.63 2.25 2.50Friday 20 0.75 1.01 1.63 2.50 3.00Saturday 21 0.81 1.23 2.13 2.75 3.38Sunday 22 0.85 1.03 2.00 2.25 2.88
Hour of day 00:00 - 06:00 16 0.60 0.75 1.00 1.25 1.5006:01 - 09:00 12 0.46 0.90 0.75 1.75 2.3809:01 - 11:00 15 0.58 1.03 1.00 1.50 2.3811:01 - 13:00 15 0.56 0.88 1.13 1.50 2.2513:01 - 15:00 17 0.65 0.90 1.13 1.50 2.6315:01 - 18:00 34 1.29 1.48 3.13 3.50 3.5018:01 - 24:00 46 1.77 2.41 3.75 4.75 7.25
Note: 1. Crashes extracted from years 2000 and 2001 for Brevard, City of Orlando, Hillsborough, Miami-Dade, and Seminole, and years 1999 and 2000 for Orange County. 2. Crashes represent only long forms. 3. Standard Deviation, 85th, 90th, and 95th Percentiles represent crash statistics per year per intersection.
85th Percentile 90th Percentile 95th Percentile
Entire Category
CATEGORY 36EXPECTED ANNUAL CRASH VALUE TABLE - 6 COUNTIES
4 Lane x T4 Lane Intersection, SignalizedTotal Number of Intersections Included - 26
Total number of crashes per year
Mean crashes per intersection
per year
Standard Deviation
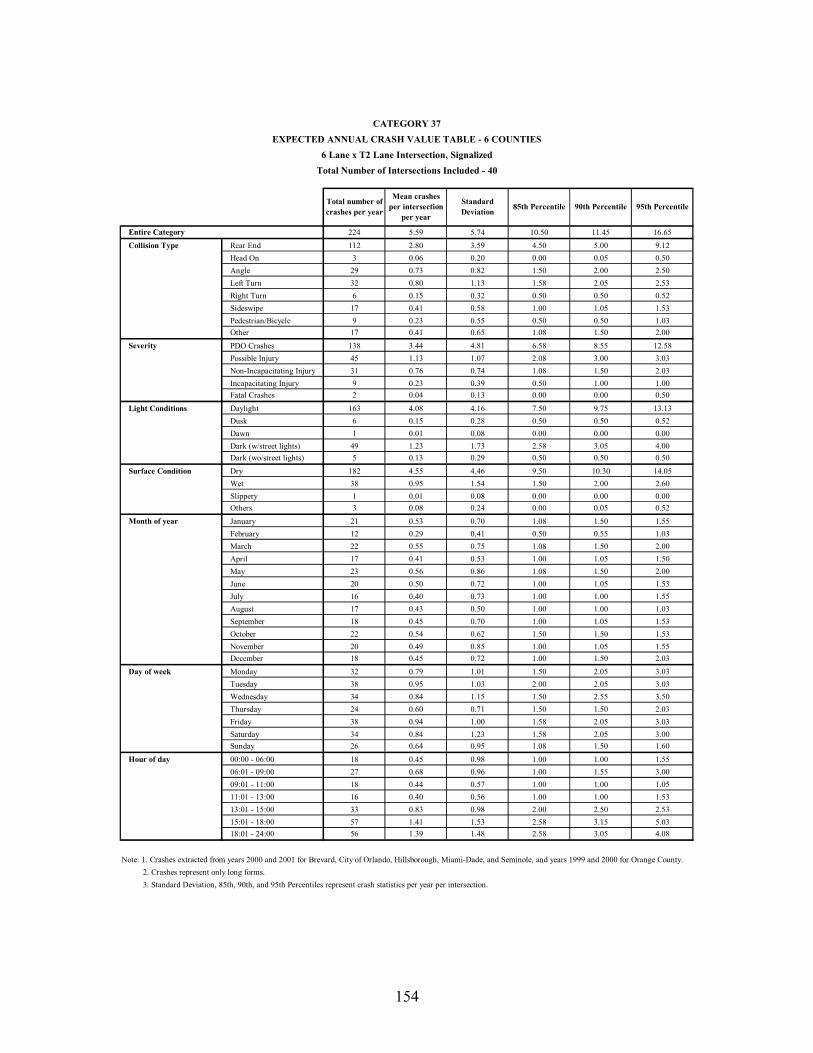
154
224 5.59 5.74 10.50 11.45 16.65Collision Type Rear End 112 2.80 3.59 4.50 5.00 9.12
Head On 3 0.06 0.20 0.00 0.05 0.50Angle 29 0.73 0.82 1.50 2.00 2.50Left Turn 32 0.80 1.13 1.58 2.05 2.53Right Turn 6 0.15 0.32 0.50 0.50 0.52Sideswipe 17 0.41 0.58 1.00 1.05 1.53Pedestrian/Bicycle 9 0.23 0.55 0.50 0.50 1.03Other 17 0.41 0.65 1.08 1.50 2.00
Severity PDO Crashes 138 3.44 4.81 6.58 8.55 12.58Possible Injury 45 1.13 1.07 2.08 3.00 3.03Non-Incapacitating Injury 31 0.76 0.74 1.08 1.50 2.03Incapacitating Injury 9 0.23 0.39 0.50 1.00 1.00Fatal Crashes 2 0.04 0.13 0.00 0.00 0.50
Light Conditions Daylight 163 4.08 4.16 7.50 9.75 13.13Dusk 6 0.15 0.28 0.50 0.50 0.52Dawn 1 0.01 0.08 0.00 0.00 0.00Dark (w/street lights) 49 1.23 1.73 2.58 3.05 4.00Dark (wo/street lights) 5 0.13 0.29 0.50 0.50 0.50
Surface Condition Dry 182 4.55 4.46 9.50 10.30 14.05Wet 38 0.95 1.54 1.50 2.00 2.60Slippery 1 0.01 0.08 0.00 0.00 0.00Others 3 0.08 0.24 0.00 0.05 0.52
Month of year January 21 0.53 0.70 1.08 1.50 1.55February 12 0.29 0.41 0.50 0.55 1.03March 22 0.55 0.75 1.08 1.50 2.00April 17 0.41 0.53 1.00 1.05 1.50May 23 0.56 0.86 1.08 1.50 2.00June 20 0.50 0.72 1.00 1.05 1.53July 16 0.40 0.73 1.00 1.00 1.55August 17 0.43 0.50 1.00 1.00 1.03September 18 0.45 0.70 1.00 1.05 1.53October 22 0.54 0.62 1.50 1.50 1.53November 20 0.49 0.85 1.00 1.05 1.55December 18 0.45 0.72 1.00 1.50 2.03
Day of week Monday 32 0.79 1.01 1.50 2.05 3.03Tuesday 38 0.95 1.03 2.00 2.05 3.03Wednesday 34 0.84 1.15 1.50 2.55 3.50Thursday 24 0.60 0.71 1.50 1.50 2.03Friday 38 0.94 1.00 1.58 2.05 3.03Saturday 34 0.84 1.23 1.58 2.05 3.00Sunday 26 0.64 0.95 1.08 1.50 1.60
Hour of day 00:00 - 06:00 18 0.45 0.98 1.00 1.00 1.5506:01 - 09:00 27 0.68 0.96 1.00 1.55 3.0009:01 - 11:00 18 0.44 0.57 1.00 1.00 1.0511:01 - 13:00 16 0.40 0.56 1.00 1.00 1.5313:01 - 15:00 33 0.83 0.98 2.00 2.50 2.5315:01 - 18:00 57 1.41 1.53 2.58 3.15 5.0318:01 - 24:00 56 1.39 1.48 2.58 3.05 4.08
Note: 1. Crashes extracted from years 2000 and 2001 for Brevard, City of Orlando, Hillsborough, Miami-Dade, and Seminole, and years 1999 and 2000 for Orange County. 2. Crashes represent only long forms. 3. Standard Deviation, 85th, 90th, and 95th Percentiles represent crash statistics per year per intersection.
85th Percentile 90th Percentile 95th Percentile
Entire Category
CATEGORY 37EXPECTED ANNUAL CRASH VALUE TABLE - 6 COUNTIES
6 Lane x T2 Lane Intersection, SignalizedTotal Number of Intersections Included - 40
Total number of crashes per year
Mean crashes per intersection
per year
Standard Deviation

155
50 5.56 5.82 6.90 9.50 14.50Collision Type Rear End 26 2.89 3.76 4.60 6.40 9.20
Head On 0 0.00 0.00 0.00 0.00 0.00Angle 8 0.83 0.87 1.50 1.70 2.10Left Turn 6 0.67 0.61 1.40 1.50 1.50Right Turn 0 0.00 0.00 0.00 0.00 0.00Sideswipe 6 0.61 0.42 1.00 1.00 1.00Pedestrian/Bicycle 0 0.00 0.00 0.00 0.00 0.00Other 5 0.56 0.77 0.50 0.90 1.70
Severity PDO Crashes 32 3.56 4.30 4.20 6.50 10.50Possible Injury 11 1.22 1.15 2.50 2.50 2.50Non-Incapacitating Injury 6 0.67 0.87 1.40 1.70 2.10Incapacitating Injury 1 0.11 0.33 0.00 0.20 0.60Fatal Crashes 0 0.00 0.00 0.00 0.00 0.00
Light Conditions Daylight 31 3.44 2.96 5.70 6.70 8.10Dusk 2 0.17 0.35 0.40 0.60 0.80Dawn 1 0.06 0.17 0.00 0.10 0.30Dark (w/street lights) 17 1.89 2.80 2.40 3.80 6.40Dark (wo/street lights) 0 0.00 0.00 0.00 0.00 0.00
Surface Condition Dry 41 4.56 4.52 6.70 8.60 11.80Wet 9 1.00 1.54 2.20 2.90 3.70Slippery 0 0.00 0.00 0.00 0.00 0.00Others 0 0.00 0.00 0.00 0.00 0.00
Month of year January 5 0.56 0.81 0.90 1.30 1.90February 3 0.33 0.56 0.90 1.10 1.30March 3 0.28 0.36 0.50 0.60 0.80April 6 0.67 0.97 1.00 1.40 2.20May 7 0.78 0.83 1.50 1.60 1.80June 5 0.50 0.61 0.50 0.80 1.40July 3 0.33 0.56 0.90 1.10 1.30August 4 0.39 0.60 1.00 1.10 1.30September 4 0.44 0.68 0.90 1.20 1.60October 2 0.17 0.25 0.50 0.50 0.50November 6 0.61 0.65 1.00 1.20 1.60December 5 0.50 0.79 0.50 0.90 1.70
Day of week Monday 7 0.78 0.75 1.50 1.60 1.80Tuesday 5 0.56 0.58 1.00 1.10 1.30Wednesday 10 1.11 1.65 2.20 3.00 4.00Thursday 5 0.50 0.50 0.90 1.10 1.30Friday 9 0.94 1.13 1.50 1.90 2.70Saturday 7 0.72 1.46 0.90 1.70 3.10Sunday 9 0.94 1.10 1.90 2.20 2.60
Hour of day 00:00 - 06:00 10 1.06 1.70 1.00 1.90 3.7006:01 - 09:00 6 0.67 0.83 1.00 1.30 1.9009:01 - 11:00 4 0.44 0.58 1.00 1.10 1.3011:01 - 13:00 3 0.33 0.71 0.80 1.20 1.6013:01 - 15:00 7 0.78 0.51 1.40 1.50 1.5015:01 - 18:00 7 0.72 0.62 1.30 1.60 1.8018:01 - 24:00 14 1.56 2.57 2.30 3.60 5.80
Note: 1. Crashes extracted from years 2000 and 2001 for Brevard, City of Orlando, Hillsborough, Miami-Dade, and Seminole, and years 1999 and 2000 for Orange County. 2. Crashes represent only long forms. 3. Standard Deviation, 85th, 90th, and 95th Percentiles represent crash statistics per year per intersection.
85th Percentile 90th Percentile 95th Percentile
Entire Category
CATEGORY 38EXPECTED ANNUAL CRASH VALUE TABLE - 6 COUNTIES
6 Lane x T4 Lane Intersection, SignalizedTotal Number of Intersections Included - 9
Total number of crashes per year
Mean crashes per intersection
per year
Standard Deviation

156
195 4.33 3.67 8.90 9.80 10.50Collision Type Rear End 38 0.84 1.07 1.50 1.80 2.50
Head On 4 0.08 0.32 0.00 0.00 0.50Angle 64 1.42 1.68 2.50 3.00 3.90Left Turn 18 0.39 0.69 1.00 1.30 1.50Right Turn 3 0.07 0.23 0.00 0.00 0.50Sideswipe 33 0.73 0.74 1.50 2.00 2.00Pedestrian/Bicycle 12 0.26 0.47 0.50 0.50 0.90Other 25 0.54 0.66 1.00 1.50 1.90
Severity PDO Crashes 142 3.16 2.95 6.30 8.00 8.90Possible Injury 28 0.61 0.69 1.50 1.50 1.50Non-Incapacitating Injury 20 0.43 0.58 1.00 1.30 1.50Incapacitating Injury 6 0.12 0.24 0.50 0.50 0.50Fatal Crashes 1 0.01 0.07 0.00 0.00 0.00
Light Conditions Daylight 136 3.02 2.92 7.00 8.30 8.50Dusk 7 0.14 0.29 0.50 0.50 0.90Dawn 2 0.03 0.13 0.00 0.00 0.40Dark (w/street lights) 50 1.11 1.15 2.20 2.50 3.00Dark (wo/street lights) 1 0.02 0.10 0.00 0.00 0.00
Surface Condition Dry 0 0.00 0.00 0.00 0.00 0.00Wet 171 3.80 3.14 8.00 8.60 9.00Slippery 22 0.49 0.64 1.00 1.30 1.90Others 2 0.04 0.14 0.00 0.00 0.50
Month of year January 16 0.34 0.47 1.00 1.00 1.00February 16 0.34 0.54 1.00 1.00 1.40March 22 0.48 0.60 1.00 1.50 1.50April 18 0.40 0.55 1.00 1.00 1.50May 14 0.31 0.51 0.50 1.00 1.40June 20 0.44 0.59 1.00 1.30 1.90July 17 0.37 0.49 1.00 1.00 1.40August 22 0.48 0.63 1.00 1.00 1.90September 18 0.39 0.55 0.70 1.00 1.00October 10 0.21 0.49 0.50 0.50 0.50November 16 0.36 0.52 0.70 1.00 1.40December 10 0.21 0.41 0.50 0.50 1.00
Day of week Monday 25 0.56 0.76 1.50 1.50 2.00Tuesday 32 0.70 0.94 1.50 1.80 2.90Wednesday 24 0.53 0.59 1.00 1.50 1.50Thursday 25 0.56 0.61 1.20 1.50 1.90Friday 35 0.78 0.77 1.50 1.50 2.40Saturday 27 0.60 0.64 1.00 1.30 1.90Sunday 28 0.61 0.75 1.00 1.50 2.00
Hour of day 00:00 - 06:00 29 0.63 0.76 1.50 1.50 2.0006:01 - 09:00 24 0.52 0.67 1.00 1.00 1.8009:01 - 11:00 18 0.40 0.52 1.00 1.00 1.4011:01 - 13:00 24 0.53 0.67 1.00 1.50 1.9013:01 - 15:00 27 0.59 0.76 1.50 2.00 2.0015:01 - 18:00 35 0.77 0.79 1.50 1.80 2.4018:01 - 24:00 40 0.89 1.09 1.50 2.30 3.00
Note: 1. Crashes extracted from years 2000 and 2001 for Brevard, City of Orlando, Hillsborough, Miami-Dade, and Seminole, and years 1999 and 2000 for Orange County. 2. Crashes represent only long forms. 3. Standard Deviation, 85th, 90th, and 95th Percentiles represent crash statistics per year per intersection.
85th Percentile 90th Percentile 95th Percentile
Entire Category
CATEGORY 39EXPECTED ANNUAL CRASH VALUE TABLE - 6 COUNTIES
Major Road One-Way Intersection, Signalized, AADT/lane for Major Road ≤ 7,000
Total Number of Intersections Included - 45
Total number of crashes per year
Mean crashes per intersection
per year
Standard Deviation

157
386 9.65 11.11 13.23 20.20 27.55Collision Type Rear End 89 2.23 3.12 3.30 5.00 5.27
Head On 5 0.11 0.31 0.07 0.50 0.52Angle 121 3.03 3.87 4.58 10.05 11.58Left Turn 41 1.03 2.02 1.58 2.00 3.72Right Turn 2 0.05 0.15 0.00 0.05 0.50Sideswipe 60 1.50 1.44 3.00 4.00 4.00Pedestrian/Bicycle 14 0.35 0.60 0.57 1.05 1.53Other 55 1.36 1.44 2.08 2.50 3.15
Severity PDO Crashes 310 7.74 9.55 11.88 16.70 20.20Possible Injury 49 1.21 1.29 2.08 3.00 3.10Non-Incapacitating Injury 20 0.49 0.67 1.00 2.00 2.00Incapacitating Injury 9 0.21 0.42 0.50 0.55 1.00Fatal Crashes 0 0.00 0.00 0.00 0.00 0.00
Light Conditions Daylight 243 6.06 6.74 9.58 10.65 17.53Dusk 8 0.20 0.34 0.50 0.55 1.00Dawn 4 0.10 0.34 0.00 0.05 0.55Dark (w/street lights) 129 3.23 4.27 5.08 5.75 8.82Dark (wo/street lights) 3 0.06 0.17 0.00 0.50 0.50
Surface Condition Dry 332 8.30 8.96 11.80 19.10 22.40Wet 44 1.09 1.89 2.00 2.10 3.67Slippery 0 0.00 0.00 0.00 0.00 0.00Others 11 0.26 0.62 0.50 0.50 1.03
Month of year January 28 0.69 0.99 1.50 1.55 2.55February 24 0.60 0.80 1.50 2.00 2.00March 43 1.06 1.28 2.00 2.55 4.50April 34 0.85 1.04 1.50 2.00 3.05May 31 0.78 1.17 1.08 1.50 2.12June 29 0.71 0.83 1.08 1.55 2.53July 36 0.90 0.91 1.50 2.05 2.53August 32 0.80 1.31 1.50 2.00 4.03September 35 0.88 1.41 1.50 1.60 3.53October 34 0.85 1.14 1.50 2.05 3.08November 31 0.78 1.28 1.08 1.55 4.53December 31 0.76 0.90 1.50 1.55 2.50
Day of week Monday 62 1.55 2.10 3.08 3.55 4.58Tuesday 45 1.13 1.48 2.00 2.60 3.60Wednesday 42 1.05 1.16 2.08 2.50 3.05Thursday 47 1.16 1.46 2.00 2.10 3.62Friday 67 1.68 2.24 2.58 3.50 3.80Saturday 63 1.56 1.99 3.15 4.05 5.58Sunday 61 1.53 1.87 2.50 3.10 5.55
Hour of day 00:00 - 06:00 65 1.63 2.29 2.15 3.35 8.0306:01 - 09:00 36 0.90 1.14 1.50 2.05 3.5509:01 - 11:00 28 0.70 1.04 1.08 1.50 2.1011:01 - 13:00 39 0.98 1.18 2.00 2.50 2.6013:01 - 15:00 47 1.16 1.38 2.50 3.00 3.5315:01 - 18:00 75 1.88 2.25 3.58 4.10 7.0818:01 - 24:00 97 2.41 3.42 3.58 4.05 4.87
Note: 1. Crashes extracted from years 2000 and 2001 for Brevard, City of Orlando, Hillsborough, Miami-Dade, and Seminole, and years 1999 and 2000 for Orange County. 2. Crashes represent only long forms. 3. Standard Deviation, 85th, 90th, and 95th Percentiles represent crash statistics per year per intersection.
85th Percentile 90th Percentile 95th Percentile
Entire Category
Total number of crashes per year
Mean crashes per intersection
per year
Standard Deviation
CATEGORY 40EXPECTED ANNUAL CRASH VALUE TABLE - 6 COUNTIES
Major Road One-Way Intersection, Signalized, AADT/lane for Major Road > 7,000Total Number of Intersections Included - 40

158
276 7.65 7.40 13.25 17.50 22.25Collision Type Rear End 71 1.97 2.38 4.00 6.00 7.25
Head On 3 0.07 0.18 0.00 0.50 0.50Angle 119 3.31 3.42 7.25 7.50 10.88Left Turn 28 0.76 1.41 1.50 2.25 3.13Right Turn 3 0.07 0.34 0.00 0.00 0.13Sideswipe 26 0.71 1.09 1.50 2.00 2.13Pedestrian/Bicycle 4 0.10 0.23 0.38 0.50 0.50Other 24 0.67 0.61 1.00 1.50 1.63
Severity PDO Crashes 180 5.00 5.13 8.50 11.75 15.63Possible Injury 57 1.58 1.64 2.50 3.50 4.75Non-Incapacitating Injury 31 0.86 1.07 1.88 2.00 3.50Incapacitating Injury 8 0.21 0.32 0.50 0.50 1.00Fatal Crashes 0 0.00 0.00 0.00 0.00 0.00
Light Conditions Daylight 189 5.25 5.49 8.00 10.75 15.25Dusk 9 0.25 0.41 0.50 1.00 1.00Dawn 2 0.04 0.18 0.00 0.00 0.13Dark (w/street lights) 75 2.08 2.14 3.50 5.75 6.25Dark (wo/street lights) 1 0.03 0.12 0.00 0.00 0.13
Surface Condition Dry 246 6.83 6.40 11.88 15.50 19.63Wet 25 0.68 1.02 1.00 2.00 2.50Slippery 1 0.03 0.12 0.00 0.00 0.13Others 4 0.11 0.27 0.38 0.50 0.63
Month of year January 21 0.58 0.69 1.50 1.50 2.00February 18 0.49 0.62 1.00 1.00 1.63March 26 0.72 0.91 1.75 2.00 2.63April 20 0.56 0.88 1.00 1.50 2.38May 22 0.60 0.76 1.38 1.50 2.13June 24 0.67 0.81 1.38 1.75 2.50July 22 0.60 0.84 1.00 1.50 2.25August 29 0.81 0.84 1.50 1.50 2.50September 20 0.54 0.72 1.38 1.50 1.63October 27 0.75 1.08 1.88 2.00 2.75November 28 0.76 0.83 1.88 2.00 2.50December 21 0.58 0.58 1.38 1.50 1.50
Day of week Monday 49 1.36 1.82 3.13 4.50 5.63Tuesday 34 0.94 1.24 1.88 2.00 3.00Wednesday 39 1.07 1.26 1.88 2.25 3.38Thursday 34 0.94 0.85 1.50 2.00 2.50Friday 46 1.26 1.39 2.38 3.00 3.88Saturday 41 1.13 1.34 2.38 3.00 4.13Sunday 34 0.94 1.08 2.38 2.75 3.00
Hour of day 00:00 - 06:00 35 0.96 1.12 1.50 2.00 2.8806:01 - 09:00 30 0.83 0.93 1.50 2.25 2.6309:01 - 11:00 26 0.71 0.78 1.88 2.00 2.0011:01 - 13:00 35 0.97 1.18 1.88 2.75 3.6313:01 - 15:00 34 0.93 0.99 1.88 2.25 2.6315:01 - 18:00 54 1.49 1.80 2.00 2.50 4.7518:01 - 24:00 64 1.76 2.16 4.13 4.50 5.38
Note: 1. Crashes extracted from years 2000 and 2001 for Brevard, City of Orlando, Hillsborough, Miami-Dade, and Seminole, and years 1999 and 2000 for Orange County. 2. Crashes represent only long forms. 3. Standard Deviation, 85th, 90th, and 95th Percentiles represent crash statistics per year per intersection.
85th Percentile 90th Percentile 95th Percentile
Entire Category
CATEGORY 41EXPECTED ANNUAL CRASH VALUE TABLE - 6 COUNTIES
Minor Road One-Way Intersection, SignalizedTotal Number of Intersections Included - 36
Total number of crashes per year
Mean crashes per intersection
per year
Standard Deviation

159
71 5.46 7.13 7.00 10.00 17.40Collision Type Rear End 12 0.88 0.85 1.50 1.50 2.10
Head On 1 0.08 0.19 0.10 0.40 0.50Angle 30 2.31 3.53 4.00 5.50 8.60Left Turn 5 0.38 1.12 0.20 0.80 2.20Right Turn 0 0.00 0.00 0.00 0.00 0.00Sideswipe 12 0.88 1.19 1.10 1.40 2.70Pedestrian/Bicycle 1 0.04 0.14 0.00 0.00 0.20Other 12 0.88 1.08 1.80 2.70 3.00
Severity PDO Crashes 59 4.50 6.40 5.60 7.40 14.60Possible Injury 7 0.54 0.59 1.00 1.00 1.40Non-Incapacitating Injury 5 0.35 0.52 1.00 1.00 1.20Incapacitating Injury 1 0.08 0.19 0.10 0.40 0.50Fatal Crashes 0 0.00 0.00 0.00 0.00 0.00
Light Conditions Daylight 52 3.96 5.64 5.00 8.00 13.80Dusk 3 0.19 0.56 0.10 0.40 1.10Dawn 0 0.00 0.00 0.00 0.00 0.00Dark (w/street lights) 17 1.31 1.09 2.00 2.00 2.80Dark (wo/street lights) 0 0.00 0.00 0.00 0.00 0.00
Surface Condition Dry 61 4.69 5.83 6.40 9.10 14.80Wet 9 0.65 0.99 1.10 1.40 2.30Slippery 0 0.00 0.00 0.00 0.00 0.00Others 2 0.12 0.42 0.00 0.00 0.60
Month of year January 5 0.35 0.47 0.60 0.90 1.20February 4 0.27 0.70 0.50 0.50 1.30March 5 0.38 0.74 1.00 1.00 1.60April 7 0.54 0.56 1.00 1.00 1.40May 6 0.46 0.59 1.00 1.00 1.40June 6 0.42 0.61 1.00 1.00 1.40July 8 0.58 0.76 1.10 1.40 1.90August 9 0.69 0.95 0.90 2.10 2.70September 5 0.35 0.72 0.60 0.90 1.60October 7 0.50 0.65 1.10 1.40 1.70November 6 0.46 1.09 0.50 0.50 1.90December 6 0.46 0.66 1.50 1.50 1.50
Day of week Monday 6 0.46 0.69 1.10 1.40 1.70Tuesday 14 1.08 1.62 2.70 3.30 4.10Wednesday 12 0.88 1.21 1.50 1.50 2.70Thursday 9 0.65 1.25 1.10 1.40 2.70Friday 11 0.81 1.75 1.00 1.00 3.20Saturday 11 0.81 0.80 1.50 1.50 1.70Sunday 10 0.77 0.99 1.70 2.30 2.70
Hour of day 00:00 - 06:00 12 0.88 1.16 1.60 1.90 2.8006:01 - 09:00 9 0.65 1.05 1.20 1.80 2.6009:01 - 11:00 7 0.54 0.97 1.00 1.00 2.0011:01 - 13:00 12 0.88 0.85 2.00 2.00 2.2013:01 - 15:00 5 0.35 0.75 1.00 1.00 1.6015:01 - 18:00 18 1.35 1.82 1.90 3.10 4.7018:01 - 24:00 11 0.81 1.32 1.60 1.90 3.00
Note: 1. Crashes extracted from years 2000 and 2001 for Brevard, City of Orlando, Hillsborough, Miami-Dade, and Seminole, and years 1999 and 2000 for Orange County. 2. Crashes represent only long forms. 3. Standard Deviation, 85th, 90th, and 95th Percentiles represent crash statistics per year per intersection.
85th Percentile 90th Percentile 95th Percentile
Entire Category
CATEGORY 42EXPECTED ANNUAL CRASH VALUE TABLE - 6 COUNTIES
Both Major and Minor Roads One-Way IntersectionTotal Number of Intersections Included - 13
Total number of crashes per year
Mean crashes per intersection
per year
Standard Deviation

160
73 6.04 3.92 10.18 10.45 12.30Collision Type Rear End 20 1.63 1.21 2.85 3.40 3.73
Head On 0 0.00 0.00 0.00 0.00 0.00Angle 14 1.13 0.96 2.00 2.00 2.45Left Turn 11 0.88 1.42 1.35 1.90 3.35Right Turn 1 0.04 0.14 0.00 0.00 0.23Sideswipe 15 1.25 0.75 1.68 1.95 2.23Pedestrian/Bicycle 4 0.29 0.40 0.68 0.95 1.00Other 10 0.83 0.83 1.68 1.95 2.23
Severity PDO Crashes 60 5.00 4.07 8.70 9.80 11.80Possible Injury 6 0.46 0.62 1.18 1.45 1.50Non-Incapacitating Injury 6 0.46 0.66 0.85 1.40 1.73Incapacitating Injury 1 0.08 0.19 0.18 0.45 0.50Fatal Crashes 1 0.04 0.14 0.00 0.00 0.23
Light Conditions Daylight 51 4.21 3.33 6.85 7.40 9.53Dusk 2 0.17 0.25 0.50 0.50 0.50Dawn 2 0.17 0.25 0.50 0.50 0.50Dark (w/street lights) 18 1.46 0.94 2.35 2.90 3.00Dark (wo/street lights) 1 0.04 0.14 0.00 0.00 0.23
Surface Condition Dry 69 5.71 3.72 9.35 9.90 11.80Wet 3 0.25 0.40 0.68 0.95 1.00Slippery 0 0.00 0.00 0.00 0.00 0.00Others 1 0.08 0.19 0.18 0.45 0.50
Month of year January 4 0.29 0.33 0.50 0.50 0.73February 7 0.54 0.58 1.18 1.45 1.50March 9 0.75 0.89 1.68 1.95 2.23April 6 0.50 0.48 1.00 1.00 1.23May 6 0.50 0.60 1.18 1.45 1.50June 4 0.29 0.40 0.68 0.95 1.00July 8 0.67 0.72 1.35 1.90 2.00August 7 0.54 0.62 1.00 1.00 1.45September 8 0.67 0.58 1.50 1.50 1.50October 4 0.33 0.44 1.00 1.00 1.00November 5 0.38 0.43 1.00 1.00 1.00December 7 0.58 0.56 1.18 1.45 1.50
Day of week Monday 9 0.71 0.84 1.35 1.90 2.23Tuesday 10 0.79 0.62 1.50 1.50 1.73Wednesday 11 0.88 0.77 1.50 1.50 1.95Thursday 11 0.92 1.02 1.35 1.90 2.68Friday 11 0.92 1.14 1.68 1.95 2.90Saturday 10 0.83 0.58 1.50 1.50 1.50Sunday 12 1.00 0.83 2.00 2.00 2.23
Hour of day 00:00 - 06:00 11 0.92 0.85 1.85 2.40 2.5006:01 - 09:00 8 0.63 0.68 1.50 1.50 1.7309:01 - 11:00 5 0.42 0.76 1.50 1.50 1.7311:01 - 13:00 7 0.54 0.54 0.68 0.95 1.4513:01 - 15:00 9 0.71 0.94 1.35 1.90 2.4515:01 - 18:00 16 1.33 1.09 2.18 2.45 3.1818:01 - 24:00 18 1.50 1.09 2.68 2.95 3.00
Note: 1. Crashes extracted from years 2000 and 2001 for Brevard, City of Orlando, Hillsborough, Miami-Dade, and Seminole, and years 1999 and 2000 for Orange County. 2. Crashes represent only long forms. 3. Standard Deviation, 85th, 90th, and 95th Percentiles represent crash statistics per year per intersection.
85th Percentile 90th Percentile 95th Percentile
Entire Category
CATEGORY 43EXPECTED ANNUAL CRASH VALUE TABLE - 6 COUNTIES
T Intersection with Minor Road One-Way, SignalizedTotal Number of Intersections Included - 12
Total number of crashes per year
Mean crashes per intersection
per year
Standard Deviation

161
51 2.55 3.38 6.30 8.15 9.58Collision Type Rear End 10 0.50 0.71 1.00 1.10 2.03
Head On 2 0.10 0.26 0.07 0.50 0.53Angle 18 0.90 1.34 2.08 2.65 4.03Left Turn 16 0.80 1.32 1.58 2.15 3.58Right Turn 0 0.00 0.00 0.00 0.00 0.00Sideswipe 2 0.08 0.24 0.00 0.05 0.53Pedestrian/Bicycle 0 0.00 0.00 0.00 0.00 0.00Other 4 0.18 0.41 0.50 0.55 1.03
Severity PDO Crashes 25 1.25 2.31 2.08 2.85 6.15Possible Injury 12 0.58 0.92 1.50 1.55 2.08Non-Incapacitating Injury 12 0.58 1.12 1.50 1.55 2.13Incapacitating Injury 3 0.15 0.24 0.50 0.50 0.50Fatal Crashes 0 0.00 0.00 0.00 0.00 0.00
Light Conditions Daylight 33 1.65 2.40 4.58 5.00 5.20Dusk 2 0.08 0.24 0.00 0.05 0.53Dawn 1 0.05 0.15 0.00 0.05 0.50Dark (w/street lights) 13 0.65 0.88 1.58 2.00 2.05Dark (wo/street lights) 3 0.13 0.28 0.50 0.50 0.53
Surface Condition Dry 43 2.13 2.72 5.30 7.05 7.55Wet 8 0.38 0.72 1.00 1.00 1.10Slippery 1 0.03 0.11 0.00 0.00 0.03Others 1 0.03 0.11 0.00 0.00 0.03
Month of year January 5 0.25 0.47 0.50 0.60 1.50February 1 0.05 0.15 0.00 0.05 0.50March 6 0.28 0.38 0.57 1.00 1.00April 4 0.18 0.34 0.50 0.55 1.00May 4 0.20 0.41 0.50 0.55 1.03June 2 0.08 0.18 0.07 0.50 0.50July 4 0.20 0.50 0.50 0.55 1.05August 5 0.23 0.50 0.50 0.55 1.05September 8 0.38 0.78 0.65 1.50 1.58October 5 0.25 0.38 0.50 0.50 0.55November 7 0.35 0.67 0.50 0.50 0.63December 3 0.13 0.28 0.50 0.50 0.53
Day of week Monday 9 0.43 0.63 1.08 1.50 1.53Tuesday 10 0.48 0.77 1.00 1.05 1.58Wednesday 12 0.58 0.92 1.15 2.05 2.53Thursday 6 0.30 0.52 0.57 1.00 1.05Friday 5 0.23 0.38 0.57 1.00 1.00Saturday 9 0.43 0.71 1.08 1.50 1.55Sunday 3 0.13 0.32 0.07 0.55 1.00
Hour of day 00:00 - 06:00 6 0.28 0.62 0.57 1.00 1.0806:01 - 09:00 7 0.35 0.65 0.57 1.05 1.5509:01 - 11:00 3 0.13 0.36 0.07 0.50 0.5511:01 - 13:00 5 0.23 0.34 0.50 0.55 1.0013:01 - 15:00 4 0.18 0.29 0.50 0.50 0.5315:01 - 18:00 13 0.63 0.94 1.23 2.50 2.5318:01 - 24:00 16 0.78 1.14 1.50 1.70 3.53
Note: 1. Crashes extracted from years 2000 and 2001 for Brevard, City of Orlando, Hillsborough, Miami-Dade, and Seminole, and years 1999 and 2000 for Orange County. 2. Crashes represent only long forms. 3. Standard Deviation, 85th, 90th, and 95th Percentiles represent crash statistics per year per intersection.
85th Percentile 90th Percentile 95th Percentile
Entire Category
CATEGORY 44EXPECTED ANNUAL CRASH VALUE TABLE - 6 COUNTIES
Ramp Intersection, Signalized, AADT/lane for Major Road ≤ 7,000
Total Number of Intersections Included - 20
Total number of crashes per year
Mean crashes per intersection
per year
Standard Deviation

162
93 3.30 4.60 6.43 7.45 14.03Collision Type Rear End 46 1.63 2.34 3.45 4.00 4.33
Head On 1 0.02 0.09 0.00 0.00 0.00Angle 23 0.80 1.70 1.00 2.60 4.00Left Turn 10 0.34 0.51 1.00 1.00 1.00Right Turn 0 0.00 0.00 0.00 0.00 0.00Sideswipe 8 0.29 1.05 0.48 0.50 0.82Pedestrian/Bicycle 1 0.04 0.13 0.00 0.00 0.32Other 6 0.20 0.50 0.50 0.50 0.50
Severity PDO Crashes 59 2.09 3.26 4.93 5.95 9.92Possible Injury 23 0.82 1.09 1.50 2.50 2.50Non-Incapacitating Injury 7 0.25 0.46 0.50 0.65 1.00Incapacitating Injury 4 0.14 0.43 0.00 0.50 0.82Fatal Crashes 0 0.00 0.00 0.00 0.00 0.00
Light Conditions Daylight 59 2.09 2.66 3.48 5.80 7.80Dusk 2 0.07 0.18 0.00 0.50 0.50Dawn 1 0.02 0.09 0.00 0.00 0.00Dark (w/street lights) 30 1.05 2.04 1.98 2.60 5.63Dark (wo/street lights) 2 0.07 0.18 0.00 0.50 0.50
Surface Condition Dry 73 2.59 3.95 4.00 5.10 11.38Wet 20 0.71 0.92 1.98 2.15 2.50Slippery 0 0.00 0.00 0.00 0.00 0.00Others 0 0.00 0.00 0.00 0.00 0.00
Month of year January 7 0.25 0.44 0.50 0.65 1.33February 6 0.20 0.31 0.50 0.50 0.82March 9 0.30 0.50 1.00 1.00 1.33April 8 0.29 0.42 0.50 1.00 1.00May 4 0.13 0.29 0.48 0.50 0.82June 7 0.23 0.50 0.50 0.65 1.33July 6 0.21 0.40 0.50 0.65 1.00August 9 0.30 0.55 0.50 1.15 1.50September 8 0.29 0.79 0.50 0.65 1.00October 9 0.32 0.46 1.00 1.00 1.00November 11 0.39 0.79 0.50 1.15 1.83December 11 0.39 0.72 0.50 1.50 2.15
Day of week Monday 15 0.54 0.91 1.00 1.30 2.65Tuesday 12 0.43 0.72 0.98 1.15 1.83Wednesday 12 0.41 0.64 1.00 1.00 1.65Thursday 11 0.39 0.80 0.50 1.30 2.33Friday 12 0.43 0.69 0.50 1.00 1.00Saturday 16 0.55 0.75 1.00 1.65 2.00Sunday 16 0.55 0.84 1.00 1.15 2.15
Hour of day 00:00 - 06:00 13 0.45 0.76 1.00 1.15 1.5006:01 - 09:00 11 0.39 0.81 1.00 1.15 1.8309:01 - 11:00 9 0.30 0.57 0.98 1.15 1.5011:01 - 13:00 11 0.38 0.52 1.00 1.00 1.0013:01 - 15:00 10 0.34 0.88 0.50 1.00 1.0015:01 - 18:00 17 0.59 0.77 1.50 1.50 1.8318:01 - 24:00 24 0.86 1.44 1.48 2.30 4.30
Note: 1. Crashes extracted from years 2000 and 2001 for Brevard, City of Orlando, Hillsborough, Miami-Dade, and Seminole, and years 1999 and 2000 for Orange County. 2. Crashes represent only long forms. 3. Standard Deviation, 85th, 90th, and 95th Percentiles represent crash statistics per year per intersection.
85th Percentile 90th Percentile 95th Percentile
Entire Category
CATEGORY 45EXPECTED ANNUAL CRASH VALUE TABLE - 6 COUNTIES
Ramp Intersection, Signalized, AADT/lane for Major Road > 7,000Total Number of Intersections included - 28
Total number of crashes per year
Mean crashes per intersection
per year
Standard Deviation
163
9.4 Summary
This chapter has described the classification of the intersections into 45 categories.
By categorizing intersections in this manner, the average number of crashes taking place
at an intersection can be found more precisely. For estimating the number of crashes
occurring at an intersection in a year, the category of the intersection can be determined
and then the tables can be checked for that particular category. This process will facilitate
estimating the expected crashes based on the collision type, severity, surface and light
conditions, and time, day and month of the crash. Also, intersections with above average
or high number of crashes could be identified based on these tables.

164
10 CONCLUSIONS
We have concluded the most extensive data collection effort for signalized
intersections in Florida. We have also developed crash profiles for 45 different types of
intersections based on configuration and traffic volume, and if the sample size permitted
we have further classified in several cases based on the number of left turn lanes or the
speed limit.
The 45 crash tables presented in Chapter 9 will be very useful to engineers and
would serve as a crash profile manual that could be used as reference values that could
assist in identifying intersections with specific problems, e.g., high number of fatal
crashes or high number of angle crashes, etc.
We have also developed a simplistic method to identify the expected number of
crashes based on the total number of lanes which is a surrogate measure for the size of
the intersection and volume. This method presented in Chapter 7 is similar to the method
applied in the ITE trip generation manual, and could be simple in identifying the
expected number of crashes by type given that the number of lanes is known.
We have started developing a database application that would have the ability to
further expand by allowing users to input data from other areas of the state. As other
counties begin to enter data, the database will have to be self-adaptive such that the
necessary database tables and relationships will be created on-demand. Once the sample
of a particular type of intersections in a new county is adequate to conduct the same type

165
of analysis that we have been doing in this project, the application will be able to
automatically switch from input to output mode. In other words, the application will
serve as input and output at the same time. The data gathered from the current project
will serve as the base and will grow over time until it encompasses all types of
intersections for all areas of the state beyond just the 6 counties that were considered in
this study.

166
REFERENCES 1. Abdel-Aty, M., Keller, J. and Brady P. (2005) Analysis of the Types of Crashes at
Signalized Intersections using Complete Crash Data and Tree-Based Regression,
Journal of the Transportation Research Board, accepted Feb. 2005 (forthcoming).
2. Abdelwahab H. and Abdel-Aty M. (2001). Development of Artificial Neural
Networks Models to Predict Driver Injury Severity in Traffic Accidents at Signalized
Intersections, Journal of the Transportation Research Board, Vol. 1746, pp. 6-13.
3. Abdelwahab H. and Abdel-Aty M. (2002). Investigating Driver Injury Severity in
Traffic Accidents Using Fuzzy ARTMAP, Journal of Computer-Aided Civil and
Infrastructure Engineering 17, pp. 396-408
4. Abdel-Aty M. and Abdelwahab H. (2004) Predicting Injury Severity Levels in Traffic
Crashes: A Modeling Comparison, ASCE Journal of Transportation Engineering, Vol
130, No.2., pp. 204-210
5. Al-Turk, M. and Moussavi, M. (1996). Accident Frequency as a Function of Traffic
Congestion at Signalized Intersections. Presented at the 75th Annual Meeting of the
Transportation Research Board, Washington, D.C.
6. Andersen, S. A. (2001). Analysis of Traffic Collisions Involving Pedestrians and
Bicycles 2000 through 2002 In Louisville, Kentucky.
http://www.loukymetro.org/Department/PlanDesign/pdf/collisionrpt.pdf.
7. Bauer, K. and Harwood, D. (1996). Statistical Models of At-grade Intersection
Accidents. Report FHW A-RD-96-125. FHWA, U.S.DOT.
8. Belanger, C. (1994). Estimation of Safety of Four-Legged Unsignalized Intersections,
Transportation Research Record, Vol. 1467, Transportation Research Board,
Washington D.C., USA, pp. 23-29.
167
9. Bhesania, R. P. (1991). Using Accident Statistics and Characteristics to Improve
Safety. ITE Journal, Vol. 61, No. 3, pp. 37-41.
10. Bonneson, J. and Patrick, T. (1993). Estimation of Safety at Two-Way Stop-
Controlled Intersections on Rural Highways. Transportation Research Record,
No.1401, pp. 83-89.
11. Brown, R. J. (1981). A Method for Determining the Accident Potential at an
Intersection. ITE Journal.
12. Chen, C. H. (1996). Fuzzy Logic and Neural Network Handbook. McGraw-Hill.
13. Chin, H. and Abddul-Quddus, M. (2001). Applying the Random Effect Negative
Binomial Model to Examine Traffic Accident Occurrence at Signalized Intersections.
Accident Analysis & Prevention.
14. Christodoulou, C. and Georgiopoulos, M. "Applications of Neural Networks in
Electromagnetics" Artech House, Boston, 2001.
15. Datta, Tapan K., and Dutta U. (1990). Traffic Signal Installation and Accident
Experience. ITE Journal, pp. 39–42.
16. FHWA (2002), National Agenda for Intersection Safety, FHWA.
17. Greibe, P. (2003). Accident Prediction Models for Urban Roads. Accident Analysis
and Prediction Vol. 35 Iss. 2 pp. 273-285.
18. Hall, J. W. and Hurtado, M. (1992). Effect of Intersection Congestion on Accident
Rates. Transportation Research Record, No. 1376, pp. 71-77.

168
19. Hammerslag, R.; Roos, J. P. and Kwakernaak, M. (1982). Analysis of accidents in
traffic situations by means of multiproportional weighted Poisson model.
Transportation Research Record, 847: 29–36.
20. Harris, Joseph, I., and Stuart R. (1968). Traffic Conflict Characteristics–Accident
Potential at Intersections. Presented at the 47th Annual Meeting of Transportation
Research Board, Washington, D.C.
21. Hauer, E., Ng, J. C. N., & Lovell, J. (1988). Estimation of Safety at Signalized
Intersections. Transportation Research Record 1185, 48-61.
22. Hill, S. E. and J. K. Lindly. (2003). Red-Light Running Prediction and Analysis.
UTCA Report 02112, Tuscaloosa, Alabama, USA: University Transportation Center
for Alabama.
23. Hoque, M. and Anderson, D. (1986). The Use of Accident Type and Road Class
Information in Assessing the Urban Road Safety Problem. ITE Journal, Vol. 56, No.
8, pp. 51-54.
24. Huang, H., C. Zegeer, R. Nassi and B. Fairfa. (2000). The Effects of Innovative
Pedestrian Signals at Unsignalized Intersections: A Tale of Three Treatments. Report
FHWA-RD-00-098, Washington, DC, USA: Federal Highway Administration.
25. Jia, Xudong, and Parsonson, P. (1995). Expected Values for Accident Analyses at
Atlanta Intersections. 65th ITE Annual Meeting, Washington, D.C.
26. King, G. F. and Goldblatt, R. B. (1975). Relationship of Accident Patterns to Type of
Intersection Control. Transportation Research Record, No. 540.
27. Lau, Y. K, Michael, and May, A. (1988). Accident Prediction Model Development:
Signalized Intersections. Institution of Transportation Studies, Berkeley, CA.

169
28. Leden, L. (2002). Pedestrian Risk Decrease with Pedestrian Flow. A Case Study
based on data from Signalized Intersections in Hamilton, Ontario. Accident Analysis
and Prevention, Vol. 34, No. 4, pp. 457-464.
29. Liu, P. and H.-G. Young. A Neural Network Approach on Studying the Effect of
Urban Signalized Intersection Characteristics on Occurrence of Traffic Accidents.
Presented at the 83nd Annual Meeting of the Transportation Research Board,
Washington D. C. 2004.
30. Mohamedshah, Y., L. Chen and F. Council. “Association of Selected Intersection
Factors with Red-Light Running Crashes.” Presented at the ITE 2000 Annual
Meeting and Exhibit, Nashville, Tennessee, August 2000.
31. Mucsi, K. and A. M. Khan. “Effectiveness of Additional Lanes at Signalized
Intersections.” ITE Journal, No. 73, No. 1, January 2003, pp. 26-30.
32. Najafi, F., Aty, M., Lu, J., Eldeen, S., and Jolibois, S. (1998). Identification and
Classification of Typical Intersection Crash Patterns in Florida. UF Project # 4910-
4504-621-12.
33. Ogden, K., Newstead, S., Ryan, P., and Gantzer, S. (1997). Factors Affecting Crashes
at Signalized Intersections. Monash University Accident Research Centre - Report
#62.
34. Okamoto, H. and Koshi, M. 1989: A method to cope with the random errors of
observed accident rates in regression analysis. Accident Analysis and Prevention,
21:317–332.
35. PAB Consultants, Inc. (1997). Expected Annual Accident Value Analysis. State
Project Number 99006-1695.

170
36. Pernia, J., J. Lu, X. Xie, M. Weng and D. Synder. “Development of Models to
Quantify the Impacts of Signalization of Intersection Crashes.” Presented at the 81st
Annual Meeting of the Transportation Research Board, Washington, D.C., 2002.
37. Persaud, B. and Nguyen, T. (1998), Disaggregate Safety Performance Models for
Signalized intersections on Ontario Provincial Roads. Transportation Research
Record, No. 1635, pp. 113-120.
38. Poch, M. and Mannering, F. (1996). Negative Binomial Analysis of Intersection
Accident Frequencies. Presented at the 75th Annual Meeting of the Transportation
Research Board, Washington, D.C.
39. Porter, B. and Berry, T. (2001). A Nationwide Survey of Self-Reported Red Light
running: measuring prevalence, predictors, and perceived consequences. Accident
Analysis and Prevention, Vol. 33, No. 6, pp. 735-741.
40. Porter, B. and England, K. 2000. Predicting Red-Light Running Behavior: A Traffic
Safety Study in Three Urban Settings. Journal of Safety Research, Vol. 31, pp. 1-8.
41. Retting, R. and Greene, M. (1997). Influence of Traffic Signal Timing on Red-Light
Running and Potential Vehicle Conflicts at Urban Intersections. Transportation
Research Record, No.1595, pp. 1-7.
42. Retting, R., Ulmer, R., and Williams A. (1999 a). Prevalence and Characteristics of
Red Light Running Crashes in the United States. Accident Analysis and Prevention,
Vol. 31, No. 6, pp. 687-694.
43. Retting, R. and Williams, A. (1996). Characteristics of Red Light Violators: Results
of a Field Investigation. Journal of Safety Research, Vol. 27, pp. 9¯15.

171
44. Retting, R., Williams, A., Farmer, C., and Feldman, A. (1999 b). Evaluation of Red
Light Camera Enforcement in Fairfax, VA, USA. ITE Journal, Vol. 69, No. 8, pp.
30¯34.
45. Retting, R., Williams, A., Farmer, C., and Feldman, A. (1999 c). Evaluation of Red
Light Camera Enforcement in Oxnard, California. Accident Analysis and Prevention,
Vol. 31, pp. 169¯174.
46. Retting, R., Williams, A., Preusser, D., and Weinstein, H. (1995). Classifying Urban
Crashes for Countermeasure Development. Accident Analysis and Prevention, Vol.
27, pp. 283¯294.
47. Rodriguez, L.-P., and Sayed, T. Accident Prediction Models for Urban Unsignalized
Intersections in British Columbia. Transportation Research Record 1665, TRB,
National Research Council, Washington, D.C., pp. 93-99, 1999.
48. Sayed, T. and Zein, S. (1999). Traffic Conflict Standards for Intersections.
Transportation Planning and Technology, Vol. 22, pp. 309-323.
49. Shankar, V.; Mannering, F. L. and Barfield, W. (1995). Effect of Roadway
Geometrics and Environmental Factors on Rural Freeway Accident Frequencies.
Accident Analysis and Prevention, 27(1): 371–389.
50. Stamatiadis, N., K.R. Agent, and A. Bizakis. Guidelines for Left turn Phasing
Treatment, Transportation Research Record 1605, TRB, National Research Council,
Washington, D.C., 1997, pp. 1-7
51. Storsteen, M. (1999). Identification of Abnormal Accident Patterns at Intersections.
Transportation Research Board, September 1999. South Dakota Department of
Transportation, Pierre, SD.

172
52. Turner, S. and Nicholson, A. (1998). Intersection Accident Estimation: The Role of
Intersection Location and Non-Collision Flows. Accident Analysis and Prevention,
Vol. 30, No. 4, pp. 505–517, 1998.
53. Vogt, A. and Bared, J. (1998). Accident models for two-lane rural segments and
intersections. Transportation Research Record, No. 1635, pp. 18-29.
54. Weerasuriya, S. and Pietrzyk, M. (1998). Development of Expected Conflict Value
Tables for Unsignalized Three-legged Intersections. Transportation Research Record
No. 1635, TRB, pp. 121-126.
55. Wolverton, J. J., and J. M. Mounce. (1996). Study of Accidents at Signalized
Intersections. Montana Department of Transportation and Federal Highway
Administration, U.S. Department of Transportation.
56. Wong, Y. D. and Nicholson, A. (1992). Driver behavior at horizontal curves: risk
compensation and the margin of safety. Accident Analysis and Prevention, 24(4):
425–436.
57. Worsey, G. (1985). Predicting Urban Accident Rates from Road and Traffic
Characteristics. ITE Journal, Vol. 55, No. 12, pp. 37-40.
58. Yiu-Kuen, M. and May, A. (1987). Injury Accident Prediction Models for Signalized
Intersections. Transportation Research Record, No.1172, pp. 58-67.
59. Zador, P., Stein, H., Shapiro, S., and Tarnoff, P. (1985). Effect of Clearance Interval
Timing on Traffic Flow and Crashes at Signalized Intersections. ITE Journal, Vol.
55, No. 11, pp. 36-39.

173
APPENDIX A
19 CATEGORY CRASH PROFILE TABLES FOR BREVARD COUNTY

174
Total Number Mean Crashes Standard 85th 90th 95th
Crashes Per Year* Per IntersectionPer Year Deviation** Percentile Percentile Percentile
Collision Type Rear End 3 0.30 0.47 1 1 1Head On 0 0.00 0.00 0 0 0Angle 0 0.03 0.00 0 0 0Left Turn 1 0.10 0.00 0 0 1Right Turn 0 0.03 0.00 0 0 0Sideswipe 0 0.03 0.00 0 0 0Pedestrian/Bicycle 1 0.13 0.00 0 0 1Other/Unknown 0 0.06 0.24 0 0 0
Severity No Injury 1 0.10 0.24 0 0 1Possible Injury 3 0.27 0.47 1 1 1Non-Incapacitating Injury 2 0.17 0.24 0 0 1Incapacitating Injury 0 0.00 0.00 0 0 0Fatal Injury 0 0.00 0.00 0 0 0
Light Conditions Daylight 4 0.73 0.47 1 1 1Dusk 0 0.00 0.00 0 0 0Dawn 0 0.00 0.00 0 0 0Dark (w/street lights) 1 0.13 0.24 0 0 0Dark (wo/ street lights) 1 0.20 0.24 0 0 1
Surface Conditions Dry 5 0.50 0.47 1 1 2Wet 0 0.03 0.00 0 0 0Others 0 0.00 0.00 0 0 0
Month of Year January 1 0.10 0.00 0 0 1February 1 0.07 0.24 0 0 0March 0 0.03 0.00 0 0 0April 1 0.10 0.00 0 0 0May 1 0.07 0.00 0 0 0June 0 0.03 0.24 0 0 0July 0 0.03 0.24 0 0 0August 1 0.07 0.00 0 0 0September 0 0.03 0.00 0 0 0October 0 0.03 0.24 0 0 0November 0 0.00 0.00 0 0 0December 1 0.07 0.00 0 0 0
Day of Week Monday 0 0.03 0.00 0 0 0Tuesday 2 0.17 0.24 0 0 1Wednesday 1 0.10 0.00 0 0 1Thursday 1 0.13 0.00 0 0 0Friday 0 0.03 0.24 0 0 0Saturday 1 0.10 0.00 0 0 1Sunday 1 0.07 0.00 0 0 0
Hour of Day 00:00 - 06:00 0 0.03 0.00 0 0 006:01 - 09:00 0 0.03 0.00 0 0 009:01 - 11:00 1 0.10 0.00 0 0 111:01 - 13:00 1 0.07 0.24 0 0 013:01 - 15:00 0 0.00 0.00 0 0 015:01 - 18:00 3 0.27 0.24 0 0 118:01 - 24:00 1 0.13 0.00 0 0 1
* Crashes extracted for years 2000, 2001 and 2002 long forms only.** Standard Deviation column represents the standard deviation for mean crashes per year per intersection.
EXPECTED ANNUAL ACCIDENT TABLE - BREVARD COUNTY
2 Lane x 2 Lane Signalized Intersection, AADT/ Lane On Major Road >= 5,000
Total number of intersections Included - 10
CATEGORY 1

175
Total Number Mean Crashes Standard 85th 90th 95th
Crashes Per Year* Per IntersectionPer Year Deviation** Percentile Percentile Percentile
Collision Type Rear End 2 0.40 0.24 0 1 1Head On 1 0.13 0.00 0 0 0Angle 3 0.60 0.24 1 1 1Left Turn 2 0.47 0.24 1 1 1Right Turn 0 0.07 0.00 0 0 0Sideswipe 0 0.00 0.00 0 0 0Pedestrian/Bicycle 0 0.07 0.00 0 0 0Other/Unknown 0 0.00 0.00 0 0 0
Severity No Injury 2 0.29 0.24 1 1 1Possible Injury 2 0.29 0.47 1 1 1Non-Incapacitating Injury 4 0.52 0.94 1 1 1Incapacitating Injury 1 0.10 0.00 0 0 0Fatal Injury 0 0.00 0.00 0 0 0
Light Conditions Daylight 4 0.62 0.24 1 1 1Dusk 0 0.05 0.00 0 0 0Dawn 0 0.00 0.00 0 0 0Dark (w/street lights) 2 0.29 0.24 1 1 1Dark (wo/ street lights) 2 0.24 0.24 0 0 1
Surface Conditions Dry 6 0.90 0.94 2 2 2Wet 2 0.29 0.24 1 1 1Others 0 0.00 0.00 0 0 0
Month of Year January 0 0.05 0.00 0 0 0February 1 0.10 0.24 0 0 0March 0 0.05 0.00 0 0 0April 0 0.05 0.00 0 0 0May 1 0.14 0.47 0 0 1June 1 0.10 0.00 0 0 0July 1 0.14 0.24 0 0 1August 1 0.14 0.24 0 0 1September 1 0.10 0.00 0 0 0October 1 0.14 0.00 0 0 1November 1 0.10 0.00 0 0 0December 1 0.14 0.00 0 0 0
Day of Week Monday 1 0.19 0.24 0 0 1Tuesday 1 0.14 0.24 0 0 0Wednesday 1 0.10 0.00 0 0 0Thursday 1 0.10 0.00 0 0 0Friday 2 0.33 0.00 1 1 1Saturday 2 0.24 0.00 1 1 1Sunday 1 0.14 0.00 0 0 1
Hour of Day 00:00 - 06:00 0 0.00 0.00 0 0 006:01 - 09:00 1 0.14 0.00 0 0 109:01 - 11:00 0 0.00 0.00 0 0 011:01 - 13:00 1 0.14 0.00 0 0 013:01 - 15:00 1 0.14 0.24 0 0 115:01 - 18:00 2 0.29 0.00 1 1 118:01 - 24:00 4 0.52 0.47 1 1 1
* Crashes extracted for years 2000, 2001 and 2002 long forms only.** Standard Deviation column represents the standard deviation for mean crashes per year per intersection.
Total number of intersections Included - 7
CATEGORY 2
EXPECTED ANNUAL ACCIDENT TABLE - BREVARD COUNTY
2 Lane x 2 Lane Signalized Intersection, AADT/ Lane On Major Road < 5,000

176
Total Number Mean Crashes Standard 85th 90th 95th
Crashes Per Year* Per IntersectionPer Year Deviation** Percentile Percentile Percentile
Collision Type Rear End 13 1.03 0.73 1 2 2Head On 0 0.03 0.12 0 0 0Angle 6 0.46 0.72 1 2 2Left Turn 8 0.59 0.73 2 2 2Right Turn 0 0.00 0.00 0 0 0Sideswipe 1 0.08 0.12 0 0 0Pedestrian/Bicycle 2 0.15 0.39 1 1 1Other/Unknown 3 0.23 0.39 1 1 1
Severity No Injury 2 0.40 1.86 3 3 4Possible Injury 1 0.20 0.41 1 1 1Non-Incapacitating Injury 0 0.00 0.00 0 0 0Incapacitating Injury 0 0.00 0.00 0 0 0Fatal Injury 0 0.00 0.00 0 0 0
Light Conditions Daylight 19 1.44 1.50 3 3 4Dusk 1 0.10 0.25 0 0 1Dawn 0 0.00 0.00 0 0 0Dark (w/street lights) 5 0.36 0.40 1 1 1Dark (wo/ street lights) 6 0.44 0.30 1 1 1
Surface Conditions Dry 26 1.97 1.91 3 4 5Wet 5 0.36 0.40 1 1 1Others 0 0.00 0.00 0 0 0
Month of Year January 4 0.28 0.38 1 1 1February 3 0.23 0.40 1 1 1March 3 0.23 0.35 0 0 1April 3 0.23 0.39 1 1 1May 2 0.18 0.18 0 0 0June 4 0.31 0.25 0 0 1July 3 0.21 0.35 0 1 1August 3 0.26 0.35 0 1 1September 2 0.13 0.15 0 0 0October 2 0.13 0.25 0 0 1November 3 0.26 0.31 1 1 1December 2 0.13 0.17 0 0 0
Day of Week Monday 6 0.44 0.79 2 2 2Tuesday 4 0.31 0.15 0 0 0Wednesday 3 0.26 0.39 1 1 1Thursday 4 0.31 0.40 1 1 1Friday 7 0.54 0.38 1 1 1Saturday 6 0.46 0.50 1 1 1Sunday 3 0.26 0.38 1 1 1
Hour of Day 00:00 - 06:00 1 0.10 0.25 0 0 106:01 - 09:00 3 0.26 0.39 1 1 109:01 - 11:00 2 0.13 0.25 0 0 111:01 - 13:00 3 0.26 0.28 1 1 113:01 - 15:00 2 0.18 0.25 0 0 115:01 - 18:00 13 1.00 0.64 1 1 118:01 - 24:00 8 0.64 0.79 1 1 2
* Crashes extracted for years 2000, 2001 and 2002 long forms only.** Standard Deviation column represents the standard deviation for mean crashes per year per intersection.
CATEGORY 3
4 Lane x 2 Lane Signalized Intersection, AADT/ Lane On Major Road >= 7,000 (Total LTLs <=2)
EXPECTED ANNUAL ACCIDENT TABLE - BREVARD COUNTY
Total number of intersections Included - 13

177
Total Number Mean Crashes Standard 85th 90th 95th
Crashes Per Year* Per IntersectionPer Year Deviation** Percentile Percentile Percentile
Collision Type Rear End 49 1.81 1.51 3 4 4Head On 2 0.09 0.15 0 0 0Angle 17 0.63 0.52 1 1 2Left Turn 17 0.64 0.74 1 2 2Right Turn 1 0.04 0.11 0 0 0Sideswipe 3 0.10 0.18 0 0 0Pedestrian/Bicycle 2 0.07 0.14 0 0 0Other/Unknown 7 0.26 0.44 1 1 1
Severity No Injury 19 0.72 0.79 1 2 2Possible Injury 43 1.59 1.29 3 3 4Non-Incapacitating Injury 22 0.83 0.79 2 2 2Incapacitating Injury 7 0.27 0.38 1 1 1Fatal Injury 0 0.01 0.06 0 0 0
Light Conditions Daylight 63 2.33 1.63 4 4 5Dusk 2 0.06 0.13 0 0 0Dawn 1 0.04 0.11 0 0 0Dark (w/street lights) 17 0.63 0.63 1 2 2Dark (wo/ street lights) 10 0.36 0.36 1 1 1
Surface Conditions Dry 78 2.88 1.91 5 5 5Wet 13 0.48 0.66 1 1 2Others 2 0.06 0.19 0 0 1
Month of Year January 10 0.36 0.43 1 1 1February 7 0.26 0.30 1 1 1March 9 0.33 0.36 1 1 1April 9 0.32 0.39 1 1 1May 11 0.40 0.43 1 1 1June 8 0.28 0.33 1 1 1July 6 0.21 0.29 1 1 1August 4 0.16 0.27 0 0 1September 6 0.21 0.26 0 0 1October 11 0.41 0.45 1 1 1November 9 0.35 0.39 1 1 1December 10 0.36 0.49 1 1 1
Day of Week Monday 12 0.46 0.45 1 1 1Tuesday 13 0.47 0.45 1 1 1Wednesday 11 0.41 0.41 1 1 1Thursday 16 0.58 0.57 1 1 2Friday 10 0.36 0.44 1 1 1Saturday 21 0.78 0.65 1 2 2Sunday 16 0.59 0.54 1 1 1
Hour of Day 00:00 - 06:00 4 0.14 0.27 0 0 106:01 - 09:00 11 0.40 0.47 1 1 109:01 - 11:00 8 0.30 0.36 1 1 111:01 - 13:00 11 0.42 0.45 1 1 113:01 - 15:00 14 0.53 0.56 1 1 215:01 - 18:00 26 0.95 0.95 2 2 318:01 - 24:00 25 0.91 0.81 2 2 2
* Crashes extracted for years 2000, 2001 and 2002 long forms only.** Standard Deviation column represents the standard deviation for mean crashes per year per intersection.
CATEGORY 4
4 Lane x 2 Lane Signalized Intersection, AADT/ Lane On Major Road >= 7,000 (Total LTLs > 2)
Total number of intersections Included - 27
EXPECTED ANNUAL ACCIDENT TABLE - BREVARD COUNTY

178
Total Number Mean Crashes Standard 85th 90th 95th
Crashes Per Year* Per IntersectionPer Year Deviation** Percentile Percentile Percentile
Collision Type Rear End 16 0.96 1.27 2 2 3Head On 0 0.00 0.00 0 0 0Angle 8 0.47 0.60 1 1 2Left Turn 6 0.35 0.42 1 1 1Right Turn 0 0.00 0.00 0 0 0Sideswipe 2 0.10 0.20 0 0 0Pedestrian/Bicycle 0 0.00 0.00 0 0 0Other/Unknown 2 0.14 0.17 0 0 0
Severity No Injury 7 0.41 0.60 1 1 1Possible Injury 12 0.65 0.71 1 1 2Non-Incapacitating Injury 10 0.56 0.64 1 1 2Incapacitating Injury 3 0.15 0.21 0 0 0Fatal Injury 0 0.02 0.08 0 0 0
Light Conditions Daylight 21 1.22 1.23 2 2 3Dusk 0 0.02 0.08 0 0 0Dawn 0 0.02 0.08 0 0 0Dark (w/street lights) 8 0.45 0.46 1 1 1Dark (wo/ street lights) 3 0.18 0.29 1 1 1
Surface Conditions Dry 23 1.37 1.31 3 3 3Wet 9 0.51 0.64 1 1 2Others 0 0.00 0.00 0 0 0
Month of Year January 3 0.19 0.29 1 1 1February 3 0.19 0.29 0 0 1March 4 0.20 0.35 1 1 1April 3 0.19 0.24 0 0 1May 3 0.17 0.29 1 1 1June 4 0.22 0.33 1 1 1July 2 0.11 0.33 0 0 1August 3 0.19 0.27 1 1 1September 2 0.09 0.20 0 0 0October 3 0.17 0.31 1 1 1November 2 0.09 0.20 0 0 0December 2 0.15 0.20 0 0 0
Day of Week Monday 3 0.18 0.31 1 1 1Tuesday 6 0.33 0.37 1 1 1Wednesday 3 0.20 0.24 0 0 1Thursday 4 0.25 0.34 1 1 1Friday 6 0.33 0.50 1 1 1Saturday 8 0.45 0.51 1 1 1Sunday 5 0.27 0.34 1 1 1
Hour of Day 00:00 - 06:00 1 0.06 0.13 0 0 006:01 - 09:00 6 0.37 0.48 1 1 109:01 - 11:00 2 0.12 0.23 0 0 111:01 - 13:00 4 0.22 0.31 1 1 113:01 - 15:00 3 0.16 0.29 0 0 115:01 - 18:00 11 0.65 0.75 1 1 218:01 - 24:00 8 0.45 0.67 1 1 1
* Crashes extracted for years 2000, 2001 and 2002 long forms only.** Standard Deviation column represents the standard deviation for mean crashes per year per intersection.
CATEGORY 5
4 Lane x 2 Lane Signalized Intersection, AADT/ Lane On Major Road < 7,000 (Total LTLs <=2)
Total number of intersections Included - 17
EXPECTED ANNUAL ACCIDENT TABLE - BREVARD COUNTY

179
Total Number Mean Crashes Standard 85th 90th 95th
Crashes Per Year* Per IntersectionPer Year Deviation** Percentile Percentile Percentile
Collision Type Rear End 21 1.02 1.29 2 3 3Head On 1 0.06 0.13 0 0 0Angle 15 0.70 0.69 1 2 2Left Turn 14 0.67 0.65 1 2 2Right Turn 0 0.02 0.07 0 0 0Sideswipe 1 0.06 0.13 0 0 0Pedestrian/Bicycle 2 0.08 0.18 0 0 0Other/Unknown 3 0.16 0.25 0 1 1
Severity No Injury 12 0.56 0.67 1 1 2Possible Injury 20 0.95 1.00 2 2 2Non-Incapacitating Injury 13 0.62 0.78 1 1 2Incapacitating Injury 8 0.40 0.49 1 1 1Fatal Injury 0 0.00 0.00 0 0 0
Light Conditions Daylight 35 1.67 1.57 3 4 5Dusk 1 0.05 0.12 0 0 0Dawn 0 0.02 0.07 0 0 0Dark (w/street lights) 9 0.43 0.53 1 1 1Dark (wo/ street lights) 8 0.37 0.53 1 1 1
Surface Conditions Dry 47 2.24 2.18 4 6 6Wet 6 0.27 0.31 1 1 1Others 0 0.02 0.07 0 0 0
Month of Year January 5 0.25 0.38 1 1 1February 5 0.22 0.38 0 0 1March 9 0.43 0.55 1 1 1April 4 0.17 0.29 0 1 1May 3 0.14 0.31 0 0 1June 4 0.21 0.22 0 0 1July 4 0.17 0.31 1 1 1August 5 0.22 0.27 1 1 1September 4 0.19 0.27 1 1 1October 5 0.25 0.30 1 1 1November 4 0.17 0.23 0 0 1December 7 0.32 0.72 0 0 1
Day of Week Monday 6 0.30 0.39 1 1 1Tuesday 9 0.41 0.42 1 1 1Wednesday 8 0.37 0.55 0 1 1Thursday 7 0.35 0.40 1 1 1Friday 9 0.43 0.47 1 1 1Saturday 10 0.48 0.47 1 1 1Sunday 9 0.43 0.67 1 2 2
Hour of Day 00:00 - 06:00 2 0.11 0.27 0 0 106:01 - 09:00 6 0.29 0.34 1 1 109:01 - 11:00 5 0.24 0.41 0 0 111:01 - 13:00 6 0.30 0.39 1 1 113:01 - 15:00 6 0.30 0.31 1 1 115:01 - 18:00 15 0.71 0.66 2 2 218:01 - 24:00 17 0.81 0.98 2 2 3
* Crashes extracted for years 2000, 2001 and 2002 long forms only.** Standard Deviation column represents the standard deviation for mean crashes per year per intersection.
CATEGORY 6
4 Lane x 2 Lane Signalized Intersection, AADT/ Lane On Major Road < 7,000 (Total LTLs > 2)
Total number of intersections Included - 21
EXPECTED ANNUAL ACCIDENT TABLE - BREVARD COUNTY

180
Total Number Mean Crashes Standard 85th 90th 95th
Crashes Per Year* Per IntersectionPer Year Deviation** Percentile Percentile Percentile
Collision Type Rear End 9 3.00 2.60 5 5 5Head On 0 0.00 0.00 0 0 0Angle 3 0.89 0.77 1 1 1Left Turn 2 0.67 0.88 1 1 2Right Turn 0 0.00 0.00 0 0 0Sideswipe 1 0.33 0.33 1 1 1Pedestrian/Bicycle 0 0.00 0.00 0 0 0Other/Unknown 0 0.11 0.19 0 0 0
Severity No Injury 3 1.11 1.02 2 2 2Possible Injury 6 2.11 2.17 4 4 4Non-Incapacitating Injury 3 1.00 0.88 2 2 2Incapacitating Injury 1 0.44 0.77 1 1 1Fatal Injury 0 0.00 0.00 0 0 0
Light Conditions Daylight 8 2.78 0.24 4 4 4Dusk 1 0.22 0.47 1 1 1Dawn 0 0.11 0.24 0 0 0Dark (w/street lights) 2 0.67 0.47 1 1 1Dark (wo/ street lights) 3 0.89 0.47 2 2 2
Surface Conditions Dry 12 4.00 0.00 6 6 6Wet 2 0.67 0.47 1 1 1Others 0 0.00 0.00 0 0 0
Month of Year January 1 0.44 0.47 1 1 1February 1 0.33 0.24 1 1 1March 3 1.00 0.71 2 2 2April 0 0.11 0.24 0 0 0May 1 0.33 0.24 1 1 1June 1 0.33 0.24 1 1 1July 1 0.22 0.47 1 1 1August 1 0.33 0.24 1 1 1September 1 0.33 0.24 1 1 1October 2 0.56 0.71 1 1 1November 2 0.56 0.24 1 1 1December 1 0.44 0.00 1 1 1
Day of Week Monday 1 0.44 0.51 1 1 1Tuesday 1 0.33 0.33 1 1 1Wednesday 2 0.67 0.67 1 1 1Thursday 2 0.56 0.69 1 1 1Friday 2 0.78 0.84 1 1 2Saturday 3 1.00 1.00 2 2 2Sunday 4 1.22 1.07 2 2 2
Hour of Day 00:00 - 06:00 1 0.44 0.47 1 1 106:01 - 09:00 1 0.44 0.47 1 1 109:01 - 11:00 2 0.56 0.24 1 1 111:01 - 13:00 3 0.89 0.47 2 2 213:01 - 15:00 3 0.89 0.94 2 2 215:01 - 18:00 2 0.56 0.71 1 1 118:01 - 24:00 4 1.22 0.24 2 2 2
* Crashes extracted for years 2000, 2001 and 2002 long forms only.** Standard Deviation column represents the standard deviation for mean crashes per year per intersection.
Total number of intersections Included - 3
CATEGORY 7
4 Lane x 4 Lane Signalized Intersection, AADT/ Lane On Major Road >= 7,500
EXPECTED ANNUAL ACCIDENT TABLE - BREVARD COUNTY

181
Total Number Mean Crashes Standard 85th 90th 95th
Crashes Per Year* Per IntersectionPer Year Deviation** Percentile Percentile Percentile
Collision Type Rear End 15 1.88 0.94 2 3 3Head On 1 0.08 0.47 0 0 0Angle 5 0.63 0.94 1 1 2Left Turn 7 0.88 2.36 1 2 3Right Turn 0 0.04 0.00 0 0 0Sideswipe 1 0.17 0.24 0 0 1Pedestrian/Bicycle 2 0.25 0.24 0 1 1Other/Unknown 3 0.38 0.47 1 1 1
Severity No Injury 5 0.58 1.41 2 2 2Possible Injury 14 1.79 3.54 3 3 4Non-Incapacitating Injury 4 0.50 0.47 1 1 1Incapacitating Injury 4 0.54 1.18 1 1 1Fatal Injury 0 0.04 0.00 0 0 0
Light Conditions Daylight 17 2.13 0.71 3 4 4Dusk 1 0.08 0.24 0 0 0Dawn 0 0.04 0.00 0 0 0Dark (w/street lights) 6 0.79 1.65 1 2 2Dark (wo/ street lights) 3 0.42 1.18 0 1 1
Surface Conditions Dry 24 3.00 3.30 4 5 7Wet 3 0.42 0.00 1 1 1Others 0 0.04 0.00 0 0 0
Month of Year January 5 0.63 0.71 1 1 2February 1 0.17 0.47 0 0 1March 2 0.21 0.24 0 0 1April 4 0.54 0.47 1 1 1May 3 0.42 0.47 1 1 1June 2 0.21 0.00 0 0 0July 2 0.25 0.47 1 1 1August 3 0.38 0.94 0 1 1September 4 0.46 0.24 1 1 1October 2 0.25 0.47 1 1 1November 2 0.29 0.24 1 1 1December 4 0.50 0.94 1 1 1
Day of Week Monday 3 0.38 0.24 1 1 1Tuesday 6 0.71 0.94 1 1 2Wednesday 5 0.58 0.24 2 2 2Thursday 6 0.79 0.24 1 1 2Friday 5 0.67 0.47 1 1 1Saturday 5 0.67 1.18 2 2 2Sunday 4 0.50 0.94 1 1 2
Hour of Day 00:00 - 06:00 2 0.25 0.71 0 1 106:01 - 09:00 4 0.50 0.24 1 1 109:01 - 11:00 3 0.38 0.47 1 1 111:01 - 13:00 3 0.42 1.18 0 1 113:01 - 15:00 5 0.63 1.18 1 2 215:01 - 18:00 7 0.92 0.47 1 2 218:01 - 24:00 10 1.21 0.00 2 2 2
* Crashes extracted for years 2000, 2001 and 2002 long forms only.** Standard Deviation column represents the standard deviation for mean crashes per year per intersection.
Total number of intersections Included - 8
CATEGORY 8
4 Lane x 4 Lane Signalized Intersection, AADT/ Lane On Major Road < 7,500
EXPECTED ANNUAL ACCIDENT TABLE - BREVARD COUNTY

182
Total Number Mean Crashes Standard 85th 90th 95th
Crashes Per Year* Per IntersectionPer Year Deviation** Percentile Percentile Percentile
Collision Type Rear End 14 1.95 2.36 4 5 5Head On 0 0.05 0.24 0 0 0Angle 5 0.71 1.41 1 2 2Left Turn 2 0.29 0.24 1 1 1Right Turn 0 0.05 0.00 0 0 0Sideswipe 1 0.19 0.24 0 1 1Pedestrian/Bicycle 1 0.10 0.00 0 0 0Other/Unknown 0 0.00 0.00 0 0 0
Severity No Injury 5 0.71 0.00 1 2 2Possible Injury 8 1.14 0.71 2 2 3Non-Incapacitating Injury 7 1.00 0.24 2 2 3Incapacitating Injury 1 0.19 0.00 0 0 1Fatal Injury 0 0.00 0.00 0 0 0
Light Conditions Daylight 15 2.14 3.06 5 5 5Dusk 0 0.00 0.00 0 0 0Dawn 0 0.05 0.00 0 0 0Dark (w/street lights) 5 0.67 0.94 1 2 2Dark (wo/ street lights) 1 0.19 0.24 0 0 1
Surface Conditions Dry 19 2.67 4.24 6 6 6Wet 3 0.38 0.00 1 1 1Others 0 0.00 0.00 0 0 0
Month of Year January 1 0.10 0.00 0 0 0February 4 0.57 0.24 1 1 2March 4 0.62 0.94 1 2 2April 3 0.48 0.47 1 1 1May 1 0.19 0.24 0 0 1June 1 0.14 0.47 0 0 1July 2 0.29 0.71 1 1 1August 1 0.19 0.47 0 0 1September 2 0.33 0.24 0 1 1October 1 0.14 0.24 0 0 1November 1 0.10 0.47 0 0 0December 1 0.19 0.00 0 0 0
Day of Week Monday 2 0.33 0.94 1 1 1Tuesday 3 0.43 0.47 1 1 1Wednesday 3 0.43 0.94 1 1 1Thursday 3 0.48 0.71 1 1 1Friday 3 0.38 0.24 1 1 1Saturday 5 0.76 0.71 2 2 2Sunday 4 0.52 0.47 1 1 2
Hour of Day 00:00 - 06:00 1 0.14 0.47 0 0 106:01 - 09:00 2 0.33 0.47 1 1 109:01 - 11:00 2 0.24 0.71 1 1 111:01 - 13:00 3 0.43 0.47 1 1 213:01 - 15:00 3 0.38 0.00 0 1 215:01 - 18:00 7 1.05 1.65 2 2 318:01 - 24:00 5 0.76 0.71 2 2 2
* Crashes extracted for years 2000, 2001 and 2002 long forms only.** Standard Deviation column represents the standard deviation for mean crashes per year per intersection.
CATEGORY 10
EXPECTED ANNUAL ACCIDENT TABLE - BREVARD COUNTY
Total number of intersections Included - 7
6 Lane x 2 Lane Signalized Intersection, AADT/ Lane On Major Road <7,500

183
Total Number Mean Crashes Standard 85th 90th 95th
Crashes Per Year* Per IntersectionPer Year Deviation** Percentile Percentile Percentile
Collision Type Rear End 11 5.67 1.41 6 6 7Head On 0 0.17 0.24 0 0 0Angle 2 1.00 0.00 1 1 1Left Turn 2 0.83 0.71 1 1 1Right Turn 0 0.00 0.00 0 0 0Sideswipe 1 0.33 0.47 1 1 1Pedestrian/Bicycle 0 0.17 0.24 0 0 0Other/Unknown 1 0.50 0.71 1 1 1
Severity No Injury 3 1.50 0.71 2 2 2Possible Injury 8 4.00 1.89 5 5 5Non-Incapacitating Injury 3 1.67 1.41 2 2 3Incapacitating Injury 1 1.00 0.00 1 1 1Fatal Injury 0 0.00 0.00 0 0 0
Light Conditions Daylight 8 4.00 0.47 4 4 4Dusk 2 0.83 0.24 1 1 1Dawn 1 0.33 0.00 0 0 0Dark (w/street lights) 4 2.17 0.24 2 2 2Dark (wo/ street lights) 1 0.33 0.00 0 0 0
Surface Conditions Dry 13 6.67 0.47 7 7 7Wet 2 0.83 0.24 1 1 1Others 0 0.17 0.24 0 0 0
Month of Year January 1 0.67 0.47 1 1 1February 1 0.67 0.00 1 1 1March 3 1.50 0.24 2 2 2April 1 0.67 0.94 1 1 1May 1 0.67 0.94 1 1 1June 1 0.67 0.47 1 1 1July 0 0.17 0.24 0 0 0August 1 0.67 0.47 1 1 1September 1 0.50 0.24 1 1 1October 1 0.33 0.00 0 0 0November 2 1.00 0.94 1 2 2December 2 1.17 1.18 2 2 2
Day of Week Monday 4 1.83 0.24 2 2 2Tuesday 2 1.17 1.18 2 2 2Wednesday 3 1.33 0.47 2 2 2Thursday 2 1.00 0.47 1 1 1Friday 2 1.17 0.24 1 1 1Saturday 2 0.83 0.24 1 1 1Sunday 3 1.33 0.00 1 1 1
Hour of Day 00:00 - 06:00 1 0.33 0.47 1 1 106:01 - 09:00 1 0.33 0.00 0 0 009:01 - 11:00 2 0.83 0.24 1 1 111:01 - 13:00 1 0.33 0.00 0 0 013:01 - 15:00 2 1.17 0.71 2 2 215:01 - 18:00 5 2.50 0.24 3 3 318:01 - 24:00 6 3.17 0.71 4 4 4
* Crashes extracted for years 2000, 2001 and 2002 long forms only.** Standard Deviation column represents the standard deviation for mean crashes per year per intersection.
Total number of intersections Included - 2
CATEGORY 11
6 Lane x 4 Lane and 6 Lane x 6 Lane Signalized Intersection
EXPECTED ANNUAL ACCIDENT TABLE - BREVARD COUNTY

184
Total Number Mean Crashes Standard 85th 90th 95th
Crashes Per Year* Per IntersectionPer Year Deviation** Percentile Percentile Percentile
Collision Type Rear End 12 1.37 1.89 3 3 4Head On 0 0.00 0.00 0 0 0Angle 4 0.41 1.65 1 1 2Left Turn 1 0.15 0.24 0 0 1Right Turn 0 0.04 0.00 0 0 0Sideswipe 1 0.11 0.24 0 0 0Pedestrian/Bicycle 0 0.04 0.24 0 0 0Other/Unknown 3 0.30 0.71 1 1 1
Severity No Injury 5 0.59 1.65 1 2 2Possible Injury 9 1.00 0.24 3 3 3Non-Incapacitating Injury 4 0.41 1.41 1 1 1Incapacitating Injury 2 0.22 0.47 1 1 1Fatal Injury 0 0.00 0.00 0 0 0
Light Conditions Daylight 12 1.37 1.18 3 3 3Dusk 1 0.15 0.00 0 0 0Dawn 0 0.04 0.24 0 0 0Dark (w/street lights) 4 0.44 0.00 1 1 1Dark (wo/ street lights) 2 0.22 0.71 1 1 1
Surface Conditions Dry 17 1.93 2.12 4 4 5Wet 2 0.33 0.00 1 1 1Others 1 0.11 0.00 0 0 0
Month of Year January 2 0.19 0.47 1 1 1February 3 0.33 0.24 1 1 1March 3 0.30 0.24 1 1 1April 2 0.19 0.71 1 1 1May 2 0.19 0.71 0 0 1June 1 0.11 0.00 0 0 0July 3 0.30 0.24 1 1 1August 1 0.15 0.00 0 0 1September 1 0.15 0.00 0 0 1October 1 0.15 0.00 0 0 0November 1 0.07 0.47 0 0 0December 3 0.30 0.00 1 1 1
Day of Week Monday 2 0.19 0.24 0 0 1Tuesday 3 0.33 0.00 1 1 1Wednesday 3 0.33 0.00 1 1 1Thursday 5 0.59 0.71 1 1 1Friday 3 0.30 0.94 1 1 1Saturday 4 0.41 0.94 1 1 1Sunday 2 0.26 0.24 1 1 1
Hour of Day 00:00 - 06:00 2 0.19 0.47 0 0 106:01 - 09:00 2 0.22 0.47 1 1 109:01 - 11:00 1 0.15 0.24 0 0 111:01 - 13:00 2 0.19 0.00 1 1 113:01 - 15:00 3 0.37 0.47 1 1 115:01 - 18:00 7 0.74 1.65 2 2 318:01 - 24:00 5 0.56 0.24 1 1 2
* Crashes extracted for years 2000, 2001 and 2002 long forms only.** Standard Deviation column represents the standard deviation for mean crashes per year per intersection.
Total number of intersections Included - 9
CATEGORY 12
T- Intersection, Signalized, AADT/ Lane On Major Road >=7500
EXPECTED ANNUAL ACCIDENT TABLE - BREVARD COUNTY

185
Total Number Mean Crashes Standard 85th 90th 95th
Crashes Per Year* Per IntersectionPer Year Deviation** Percentile Percentile Percentile
Collision Type Rear End 14 0.91 1.29 3 3 3Head On 0 0.02 0.09 0 0 0Angle 3 0.22 0.35 1 1 1Left Turn 3 0.18 0.28 1 0 1Right Turn 0 0.02 0.09 0 0 0Sideswipe 1 0.07 0.19 0 0 0Pedestrian/Bicycle 0 0.02 0.09 0 0 0Other/Unknown 2 0.11 0.21 1 0 0
Severity No Injury 6 0.38 0.59 1 1 2Possible Injury 7 0.47 0.55 2 1 1Non-Incapacitating Injury 5 0.36 0.53 2 1 1Incapacitating Injury 2 0.11 0.21 1 0 0Fatal Injury 0 0.02 0.09 0 0 0
Light Conditions Daylight 13 0.84 1.15 3 3 3Dusk 2 0.11 0.27 0 0 1Dawn 0 0.00 0.00 0 0 0Dark (w/street lights) 3 0.22 0.33 1 1 1Dark (wo/ street lights) 2 0.16 0.21 1 0 0
Surface Conditions Dry 17 1.11 1.26 4 3 3Wet 3 0.22 0.39 1 1 1Others 0 0.00 0.00 0 0 0
Month of Year January 4 0.29 0.53 1 1 1February 1 0.09 0.20 0 0 0March 3 0.18 0.28 1 1 1April 2 0.16 0.35 0 1 1May 1 0.09 0.15 1 0 0June 2 0.16 0.38 0 1 1July 1 0.09 0.20 0 0 0August 2 0.13 0.17 1 0 0September 2 0.11 0.24 0 1 1October 1 0.04 0.12 0 0 0November 1 0.09 0.20 0 0 0December 2 0.11 0.16 1 0 0
Day of Week Monday 2 0.11 0.27 0 0 1Tuesday 5 0.33 0.49 1 1 1Wednesday 4 0.27 0.36 1 1 1Thursday 4 0.24 0.32 1 1 1Friday 3 0.22 0.35 0 0 1Saturday 3 0.18 0.25 0 1 1Sunday 3 0.18 0.25 0 1 1
Hour of Day 00:00 - 06:00 1 0.07 0.14 0 0 006:01 - 09:00 2 0.11 0.21 1 0 009:01 - 11:00 2 0.13 0.25 1 1 111:01 - 13:00 1 0.04 0.12 0 0 013:01 - 15:00 3 0.18 0.33 1 1 115:01 - 18:00 9 0.58 0.82 2 2 218:01 - 24:00 6 0.42 0.60 1 1 2
* Crashes extracted for years 2000, 2001 and 2002 long forms only.** Standard Deviation column represents the standard deviation for mean crashes per year per intersection.
Total number of intersections Included - 15
CATEGORY 13
T - Intersection, Signalized, AADT/ Lane On Major Road <7,500
EXPECTED ANNUAL ACCIDENT TABLE - BREVARD COUNTY

186
Total Number Mean Crashes Standard 85th 90th 95th
Crashes Per Year* Per IntersectionPer Year Deviation** Percentile Percentile Percentile
Collision Type Rear End 6 1.00 0.00 2 2 3Head On 0 0.00 0.00 0 0 0Angle 2 0.39 0.47 1 1 1Left Turn 2 0.33 0.00 1 1 1Right Turn 0 0.00 0.00 0 0 0Sideswipe 0 0.00 0.00 0 0 0Pedestrian/Bicycle 0 0.00 0.00 0 0 0Other/Unknown 0 0.06 0.24 0 0 0
Severity No Injury 1 0.22 0.00 0 1 1Possible Injury 5 0.89 0.94 2 2 2Non-Incapacitating Injury 2 0.33 0.00 0 1 1Incapacitating Injury 1 0.17 0.00 0 1 1Fatal Injury 0 0.00 0.00 0 0 0
Light Conditions Daylight 7 1.11 0.71 2 2 2Dusk 0 0.06 0.00 0 0 0Dawn 0 0.00 0.00 0 0 0Dark (w/street lights) 2 0.33 0.24 1 1 1Dark (wo/ street lights) 1 0.11 0.00 0 0 0
Surface Conditions Dry 6 1.06 0.71 2 3 3Wet 3 0.44 0.24 1 1 1Others 1 0.11 0.00 0 0 0
Month of Year January 1 0.22 0.00 0 1 1February 1 0.11 0.24 0 0 0March 1 0.17 0.00 0 1 1April 1 0.17 0.47 0 1 1May 0 0.06 0.00 0 0 0June 1 0.11 0.24 0 0 0July 1 0.11 0.47 0 0 1August 0 0.06 0.00 0 0 0September 1 0.17 0.00 0 0 0October 1 0.17 0.47 0 1 1November 2 0.28 0.24 0 1 1December 1 0.17 0.47 0 1 1
Day of Week Monday 2 0.33 0.24 1 1 1Tuesday 2 0.28 0.47 1 1 1Wednesday 2 0.39 0.47 1 1 1Thursday 1 0.22 0.47 1 1 1Friday 1 0.17 0.24 0 0 0Saturday 1 0.22 0.00 0 0 0Sunday 1 0.17 0.24 0 1 1
Hour of Day 00:00 - 06:00 1 0.17 0.24 0 0 006:01 - 09:00 0 0.00 0.00 0 0 009:01 - 11:00 2 0.28 0.47 0 1 111:01 - 13:00 2 0.33 0.24 1 1 113:01 - 15:00 1 0.11 0.24 0 0 015:01 - 18:00 3 0.44 0.00 1 1 118:01 - 24:00 3 0.44 0.00 1 1 1
* Crashes extracted for years 2000, 2001 and 2002 long forms only.** Standard Deviation column represents the standard deviation for mean crashes per year per intersection.
CATEGORY 17
Ramp Intersection, Signalized, AADT/ Lane On Major Road >= 7,500
Total number of intersections Included - 6
EXPECTED ANNUAL ACCIDENT TABLE - BREVARD COUNTY

187
Total Number Mean Crashes Standard 85th 90th 95th
Crashes Per Year* Per IntersectionPer Year Deviation** Percentile Percentile Percentile
Collision Type Rear End 3 0.50 0.35 1 1 1Head On 0 0.00 0.00 0 0 0Angle 2 0.39 0.49 1 1 1Left Turn 4 0.67 0.99 1 2 2Right Turn 0 0.00 0.00 0 0 0Sideswipe 0 0.00 0.00 0 0 0Pedestrian/Bicycle 0 0.06 0.14 0 0 0Other/Unknown 0 0.00 0.00 0 0 0
Severity No Injury 1 0.17 0.18 0 0 0Possible Injury 3 0.50 0.91 1 1 2Non-Incapacitating Injury 4 0.61 0.71 1 2 2Incapacitating Injury 1 0.00 0.00 0 0 0Fatal Injury 0 0.00 0.00 0 0 0
Light Conditions Daylight 5 0.89 0.62 2 2 2Dusk 0 0.00 0.00 0 0 0Dawn 0 0.00 0.00 0 0 0Dark (w/street lights) 2 0.39 0.49 1 1 1Dark (wo/ street lights) 1 0.17 0.41 0 1 1
Surface Conditions Dry 8 1.33 1.28 2 3 3Wet 1 0.11 0.17 0 0 0Others 0 0.00 0.00 0 0 0
Month of Year January 1 0.22 0.40 1 1 1February 1 0.11 0.17 0 0 0March 1 0.11 0.27 0 0 1April 0 0.06 0.14 0 0 0May 0 0.06 0.14 0 0 0June 1 0.11 0.17 0 0 0July 0 0.06 0.14 0 0 0August 2 0.33 0.52 1 1 1September 0 0.06 0.14 0 0 0October 1 0.22 0.17 0 0 0November 2 0.28 0.25 0 1 1December 0 0.00 0.00 0 0 0
Day of Week Monday 0 0.06 0.14 0 0 0Tuesday 2 0.33 0.56 1 1 1Wednesday 1 0.11 0.17 0 0 0Thursday 2 0.39 0.33 1 1 1Friday 1 0.17 0.28 0 1 1Saturday 2 0.28 0.25 0 1 1Sunday 2 0.28 0.39 1 1 1
Hour of Day 00:00 - 06:00 0 0.06 0.14 0 0 006:01 - 09:00 1 0.22 0.40 1 1 109:01 - 11:00 0 0.06 0.14 0 0 011:01 - 13:00 1 0.22 0.27 0 1 113:01 - 15:00 1 0.11 0.17 0 0 015:01 - 18:00 2 0.33 0.30 1 1 118:01 - 24:00 3 0.56 0.54 1 1 1
* Crashes extracted for years 2000, 2001 and 2002 long forms only.** Standard Deviation column represents the standard deviation for mean crashes per year per intersection.
Total number of intersections Included - 6
CATEGORY 18
Ramp Intersection, Signalized, AADT/ Lane On Major Road <7,500
EXPECTED ANNUAL ACCIDENT TABLE - BREVARD COUNTY

188
APPENDIX B
19 CATEGORY CRASH PROFILE TABLES FOR CITY OF ORLANDO

189
Total Number Mean Crashes
Crashes Per Year* Per IntersectionPer Year
Collision Type Rear End 19 1.58 1.71 3.3 3.3 4.2Head On 0 0.03 0.10 0.0 0.0 0.2Angle 9 0.75 1.03 1.1 1.3 2.4Left Turn 10 0.83 1.03 2.1 2.3 2.5Right Turn 0 0.00 0.00 0.0 0.0 0.0Sideswipe 4 0.36 0.50 0.7 0.7 1.1Pedestrian/Bicycle 2 0.14 0.22 0.3 0.3 0.5Other 2 0.19 0.22 0.3 0.3 0.5Unknown 2 0.17 0.30 0.3 0.3 0.6
Severity PDO Crashes 11 0.89 0.95 2.3 2.3 2.3Injury 12 1.03 0.85 1.9 2.3 2.5Non-Incapacitating Injury 9 0.72 1.00 1.35 1.90 2.6Incapacitating Injury 3 0.22 0.41 0.45 0.63 0.97Fatal Crashes 0 0.03 0.10 0.0 0.0 0.2
Light Conditions Daylight 32 2.67 2.59 4.6 6.1 7.4Dusk 1 0.08 0.15 0.3 0.3 0.3Dawn 1 0.06 0.13 0.1 0.3 0.3Dark (w/street lights) 15 1.22 1.42 2.7 3.2 3.6Dark (wo/street lights) 0 0.03 0.10 0.0 0.0 0.2
Surface Condition Dry 41 3.44 3.36 6.1 6.3 8.7Wet 7 0.56 0.89 1.1 1.3 2.1Others 1 0.06 0.13 0.1 0.3 0.3
Month of year January 3 0.25 0.38 0.3 0.3 0.8February 4 0.31 0.48 0.5 0.6 1.1March 4 0.31 0.33 0.7 0.7 0.8April 5 0.39 0.47 1.0 1.0 1.2May 2 0.19 0.26 0.5 0.6 0.7June 4 0.36 0.59 0.7 0.7 1.3July 5 0.42 0.62 1.0 1.6 1.7August 5 0.39 0.47 0.8 1.0 1.2September 5 0.44 0.57 0.9 1.3 1.5October 3 0.28 0.31 0.5 0.6 0.8November 3 0.28 0.47 0.8 1.0 1.2December 5 0.44 0.43 1.0 1.0 1.0
Day of week Monday 5 0.42 0.47 0.7 0.7 1.1Tuesday 10 0.81 1.08 1.7 2.2 2.8Wednesday 8 0.67 0.78 1.8 2.0 2.0Thursday 7 0.58 0.57 1.1 1.3 1.5Friday 5 0.44 0.62 1.0 1.0 1.5Saturday 5 0.44 0.64 0.9 1.3 1.6Sunday 8 0.69 1.00 1.6 2.5 2.7
Hour of day 00:00 - 06:00 5 0.42 0.59 0.8 1.0 1.506:01 - 09:00 6 0.47 0.50 1.1 1.3 1.309:01 - 11:00 3 0.25 0.35 0.7 0.7 0.811:01 - 13:00 7 0.56 0.77 1.6 1.9 2.013:01 - 15:00 6 0.53 0.48 1.1 1.3 1.315:01 - 18:00 10 0.81 0.94 1.7 1.7 2.318:01 - 24:00 12 1.03 1.21 2.6 2.9 3.2
* Crashes extracted for years 1999, 2000 and 2001 long forms only.** Standard Deviation column represents the standard deviation for mean crashes per year per intersection.
CATEGORY 1
EXPECTED ANNUAL CRASH VALUE TABLE - CITY OF ORLANDO2 Lane x 2 Lane Intersection, Signalized, AADT/lane for Major Road ≥ 5000
Total number Intersections - 12
95th PercentileStandard Deviation 85th Percentile 90th Percentile

190
Total Number Mean Crashes
Crashes Per Year* Per IntersectionPer Year
Collision Type Rear End 14 0.55 0.97 1.2 1.7 2.4Head On 0 0.00 0.00 0.0 0.0 0.0Angle 7 0.26 0.37 0.4 0.7 0.7Left Turn 5 0.19 0.41 0.7 0.7 0.9Right Turn 0 0.00 0.00 0.0 0.0 0.0Sideswipe 2 0.08 0.22 0.1 0.3 0.3Pedestrian/Bicycle 1 0.05 0.15 0.0 0.2 0.3Other 3 0.13 0.30 0.3 0.3 0.6Unknown 2 0.06 0.13 0.3 0.3 0.3
Severity PDO Crashes 7 0.27 0.57 0.4 1.0 1.3Injury 7 0.28 0.47 0.8 1.0 1.3Non-Incapacitating Injury 8 0.31 0.39 0.67 0.83 1Incapacitating Injury 1 0.05 0.12 0.08 0.33 0.33Fatal Crashes 0 0.00 0.00 0.0 0.0 0.0
Light Conditions Daylight 23 0.88 1.17 2.1 2.3 2.3Dusk 1 0.03 0.09 0.0 0.0 0.3Dawn 0 0.01 0.07 0.0 0.0 0.0Dark (w/street lights) 10 0.40 0.73 1.1 1.5 1.9Dark (wo/street lights) 0 0.00 0.00 0.0 0.0 0.0
Surface Condition Dry 30 1.17 1.60 2.8 3.5 3.9Wet 4 0.15 0.25 0.4 0.7 0.7Others 0 0.01 0.07 0.0 0.0 0.0
Month of year January 6 0.23 0.35 0.4 0.7 0.9February 2 0.08 0.22 0.1 0.3 0.3March 4 0.17 0.36 0.4 0.7 0.9April 3 0.10 0.26 0.1 0.5 0.7May 3 0.13 0.25 0.3 0.3 0.6June 2 0.09 0.20 0.3 0.3 0.6July 2 0.09 0.18 0.3 0.3 0.3August 3 0.13 0.25 0.3 0.3 0.6September 1 0.04 0.11 0.0 0.2 0.3October 3 0.10 0.21 0.3 0.3 0.6November 2 0.09 0.18 0.3 0.3 0.3December 2 0.08 0.22 0.1 0.3 0.3
Day of week Monday 1 0.05 0.12 0.1 0.3 0.3Tuesday 7 0.26 0.37 0.8 1.0 1.0Wednesday 4 0.14 0.25 0.3 0.3 0.6Thursday 5 0.21 0.30 0.7 0.7 0.7Friday 6 0.24 0.43 0.7 0.8 1.0Saturday 6 0.23 0.43 0.4 0.7 0.7Sunday 5 0.19 0.35 0.4 0.7 0.9
Hour of day 00:00 - 06:00 4 0.17 0.40 0.3 0.3 0.306:01 - 09:00 3 0.12 0.28 0.3 0.3 0.309:01 - 11:00 2 0.09 0.22 0.3 0.3 0.311:01 - 13:00 3 0.13 0.23 0.3 0.3 0.313:01 - 15:00 6 0.23 0.40 0.4 0.7 0.915:01 - 18:00 8 0.31 0.42 0.8 1.0 1.318:01 - 24:00 7 0.28 0.56 0.7 0.8 1.3
* Crashes extracted for years 1999, 2000 and 2001 long forms only.** Standard Deviation column represents the standard deviation for mean crashes per year per intersection.
CATEGORY 2
EXPECTED ANNUAL CRASH VALUE TABLE - CITY OF ORLANDO2 Lane x 2 Lane Intersection, Signalized, AADT/lane for Major Road < 5000
Total number Intersections - 26
95th PercentileStandard Deviation 85th Percentile 90th Percentile

191
Total Number Mean Crashes
Crashes Per Year* Per IntersectionPer Year
Collision Type Rear End 6 5.67 0.00 5.7 5.7 5.7Head On 0 0.00 0.00 0.0 5.7 5.7Angle 2 1.67 0.00 1.7 5.7 5.7Left Turn 2 1.67 0.00 1.7 5.7 5.7Right Turn 0 0.00 0.00 0.0 5.7 5.7Sideswipe 2 2.00 0.00 2.0 5.7 5.7Pedestrian/Bicycle 0 0.00 0.00 0.0 0.0 0.0Other 1 0.67 0.00 0.7 5.7 5.7Unknown 2 2.00 0.00 2.0 5.7 5.7
Severity PDO Crashes 5 5.00 0.00 5.0 5.0 5.0Injury 3 2.67 0.00 2.7 2.7 2.7Non-Incapacitating Injury 2 1.67 0.00 1.67 1.67 1.67Incapacitating Injury 0 0.33 0.00 0.33 0.33 0.33Fatal Crashes 0 0.33 0.00 0.3 0.3 0.3
Light Conditions Daylight 8 8.00 0.00 8.0 8.0 8.0Dusk 1 0.67 0.00 0.7 0.7 0.7Dawn 0 0.33 0.00 0.3 0.3 0.3Dark (w/street lights) 5 4.67 0.00 4.7 4.7 4.7Dark (wo/street lights) 0 0.00 0.00 0.0 0.0 0.0
Surface Condition Dry 12 12.00 0.00 12.0 12.0 12.0Wet 2 1.67 0.00 1.7 1.7 1.7Others 0 0.00 0.00 0.0 0.0 0.0
Month of year January 1 1.00 0.00 1.0 1.0 1.0February 0 0.33 0.00 0.3 0.3 0.3March 2 1.67 0.00 1.7 1.7 1.7April 2 2.33 0.00 2.3 2.3 2.3May 0 0.33 0.00 0.3 0.3 0.3June 2 1.67 0.00 1.7 1.7 1.7July 1 0.67 0.00 0.7 0.7 0.7August 2 1.67 0.00 1.7 1.7 1.7September 2 1.67 0.00 1.7 1.7 1.7October 0 0.33 0.00 0.3 0.3 0.3November 1 1.00 0.00 1.0 1.0 1.0December 1 1.00 0.00 1.0 1.0 1.0
Day of week Monday 0 0.33 0.00 0.3 0.3 0.3Tuesday 3 2.67 0.00 2.7 2.7 2.7Wednesday 2 1.67 0.00 1.7 1.7 1.7Thursday 1 1.00 0.00 1.0 1.0 1.0Friday 2 1.67 0.00 1.7 1.7 1.7Saturday 3 3.33 0.00 3.3 3.3 3.3Sunday 3 3.00 0.00 3.0 3.0 3.0
Hour of day 00:00 - 06:00 3 2.67 0.00 2.7 2.7 2.706:01 - 09:00 1 0.67 0.00 0.7 0.7 0.709:01 - 11:00 2 2.33 0.00 2.3 2.3 2.311:01 - 13:00 1 1.00 0.00 1.0 1.0 1.013:01 - 15:00 1 1.00 0.00 1.0 1.0 1.015:01 - 18:00 3 2.67 0.00 2.7 2.7 2.718:01 - 24:00 3 3.33 0.00 3.3 3.3 3.3
* Crashes extracted for years 1999, 2000 and 2001 long forms only.** Standard Deviation column represents the standard deviation for mean crashes per year per intersection.
CATEGORY 3
EXPECTED ANNUAL CRASH VALUE TABLE - CITY OF ORLANDO4 Lane x 2 Lane Intersection, Signalized, AADT/lane for Major Road ≥ 7000 (LT lanes ≤ 2)
Total number Intersections - 1
95th PercentileStandard Deviation 85th Percentile 90th Percentile

192
Total Number Mean Crashes
Crashes Per Year* Per IntersectionPer Year
Collision Type Rear End 191 2.54 3.42 5.6 6.9 11.0Head On 1 0.01 0.07 0.0 0.0 0.0Angle 70 0.93 0.96 1.7 2.4 2.7Left Turn 45 0.60 0.71 1.3 1.7 2.0Right Turn 0 0.00 0.00 0.0 0.0 0.0Sideswipe 29 0.39 0.56 0.7 1.0 1.7Pedestrian/Bicycle 9 0.12 0.27 0.3 0.3 0.7Other 11 0.14 0.26 0.3 0.5 0.7Unkown 11 0.15 0.29 0.3 0.3 0.7
Severity PDO Crashes 71 0.95 1.23 2.0 2.3 3.4Injury 87 1.16 1.42 2.6 3.0 3.3Non-Incapacitating Injury 86 1.14 1.16 2.00 2.67 3.77Incapacitating Injury 19 0.26 0.39 0.67 0.67 1.00Fatal Crashes 1 0.01 0.05 0.0 0.0 0.0
Light Conditions Daylight 253 3.38 3.17 7.3 7.7 9.8Dusk 10 0.13 0.24 0.3 0.3 0.7Dawn 6 0.08 0.20 0.3 0.3 0.3Dark (w/street lights) 90 1.20 1.71 2.0 3.2 4.9Dark (wo/street lights) 8 0.10 0.39 0.0 0.2 0.5
Surface Condition Dry 317 4.23 4.28 8.6 10.0 12.6Wet 45 0.60 0.87 1.3 1.9 2.4Others 1 0.01 0.07 0.0 0.0 0.0
Month of year January 24 0.32 0.43 0.7 1.0 1.3February 29 0.38 0.52 1.0 1.3 1.4March 25 0.33 0.55 0.7 0.7 1.3April 36 0.48 0.61 1.0 1.0 1.4May 30 0.40 0.51 1.0 1.0 1.3June 27 0.36 0.50 0.7 0.9 1.4July 31 0.41 0.63 1.0 1.3 1.7August 32 0.42 0.56 1.0 1.0 1.3September 34 0.45 0.62 1.0 1.2 1.8October 36 0.48 0.57 1.0 1.2 1.3November 31 0.41 0.56 1.0 1.0 1.3December 33 0.44 0.55 1.0 1.2 1.4
Day of week Monday 42 0.56 0.84 1.3 1.7 2.3Tuesday 58 0.77 0.76 1.6 1.9 2.0Wednesday 56 0.75 0.91 1.6 2.0 2.7Thursday 56 0.75 0.89 1.3 1.9 2.5Friday 52 0.70 0.78 1.3 1.9 2.4Saturday 54 0.72 0.83 2.0 2.0 2.3Sunday 48 0.64 0.83 1.7 1.7 2.0
Hour of day 00:00 - 06:00 31 0.41 0.69 1.0 1.0 1.706:01 - 09:00 43 0.57 0.63 1.0 1.3 2.009:01 - 11:00 27 0.36 0.47 1.0 1.0 1.311:01 - 13:00 47 0.62 0.76 1.3 1.3 2.113:01 - 15:00 49 0.65 0.66 1.3 1.7 1.815:01 - 18:00 85 1.13 1.24 2.3 2.5 4.018:01 - 24:00 84 1.12 1.61 2.0 2.9 4.6
* Crashes extracted for years 1999, 2000 and 2001 long forms only.** Standard Deviation column represents the standard deviation for mean crashes per year per intersection.
CATEGORY 4
EXPECTED ANNUAL CRASH VALUE TABLE - CITY OF ORLANDO4 Lane x 2 Lane Intersection, Signalized, AADT/lane for Major Road ≥ 7000 (LT lanes > 2)
Total number Intersections - 75
95th PercentileStandard Deviation 85th Percentile 90th Percentile

193
Total Number Mean Crashes
Crashes Per Year* Per IntersectionPer Year
Collision Type Rear End 18 0.80 0.81 1.6 1.9 2.6Head On 0 0.00 0.00 0.0 0.0 0.0Angle 22 0.94 1.00 2.3 2.6 2.7Left Turn 14 0.61 1.04 0.9 1.3 2.8Right Turn 0 0.00 0.00 0.0 0.0 0.0Sideswipe 6 0.25 0.34 0.7 0.7 1.0Pedestrian/Bicycle 3 0.13 0.26 0.6 0.7 0.7Other 5 0.22 0.41 0.3 0.6 1.0Unknown 3 0.13 0.26 0.3 0.3 0.6
Severity PDO Crashes 13 0.58 0.71 1.0 1.5 2.3Injury 18 0.77 0.87 1.6 2.2 2.6Non-Incapacitating Injury 16 0.70 0.51 1.23 1.33 1.63Incapacitating Injury 6 0.25 0.32 0.57 0.67 0.97Fatal Crashes 0 0.00 0.00 0.0 0.0 0.0
Light Conditions Daylight 51 2.20 1.63 4.2 4.3 4.6Dusk 2 0.09 0.18 0.3 0.3 0.3Dawn 1 0.03 0.10 0.0 0.0 0.3Dark (w/street lights) 17 0.74 0.86 1.6 1.7 2.0Dark (wo/street lights) 0 0.01 0.07 0.0 0.0 0.0
Surface Condition Dry 61 2.67 1.91 4.7 5.2 5.6Wet 9 0.39 0.38 0.9 1.0 1.0Others 0 0.01 0.07 0.0 0.0 0.0
Month of year January 6 0.28 0.33 0.7 0.7 1.0February 8 0.35 0.40 0.7 0.9 1.0March 6 0.25 0.34 0.3 0.9 1.0April 4 0.19 0.28 0.3 0.6 0.7May 4 0.16 0.20 0.3 0.3 0.3June 7 0.32 0.34 0.7 0.7 1.0July 6 0.28 0.38 0.6 0.9 1.0August 6 0.25 0.39 0.6 0.7 0.7September 6 0.26 0.36 0.6 0.7 1.0October 8 0.33 0.36 0.7 0.7 1.0November 5 0.20 0.26 0.6 0.7 0.7December 5 0.22 0.29 0.6 0.7 0.7
Day of week Monday 6 0.25 0.35 0.7 0.7 1.0Tuesday 9 0.41 0.43 0.7 0.9 1.0Wednesday 14 0.61 0.61 1.2 1.3 1.3Thursday 12 0.54 0.55 1.0 1.3 1.3Friday 10 0.45 0.50 0.9 1.3 1.3Saturday 9 0.39 0.34 0.9 1.0 1.0Sunday 10 0.43 0.47 0.9 1.0 1.3
Hour of day 00:00 - 06:00 8 0.36 0.72 0.9 1.3 1.906:01 - 09:00 10 0.42 0.42 1.0 1.0 1.009:01 - 11:00 3 0.13 0.22 0.3 0.3 0.611:01 - 13:00 11 0.46 0.51 1.0 1.0 1.613:01 - 15:00 9 0.41 0.44 0.7 0.9 1.015:01 - 18:00 16 0.71 0.71 1.6 1.7 1.718:01 - 24:00 13 0.58 0.57 1.0 1.3 1.3
* Crashes extracted for years 1999, 2000 and 2001 long forms only.** Standard Deviation column represents the standard deviation for mean crashes per year per intersection.
CATEGORY 6
EXPECTED ANNUAL CRASH VALUE TABLE - CITY OF ORLANDO4 Lane x 2 Lane Intersection, Signalized, AADT/lane for Major Road < 7000 (LT lanes > 2)
Total number Intersections - 23
95th PercentileStandard Deviation 85th Percentile 90th Percentile
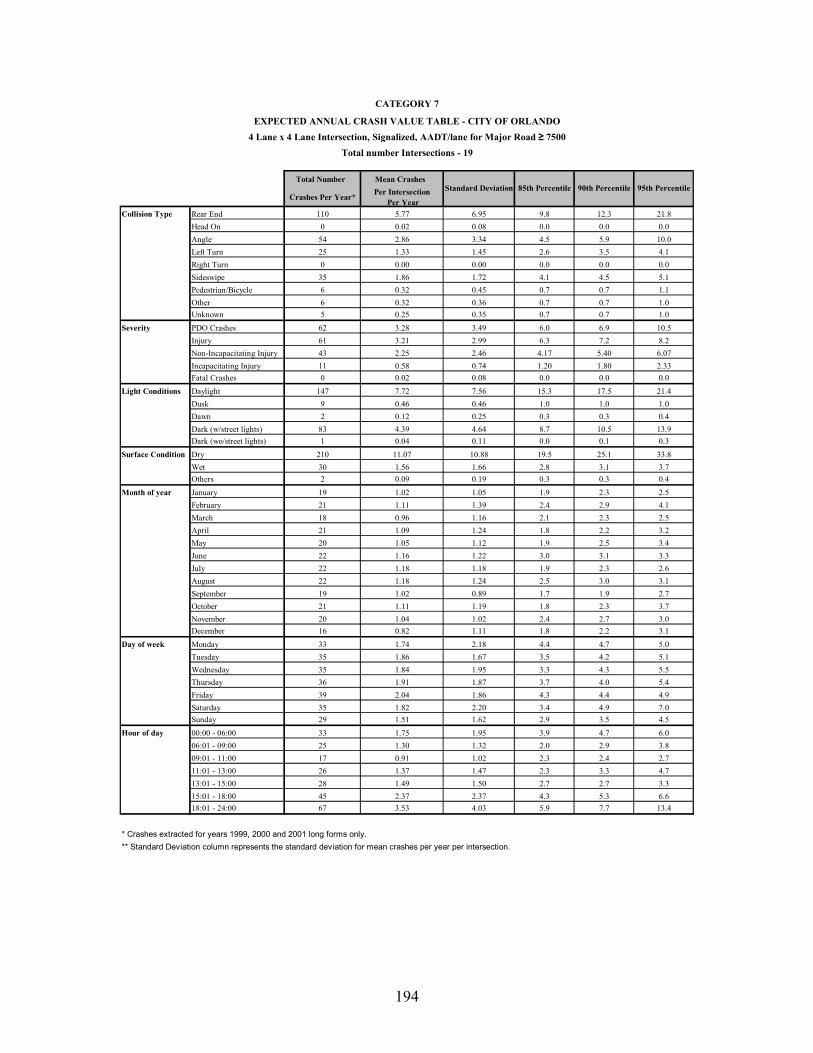
194
Total Number Mean Crashes
Crashes Per Year* Per IntersectionPer Year
Collision Type Rear End 110 5.77 6.95 9.8 12.3 21.8Head On 0 0.02 0.08 0.0 0.0 0.0Angle 54 2.86 3.34 4.5 5.9 10.0Left Turn 25 1.33 1.45 2.6 3.5 4.1Right Turn 0 0.00 0.00 0.0 0.0 0.0Sideswipe 35 1.86 1.72 4.1 4.5 5.1Pedestrian/Bicycle 6 0.32 0.45 0.7 0.7 1.1Other 6 0.32 0.36 0.7 0.7 1.0Unknown 5 0.25 0.35 0.7 0.7 1.0
Severity PDO Crashes 62 3.28 3.49 6.0 6.9 10.5Injury 61 3.21 2.99 6.3 7.2 8.2Non-Incapacitating Injury 43 2.25 2.46 4.17 5.40 6.07Incapacitating Injury 11 0.58 0.74 1.20 1.80 2.33Fatal Crashes 0 0.02 0.08 0.0 0.0 0.0
Light Conditions Daylight 147 7.72 7.56 15.3 17.5 21.4Dusk 9 0.46 0.46 1.0 1.0 1.0Dawn 2 0.12 0.25 0.3 0.3 0.4Dark (w/street lights) 83 4.39 4.64 8.7 10.5 13.9Dark (wo/street lights) 1 0.04 0.11 0.0 0.1 0.3
Surface Condition Dry 210 11.07 10.88 19.5 25.1 33.8Wet 30 1.56 1.66 2.8 3.1 3.7Others 2 0.09 0.19 0.3 0.3 0.4
Month of year January 19 1.02 1.05 1.9 2.3 2.5February 21 1.11 1.39 2.4 2.9 4.1March 18 0.96 1.16 2.1 2.3 2.5April 21 1.09 1.24 1.8 2.2 3.2May 20 1.05 1.12 1.9 2.5 3.4June 22 1.16 1.22 3.0 3.1 3.3July 22 1.18 1.18 1.9 2.3 2.6August 22 1.18 1.24 2.5 3.0 3.1September 19 1.02 0.89 1.7 1.9 2.7October 21 1.11 1.19 1.8 2.3 3.7November 20 1.04 1.02 2.4 2.7 3.0December 16 0.82 1.11 1.8 2.2 3.1
Day of week Monday 33 1.74 2.18 4.4 4.7 5.0Tuesday 35 1.86 1.67 3.5 4.2 5.1Wednesday 35 1.84 1.95 3.3 4.3 5.5Thursday 36 1.91 1.87 3.7 4.0 5.4Friday 39 2.04 1.86 4.3 4.4 4.9Saturday 35 1.82 2.20 3.4 4.9 7.0Sunday 29 1.51 1.62 2.9 3.5 4.5
Hour of day 00:00 - 06:00 33 1.75 1.95 3.9 4.7 6.006:01 - 09:00 25 1.30 1.32 2.0 2.9 3.809:01 - 11:00 17 0.91 1.02 2.3 2.4 2.711:01 - 13:00 26 1.37 1.47 2.3 3.3 4.713:01 - 15:00 28 1.49 1.50 2.7 2.7 3.315:01 - 18:00 45 2.37 2.37 4.3 5.3 6.618:01 - 24:00 67 3.53 4.03 5.9 7.7 13.4
* Crashes extracted for years 1999, 2000 and 2001 long forms only.** Standard Deviation column represents the standard deviation for mean crashes per year per intersection.
CATEGORY 7
EXPECTED ANNUAL CRASH VALUE TABLE - CITY OF ORLANDO4 Lane x 4 Lane Intersection, Signalized, AADT/lane for Major Road ≥ 7500
Total number Intersections - 19
95th PercentileStandard Deviation 85th Percentile 90th Percentile

195
Total Number Mean Crashes
Crashes Per Year* Per IntersectionPer Year
Collision Type Rear End 4 0.80 0.56 1.3 1.3 1.3Head On 0 0.00 0.00 0.0 0.0 0.0Angle 7 1.40 1.09 2.2 2.5 2.7Left Turn 5 0.93 1.19 1.6 2.1 2.5Right Turn 0 0.00 0.00 0.0 0.0 0.0Sideswipe 2 0.33 0.47 0.8 0.9 0.9Pedestrian/Bicycle 0 0.00 0.00 0.0 0.0 0.0Other 1 0.13 0.18 0.3 0.3 0.3Unknown 1 0.13 0.30 0.3 0.4 0.5
Severity PDO Crashes 5 1.00 1.37 1.9 2.4 2.9Injury 4 0.87 0.51 1.1 1.2 1.3Non-Incapacitating Injury 3 0.67 0.67 1.27 1.40 1.53Incapacitating Injury 1 0.13 0.18 0.33 0.33 0.33Fatal Crashes 0 0.00 0.00 0.0 0.0 0.0
Light Conditions Daylight 13 2.60 1.82 3.8 4.2 4.6Dusk 0 0.00 0.00 0.0 0.0 0.0Dawn 0 0.07 0.15 0.1 0.2 0.3Dark (w/street lights) 5 1.00 0.71 1.7 1.7 1.7Dark (wo/street lights) 0 0.07 0.15 0.1 0.2 0.3
Surface Condition Dry 17 3.40 2.70 5.6 6.1 6.5Wet 2 0.33 0.41 0.6 0.7 0.9Others 0 0.00 0.00 0.0 0.0 0.0
Month of year January 2 0.47 0.51 1.0 1.0 1.0February 2 0.33 0.24 0.5 0.5 0.6March 1 0.20 0.45 0.4 0.6 0.8April 1 0.27 0.43 0.6 0.7 0.9May 2 0.33 0.58 0.7 0.9 1.1June 1 0.20 0.30 0.5 0.5 0.6July 2 0.47 0.45 0.8 0.9 0.9August 2 0.40 0.43 0.8 0.9 0.9September 1 0.27 0.28 0.5 0.5 0.6October 0 0.07 0.15 0.1 0.2 0.3November 2 0.40 0.28 0.7 0.7 0.7December 2 0.33 0.33 0.7 0.7 0.7
Day of week Monday 3 0.67 0.62 1.1 1.3 1.5Tuesday 1 0.13 0.18 0.3 0.3 0.3Wednesday 2 0.40 0.72 0.9 1.1 1.4Thursday 2 0.40 0.72 0.9 1.1 1.4Friday 3 0.67 0.47 1.0 1.0 1.0Saturday 4 0.87 0.69 1.5 1.5 1.6Sunday 3 0.60 0.55 1.1 1.2 1.3
Hour of day 00:00 - 06:00 1 0.13 0.18 0.3 0.3 0.306:01 - 09:00 1 0.20 0.30 0.5 0.5 0.609:01 - 11:00 2 0.40 0.72 0.9 1.1 1.411:01 - 13:00 3 0.67 0.41 1.0 1.0 1.013:01 - 15:00 2 0.33 0.41 0.6 0.7 0.915:01 - 18:00 4 0.73 0.64 1.3 1.4 1.518:01 - 24:00 6 1.27 0.89 2.0 2.0 2.0
* Crashes extracted for years 1999, 2000 and 2001 long forms only.** Standard Deviation column represents the standard deviation for mean crashes per year per intersection.
CATEGORY 8
EXPECTED ANNUAL CRASH VALUE TABLE - CITY OF ORLANDO4 Lane x 4 Lane Intersection, Signalized, AADT/lane for Major Road < 7500
Total number Intersections - 5
95th PercentileStandard Deviation 85th Percentile 90th Percentile

196
Total Number Mean Crashes
Crashes Per Year* Per IntersectionPer Year
Collision Type Rear End 75 5.00 3.72 9.0 10.9 12.1Head On 1 0.04 0.12 0.0 0.2 0.3Angle 32 2.16 2.62 3.3 3.5 5.7Left Turn 15 1.00 0.72 1.6 1.9 2.1Right Turn 0 0.00 0.00 0.0 0.0 0.0Sideswipe 15 1.02 0.79 1.7 2.1 2.3Pedestrian/Bicycle 3 0.18 0.31 0.3 0.5 0.8Other 4 0.27 0.40 0.3 0.7 1.1Unknown 2 0.11 0.21 0.3 0.3 0.4
Severity PDO Crashes 30 1.98 2.23 2.3 2.7 4.9Injury 35 2.33 1.72 4.0 4.2 4.8Non-Incapacitating Injury 34 2.29 1.36 3.60 4.27 4.67Incapacitating Injury 8 0.51 0.60 0.67 1.27 1.77Fatal Crashes 2 0.11 0.21 0.3 0.3 0.4
Light Conditions Daylight 99 6.62 4.20 10.5 12.7 14.2Dusk 3 0.22 0.43 0.3 0.3 0.7Dawn 1 0.09 0.20 0.3 0.3 0.4Dark (w/street lights) 42 2.78 2.64 4.9 5.2 6.8Dark (wo/street lights) 1 0.07 0.19 0.0 0.2 0.4
Surface Condition Dry 135 8.98 6.08 14.1 14.7 17.9Wet 12 0.80 0.78 1.6 1.9 2.2Others 0 0.00 0.00 0.0 0.0 0.0
Month of year January 9 0.58 0.43 1.0 1.0 1.1February 9 0.58 0.58 1.0 1.2 1.5March 13 0.89 0.66 1.6 1.7 1.9April 15 1.02 0.91 2.0 2.4 2.8May 13 0.89 0.64 1.6 1.9 2.0June 12 0.80 0.72 1.3 1.7 2.2July 14 0.93 0.98 2.0 2.4 2.7August 13 0.89 0.50 1.3 1.5 1.7September 11 0.73 0.85 1.3 1.3 1.9October 16 1.07 0.96 1.7 2.3 2.9November 9 0.62 0.69 1.3 1.5 1.8December 12 0.78 0.73 1.3 1.3 1.7
Day of week Monday 21 1.38 1.52 2.3 2.5 3.7Tuesday 18 1.22 0.80 2.3 2.3 2.3Wednesday 21 1.40 1.20 2.6 2.7 3.2Thursday 18 1.20 1.02 2.3 2.7 3.0Friday 23 1.51 1.36 2.0 2.6 3.7Saturday 23 1.56 0.99 2.3 2.3 2.8Sunday 23 1.51 1.15 2.0 3.0 3.8
Hour of day 00:00 - 06:00 16 1.07 1.11 2.3 2.5 3.006:01 - 09:00 15 1.00 0.84 1.3 2.1 2.709:01 - 11:00 10 0.67 0.63 1.6 1.7 1.711:01 - 13:00 19 1.24 1.00 2.3 2.5 2.713:01 - 15:00 21 1.40 1.64 2.3 3.3 4.515:01 - 18:00 34 2.29 1.54 3.6 4.3 4.918:01 - 24:00 32 2.11 1.74 2.7 3.1 4.5
* Crashes extracted for years 1999, 2000 and 2001 long forms only.** Standard Deviation column represents the standard deviation for mean crashes per year per intersection.
CATEGORY 9
EXPECTED ANNUAL CRASH VALUE TABLE - CITY OF ORLANDO6 Lane x 2 Lane Intersection, Signalized, AADT/lane for Major Road ≥ 7500
Total number Intersections - 15
95th PercentileStandard Deviation 85th Percentile 90th Percentile

197
Total Number Mean Crashes
Crashes Per Year* Per IntersectionPer Year
Collision Type Rear End 13 6.67 4.71 9.0 9.3 9.7Head On 0 0.17 0.24 0.3 0.3 0.3Angle 11 5.67 2.83 7.1 7.3 7.5Left Turn 8 4.00 3.77 5.9 6.1 6.4Right Turn 0 0.00 0.00 0.0 0.0 0.0Sideswipe 3 1.33 1.41 2.0 2.1 2.2Pedestrian/Bicycle 0 0.00 0.00 0.0 0.0 0.0Other 0 0.00 0.00 0.0 0.0 0.0Unknown 1 0.67 0.00 0.7 0.7 0.7
Severity PDO Crashes 9 4.33 1.41 5.0 5.1 5.2Injury 8 4.17 0.24 4.3 4.3 4.3Non-Incapacitating Injury 8 4.00 1.89 4.93 5.07 5.2Incapacitating Injury 3 1.33 0.00 1.33 1.33 1.33Fatal Crashes 0 0.17 0.24 0.3 0.3 0.3
Light Conditions Daylight 24 12.17 3.06 13.7 13.9 14.1Dusk 1 0.33 0.47 0.6 0.6 0.6Dawn 0 0.00 0.00 0.0 0.0 0.0Dark (w/street lights) 11 5.67 2.36 6.8 7.0 7.2Dark (wo/street lights) 1 0.33 0.47 0.6 0.6 0.6
Surface Condition Dry 31 15.67 5.19 18.2 18.6 19.0Wet 5 2.50 0.71 2.9 2.9 3.0Others 1 0.33 0.47 0.6 0.6 0.6
Month of year January 5 2.50 1.18 3.1 3.2 3.3February 2 1.17 0.24 1.3 1.3 1.3March 3 1.50 0.24 1.6 1.6 1.7April 2 1.17 1.18 1.8 1.8 1.9May 5 2.67 0.47 2.9 2.9 3.0June 4 2.00 0.94 2.5 2.5 2.6July 4 1.83 0.71 2.2 2.2 2.3August 2 0.83 0.24 1.0 1.0 1.0September 3 1.50 1.18 2.1 2.2 2.3October 2 1.17 0.71 1.5 1.6 1.6November 1 0.67 0.47 0.9 0.9 1.0December 3 1.50 0.24 1.6 1.6 1.7
Day of week Monday 5 2.50 2.12 3.6 3.7 3.9Tuesday 4 2.17 0.71 2.5 2.6 2.6Wednesday 6 3.00 1.41 3.7 3.8 3.9Thursday 4 2.00 0.47 2.2 2.3 2.3Friday 7 3.67 0.00 3.7 3.7 3.7Saturday 7 3.67 2.36 4.8 5.0 5.2Sunday 3 1.50 1.65 2.3 2.4 2.6
Hour of day 00:00 - 06:00 3 1.50 0.24 1.6 1.6 1.706:01 - 09:00 4 2.00 0.47 2.2 2.3 2.309:01 - 11:00 5 2.67 0.94 3.1 3.2 3.311:01 - 13:00 4 2.00 0.94 2.5 2.5 2.613:01 - 15:00 2 1.17 1.18 1.8 1.8 1.915:01 - 18:00 8 4.17 1.18 4.8 4.8 4.918:01 - 24:00 10 5.00 0.94 5.5 5.5 5.6
* Crashes extracted for years 1999, 2000 and 2001 long forms only.** Standard Deviation column represents the standard deviation for mean crashes per year per intersection.
CATEGORY 10
EXPECTED ANNUAL CRASH VALUE TABLE - CITY OF ORLANDO6 Lane x 2 Lane Intersection, Signalized, AADT/lane for Major Road < 7500
Total number Intersections - 2
95th PercentileStandard Deviation 85th Percentile 90th Percentile

198
Total Number Mean Crashes
Crashes Per Year* Per IntersectionPer Year
Collision Type Rear End 75 10.71 6.57 17.4 17.6 17.8Head On 0 0.05 0.13 0.0 0.1 0.2Angle 20 2.86 2.25 5.1 5.5 5.9Left Turn 14 2.00 1.37 3.4 3.5 3.6Right Turn 0 0.00 0.00 0.0 0.0 0.0Sideswipe 15 2.10 1.54 3.8 4.1 4.4Pedestrian/Bicycle 3 0.48 0.63 1.1 1.3 1.5Other 5 0.76 0.50 1.3 1.3 1.3Unknown 4 0.57 0.63 1.1 1.3 1.5
Severity PDO Crashes 28 3.95 2.68 5.7 6.7 7.7Injury 33 4.71 3.14 7.9 8.6 9.3Non-Incapacitating Injury 33 4.76 3.72 7.17 8.67 10.12Incapacitating Injury 5 0.71 0.83 1.70 1.80 1.90Fatal Crashes 1 0.10 0.16 0.3 0.3 0.3
Light Conditions Daylight 82 11.76 7.37 19.6 20.3 21.0Dusk 3 0.43 0.42 0.7 0.8 0.9Dawn 2 0.33 0.38 0.7 0.8 0.9Dark (w/street lights) 47 6.76 5.05 12.8 13.3 13.8Dark (wo/street lights) 2 0.24 0.37 0.4 0.6 0.8
Surface Condition Dry 119 17.00 10.47 26.7 28.8 30.9Wet 17 2.48 1.60 4.4 4.5 4.6Others 0 0.05 0.13 0.0 0.1 0.2
Month of year January 10 1.48 0.81 2.3 2.3 2.3February 11 1.52 1.15 2.4 2.7 3.0March 15 2.19 1.35 3.2 3.7 4.2April 15 2.10 1.80 4.1 4.5 4.9May 11 1.57 1.47 3.4 3.5 3.6June 13 1.86 1.60 3.1 3.5 3.9July 10 1.48 1.07 2.4 2.6 2.8August 13 1.81 1.71 2.6 3.4 4.2September 10 1.43 1.67 2.9 3.5 4.1October 10 1.43 0.98 2.1 2.4 2.7November 12 1.76 1.24 2.5 3.0 3.5December 6 0.86 0.47 1.3 1.3 1.3
Day of week Monday 15 2.14 1.55 3.5 3.9 4.3Tuesday 21 3.05 1.62 4.7 4.7 4.7Wednesday 20 2.86 1.54 4.7 4.8 4.9Thursday 17 2.43 2.25 4.3 5.1 5.9Friday 20 2.86 1.68 4.7 4.9 5.1Saturday 21 3.05 1.85 4.8 5.2 5.6Sunday 22 3.10 2.39 6.1 6.3 6.5
Hour of day 00:00 - 06:00 17 2.48 2.11 4.8 5.2 5.606:01 - 09:00 12 1.67 1.78 3.2 3.8 4.409:01 - 11:00 14 1.95 1.38 3.4 3.7 4.011:01 - 13:00 13 1.86 1.25 3.4 3.5 3.613:01 - 15:00 19 2.71 1.89 5.0 5.0 5.015:01 - 18:00 24 3.43 1.98 5.2 5.7 6.218:01 - 24:00 38 5.43 4.60 10.9 11.6 12.3
* Crashes extracted for years 1999, 2000 and 2001 long forms only.** Standard Deviation column represents the standard deviation for mean crashes per year per intersection.
CATEGORY 11
EXPECTED ANNUAL CRASH VALUE TABLE - CITY OF ORLANDO6 Lane x 4 Lane and 6 Lane x 6 Lane Intersection, Signalized
Total number Intersections - 7
95th PercentileStandard Deviation 85th Percentile 90th Percentile

199
Total Number Mean Crashes
Crashes Per Year* Per IntersectionPer Year
Collision Type Rear End 35 2.72 2.98 4.3 5.3 7.8Head On 0 0.00 0.00 0.0 0.0 0.0Angle 9 0.72 0.61 1.1 1.5 1.8Left Turn 9 0.67 0.62 1.4 1.6 1.7Right Turn 0 0.00 0.00 0.0 0.0 0.0Sideswipe 8 0.62 0.65 1.1 1.3 1.7Pedestrian/Bicycle 2 0.18 0.65 0.0 0.0 0.9Other 4 0.28 0.27 0.3 0.3 0.6Unknown 0 0.03 0.09 0.0 0.0 0.1
Severity PDO Crashes 14 1.08 0.87 2.0 2.0 2.4Injury 18 1.41 1.04 2.0 2.0 2.8Non-Incapacitating Injury 16 1.26 1.28 2.13 2.53 3.47Incapacitating Injury 3 0.21 0.42 0.67 0.67 0.93Fatal Crashes 0 0.00 0.00 0.0 0.0 0.0
Light Conditions Daylight 48 3.72 2.88 6.4 6.6 7.9Dusk 3 0.26 0.28 0.7 0.7 0.7Dawn 1 0.08 0.20 0.1 0.3 0.5Dark (w/street lights) 13 1.00 0.94 1.7 1.9 2.5Dark (wo/street lights) 2 0.15 0.22 0.3 0.3 0.5
Surface Condition Dry 59 4.54 3.75 6.9 7.5 10.3Wet 8 0.59 0.39 1.0 1.0 1.1Others 1 0.08 0.15 0.3 0.3 0.3
Month of year January 5 0.41 0.43 1.0 1.0 1.0February 3 0.23 0.46 0.3 0.3 0.9March 7 0.51 0.68 1.1 1.5 1.8April 7 0.51 0.70 1.1 1.3 1.7May 8 0.62 0.54 1.1 1.3 1.5June 3 0.26 0.28 0.7 0.7 0.7July 7 0.51 0.57 1.0 1.0 1.4August 8 0.62 0.51 1.1 1.3 1.3September 5 0.38 0.36 0.7 0.9 1.0October 6 0.44 0.48 0.8 1.2 1.3November 4 0.28 0.36 0.7 0.7 0.8December 6 0.44 0.39 0.7 0.9 1.1
Day of week Monday 8 0.62 0.62 1.3 1.3 1.6Tuesday 12 0.90 0.66 1.7 1.7 1.8Wednesday 12 0.90 1.10 2.0 2.0 2.7Thursday 10 0.74 0.56 1.4 1.6 1.7Friday 8 0.64 0.58 1.1 1.3 1.6Saturday 11 0.82 0.65 1.4 1.6 1.9Sunday 8 0.59 0.82 1.0 1.0 1.8
Hour of day 00:00 - 06:00 5 0.38 0.47 0.7 0.7 1.106:01 - 09:00 10 0.74 0.98 1.3 2.3 2.809:01 - 11:00 4 0.33 0.36 0.7 0.9 1.011:01 - 13:00 6 0.44 0.44 0.7 0.9 1.113:01 - 15:00 10 0.77 0.61 1.4 1.6 1.815:01 - 18:00 18 1.41 1.12 2.5 3.1 3.318:01 - 24:00 15 1.13 1.02 2.1 2.3 2.9
* Crashes extracted for years 1999, 2000 and 2001 long forms only.** Standard Deviation column represents the standard deviation for mean crashes per year per intersection.
CATEGORY 12
EXPECTED ANNUAL CRASH VALUE TABLE - CITY OF ORLANDOT Intersection, Signalized, AADT/lane for Major Road ≥ 7500
Total number Intersections - 13
95th PercentileStandard Deviation 85th Percentile 90th Percentile

200
Total Number Mean Crashes
Crashes Per Year* Per IntersectionPer Year
Collision Type Rear End 31 1.12 1.58 2.3 3.0 3.7Head On 0 0.01 0.06 0.0 0.0 0.0Angle 7 0.26 0.41 0.7 1.0 1.0Left Turn 10 0.35 0.57 1.0 1.0 1.2Right Turn 0 0.00 0.00 0.0 0.0 0.0Sideswipe 7 0.24 0.36 0.3 0.8 1.0Pedestrian/Bicycle 1 0.04 0.14 0.0 0.0 0.2Other 8 0.29 0.57 0.3 0.7 1.5Unknown 2 0.07 0.17 0.3 0.3 0.3
Severity PDO Crashes 15 0.54 0.86 1.0 1.3 1.3Injury 12 0.44 0.56 1.0 1.3 1.6Non-Incapacitating Injury 17 0.60 0.70 1.32 1.67 1.88Incapacitating Injury 4 0.15 0.21 0.33 0.33 0.55Fatal Crashes 0 0.01 0.06 0.0 0.0 0.0
Light Conditions Daylight 42 1.50 1.59 3.3 4.2 4.9Dusk 4 0.13 0.25 0.3 0.3 0.6Dawn 0 0.01 0.06 0.0 0.0 0.0Dark (w/street lights) 19 0.69 1.14 1.0 1.8 2.0Dark (wo/street lights) 1 0.04 0.10 0.0 0.1 0.3
Surface Condition Dry 51 1.81 1.91 3.0 4.1 6.2Wet 15 0.52 1.07 0.7 1.0 1.9Others 1 0.04 0.14 0.0 0.0 0.2
Month of year January 6 0.23 0.24 0.3 0.7 0.7February 6 0.21 0.39 0.7 0.7 1.1March 5 0.19 0.28 0.3 0.7 0.7April 6 0.21 0.28 0.3 0.7 0.7May 7 0.24 0.39 0.7 0.7 0.9June 3 0.12 0.24 0.3 0.3 0.6July 6 0.20 0.31 0.3 0.7 0.9August 5 0.18 0.39 0.7 0.7 1.1September 4 0.14 0.34 0.3 0.3 0.6October 5 0.19 0.36 0.7 0.7 0.9November 8 0.30 0.44 0.7 1.0 1.2December 4 0.14 0.21 0.3 0.3 0.6
Day of week Monday 9 0.33 0.50 0.7 0.8 1.0Tuesday 10 0.35 0.44 0.7 0.7 1.1Wednesday 10 0.35 0.49 0.7 0.7 1.3Thursday 9 0.32 0.44 0.7 0.8 1.2Friday 11 0.40 0.52 1.0 1.0 1.4Saturday 9 0.33 0.45 0.7 1.1 1.3Sunday 8 0.27 0.60 0.7 0.7 0.9
Hour of day 00:00 - 06:00 7 0.26 0.69 0.3 0.8 1.206:01 - 09:00 9 0.33 0.44 0.7 1.0 1.009:01 - 11:00 5 0.19 0.29 0.3 0.4 0.911:01 - 13:00 6 0.23 0.29 0.3 0.4 0.913:01 - 15:00 10 0.36 0.49 0.7 1.1 1.315:01 - 18:00 10 0.37 0.55 0.7 1.0 1.218:01 - 24:00 18 0.63 0.78 1.3 1.5 2.0
* Crashes extracted for years 1999, 2000 and 2001 long forms only.** Standard Deviation column represents the standard deviation for mean crashes per year per intersection.
CATEGORY 13
EXPECTED ANNUAL CRASH VALUE TABLE - CITY OF ORLANDOT Intersection, Signalized, AADT/lane for Major Road < 7500
Total number Intersections - 28
95th PercentileStandard Deviation 85th Percentile 90th Percentile

201
Total Number Mean Crashes
Crashes Per Year* Per IntersectionPer Year
Collision Type Rear End 22 0.66 0.55 1.3 1.3 1.5Head On 0 0.00 0.00 0.0 0.0 0.0Angle 33 0.99 1.02 1.8 2.6 3.1Left Turn 4 0.13 0.26 0.3 0.6 0.7Right Turn 0 0.00 0.00 0.0 0.0 0.0Sideswipe 25 0.76 0.67 1.7 1.7 2.0Pedestrian/Bicycle 4 0.11 0.20 0.3 0.3 0.5Other 7 0.22 0.36 0.7 0.7 1.0Unknown 12 0.37 0.45 0.7 1.2 1.3
Severity PDO Crashes 36 1.08 0.78 1.7 2.3 2.5Injury 20 0.61 0.52 1.0 1.0 1.7Non-Incapacitating Injury 15 0.45 0.51 0.73 1.27 1.67Incapacitating Injury 4 0.11 0.22 0.33 0.33 0.33Fatal Crashes 0 0.00 0.00 0.0 0.0 0.0
Light Conditions Daylight 67 2.02 1.24 3.3 3.6 4.1Dusk 4 0.11 0.22 0.3 0.3 0.7Dawn 0 0.01 0.06 0.0 0.0 0.0Dark (w/street lights) 36 1.08 1.00 2.3 2.6 3.0Dark (wo/street lights) 1 0.02 0.08 0.0 0.0 0.1
Surface Condition Dry 97 2.94 1.79 4.6 5.7 6.1Wet 10 0.30 0.32 0.7 0.7 0.8Others 0 0.01 0.06 0.0 0.0 0.0
Month of year January 9 0.26 0.27 0.7 0.7 0.7February 6 0.19 0.25 0.3 0.3 0.7March 12 0.35 0.34 0.7 0.7 1.0April 8 0.25 0.30 0.7 0.7 0.8May 8 0.24 0.34 0.7 0.7 0.7June 9 0.26 0.29 0.7 0.7 0.7July 13 0.38 0.39 0.7 0.7 1.1August 12 0.35 0.33 0.7 0.7 0.8September 7 0.21 0.27 0.4 0.7 0.7October 8 0.24 0.29 0.4 0.7 0.8November 8 0.24 0.30 0.7 0.7 0.7December 8 0.23 0.34 0.7 0.7 0.8
Day of week Monday 10 0.29 0.51 0.7 0.7 1.2Tuesday 12 0.37 0.32 0.7 0.7 1.0Wednesday 14 0.41 0.46 0.7 1.0 1.3Thursday 14 0.42 0.48 0.7 1.0 1.3Friday 21 0.63 0.46 1.0 1.0 1.3Saturday 21 0.64 0.63 1.3 1.3 1.9Sunday 15 0.46 0.42 0.7 0.9 1.3
Hour of day 00:00 - 06:00 21 0.65 0.63 1.3 1.6 1.706:01 - 09:00 11 0.34 0.36 0.7 0.7 1.009:01 - 11:00 8 0.23 0.28 0.7 0.7 0.711:01 - 13:00 11 0.33 0.28 0.7 0.7 0.813:01 - 15:00 16 0.49 0.53 1.0 1.0 1.515:01 - 18:00 19 0.57 0.43 1.0 1.0 1.118:01 - 24:00 21 0.63 0.71 1.3 1.6 1.9
* Crashes extracted for years 1999, 2000 and 2001 long forms only.** Standard Deviation column represents the standard deviation for mean crashes per year per intersection.
CATEGORY 14
EXPECTED ANNUAL CRASH VALUE TABLE - CITY OF ORLANDOSignalized Intersection, One-way Major Road
Total number Intersections - 33
95th PercentileStandard Deviation 85th Percentile 90th Percentile

202
Total Number Mean Crashes
Crashes Per Year* Per IntersectionPer Year
Collision Type Rear End 34 1.60 1.96 3.3 3.7 6.3Head On 0 0.00 0.00 0.0 0.0 0.0Angle 60 2.87 2.11 5.7 6.3 7.0Left Turn 7 0.35 0.52 1.0 1.0 1.0Right Turn 0 0.00 0.00 0.0 0.0 0.0Sideswipe 12 0.56 0.58 1.3 1.3 1.3Pedestrian/Bicycle 2 0.10 0.19 0.3 0.3 0.3Other 5 0.24 0.24 0.3 0.7 0.7Unknown 5 0.22 0.29 0.3 0.7 0.7
Severity PDO Crashes 24 1.16 1.01 2.0 2.0 3.3Injury 32 1.51 1.22 2.3 2.7 3.0Non-Incapacitating Injury 27 1.27 1.09 2.33 3.00 3Incapacitating Injury 6 0.27 0.33 0.67 0.67 1.00Fatal Crashes 0 0.00 0.00 0.0 0.0 0.0
Light Conditions Daylight 76 3.63 2.69 7.3 7.7 8.3Dusk 3 0.16 0.25 0.3 0.7 0.7Dawn 1 0.05 0.16 0.0 0.0 0.3Dark (w/street lights) 44 2.08 1.88 3.7 4.0 4.3Dark (wo/street lights) 0 0.02 0.07 0.0 0.0 0.0
Surface Condition Dry 110 5.24 3.90 9.7 10.3 12.0Wet 14 0.67 0.73 1.0 1.7 2.0Others 1 0.03 0.10 0.0 0.0 0.3
Month of year January 10 0.49 0.73 1.0 1.0 1.7February 9 0.43 0.48 1.0 1.3 1.3March 11 0.52 0.55 1.0 1.0 1.7April 12 0.56 0.59 1.3 1.3 1.7May 9 0.43 0.50 1.0 1.0 1.3June 10 0.48 0.49 1.0 1.3 1.3July 12 0.56 0.69 1.0 1.0 1.3August 13 0.62 0.57 1.0 1.3 1.3September 10 0.49 0.58 1.3 1.3 1.7October 9 0.44 0.69 1.0 1.3 1.7November 10 0.46 0.47 1.0 1.0 1.3December 10 0.46 0.44 0.7 1.0 1.3
Day of week Monday 18 0.86 1.05 1.3 1.3 3.0Tuesday 16 0.76 0.79 1.7 1.7 2.0Wednesday 18 0.87 0.67 1.3 2.0 2.0Thursday 18 0.84 0.62 1.3 1.7 2.0Friday 21 1.00 0.80 2.0 2.0 2.3Saturday 18 0.87 0.76 1.3 2.0 2.0Sunday 15 0.73 0.83 1.7 2.0 2.0
Hour of day 00:00 - 06:00 20 0.95 0.97 1.7 1.7 2.006:01 - 09:00 14 0.65 0.73 1.3 1.7 2.009:01 - 11:00 12 0.57 0.63 1.0 1.3 1.711:01 - 13:00 14 0.68 0.68 1.3 1.7 1.713:01 - 15:00 15 0.70 0.62 1.3 1.7 1.715:01 - 18:00 22 1.03 0.87 2.0 2.0 2.318:01 - 24:00 28 1.35 1.15 2.3 2.7 3.3
* Crashes extracted for years 1999, 2000 and 2001 long forms only.** Standard Deviation column represents the standard deviation for mean crashes per year per intersection.
CATEGORY 15
EXPECTED ANNUAL CRASH VALUE TABLE - CITY OF ORLANDOSignalized Intersection, One-way Minor Road
Total number Intersections - 21
95th PercentileStandard Deviation 85th Percentile 90th Percentile
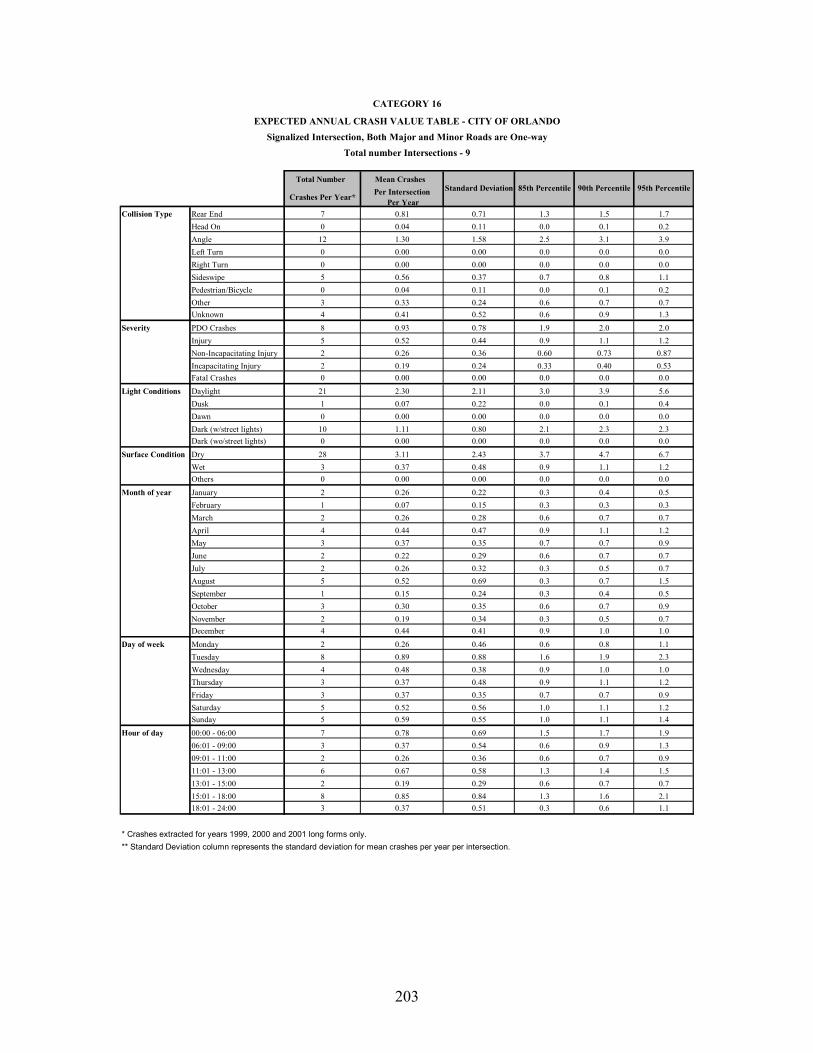
203
Total Number Mean Crashes
Crashes Per Year* Per IntersectionPer Year
Collision Type Rear End 7 0.81 0.71 1.3 1.5 1.7Head On 0 0.04 0.11 0.0 0.1 0.2Angle 12 1.30 1.58 2.5 3.1 3.9Left Turn 0 0.00 0.00 0.0 0.0 0.0Right Turn 0 0.00 0.00 0.0 0.0 0.0Sideswipe 5 0.56 0.37 0.7 0.8 1.1Pedestrian/Bicycle 0 0.04 0.11 0.0 0.1 0.2Other 3 0.33 0.24 0.6 0.7 0.7Unknown 4 0.41 0.52 0.6 0.9 1.3
Severity PDO Crashes 8 0.93 0.78 1.9 2.0 2.0Injury 5 0.52 0.44 0.9 1.1 1.2Non-Incapacitating Injury 2 0.26 0.36 0.60 0.73 0.87Incapacitating Injury 2 0.19 0.24 0.33 0.40 0.53Fatal Crashes 0 0.00 0.00 0.0 0.0 0.0
Light Conditions Daylight 21 2.30 2.11 3.0 3.9 5.6Dusk 1 0.07 0.22 0.0 0.1 0.4Dawn 0 0.00 0.00 0.0 0.0 0.0Dark (w/street lights) 10 1.11 0.80 2.1 2.3 2.3Dark (wo/street lights) 0 0.00 0.00 0.0 0.0 0.0
Surface Condition Dry 28 3.11 2.43 3.7 4.7 6.7Wet 3 0.37 0.48 0.9 1.1 1.2Others 0 0.00 0.00 0.0 0.0 0.0
Month of year January 2 0.26 0.22 0.3 0.4 0.5February 1 0.07 0.15 0.3 0.3 0.3March 2 0.26 0.28 0.6 0.7 0.7April 4 0.44 0.47 0.9 1.1 1.2May 3 0.37 0.35 0.7 0.7 0.9June 2 0.22 0.29 0.6 0.7 0.7July 2 0.26 0.32 0.3 0.5 0.7August 5 0.52 0.69 0.3 0.7 1.5September 1 0.15 0.24 0.3 0.4 0.5October 3 0.30 0.35 0.6 0.7 0.9November 2 0.19 0.34 0.3 0.5 0.7December 4 0.44 0.41 0.9 1.0 1.0
Day of week Monday 2 0.26 0.46 0.6 0.8 1.1Tuesday 8 0.89 0.88 1.6 1.9 2.3Wednesday 4 0.48 0.38 0.9 1.0 1.0Thursday 3 0.37 0.48 0.9 1.1 1.2Friday 3 0.37 0.35 0.7 0.7 0.9Saturday 5 0.52 0.56 1.0 1.1 1.2Sunday 5 0.59 0.55 1.0 1.1 1.4
Hour of day 00:00 - 06:00 7 0.78 0.69 1.5 1.7 1.906:01 - 09:00 3 0.37 0.54 0.6 0.9 1.309:01 - 11:00 2 0.26 0.36 0.6 0.7 0.911:01 - 13:00 6 0.67 0.58 1.3 1.4 1.513:01 - 15:00 2 0.19 0.29 0.6 0.7 0.715:01 - 18:00 8 0.85 0.84 1.3 1.6 2.118:01 - 24:00 3 0.37 0.51 0.3 0.6 1.1
* Crashes extracted for years 1999, 2000 and 2001 long forms only.** Standard Deviation column represents the standard deviation for mean crashes per year per intersection.
CATEGORY 16
EXPECTED ANNUAL CRASH VALUE TABLE - CITY OF ORLANDOSignalized Intersection, Both Major and Minor Roads are One-way
Total number Intersections - 9
95th PercentileStandard Deviation 85th Percentile 90th Percentile

204
APPENDIX C
19 CATEGORY CRASH PROFILE TABLES FOR DADE COUNTY

205
Total Number Mean Crashes Standard 85th 90th 95th
Crashes Per Year* Per IntersectionPer Year Deviation** Percentile Percentile Percentile
Collision Type Rear End 29 2.40 1.33 4 4 4Head On 2 0.19 0.22 1 1 1Angle 20 1.67 0.85 3 3 3Left Turn 20 1.65 1.14 3 3 4Right Turn 4 0.31 0.32 1 1 1Sideswipe 15 1.27 1.05 2 2 3Pedestrian/Bicycle 3 0.23 0.33 1 1 1Other/Unknown 33 2.75 2.01 5 5 5
Severity No Injury 48 4.02 1.84 6 6 6Possible Injury 18 1.46 0.60 2 2 2Non-Incapacitating Injury 11 0.88 0.63 1 1 2Incapacitating Injury 2 0.19 0.26 1 1 1Fatal Injury 0 0.02 0.07 0 0 0
Light Conditions Daylight 71 5.88 2.49 8 8 9Dusk 4 0.29 0.26 1 1 1Dawn 2 0.13 0.20 0 0 1Dark (w/street lights) 49 4.08 2.24 7 7 7Dark (wo/ street lights) 1 0.08 0.16 0 0 0
Surface Conditions Dry 107 8.88 4.19 13 13 14Wet 17 1.40 1.04 3 3 3Others 2 0.19 0.19 0 0 1
Month of Year January 11 0.88 0.82 2 2 2February 12 0.98 0.86 2 2 2March 14 1.13 1.00 2 2 3April 10 0.81 0.51 1 1 1May 8 0.65 0.69 1 1 2June 11 0.94 0.61 2 2 2July 11 0.90 0.55 2 2 2August 12 0.96 0.61 2 2 2September 10 0.83 0.55 1 1 1October 8 0.63 0.54 1 1 1November 11 0.90 0.63 2 2 2December 11 0.88 0.51 1 1 2
Day of Week Monday 17 1.38 0.83 2 2 3Tuesday 15 1.25 0.85 2 2 3Wednesday 15 1.27 0.62 2 2 2Thursday 15 1.25 0.66 2 2 2Friday 21 1.73 0.99 3 3 3Saturday 23 1.90 1.11 3 3 3Sunday 20 1.69 1.36 3 4 4
Hour of Day*** 00:00 - 06:00 18 1.52 1.11 2 2 306:01 - 09:00 5 0.38 0.31 1 1 109:01 - 11:00 5 0.44 0.37 1 1 111:01 - 13:00 5 0.42 0.37 1 1 113:01 - 15:00 8 0.63 0.27 1 1 115:01 - 18:00 16 1.31 0.72 2 2 218:01 - 24:00 23 1.88 1.08 3 3 3
* Crashes extracted for years 1999, 2000, 2001and 2002 for long forms only.** Standard Deviation column represents the standard deviation for mean crashes per year per intersection.*** Hour of Day statistics are based upon a portion of the crashes with time information available.
CATEGORY 1
EXPECTED ANNUAL ACCIDENT TABLE - DADE COUNTY
Total number of intersections Included -12
2 Lane x 2 Lane Signalized Intersection, AADT/ Lane On Major Road >=5,000

206
Total Number Mean Crashes Standard 85th 90th 95th
Crashes Per Year* Per IntersectionPer Year Deviation** Percentile Percentile Percentile
Collision Type Rear End 180 3.99 3.36 7 7 8Head On 8 0.18 0.26 0 1 1Angle 132 2.93 2.04 5 6 7Left Turn 62 1.37 1.21 3 3 4Right Turn 17 0.37 0.44 1 1 1Sideswipe 53 1.18 1.06 2 3 3Pedestrian/Bicycle 17 0.38 0.46 1 1 1Other/Unknown 109 2.41 2.08 4 5 6
Severity No Injury 201 4.46 3.06 7 8 9Possible Injury 95 2.12 1.35 4 4 5Non-Incapacitating Injury 48 1.07 0.85 2 2 3Incapacitating Injury 15 0.33 0.31 1 1 1Fatal Injury 1 0.02 0.07 0 0 0
Light Conditions Daylight 402 8.92 5.58 15 16 18Dusk 18 0.39 0.36 1 1 1Dawn 4 0.09 0.13 0 0 0Dark (w/street lights) 149 3.32 3.45 6 6 6Dark (wo/ street lights) 4 0.09 0.16 0 0 0
Surface Conditions Dry 488 10.84 7.79 18 20 23Wet 79 1.76 1.15 3 3 4Others 10 0.22 0.29 1 1 1
Month of Year January 43 0.96 0.82 2 2 2February 50 1.11 1.01 2 3 3March 46 1.02 0.87 2 2 2April 49 1.09 0.90 2 2 2May 53 1.17 0.96 2 3 3June 41 0.91 0.84 2 2 2July 57 1.26 0.97 2 2 3August 54 1.20 0.87 2 2 3September 45 1.00 0.93 2 2 3October 51 1.13 0.95 2 2 2November 43 0.95 0.95 2 2 2December 46 1.01 0.86 2 2 3
Day of Week Monday 81 1.79 1.24 3 4 4Tuesday 75 1.67 1.14 3 4 4Wednesday 90 2.00 1.56 3 5 5Thursday 78 1.73 1.23 3 3 3Friday 92 2.04 1.60 3 4 5Saturday 85 1.89 1.65 3 4 4Sunday 76 1.68 1.78 3 3 4
Hour of Day*** 00:00 - 06:00 53 1.17 1.36 2 3 306:01 - 09:00 36 0.80 0.71 1 2 209:01 - 11:00 29 0.63 0.39 1 1 111:01 - 13:00 34 0.74 0.48 1 2 213:01 - 15:00 41 0.91 0.61 2 2 215:01 - 18:00 79 1.74 1.12 3 3 418:01 - 24:00 90 2.00 1.64 3 4 4
* Crashes extracted for years 1999, 2000, 2001and 2002 for long forms only.** Standard Deviation column represents the standard deviation for mean crashes per year per intersection.*** Hour of Day statistics are based upon a portion of the crashes with time information available.
CATEGORY 3
4 Lane x 2 Lane Signalized Intersection, AADT/ Lane On Major Road >=7,000 (Total LTLs <=2)
EXPECTED ANNUAL ACCIDENT TABLE - DADE COUNTY
Total number of intersections Included - 45

207
Total Number Mean Crashes Standard 85th 90th 95th
Crashes Per Year* Per IntersectionPer Year Deviation** Percentile Percentile Percentile
Collision Type Rear End 221 4.79 4.20 10 10 13Head On 8 0.17 0.25 1 1 1Angle 141 3.06 2.36 6 6 7Left Turn 85 1.84 1.91 4 4 5Right Turn 11 0.23 0.31 1 1 1Sideswipe 46 0.99 0.99 2 2 3Pedestrian/Bicycle 11 0.24 0.33 1 1 1Other/Unknown 62 1.34 1.22 2 3 4
Severity No Injury 432 9.19 31.05 9 10 12Possible Injury 252 5.35 18.06 5 6 7Non-Incapacitating Injury 131 2.78 9.39 3 3 4Incapacitating Injury 40 0.84 2.87 1 1 2Fatal Injury 2 0.04 0.17 0 0 0
Light Conditions Daylight 392 8.52 6.50 17 19 19Dusk 11 0.23 0.30 1 1 1Dawn 5 0.11 0.19 0 0 0Dark (w/street lights) 172 3.74 3.24 7 7 11Dark (wo/ street lights) 3 0.07 0.15 0 0 0
Surface Conditions Dry 479 10.41 7.79 20 22 24Wet 93 2.02 1.87 4 4 5Others 11 0.24 0.34 1 1 1
Month of Year January 46 0.99 0.77 2 2 2February 44 0.96 0.88 2 2 3March 52 1.13 0.86 2 2 3April 50 1.08 1.06 2 3 3May 43 0.94 0.87 2 2 3June 51 1.10 0.99 2 3 3July 49 1.07 0.93 2 3 3August 54 1.16 1.00 2 2 3September 49 1.05 1.00 2 3 3October 50 1.09 1.05 2 3 3November 45 0.97 0.82 2 2 2December 52 1.13 0.94 2 2 3
Day of Week Monday 81 1.77 1.41 3 4 4Tuesday 82 1.79 1.46 3 4 4Wednesday 79 1.71 1.47 3 4 5Thursday 84 1.82 1.52 4 4 5Friday 90 1.95 1.56 4 4 5Saturday 89 1.93 1.70 3 4 4Sunday 79 1.71 1.52 3 4 4
Hour of Day*** 00:00 - 06:00 46 0.99 0.96 2 3 306:01 - 09:00 46 1.00 0.82 2 2 209:01 - 11:00 33 0.71 0.73 1 2 211:01 - 13:00 32 0.69 0.61 1 2 213:01 - 15:00 53 1.16 1.04 2 3 315:01 - 18:00 87 1.90 1.60 4 4 418:01 - 24:00 131 2.85 2.56 5 6 9
* Crashes extracted for years 1999, 2000, 2001and 2002 for long forms only.** Standard Deviation column represents the standard deviation for mean crashes per year per intersection.*** Hour of Day statistics are based upon a portion of the crashes with time information available.
CATEGORY 4
4 Lane x 2 Lane Signalized Intersection, AADT/ Lane On Major Road >=7,000 (Total LTLs > 2)
EXPECTED ANNUAL ACCIDENT TABLE - DADE COUNTY
Total number of intersections Included - 46

208
Total Number Mean Crashes Standard 85th 90th 95th
Crashes Per Year* Per IntersectionPer Year Deviation** Percentile Percentile Percentile
Collision Type Rear End 26 1.44 1.11 3 3 3Head On 3 0.15 0.24 0 0 0Angle 35 1.92 2.15 3 4 5Left Turn 15 0.82 0.93 2 2 2Right Turn 4 0.19 0.28 1 1 1Sideswipe 13 0.71 0.92 1 2 3Pedestrian/Bicycle 2 0.10 0.15 0 0 0Other/Unknown 24 1.31 1.20 2 3 3
Severity No Injury 44 2.42 1.78 4 5 5Possible Injury 27 1.47 1.36 3 3 4Non-Incapacitating Injury 10 0.57 0.87 2 2 2Incapacitating Injury 4 0.19 0.22 1 1 1Fatal Injury 0 0.01 0.06 0 0 0
Light Conditions Daylight 79 4.40 3.20 8 9 10Dusk 4 0.21 0.25 1 1 1Dawn 2 0.10 0.19 0 0 0Dark (w/street lights) 33 1.83 2.04 3 4 6Dark (wo/ street lights) 2 0.10 0.24 0 0 1
Surface Conditions Dry 99 5.47 4.46 9 12 14Wet 18 1.00 0.89 2 2 2Others 3 0.17 0.23 0 1 1
Month of Year January 10 0.54 0.58 1 1 2February 10 0.53 0.44 1 1 1March 11 0.61 0.61 1 1 2April 9 0.51 0.49 1 1 1May 14 0.76 0.90 1 2 3June 10 0.53 0.49 1 1 1July 10 0.53 0.57 1 1 2August 10 0.57 0.51 1 1 1September 11 0.58 0.47 1 1 1October 9 0.49 0.59 1 1 1November 8 0.44 0.48 1 1 1December 10 0.54 0.54 1 1 2
Day of Week Monday 17 0.94 0.86 2 2 2Tuesday 17 0.96 0.70 2 2 2Wednesday 12 0.67 0.69 1 1 2Thursday 20 1.08 0.92 2 2 3Friday 20 1.08 0.97 2 2 3Saturday 17 0.93 1.04 1 2 3Sunday 18 0.97 1.07 2 2 3
Hour of Day*** 00:00 - 06:00 12 0.64 0.70 1 1 106:01 - 09:00 9 0.49 0.67 1 1 209:01 - 11:00 6 0.35 0.33 1 1 111:01 - 13:00 6 0.35 0.40 1 1 113:01 - 15:00 10 0.57 0.65 1 1 215:01 - 18:00 17 0.93 0.83 2 2 218:01 - 24:00 24 1.35 1.41 3 3 4
* Crashes extracted for years 1999, 2000, 2001and 2002 for long forms only.** Standard Deviation column represents the standard deviation for mean crashes per year per intersection.*** Hour of Day statistics are based upon a portion of the crashes with time information available.
CATEGORY 5
4 Lane x 2 Lane Signalized Intersection, AADT/ Lane On Major Road < 7,000 (Total LTLs <=2)
EXPECTED ANNUAL ACCIDENT TABLE - DADE COUNTY
Total number of intersections Included - 18

209
Total Number Mean Crashes Standard 85th 90th 95th
Crashes Per Year* Per IntersectionPer Year Deviation** Percentile Percentile Percentile
Collision Type Rear End 47 2.63 3.38 5 6 8Head On 5 0.29 0.36 1 1 1Angle 49 2.72 3.13 5 5 6Left Turn 16 0.88 1.01 2 2 3Right Turn 2 0.13 0.20 0 0 0Sideswipe 13 0.69 0.61 1 1 2Pedestrian/Bicycle 6 0.31 0.43 1 1 1Other/Unknown 28 1.56 1.14 3 3 3
Severity No Injury 61 3.39 3.10 5 6 8Possible Injury 33 1.81 2.42 3 5 6Non-Incapacitating Injury 20 1.08 1.09 2 2 3Incapacitating Injury 6 0.35 0.34 1 1 1Fatal Injury 0 0.01 0.06 0 0 0
Light Conditions Daylight 115 6.39 6.14 11 12 14Dusk 5 0.26 0.35 1 1 1Dawn 2 0.10 0.19 0 0 0Dark (w/street lights) 43 2.39 3.04 4 5 7Dark (wo/ street lights) 1 0.06 0.11 0 0 0
Surface Conditions Dry 129 7.17 7.43 12 13 16Wet 31 1.69 2.08 3 4 5Others 6 0.33 0.41 1 1 1
Month of Year January 15 0.83 1.09 2 2 2February 12 0.64 0.65 1 1 2March 16 0.88 1.05 2 2 3April 14 0.76 0.91 1 2 2May 15 0.83 0.90 2 2 2June 12 0.65 0.52 1 2 2July 17 0.93 1.13 2 2 2August 15 0.85 1.25 1 2 2September 14 0.79 0.67 1 2 2October 11 0.61 0.71 1 1 2November 11 0.63 0.61 1 1 1December 14 0.79 0.96 1 2 2
Day of Week Monday 21 1.17 1.29 2 2 3Tuesday 20 1.11 1.26 2 3 4Wednesday 21 1.18 1.52 3 3 3Thursday 24 1.31 1.24 2 3 3Friday 27 1.49 1.88 3 3 4Saturday 29 1.58 1.70 3 4 5Sunday 25 1.36 1.44 2 3 4
Hour of Day*** 00:00 - 06:00 14 0.75 0.94 1 2 306:01 - 09:00 13 0.69 0.64 1 1 209:01 - 11:00 7 0.40 0.51 1 1 111:01 - 13:00 13 0.74 0.81 1 1 213:01 - 15:00 14 0.76 0.69 1 2 215:01 - 18:00 29 1.58 1.66 3 4 418:01 - 24:00 31 1.71 2.10 3 3 4
* Crashes extracted for years 1999, 2000, 2001and 2002 for long forms only.** Standard Deviation column represents the standard deviation for mean crashes per year per intersection.*** Hour of Day statistics are based upon a portion of the crashes with time information available.
CATEGORY 6
4 Lane x 2 Lane Signalized Intersection, AADT/ Lane On Major Road < 7,000 (Total LTLs > 2)
EXPECTED ANNUAL ACCIDENT TABLE - DADE COUNTY
Total number of intersections Included - 18

210
Total Number Mean Crashes Standard 85th 90th 95th
Crashes Per Year* Per IntersectionPer Year Deviation** Percentile Percentile Percentile
Collision Type Rear End 171 6.58 3.79 10 11 13Head On 10 0.37 0.35 1 1 1Angle 130 4.98 2.59 7 9 9Left Turn 84 3.23 2.40 6 6 8Right Turn 10 0.38 0.36 1 1 1Sideswipe 50 1.90 1.31 3 4 4Pedestrian/Bicycle 10 0.38 0.30 1 1 1Other/Unknown 74 2.83 1.78 5 5 6
Severity No Injury 209 8.03 3.97 13 13 14Possible Injury 110 4.22 1.88 6 7 7Non-Incapacitating Injury 52 2.01 1.40 3 3 5Incapacitating Injury 18 0.70 0.51 1 1 2Fatal Injury 2 0.07 0.11 0 0 0
Light Conditions Daylight 338 13.00 6.31 21 21 23Dusk 11 0.41 0.33 1 1 1Dawn 9 0.33 0.31 1 1 1Dark (w/street lights) 177 6.80 3.48 10 11 11Dark (wo/ street lights) 3 0.10 0.14 0 0 0
Surface Conditions Dry 446 17.16 8.12 27 28 30Wet 76 2.90 1.39 4 4 5Others 15 0.57 0.49 1 1 1
Month of Year January 41 1.57 1.19 3 3 4February 46 1.75 0.85 3 3 3March 47 1.80 1.07 3 3 4April 38 1.46 0.82 2 3 3May 49 1.88 1.09 3 3 4June 45 1.73 1.07 3 3 3July 44 1.67 0.96 3 3 3August 54 2.07 1.10 3 4 4September 41 1.57 1.09 3 3 3October 52 1.99 0.93 3 3 4November 38 1.46 0.75 2 3 3December 44 1.69 0.89 2 3 3
Day of Week Monday 83 3.17 1.57 5 5 6Tuesday 73 2.82 1.40 4 5 5Wednesday 72 2.76 1.57 5 5 5Thursday 72 2.76 1.49 5 5 5Friday 86 3.31 1.72 5 6 6Saturday 78 2.99 1.41 4 4 5Sunday 74 2.83 1.83 5 5 6
Hour of Day*** 00:00 - 06:00 60 2.31 1.35 3 3 506:01 - 09:00 49 1.88 1.14 3 4 409:01 - 11:00 32 1.22 0.64 2 2 211:01 - 13:00 31 1.19 0.68 2 2 213:01 - 15:00 31 1.20 0.75 2 2 215:01 - 18:00 72 2.77 1.42 5 5 518:01 - 24:00 116 4.46 2.27 6 7 7
* Crashes extracted for years 1999, 2000, 2001and 2002 for long forms only.** Standard Deviation column represents the standard deviation for mean crashes per year per intersection.*** Hour of Day statistics are based upon a portion of the crashes with time information available.
CATEGORY 7
4 Lane x 4 Lane Signalized Intersection, AADT/ Lane On Major Road >=7,500
EXPECTED ANNUAL ACCIDENT TABLE - DADE COUNTY
Total number of intersections Included - 26

211
Total Number Mean Crashes Standard 85th 90th 95th
Crashes Per Year* Per IntersectionPer Year Deviation** Percentile Percentile Percentile
Collision Type Rear End 112 4.88 4.40 8 11 13Head On 7 0.30 0.42 1 1 1Angle 105 4.54 4.35 7 9 9Left Turn 35 1.52 1.45 2 4 4Right Turn 10 0.43 0.66 1 1 2Sideswipe 47 2.03 3.14 3 4 5Pedestrian/Bicycle 10 0.43 0.51 1 1 1Other/Unknown 66 2.88 2.29 5 6 7
Severity No Injury 132 5.74 4.29 11 12 12Possible Injury 68 2.96 2.81 4 5 10Non-Incapacitating Injury 27 1.17 0.85 2 2 2Incapacitating Injury 12 0.52 0.55 1 1 2Fatal Injury 1 0.05 0.11 0 0 0
Light Conditions Daylight 281 12.20 10.77 18 27 31Dusk 9 0.40 0.48 1 1 1Dawn 4 0.18 0.27 0 1 1Dark (w/street lights) 96 4.17 3.76 8 9 13Dark (wo/ street lights) 2 0.08 0.19 0 0 0
Surface Conditions Dry 325 14.12 13.12 22 30 38Wet 53 2.30 2.28 3 5 5Others 14 0.61 0.44 1 1 1
Month of Year January 33 1.45 1.30 2 3 4February 29 1.25 1.22 2 3 3March 33 1.41 1.36 3 3 4April 31 1.35 1.30 2 2 3May 31 1.35 1.29 2 3 3June 33 1.43 1.29 2 3 4July 36 1.54 1.61 3 4 5August 38 1.63 1.43 3 4 4September 35 1.51 1.43 3 4 4October 32 1.40 1.18 3 3 4November 28 1.21 1.35 2 3 3December 35 1.50 1.40 3 3 4
Day of Week Monday 61 2.65 2.58 4 7 8Tuesday 52 2.24 2.09 4 4 6Wednesday 58 2.50 1.94 5 5 6Thursday 56 2.45 2.18 4 5 7Friday 63 2.73 2.78 4 5 9Saturday 58 2.51 2.60 5 6 7Sunday 45 1.96 1.81 4 5 6
Hour of Day*** 00:00 - 06:00 23 0.99 0.76 2 2 206:01 - 09:00 29 1.25 1.17 2 2 409:01 - 11:00 22 0.96 0.78 2 2 211:01 - 13:00 23 1.00 0.72 2 2 213:01 - 15:00 32 1.37 1.12 2 3 315:01 - 18:00 47 2.03 1.69 3 4 418:01 - 24:00 66 2.85 2.45 5 5 6
* Crashes extracted for years 1999, 2000, 2001and 2002 for long forms only.** Standard Deviation column represents the standard deviation for mean crashes per year per intersection.*** Hour of Day statistics are based upon a portion of the crashes with time information available.
CATEGORY 8
4 Lane x 4 Lane Signalized Intersection, AADT/ Lane On Major Road < 7,500
EXPECTED ANNUAL ACCIDENT TABLE - DADE COUNTY
Total number of intersections Included - 23

212
Total Number Mean Crashes Standard 85th 90th 95th
Crashes Per Year* Per IntersectionPer Year Deviation** Percentile Percentile Percentile
Collision Type Rear End 234 5.84 4.76 10 11 12Head On 6 0.16 0.28 0 1 1Angle 99 2.47 1.64 5 5 5Left Turn 85 2.13 1.65 4 4 5Right Turn 8 0.21 0.25 1 1 1Sideswipe 46 1.15 1.02 2 3 4Pedestrian/Bicycle 12 0.31 0.53 1 1 1Other/Unknown 57 1.41 1.57 2 2 4
Severity No Injury 186 4.64 3.27 7 10 12Possible Injury 139 3.48 2.32 5 6 9Non-Incapacitating Injury 73 1.82 1.27 3 4 4Incapacitating Injury 29 0.73 0.64 1 2 2Fatal Injury 2 0.04 0.11 0 0 0
Light Conditions Daylight 386 9.64 6.68 13 18 25Dusk 10 0.25 0.24 1 1 1Dawn 6 0.14 0.20 0 0 1Dark (w/street lights) 144 3.59 2.38 6 6 7Dark (wo/ street lights) 2 0.05 0.13 0 0 0
Surface Conditions Dry 448 11.21 7.21 15 22 27Wet 89 2.23 1.72 4 4 5Others 10 0.24 0.45 1 1 1
Month of Year January 39 0.97 0.78 2 2 3February 46 1.14 0.87 2 2 3March 49 1.23 0.92 2 3 3April 45 1.11 1.03 2 2 3May 44 1.11 0.66 2 2 3June 42 1.06 0.69 2 2 2July 48 1.20 1.13 2 3 3August 47 1.18 1.07 2 2 3September 44 1.09 0.94 2 2 3October 51 1.28 0.98 3 3 3November 49 1.22 1.01 2 3 4December 44 1.09 0.74 2 2 2
Day of Week Monday 76 1.90 1.46 3 4 5Tuesday 82 2.06 1.34 3 4 4Wednesday 82 2.05 1.51 3 4 5Thursday 80 1.99 1.53 3 4 6Friday 81 2.03 1.50 3 3 6Saturday 85 2.12 1.46 3 4 5Sunday 61 1.53 1.07 3 3 3
Hour of Day*** 00:00 - 06:00 42 1.04 0.92 2 2 306:01 - 09:00 45 1.11 1.04 2 3 309:01 - 11:00 41 1.03 0.92 2 2 211:01 - 13:00 46 1.15 1.04 2 2 313:01 - 15:00 55 1.38 0.86 2 3 315:01 - 18:00 84 2.11 1.45 4 4 518:01 - 24:00 116 2.89 1.95 5 5 6
* Crashes extracted for years 1999, 2000, 2001and 2002 for long forms only.** Standard Deviation column represents the standard deviation for mean crashes per year per intersection.*** Hour of Day statistics are based upon a portion of the crashes with time information available.
CATEGORY 9
6 Lane x 2 Lane Signalized Intersection, AADT/Lane On Major Road >=7,500
EXPECTED ANNUAL ACCIDENT TABLE - DADE COUNTY
Total Number Of Intersections - 40

213
Total Number Mean Crashes Standard 85th 90th 95th
Crashes Per Year* Per IntersectionPer Year Deviation** Percentile Percentile Percentile
Collision Type Rear End 59 3.69 2.87 7 7 7Head On 2 0.11 0.20 0 0 0Angle 45 2.81 2.47 6 6 6Left Turn 30 1.84 1.79 4 5 5Right Turn 4 0.22 0.29 1 1 1Sideswipe 16 0.97 0.75 2 2 2Pedestrian/Bicycle 4 0.22 0.26 0 1 1Other/Unknown 17 1.05 1.06 2 2 2
Severity No Injury 66 4.09 2.56 7 8 8Possible Injury 35 2.16 1.85 4 4 4Non-Incapacitating Injury 18 1.11 1.22 2 3 3Incapacitating Injury 6 0.39 0.57 1 1 1Fatal Injury 1 0.06 0.11 0 0 0
Light Conditions Daylight 124 7.73 5.38 14 15 15Dusk 5 0.30 0.31 1 1 1Dawn 3 0.17 0.31 0 1 1Dark (w/street lights) 43 2.67 1.97 5 5 5Dark (wo/ street lights) 1 0.03 0.09 0 0 0
Surface Conditions Dry 146 9.14 6.44 17 18 18Wet 26 1.63 1.21 3 3 3Others 2 0.14 0.22 0 0 0
Month of Year January 18 1.14 0.82 2 2 2February 14 0.84 0.65 2 2 2March 17 1.06 0.70 2 2 2April 14 0.89 0.72 2 2 2May 17 1.06 0.85 2 2 2June 14 0.86 0.61 2 2 2July 16 0.98 1.11 2 3 3August 18 1.11 0.96 2 3 3September 13 0.78 0.55 1 1 1October 13 0.78 0.68 2 2 2November 11 0.69 0.57 1 2 2December 11 0.70 0.61 1 2 2
Day of Week Monday 20 1.22 1.02 2 3 3Tuesday 24 1.48 0.95 2 3 3Wednesday 27 1.69 1.34 2 3 3Thursday 27 1.70 1.19 3 3 3Friday 29 1.80 1.46 3 4 4Saturday 27 1.69 1.35 3 4 4Sunday 21 1.33 0.83 2 2 2
Hour of Day*** 00:00 - 06:00 14 0.86 0.79 2 2 206:01 - 09:00 14 0.86 0.81 2 2 209:01 - 11:00 11 0.66 0.51 1 1 111:01 - 13:00 11 0.66 0.76 1 2 213:01 - 15:00 12 0.77 0.78 1 2 215:01 - 18:00 31 1.92 1.32 3 4 418:01 - 24:00 34 2.09 1.34 4 4 4
* Crashes extracted for years 1999, 2000, 2001and 2002 for long forms only.** Standard Deviation column represents the standard deviation for mean crashes per year per intersection.*** Hour of Day statistics are based upon a portion of the crashes with time information available.
CATEGORY 10
6 Lane x 2 Lane Signalized Intersection, AADT/ Lane On Major Road <7,500
EXPECTED ANNUAL ACCIDENT TABLE - DADE COUNTY
Total number of intersections Included - 16

214
Total Number Mean Crashes Standard 85th 90th 95th
Crashes Per Year* Per IntersectionPer Year Deviation** Percentile Percentile Percentile
Collision Type Rear End 349 10.58 5.09 17 18 19Head On 12 0.35 0.40 1 1 1Angle 159 4.83 2.66 8 9 9Left Turn 113 3.42 2.41 6 6 7Right Turn 20 0.61 0.52 1 1 2Sideswipe 81 2.44 1.67 4 5 5Pedestrian/Bicycle 10 0.29 0.44 1 1 1Other/Unknown 92 2.80 1.85 4 4 6
Severity No Injury 321 9.73 4.31 13 14 18Possible Injury 177 5.36 2.60 8 9 9Non-Incapacitating Injury 80 2.42 1.15 4 4 4Incapacitating Injury 29 0.89 0.62 2 2 2Fatal Injury 3 0.08 0.13 0 0 0
Light Conditions Daylight 546 16.55 6.43 23 24 26Dusk 21 0.63 0.52 1 1 1Dawn 8 0.24 0.26 1 1 1Dark (w/street lights) 258 7.80 4.02 11 12 14Dark (wo/ street lights) 3 0.08 0.14 0 0 0
Surface Conditions Dry 691 20.92 8.33 27 32 34Wet 126 3.81 1.74 5 5 7Others 19 0.58 0.68 1 1 2
Month of Year January 63 1.90 1.20 3 4 4February 78 2.35 1.11 4 4 4March 69 2.10 0.99 3 3 4April 65 1.95 1.01 3 3 3May 72 2.17 1.24 3 4 4June 67 2.02 0.94 3 3 3July 71 2.15 1.16 3 4 4August 73 2.22 1.11 3 4 4September 71 2.16 1.22 4 4 4October 75 2.26 1.02 3 4 4November 65 1.97 1.21 3 3 4December 68 2.05 0.95 3 3 3
Day of Week Monday 111 3.36 1.46 5 5 6Tuesday 127 3.85 1.81 5 6 7Wednesday 119 3.61 1.60 5 5 6Thursday 113 3.43 1.44 5 5 5Friday 137 4.14 2.07 6 6 7Saturday 128 3.87 1.95 5 5 6Sunday 101 3.05 1.66 5 5 6
Hour of Day*** 00:00 - 06:00 80 2.42 1.62 4 4 506:01 - 09:00 69 2.09 1.06 3 4 409:01 - 11:00 48 1.44 0.77 2 3 311:01 - 13:00 61 1.83 1.07 3 3 413:01 - 15:00 65 1.95 0.91 3 3 415:01 - 18:00 113 3.42 1.64 5 5 618:01 - 24:00 175 5.30 2.31 8 8 8
* Crashes extracted for years 1999, 2000, 2001and 2002 for long forms only.** Standard Deviation column represents the standard deviation for mean crashes per year per intersection.*** Hour of Day statistics are based upon a portion of the crashes with time information available.
CATEGORY 11
6 Lane x 4 Lane and 6 Lane x 6 Lane Signalized Intersection
EXPECTED ANNUAL ACCIDENT TABLE - DADE COUNTY
Total number of intersections Included - 33

215
Total Number Mean Crashes Standard 85th 90th 95th
Crashes Per Year* Per IntersectionPer Year Deviation** Percentile Percentile Percentile
Collision Type Rear End 163 4.65 5.15 8 10 14Head On 4 0.11 0.20 0 0 0Angle 59 1.69 2.08 3 4 4Left Turn 36 1.02 0.97 2 2 3Right Turn 5 0.14 0.17 0 0 0Sideswipe 33 0.95 1.17 2 2 3Pedestrian/Bicycle 9 0.26 0.29 1 1 1Other/Unknown 48 1.36 1.22 2 3 4
Severity No Injury 123 3.50 2.96 6 7 9Possible Injury 74 2.12 1.78 4 5 5Non-Incapacitating Injury 37 1.05 0.88 2 3 3Incapacitating Injury 17 0.49 0.48 1 1 2Fatal Injury 1 0.04 0.09 0 0 0
Light Conditions Daylight 243 6.95 5.90 11 14 18Dusk 9 0.25 0.30 1 1 1Dawn 4 0.11 0.17 0 0 1Dark (w/street lights) 99 2.83 2.82 5 6 8Dark (wo/ street lights) 2 0.05 0.10 0 0 0
Surface Conditions Dry 284 8.10 6.75 13 18 21Wet 66 1.89 2.15 4 4 5Others 7 0.20 0.23 1 1 1
Month of Year January 26 0.74 0.84 1 2 2February 23 0.66 0.69 1 2 2March 29 0.83 0.70 1 2 2April 29 0.81 0.88 2 2 2May 36 1.01 1.08 2 2 3June 32 0.90 0.93 2 2 3July 29 0.81 0.83 2 2 2August 34 0.96 0.85 2 2 3September 31 0.87 0.74 1 2 2October 33 0.95 1.01 2 2 3November 28 0.80 0.89 1 2 3December 29 0.83 0.80 2 2 2
Day of Week Monday 49 1.40 1.31 2 3 4Tuesday 50 1.42 1.40 2 3 4Wednesday 52 1.49 1.61 4 4 4Thursday 47 1.34 1.18 3 3 3Friday 51 1.45 1.09 3 3 4Saturday 60 1.70 1.68 3 4 5Sunday 49 1.39 1.45 3 4 4
Hour of Day*** 00:00 - 06:00 29 0.81 1.07 2 2 306:01 - 09:00 26 0.75 0.67 1 2 209:01 - 11:00 19 0.54 0.47 1 1 111:01 - 13:00 21 0.59 0.66 2 2 213:01 - 15:00 34 0.96 0.91 2 2 315:01 - 18:00 52 1.49 1.15 3 3 418:01 - 24:00 72 2.06 1.64 4 4 5
* Crashes extracted for years 1999, 2000, 2001and 2002 for long forms only.** Standard Deviation column represents the standard deviation for mean crashes per year per intersection.*** Hour of Day statistics are based upon a portion of the crashes with time information available.
CATEGORY 12
T- Intersection, Signalized, AADT/ Lane On Major Road ?7500
EXPECTED ANNUAL ACCIDENT TABLE - DADE COUNTY
Total number of intersections Included - 35

216
Total Number Mean Crashes Standard 85th 90th 95th
Crashes Per Year* Per IntersectionPer Year Deviation** Percentile Percentile Percentile
Collision Type Rear End 27 2.25 1.71 4 4 5Head On 1 0.04 0.10 0 0 0Angle 14 1.13 1.45 2 3 4Left Turn 11 0.90 1.26 2 3 3Right Turn 2 0.17 0.29 0 1 1Sideswipe 6 0.48 0.39 1 1 1Pedestrian/Bicycle 1 0.10 0.13 0 0 0Other/Unknown 9 0.75 0.65 2 2 2
Severity No Injury 21 1.77 1.46 3 3 4Possible Injury 15 1.27 1.29 3 3 3Non-Incapacitating Injury 10 0.81 0.79 2 2 2Incapacitating Injury 3 0.27 0.33 1 1 1Fatal Injury 1 0.04 0.10 0 0 0
Light Conditions Daylight 48 4.02 3.68 7 9 11Dusk 2 0.15 0.17 0 0 0Dawn 1 0.06 0.11 0 0 0Dark (w/street lights) 19 1.58 1.20 3 3 3Dark (wo/ street lights) 1 0.04 0.10 0 0 0
Surface Conditions Dry 60 5.02 4.10 8 9 11Wet 10 0.79 0.74 1 1 2Others 0 0.00 0.00 0 0 0
Month of Year January 7 0.58 0.64 1 1 2February 7 0.60 0.63 1 1 2March 5 0.40 0.39 1 1 1April 5 0.42 0.47 1 1 1May 7 0.58 0.53 1 1 1June 8 0.63 0.60 1 1 2July 6 0.52 0.46 1 1 1August 5 0.42 0.55 1 1 1September 3 0.25 0.30 1 1 1October 5 0.42 0.50 1 1 1November 6 0.48 0.41 1 1 1December 6 0.52 0.55 1 1 1
Day of Week Monday 10 0.83 0.93 1 2 2Tuesday 11 0.88 0.86 2 2 2Wednesday 10 0.81 0.87 2 2 2Thursday 12 1.02 0.84 2 2 2Friday 11 0.94 0.86 2 2 2Saturday 9 0.71 0.50 1 1 1Sunday 8 0.63 0.69 1 1 2
Hour of Day*** 00:00 - 06:00 6 0.48 0.41 1 1 106:01 - 09:00 8 0.67 1.02 1 1 209:01 - 11:00 4 0.31 0.39 1 1 111:01 - 13:00 5 0.40 0.29 1 1 113:01 - 15:00 7 0.56 0.61 1 1 215:01 - 18:00 11 0.90 0.83 1 2 218:01 - 24:00 10 0.85 0.91 1 1 2
* Crashes extracted for years 1999, 2000, 2001and 2002 for long forms only.** Standard Deviation column represents the standard deviation for mean crashes per year per intersection.*** Hour of Day statistics are based upon a portion of the crashes with time information available.
CATEGORY 13
T - Intersection, Signalized, AADT/ Lane On Major Road <7,500
EXPECTED ANNUAL ACCIDENT TABLE - DADE COUNTY
Total number of intersections Included - 12
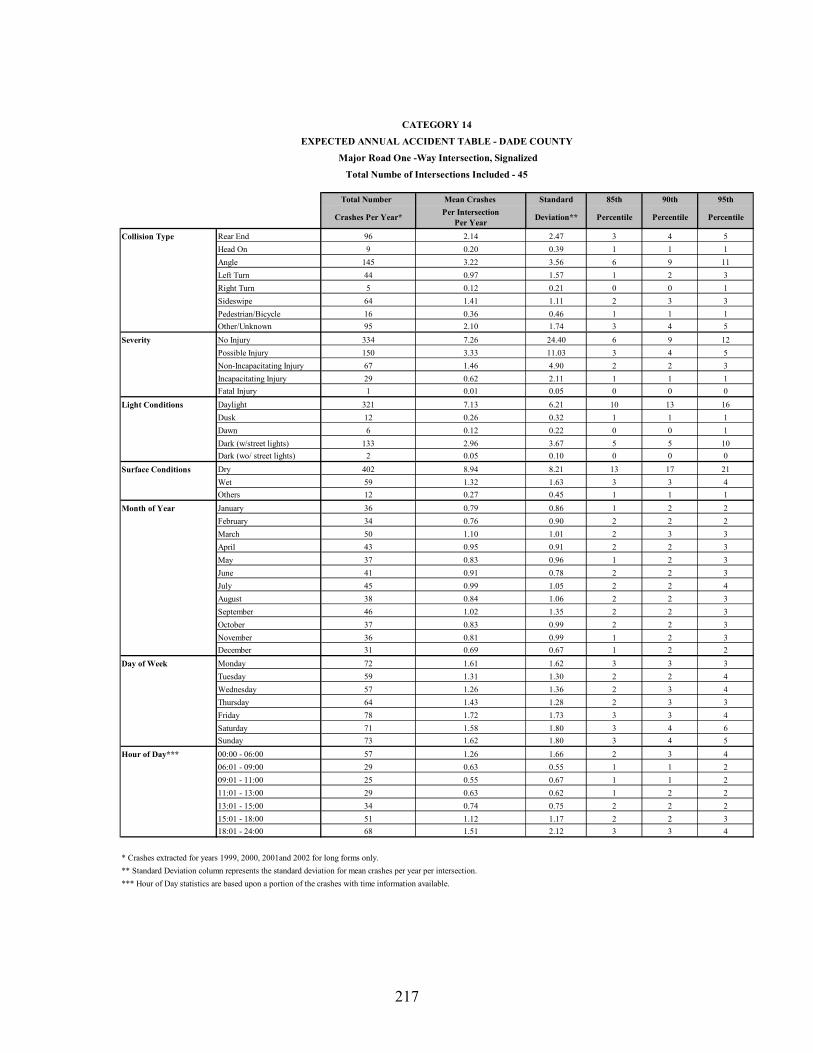
217
Total Number Mean Crashes Standard 85th 90th 95th
Crashes Per Year* Per IntersectionPer Year Deviation** Percentile Percentile Percentile
Collision Type Rear End 96 2.14 2.47 3 4 5Head On 9 0.20 0.39 1 1 1Angle 145 3.22 3.56 6 9 11Left Turn 44 0.97 1.57 1 2 3Right Turn 5 0.12 0.21 0 0 1Sideswipe 64 1.41 1.11 2 3 3Pedestrian/Bicycle 16 0.36 0.46 1 1 1Other/Unknown 95 2.10 1.74 3 4 5
Severity No Injury 334 7.26 24.40 6 9 12Possible Injury 150 3.33 11.03 3 4 5Non-Incapacitating Injury 67 1.46 4.90 2 2 3Incapacitating Injury 29 0.62 2.11 1 1 1Fatal Injury 1 0.01 0.05 0 0 0
Light Conditions Daylight 321 7.13 6.21 10 13 16Dusk 12 0.26 0.32 1 1 1Dawn 6 0.12 0.22 0 0 1Dark (w/street lights) 133 2.96 3.67 5 5 10Dark (wo/ street lights) 2 0.05 0.10 0 0 0
Surface Conditions Dry 402 8.94 8.21 13 17 21Wet 59 1.32 1.63 3 3 4Others 12 0.27 0.45 1 1 1
Month of Year January 36 0.79 0.86 1 2 2February 34 0.76 0.90 2 2 2March 50 1.10 1.01 2 3 3April 43 0.95 0.91 2 2 3May 37 0.83 0.96 1 2 3June 41 0.91 0.78 2 2 3July 45 0.99 1.05 2 2 4August 38 0.84 1.06 2 2 3September 46 1.02 1.35 2 2 3October 37 0.83 0.99 2 2 3November 36 0.81 0.99 1 2 3December 31 0.69 0.67 1 2 2
Day of Week Monday 72 1.61 1.62 3 3 3Tuesday 59 1.31 1.30 2 2 4Wednesday 57 1.26 1.36 2 3 4Thursday 64 1.43 1.28 2 3 3Friday 78 1.72 1.73 3 3 4Saturday 71 1.58 1.80 3 4 6Sunday 73 1.62 1.80 3 4 5
Hour of Day*** 00:00 - 06:00 57 1.26 1.66 2 3 406:01 - 09:00 29 0.63 0.55 1 1 209:01 - 11:00 25 0.55 0.67 1 1 211:01 - 13:00 29 0.63 0.62 1 2 213:01 - 15:00 34 0.74 0.75 2 2 215:01 - 18:00 51 1.12 1.17 2 2 318:01 - 24:00 68 1.51 2.12 3 3 4
* Crashes extracted for years 1999, 2000, 2001and 2002 for long forms only.** Standard Deviation column represents the standard deviation for mean crashes per year per intersection.*** Hour of Day statistics are based upon a portion of the crashes with time information available.
CATEGORY 14
Major Road One -Way Intersection, Signalized
EXPECTED ANNUAL ACCIDENT TABLE - DADE COUNTY
Total Numbe of Intersections Included - 45

218
Total Number Mean Crashes Standard 85th 90th 95th
Crashes Per Year* Per IntersectionPer Year Deviation** Percentile Percentile Percentile
Collision Type Rear End 35 2.30 2.43 4 5 7Head On 4 0.23 0.24 1 1 1Angle 53 3.53 3.88 7 9 11Left Turn 20 1.33 1.85 3 4 5Right Turn 2 0.13 0.33 0 0 1Sideswipe 16 1.08 1.17 2 2 3Pedestrian/Bicycle 3 0.20 0.30 1 1 1Other/Unknown 27 1.82 1.73 4 5 5
Severity No Injury 54 3.58 3.35 7 7 9Possible Injury 34 2.27 2.41 4 5 6Non-Incapacitating Injury 15 0.97 0.98 2 2 3Incapacitating Injury 5 0.35 0.40 1 1 1Fatal Injury 1 0.03 0.09 0 0 0
Light Conditions Daylight 118 7.83 7.48 13 19 24Dusk 4 0.27 0.33 1 1 1Dawn 2 0.12 0.19 0 0 1Dark (w/street lights) 36 2.38 2.66 6 6 7Dark (wo/ street lights) 1 0.03 0.13 0 0 0
Surface Conditions Dry 135 9.02 8.60 16 22 26Wet 20 1.35 1.69 2 4 5Others 4 0.27 0.27 1 1 1
Month of Year January 12 0.78 0.88 2 2 3February 11 0.75 0.91 1 2 3March 13 0.88 0.98 2 2 3April 13 0.85 1.13 1 2 3May 14 0.92 1.03 2 2 3June 14 0.93 0.98 2 2 3July 14 0.92 1.02 2 2 3August 16 1.08 1.05 2 2 3September 12 0.82 0.67 2 2 2October 17 1.15 1.32 2 3 3November 14 0.93 1.05 2 2 3December 9 0.62 0.65 1 1 2
Day of Week Monday 28 1.88 1.93 4 5 5Tuesday 22 1.48 1.52 3 4 4Wednesday 22 1.45 1.56 3 4 5Thursday 21 1.37 1.28 3 3 4Friday 24 1.60 1.51 2 4 5Saturday 22 1.48 1.83 2 4 5Sunday 21 1.37 1.30 3 3 3
Hour of Day*** 00:00 - 06:00 9 0.60 0.65 1 1 106:01 - 09:00 13 0.87 0.90 2 2 209:01 - 11:00 14 0.93 0.88 2 2 211:01 - 13:00 12 0.78 0.79 1 2 213:01 - 15:00 14 0.92 0.86 2 2 315:01 - 18:00 19 1.25 1.30 2 2 318:01 - 24:00 28 1.85 2.14 4 5 6
* Crashes extracted for years 1999, 2000, 2001and 2002 for long forms only.** Standard Deviation column represents the standard deviation for mean crashes per year per intersection.*** Hour of Day statistics are based upon a portion of the crashes with time information available.
EXPECTED ANNUAL ACCIDENT TABLE - DADE COUNTY
Minor Road One - Way Intersection, Signalized
Total Number of Intesections - 15
CATEGORY 15

219
Total Number Mean Crashes Standard 85th 90th 95th
Crashes Per Year* Per IntersectionPer Year Deviation** Percentile Percentile Percentile
Collision Type Rear End 5 1.13 0.85 2 2 2Head On 1 0.31 0.13 0 0 0Angle 15 3.81 4.68 7 8 9Left Turn 4 0.94 1.56 2 2 3Right Turn 1 0.13 0.25 0 0 0Sideswipe 8 1.88 1.98 3 4 4Pedestrian/Bicycle 0 0.06 0.13 0 0 0Other/Unknown 7 1.75 2.19 3 4 4
Severity No Injury 12 3.00 2.52 5 5 6Possible Injury 4 1.00 0.89 2 2 2Non-Incapacitating Injury 3 0.81 1.14 2 2 2Incapacitating Injury 1 0.13 0.25 0 0 0Fatal Injury 0 0.00 0.00 0 0 0
Light Conditions Daylight 30 7.44 8.74 13 16 18Dusk 2 0.56 0.66 1 1 1Dawn 1 0.13 0.14 0 0 0Dark (w/street lights) 8 1.88 1.96 3 4 4Dark (wo/ street lights) 0 0.00 0.00 0 0 0
Surface Conditions Dry 33 8.25 9.25 14 17 19Wet 5 1.31 1.80 2 3 3Others 2 0.44 0.43 1 1 1
Month of Year January 2 0.56 0.63 1 1 1February 5 1.13 1.09 2 2 2March 4 1.06 1.31 2 2 3April 4 1.06 1.31 2 2 3May 3 0.69 0.88 1 1 2June 4 0.94 0.59 1 2 2July 4 1.00 1.21 2 2 2August 4 0.88 1.09 2 2 2September 3 0.69 0.63 1 1 1October 3 0.63 0.60 1 1 1November 4 0.94 1.39 2 2 3December 2 0.44 0.88 1 1 1
Day of Week Monday 5 1.19 0.85 2 2 2Tuesday 7 1.81 2.96 4 5 5Wednesday 6 1.38 1.76 3 3 4Thursday 6 1.44 1.42 2 3 3Friday 7 1.81 2.80 4 4 5Saturday 5 1.31 0.72 2 2 2Sunday 4 1.06 1.33 2 2 3
Hour of Day*** 00:00 - 06:00 2 0.44 0.43 1 1 106:01 - 09:00 3 0.81 0.52 1 1 109:01 - 11:00 2 0.50 0.68 1 1 111:01 - 13:00 3 0.75 0.54 1 1 113:01 - 15:00 2 0.50 0.54 1 1 115:01 - 18:00 4 1.00 1.17 2 2 218:01 - 24:00 4 0.94 0.77 2 2 2
* Crashes extracted for years 1999, 2000, 2001and 2002 for long forms only.** Standard Deviation column represents the standard deviation for mean crashes per year per intersection.*** Hour of Day statistics are based upon a portion of the crashes with time information available.
EXPECTED ANNUAL ACCIDENT TABLE - DADE COUNTY
One - Way Major and One - Way Minor Road Intersection, Signalized
Total Number of Intersections Included - 4
CATEGORY 16

220
Total Number Mean Crashes Standard 85th 90th 95th
Crashes Per Year* Per IntersectionPer Year Deviation** Percentile Percentile Percentile
Collision Type Rear End 13 1.59 1.31 3 3 3Head On 0 0.03 0.09 0 0 0Angle 14 1.69 2.04 2 4 5Left Turn 9 1.09 1.25 1 2 3Right Turn 0 0.00 0.00 0 0 0Sideswipe 5 0.59 1.29 0 1 3Pedestrian/Bicycle 1 0.09 0.13 0 0 0Other/Unknown 4 0.50 0.30 1 1 1
Severity No Injury 21 2.59 2.18 4 5 6Possible Injury 10 1.28 1.47 1 2 4Non-Incapacitating Injury 6 0.72 1.05 1 2 2Incapacitating Injury 2 0.19 0.35 0 0 1Fatal Injury 0 0.00 0.00 0 0 0
Light Conditions Daylight 31 3.84 3.38 5 7 9Dusk 1 0.09 0.13 0 0 0Dawn 0 0.03 0.09 0 0 0Dark (w/street lights) 13 1.63 2.36 2 4 5Dark (wo/ street lights) 0 0.03 0.09 0 0 0
Surface Conditions Dry 36 4.53 5.02 5 8 12Wet 8 0.97 0.84 2 2 2Others 1 0.09 0.13 0 0 0
Month of Year January 3 0.41 0.40 1 1 1February 2 0.28 0.25 0 1 1March 3 0.38 0.35 1 1 1April 3 0.38 0.42 1 1 1May 2 0.25 0.19 0 1 1June 3 0.38 0.50 1 1 1July 4 0.44 0.66 1 1 1August 5 0.56 0.48 1 1 1September 5 0.66 0.69 1 1 2October 4 0.50 0.40 1 1 1November 6 0.72 1.17 1 2 3December 5 0.66 0.95 1 2 2
Day of Week Monday 8 0.94 1.06 2 2 3Tuesday 7 0.81 0.90 1 1 2Wednesday 5 0.56 0.50 1 1 1Thursday 4 0.53 0.78 1 2 2Friday 8 1.00 1.64 1 2 4Saturday 8 1.00 0.79 2 2 2Sunday 6 0.75 0.60 1 1 1
Hour of Day*** 00:00 - 06:00 4 0.53 0.83 1 1 206:01 - 09:00 5 0.66 0.55 1 1 109:01 - 11:00 3 0.38 0.35 1 1 111:01 - 13:00 4 0.47 0.47 1 1 113:01 - 15:00 6 0.72 1.35 1 2 315:01 - 18:00 8 1.03 0.87 1 2 218:01 - 24:00 8 1.00 1.34 1 2 3
* Crashes extracted for years 1999, 2000, 2001and 2002 for long forms only.** Standard Deviation column represents the standard deviation for mean crashes per year per intersection.*** Hour of Day statistics are based upon a portion of the crashes with time information available.
CATEGORY 17
Ramp Intersection, Signalized, AADT/ Lane On Major Road >=7,500
EXPECTED ANNUAL ACCIDENT TABLE - DADE COUNTY
Total number of intersections Included - 8

221
Total Number Mean Crashes Standard 85th 90th 95th
Crashes Per Year* Per IntersectionPer Year Deviation** Percentile Percentile Percentile
Collision Type Rear End 2 0.88 1.24 1 2 2Head On 0 0.13 0.18 0 0 0Angle 4 2.00 1.77 3 3 3Left Turn 3 1.38 1.59 2 2 2Right Angle 0 0.00 0.00 0 0 0Sideswipe 1 0.63 0.88 1 1 1Pedestrian/Bicycle 0 0.00 0.00 0 0 0Other/Unknown 2 1.13 0.88 2 2 2
Severity No Injury 4 1.75 2.12 3 3 3Possible Injury 3 1.25 1.41 2 2 2Non-Incapacitating Injury 2 1.00 0.35 1 1 1Incapacitating Injury 0 0.13 0.18 0 0 0Fatal Injury 0 0.00 0.00 0 0 0
Light Conditions Daylight 11 5.38 5.48 8 8 9Dusk 0 0.00 0.00 0 0 0Dawn 0 0.13 0.18 0 0 0Dark (w/street lights) 1 0.63 0.88 1 1 1Dark (wo/ street lights) 0 0.13 0.18 0 0 0
Surface Conditions Dry 9 4.63 4.42 7 7 7Wet 2 1.13 1.59 2 2 2Others 1 0.38 0.53 1 1 1
Month of Year January 1 0.50 0.71 1 1 1February 1 0.25 0.35 0 0 0March 1 0.50 0.00 1 1 1April 2 0.75 1.06 1 1 1May 1 0.25 0.35 0 0 0June 1 0.63 0.18 1 1 1July 2 1.00 1.41 2 2 2August 1 0.63 0.18 1 1 1September 2 1.00 1.41 2 2 2October 1 0.25 0.35 0 0 0November 0 0.13 0.18 0 0 0December 1 0.25 0.35 0 0 0
Day of Week Monday 1 0.50 0.71 1 1 1Tuesday 3 1.25 1.77 2 2 2Wednesday 2 1.13 0.53 1 1 1Thursday 2 1.00 1.41 2 2 2Friday 2 0.75 1.06 1 1 1Saturday 2 0.88 0.88 1 1 1Sunday 1 0.63 0.18 1 1 1
Hour of Day*** 00:00 - 06:00 1 0.50 0.71 1 1 106:01 - 09:00 3 1.50 1.06 2 2 209:01 - 11:00 0 0.13 0.18 0 0 011:01 - 13:00 0 0.13 0.18 0 0 013:01 - 15:00 1 0.38 0.18 0 0 015:01 - 18:00 2 0.88 1.24 1 2 218:01 - 24:00 1 0.63 0.88 1 1 1
* Crashes extracted for years 1999, 2000, 2001and 2002 for long forms only.** Standard Deviation column represents the standard deviation for mean crashes per year per intersection.*** Hour of Day statistics are based upon a portion of the crashes with time information available.
CATEGORY 18
Ramp Intersection, Signalized, AADT/ Lane On Major Road <7,500
EXPECTED ANNUAL ACCIDENT TABLE - DADE COUNTY
Total number of intersections Included - 2

222
Total Number Mean Crashes Standard 85th 90th 95th
Crashes Per Year* Per IntersectionPer Year Deviation** Percentile Percentile Percentile
Collision Type Rear End 23 1.61 1.21 3 3 3Head On 0 0.02 0.07 0 0 0Angle 15 1.05 0.92 2 2 2Left Turn 10 0.71 1.19 1 2 3Right Turn 0 0.02 0.07 0 0 0Sideswipe 14 0.96 0.84 2 2 2Pedestrian/Bicycle 3 0.20 0.26 1 1 1Other/Unknown 19 1.32 1.26 2 3 4
Severity No Injury 26 1.88 1.30 3 3 4Possible Injury 10 0.73 0.53 2 2 2Non-Incapacitating Injury 5 0.38 0.42 1 1 1Incapacitating Injury 2 0.13 0.16 0 0 0Fatal Injury 0 0.02 0.07 0 0 0
Light Conditions Daylight 58 4.16 3.17 7 8 9Dusk 1 0.09 0.16 0 0 0Dawn 2 0.16 0.21 0 0 0Dark (w/street lights) 21 1.46 1.08 2 2 3Dark (wo/ street lights) 0 0.02 0.07 0 0 0
Surface Conditions Dry 73 5.21 3.88 9 9 11Wet 8 0.55 0.54 1 1 1Others 2 0.13 0.19 0 0 1
Month of Year January 7 0.50 0.37 1 1 1February 7 0.52 0.39 1 1 1March 8 0.59 0.65 1 2 2April 8 0.55 0.31 1 1 1May 5 0.36 0.45 1 1 1June 6 0.41 0.43 1 1 1July 7 0.48 0.71 1 2 2August 9 0.63 0.61 1 1 2September 8 0.59 0.54 1 1 2October 5 0.36 0.32 1 1 1November 5 0.38 0.34 1 1 1December 8 0.54 0.37 1 1 1
Day of Week Monday 12 0.82 0.70 1 2 2Tuesday 11 0.80 0.50 1 1 2Wednesday 10 0.71 0.69 1 2 2Thursday 11 0.80 0.84 2 2 2Friday 16 1.13 1.21 2 2 3Saturday 10 0.71 0.55 1 2 2Sunday 13 0.91 0.62 2 2 2
Hour of Day*** 00:00 - 06:00 8 0.54 0.62 1 1 106:01 - 09:00 5 0.36 0.31 1 1 109:01 - 11:00 3 0.21 0.32 1 1 111:01 - 13:00 4 0.30 0.30 1 1 113:01 - 15:00 5 0.34 0.40 1 1 115:01 - 18:00 11 0.77 0.86 1 2 218:01 - 24:00 9 0.61 0.31 1 1 1
* Crashes extracted for years 1999, 2000, 2001and 2002 for long forms only.** Standard Deviation column represents the standard deviation for mean crashes per year per intersection.*** Hour of Day statistics are based upon a portion of the crashes with time information available.
EXPECTED ANNUAL ACCIDENT TABLE - DADE COUNTY
T Intersection With at Least One - Way Street, Signalized
Total number of intersections Included - 14
CATEGORY 19

223
APPENDIX D 19 CATEGORY CRASH PROFILE TABLES FOR HILLSBOROUGH
COUNTY

224
Total Number Mean Crashes Standard 85th 90th 95th
Crashes Per Year* Per IntersectionPer Year Deviation** Percentile Percentile Percentile
Collision Type Rear End 42 1.62 1.39 3 4 4Head On 2 0.06 0.16 0 0 0Angle 27 1.03 0.85 2 2 3Left Turn 28 1.09 1.08 2 2 3Right Turn 2 0.09 0.15 0 0 0Sideswipe 2 0.09 0.15 0 0 0Pedestrian/Bicycle 1 0.05 0.20 0 0 0Other/Unknown 5 0.18 0.25 0 1 1
Severity No Injury 53 2.05 1.35 3 4 5Possible Injury 21 0.82 0.83 1 2 3Non-Incapacitating Injury 13 0.50 0.65 1 2 2Incapacitating Injury 7 0.26 0.32 1 1 1Fatal Injury 0 0.00 0.00 0 0 0
Light Conditions Daylight 76 2.94 2.34 5 6 7Dusk 3 0.12 0.23 0 1 1Dawn 2 0.08 0.14 0 0 0Dark (w/street lights) 17 0.67 0.71 2 2 2Dark (wo/ street lights) 10 0.37 0.56 1 1 1
Surface Conditions Dry 90 3.45 2.47 6 7 8Wet 18 0.71 0.75 2 2 2Slippery 1 0.03 0.09 0 0 0Others 0 0.01 0.07 0 0 0
Month of Year January 8 0.32 0.44 1 1 1February 7 0.28 0.36 1 1 1March 10 0.37 0.51 1 1 1April 8 0.31 0.43 1 1 1May 10 0.40 0.41 1 1 1June 9 0.36 0.33 1 1 1July 8 0.29 0.39 1 1 1August 14 0.55 0.54 1 1 2September 7 0.27 0.27 1 1 1October 10 0.38 0.45 1 1 1November 9 0.33 0.31 1 1 1December 9 0.33 0.41 1 1 1
Day of Week Monday 15 0.59 0.56 1 1 2Tuesday 16 0.63 0.65 1 1 2Wednesday 16 0.62 0.52 1 1 2Thursday 17 0.65 0.71 1 2 2Friday 16 0.60 0.63 1 2 2Saturday 13 0.51 0.56 1 1 2Sunday 16 0.60 0.56 1 1 2
Hour of Day 00:00 - 06:00 7 0.27 0.31 1 1 106:01 - 09:00 13 0.50 0.49 1 1 109:01 - 11:00 8 0.29 0.27 1 1 111:01 - 13:00 11 0.42 0.54 1 1 113:01 - 15:00 10 0.37 0.54 1 1 115:01 - 18:00 23 0.90 0.86 2 2 318:01 - 24:00 28 1.09 1.10 2 3 3
* Crashes extracted for years 1999, 2000 and 2001 long forms only.** Standard Deviation column represents the standard deviation for mean crashes per year per intersection.
CATEGORY 1
2 Lane x 2 Lane Signalized Intersection, AADT/ Lane On Major Road >=5,000
EXPECTED ANNUAL ACCIDENT TABLE - HILLSBOROUGH
Total number of intersections Included - 26

225
Total Number Mean Crashes Standard 85th 90th 95th
Crashes Per Year* Per IntersectionPer Year Deviation** Percentile Percentile Percentile
Collision Type Rear End 19 1.24 1.16 2 3 3Head On 1 0.07 0.19 0 0 0Angle 19 1.29 0.92 3 3 3Left Turn 19 1.24 1.41 3 3 4Right Turn 1 0.04 0.12 0 0 0Sideswipe 2 0.11 0.21 0 0 0Pedestrian/Bicycle 1 0.04 0.12 0 0 0Other/Unknown 1 0.04 0.12 0 0 0
Severity No Injury 31 2.04 1.70 3 4 5Possible Injury 12 0.80 0.68 1 2 2Non-Incapacitating Injury 10 0.69 0.75 2 2 2Incapacitating Injury 4 0.24 0.41 0 1 1Fatal Injury 0 0.00 0.00 0 0 0
Light Conditions Daylight 42 2.82 2.33 5 5 6Dusk 2 0.13 0.21 0 0 0Dawn 1 0.04 0.12 0 0 0Dark (w/street lights) 11 0.73 0.70 1 1 2Dark (wo/ street lights) 5 0.33 0.40 1 1 1
Surface Conditions Dry 52 3.49 2.83 5 6 8Wet 8 0.56 0.54 1 1 1Slippery 1 0.04 0.12 0 0 0Others 1 0.05 0.12 0 0 0
Month of Year January 3 0.22 0.24 0 1 1February 7 0.44 0.60 1 1 1March 4 0.24 0.43 0 0 1April 4 0.29 0.31 1 1 1May 6 0.40 0.57 1 1 2June 6 0.38 0.40 1 1 1July 4 0.29 0.35 1 1 1August 7 0.49 0.52 1 1 1September 6 0.38 0.43 1 1 1October 3 0.22 0.37 0 1 1November 5 0.33 0.45 1 1 1December 6 0.40 0.52 1 1 1
Day of Week Monday 12 0.78 0.69 1 1 2Tuesday 6 0.40 0.40 1 1 1Wednesday 9 0.62 0.55 1 1 1Thursday 10 0.69 0.64 1 1 2Friday 7 0.47 0.47 1 1 1Saturday 6 0.42 0.58 1 1 2Sunday 11 0.71 0.81 1 2 2
Hour of Day 00:00 - 06:00 2 0.11 0.27 0 0 106:01 - 09:00 6 0.40 0.49 1 1 109:01 - 11:00 4 0.27 0.42 1 1 111:01 - 13:00 6 0.38 0.49 1 1 113:01 - 15:00 8 0.53 0.56 1 1 115:01 - 18:00 15 1.00 0.85 2 2 218:01 - 24:00 20 1.33 1.08 2 2 3
* Crashes extracted for years 1999, 2000 and 2001 for long forms only.** Standard Deviation column represents the standard deviation for mean crashes per year per intersection.
CATEGORY 2
2 Lane x 2 Lane Signalized Intersection, AADT/ Lane On Major Road < 5,000
EXPECTED ANNUAL ACCIDENT TABLE - HILLSBOROUGH
Total number of intersections Included - 14

226
Total Number Mean Crashes Standard 85th 90th 95th
Crashes Per Year* Per IntersectionPer Year Deviation** Percentile Percentile Percentile
Collision Type Rear End 3 0.89 0.84 1 2 2Head On 0 0.11 0.19 0 0 0Angle 2 0.67 0.88 1 1 2Left Turn 2 0.56 0.51 1 1 1Right Turn 0 0.11 0.19 0 0 0Sideswipe 0 0.11 0.19 0 0 0Pedestrian/Bicycle 0 0.11 0.19 0 0 0Other/Unknown 0 0.11 0.19 0 0 0
Severity No Injury 3 1.00 1.00 2 2 2Possible Injury 2 0.78 1.07 2 2 2Non-Incapacitating Injury 2 0.67 0.88 1 1 2Incapacitating Injury 1 0.22 0.38 0 1 1Fatal Injury 0 0.00 0.00 0 0 0
Light Conditions Daylight 4 1.44 1.35 2 2 3Dusk 1 0.22 0.19 0 0 0Dawn 1 0.22 0.38 0 1 1Dark (w/street lights) 0 0.11 0.19 0 0 0Dark (wo/ street lights) 2 0.67 0.67 1 1 1
Surface Conditions Dry 6 2.11 2.17 4 4 4Wet 2 0.56 0.51 1 1 1Slippery 0 0.00 0.00 0 0 0Others 0 0.00 0.00 0 0 0
Month of Year January 0 0.11 0.19 0 0 0February 1 0.33 0.33 1 1 1March 1 0.22 0.38 0 1 1April 1 0.33 0.33 1 1 1May 1 0.33 0.33 1 1 1June 0 0.11 0.19 0 0 0July 0 0.11 0.19 0 0 0August 1 0.22 0.38 0 1 1September 1 0.33 0.33 1 1 1October 1 0.22 0.38 0 1 1November 1 0.33 0.58 1 1 1December 1 0.44 0.77 1 1 1
Day of Week Monday 1 0.33 0.33 1 1 1Tuesday 3 0.89 0.84 1 2 2Wednesday 1 0.22 0.38 0 1 1Thursday 2 0.67 0.67 1 1 1Friday 0 0.11 0.19 0 0 0Saturday 1 0.22 0.38 0 1 1Sunday 1 0.22 0.19 0 0 0
Hour of Day 00:00 - 06:00 1 0.22 0.38 0 1 106:01 - 09:00 1 0.33 0.58 1 1 109:01 - 11:00 0 0.00 0.00 0 0 011:01 - 13:00 1 0.22 0.38 0 1 113:01 - 15:00 1 0.22 0.38 0 1 115:01 - 18:00 1 0.44 0.51 1 1 118:01 - 24:00 4 1.22 1.07 2 2 2
* Crashes extracted for years 1999, 2000 and 2001 for long forms only.** Standard Deviation column represents the standard deviation for mean crashes per year per intersection.
CATEGORY 3
4 Lane x 2 Lane Signalized Intersection, AADT/ Lane On Major Road >=7,000 (Total LTLs <= 2)
EXPECTED ANNUAL ACCIDENT TABLE - HILLSBOROUGH
Total number of intersections Included - 3

227
Total Number Mean Crashes Standard 85th 90th 95th
Crashes Per Year* Per IntersectionPer Year Deviation** Percentile Percentile Percentile
Collision Type Rear End 78 3.12 2.92 6 7 9Head On 2 0.08 0.15 0 0 0Angle 41 1.63 1.68 2 2 6Left Turn 49 1.97 1.84 4 4 5Right Turn 4 0.16 0.29 0 1 1Sideswipe 5 0.21 0.32 0 1 1Pedestrian/Bicycle 3 0.11 0.16 0 0 0Other/Unknown 10 0.40 0.43 1 1 1
Severity No Injury 85 3.40 2.58 6 8 8Possible Injury 35 1.41 1.17 3 3 3Non-Incapacitating Injury 26 1.03 1.05 2 3 3Incapacitating Injury 17 0.68 0.63 1 2 2Fatal Injury 0 0.01 0.07 0 0 0
Light Conditions Daylight 122 4.87 3.94 9 10 12Dusk 4 0.15 0.26 0 0 1Dawn 4 0.17 0.24 0 1 1Dark (w/street lights) 48 1.91 1.77 4 4 4Dark (wo/ street lights) 14 0.55 0.99 2 2 2
Surface Conditions Dry 166 6.64 5.13 13 14 15Wet 23 0.91 0.83 2 2 2Slippery 1 0.03 0.09 0 0 0Others 2 0.09 0.23 0 1 1
Month of Year January 16 0.65 0.64 1 1 1February 14 0.55 0.59 1 2 2March 18 0.71 0.66 1 1 2April 17 0.69 0.65 1 1 2May 15 0.61 0.74 1 2 2June 15 0.60 0.65 1 1 2July 16 0.63 0.78 2 2 2August 12 0.49 0.52 1 1 1September 15 0.59 0.58 1 2 2October 19 0.77 0.90 2 2 3November 19 0.77 0.69 1 2 2December 15 0.61 0.71 1 2 2
Day of Week Monday 27 1.07 0.99 2 2 2Tuesday 31 1.24 1.07 2 3 3Wednesday 32 1.29 1.08 2 3 4Thursday 25 1.01 0.97 2 2 3Friday 28 1.11 1.14 2 2 3Saturday 23 0.92 0.99 1 2 3Sunday 26 1.04 1.00 2 2 3
Hour of Day 00:00 - 06:00 13 0.52 0.67 1 2 206:01 - 09:00 20 0.79 0.78 2 2 209:01 - 11:00 11 0.44 0.50 1 1 211:01 - 13:00 14 0.55 0.52 1 1 113:01 - 15:00 20 0.81 0.79 2 2 215:01 - 18:00 36 1.45 1.11 3 3 318:01 - 24:00 57 2.27 1.92 4 5 5
* Crashes extracted for years 1999, 2000 and 2001 for long forms only.** Standard Deviation column represents the standard deviation for mean crashes per year per intersection.
CATEGORY 4
4 Lane x 2 Lane Signalized Intersection, AADT/ Lane On Major Road >=7,000 (Total LTLs > 2)
EXPECTED ANNUAL ACCIDENT TABLE - HILLSBOROUGH
Total number of intersections Included - 25

228
Total Number Mean Crashes Standard 85th 90th 95th
Crashes Per Year* Per IntersectionPer Year Deviation** Percentile Percentile Percentile
Collision Type Rear End 1 0.33 0.33 1 1 1Head On 0 0.00 0.00 0 0 0Angle 3 1.00 1.45 2 2 2Left Turn 5 1.56 1.84 3 3 3Right Turn 0 0.00 0.00 0 0 0Sideswipe 1 0.22 0.38 0 1 1Pedestrian/Bicycle 0 0.00 0.00 0 0 0Other/Unknown 1 0.33 0.33 1 1 1
Severity No Injury 6 1.89 1.68 3 3 3Possible Injury 1 0.44 0.77 1 1 1Non-Incapacitating Injury 2 0.67 1.15 1 2 2Incapacitating Injury 1 0.33 0.58 1 1 1Fatal Injury 0 0.00 0.00 0 0 0
Light Conditions Daylight 8 2.67 3.21 5 5 6Dusk 0 0.00 0.00 0 0 0Dawn 0 0.00 0.00 0 0 0Dark (w/street lights) 0 0.11 0.19 0 0 0Dark (wo/ street lights) 2 0.56 0.69 1 1 1
Surface Conditions Dry 10 3.33 4.10 6 7 7Wet 0 0.00 0.00 0 0 0Slippery 0 0.00 0.00 0 0 0Others 0 0.00 0.00 0 0 0
Month of Year January 1 0.22 0.19 0 0 0February 2 0.67 1.15 1 2 2March 1 0.33 0.58 1 1 1April 2 0.56 0.96 1 1 2May 1 0.22 0.38 0 1 1June 1 0.33 0.58 1 1 1July 1 0.44 0.51 1 1 1August 0 0.11 0.19 0 0 0September 1 0.33 0.33 1 1 1October 1 0.22 0.19 0 0 0November 1 0.44 0.51 1 1 1December 1 0.33 0.33 1 1 1
Day of Week Monday 2 0.78 1.07 2 2 2Tuesday 1 0.44 0.77 1 1 1Wednesday 2 0.56 0.69 1 1 1Thursday 2 0.56 0.51 1 1 1Friday 3 0.89 1.26 2 2 2Saturday 0 0.11 0.19 0 0 0Sunday 0 0.11 0.19 0 0 0
Hour of Day 00:00 - 06:00 0 0.11 0.19 0 0 006:01 - 09:00 2 0.56 0.96 1 1 209:01 - 11:00 0 0.11 0.19 0 0 011:01 - 13:00 0 0.11 0.19 0 0 013:01 - 15:00 2 0.56 0.96 1 1 215:01 - 18:00 3 1.11 0.84 2 2 218:01 - 24:00 3 0.89 1.26 2 2 2
* Crashes extracted for years 1999, 2000 and 2001 for long forms only.** Standard Deviation column represents the standard deviation for mean crashes per year per intersection.
CATEGORY 5
4 Lane x 2 Lane Signalized Intersection, AADT/ Lane On Major Road < 7,000 (Total LTLs <= 2)
EXPECTED ANNUAL ACCIDENT TABLE - HILLSBOROUGH
Total number of intersections Included - 3

229
Total Number Mean Crashes Standard 85th 90th 95th
Crashes Per Year* Per IntersectionPer Year Deviation** Percentile Percentile Percentile
Collision Type Rear End 35 1.86 1.38 3 3 4Head On 2 0.11 0.16 0 0 0Angle 26 1.35 1.38 3 3 4Left Turn 24 1.26 1.68 2 3 4Right Angle 3 0.14 0.23 0 0 1Sideswipe 2 0.11 0.16 0 0 0Pedestrian/Bicycle 1 0.04 0.11 0 0 0Other/Unknown 4 0.21 0.34 0 1 1
Severity No Injury 40 2.12 1.73 4 4 5Possible Injury 20 1.04 1.13 1 1 2Non-Incapacitating Injury 13 0.68 0.72 2 2 2Incapacitating Injury 10 0.51 0.64 1 1 1Fatal Injury 0 0.02 0.08 0 0 0
Light Conditions Daylight 67 3.54 3.09 6 7 7Dusk 3 0.18 0.20 0 0 0Dawn 3 0.14 0.23 0 0 1Dark (w/street lights) 14 0.74 0.74 2 2 2Dark (wo/ street lights) 9 0.46 1.03 0 1 3
Surface Conditions Dry 80 4.23 3.75 8 8 10Wet 14 0.72 0.80 1 2 2Slippery 2 0.11 0.19 0 0 0Others 0 0.02 0.08 0 0 0
Month of Year January 11 0.58 0.60 1 1 2February 7 0.35 0.48 1 1 1March 7 0.39 0.49 1 1 1April 6 0.32 0.38 1 1 1May 8 0.40 0.49 1 1 1June 9 0.49 0.50 1 1 1July 9 0.47 0.45 1 1 1August 9 0.47 0.61 1 1 2September 5 0.28 0.43 0 1 1October 8 0.40 0.45 1 1 1November 12 0.61 0.92 1 2 2December 6 0.32 0.48 1 1 1
Day of Week Monday 13 0.70 0.81 1 2 2Tuesday 15 0.77 0.64 1 1 2Wednesday 15 0.77 0.79 1 2 2Thursday 12 0.65 0.77 1 1 2Friday 13 0.70 0.82 2 2 2Saturday 12 0.61 0.80 2 2 2Sunday 17 0.88 0.85 2 2 3
Hour of Day 00:00 - 06:00 4 0.23 0.30 0 1 106:01 - 09:00 10 0.53 0.66 1 1 209:01 - 11:00 7 0.39 0.39 1 1 111:01 - 13:00 10 0.51 0.67 1 1 213:01 - 15:00 13 0.67 0.68 1 1 215:01 - 18:00 18 0.95 0.71 2 2 218:01 - 24:00 24 1.28 1.39 2 3 4
* Crashes extracted for years 1999, 2000 and 2001 for long forms only.** Standard Deviation column represents the standard deviation for mean crashes per year per intersection.
CATEGORY 6
4 Lane x 2 Lane Signalized Intersection, AADT/ Lane On Major Road < 7,000 (Total LTLs > 2)
EXPECTED ANNUAL ACCIDENT TABLE - HILLSBOROUGH
Total number of intersections Included - 20

230
Total Number Mean Crashes Standard 85th 90th 95th
Crashes Per Year* Per IntersectionPer Year Deviation** Percentile Percentile Percentile
Collision Type Rear End 75 6.25 4.80 11 11 14Head On 1 0.06 0.13 0 0 0Angle 30 2.53 1.43 4 5 5Left Turn 28 2.36 1.97 5 6 6Right Turn 3 0.28 0.28 1 1 1Sideswipe 7 0.56 0.56 1 1 1Pedestrian/Bicycle 3 0.28 0.45 1 1 1Other/Unknown 4 0.31 0.39 1 1 1
Severity No Injury 65 5.44 3.12 9 10 11Possible Injury 26 2.17 1.43 3 4 4Non-Incapacitating Injury 19 1.61 1.20 3 4 4Incapacitating Injury 13 1.11 0.86 2 2 2Fatal Injury 1 0.06 0.19 0 0 0
Light Conditions Daylight 96 8.00 6.25 11 12 18Dusk 2 0.19 0.22 0 0 0Dawn 3 0.28 0.28 1 1 1Dark (w/street lights) 39 3.25 2.29 5 5 7Dark (wo/ street lights) 10 0.83 0.66 1 2 2
Surface Conditions Dry 127 10.61 6.81 17 19 22Wet 22 1.86 1.34 3 3 4Slippery 1 0.06 0.13 0 0 0Others 0 0.03 0.10 0 0 0
Month of Year January 9 0.72 0.89 1 2 2February 13 1.08 0.99 1 1 3March 16 1.36 1.42 2 3 4April 10 0.81 0.56 1 2 2May 11 0.92 0.57 1 2 2June 13 1.11 0.95 2 2 2July 13 1.11 0.78 2 2 2August 16 1.33 1.02 3 3 3September 15 1.28 0.51 2 2 2October 13 1.08 1.06 2 3 3November 9 0.72 0.57 1 1 1December 14 1.14 0.86 2 2 2
Day of Week Monday 28 2.31 1.34 4 4 5Tuesday 25 2.06 1.84 4 5 5Wednesday 24 1.97 1.20 3 4 4Thursday 25 2.06 1.35 3 3 4Friday 15 1.28 1.21 2 2 3Saturday 15 1.25 1.42 2 2 4Sunday 21 1.75 0.99 3 3 3
Hour of Day 00:00 - 06:00 18 1.47 1.42 2 3 406:01 - 09:00 19 1.58 1.47 2 3 409:01 - 11:00 11 0.94 0.99 2 2 311:01 - 13:00 11 0.92 0.75 2 2 213:01 - 15:00 13 1.11 0.73 2 2 215:01 - 18:00 23 1.94 1.32 3 3 418:01 - 24:00 39 3.28 1.64 5 5 6
* Crashes extracted for years 1999, 2000 and 2001 for long forms only.** Standard Deviation column represents the standard deviation for mean crashes per year per intersection.
CATEGORY 7
4 Lane x 4 Lane Signalized Intersection, AADT/ Lane On Major Road >=7,500
EXPECTED ANNUAL ACCIDENT TABLE - HILLSBOROUGH
Total number of intersections Included - 12

231
Total Number Mean Crashes Standard 85th 90th 95th
Crashes Per Year* Per IntersectionPer Year Deviation** Percentile Percentile Percentile
Collision Type Rear End 6 1.50 1.14 2 3 3Head On 0 0.00 0.00 0 0 0Angle 4 1.00 0.72 2 2 2Left Turn 7 1.75 2.62 3 4 5Right Turn 0 0.00 0.00 0 0 0Sideswipe 1 0.25 0.17 0 0 0Pedestrian/Bicycle 0 0.00 0.00 0 0 0Other/Unknown 3 0.67 0.61 1 1 1
Severity No Injury 9 2.25 1.97 4 4 5Possible Injury 4 0.92 0.74 1 2 2Non-Incapacitating Injury 4 1.08 0.74 2 2 2Incapacitating Injury 2 0.42 0.83 1 1 1Fatal Injury 0 0.00 0.00 0 0 0
Light Conditions Daylight 15 3.75 3.18 6 7 8Dusk 0 0.00 0.00 0 0 0Dawn 0 0.08 0.17 0 0 0Dark (w/street lights) 4 0.92 0.92 2 2 2Dark (wo/ street lights) 2 0.42 0.32 1 1 1
Surface Conditions Dry 18 4.58 3.90 7 8 9Wet 2 0.58 0.42 1 1 1Slippery 0 0.00 0.00 0 0 0Others 0 0.00 0.00 0 0 0
Month of Year January 2 0.42 0.50 1 1 1February 2 0.50 0.19 1 1 1March 1 0.17 0.19 0 0 0April 3 0.67 0.72 1 1 2May 2 0.42 0.32 1 1 1June 2 0.58 0.57 1 1 1July 2 0.58 0.57 1 1 1August 1 0.33 0.27 1 1 1September 0 0.08 0.17 0 0 0October 3 0.75 1.10 2 2 2November 1 0.25 0.17 0 0 0December 2 0.42 0.50 1 1 1
Day of Week Monday 3 0.75 0.63 1 1 2Tuesday 4 0.92 1.13 2 2 2Wednesday 3 0.75 0.96 2 2 2Thursday 3 0.67 0.61 1 1 1Friday 4 1.08 0.69 2 2 2Saturday 2 0.50 0.58 1 1 1Sunday 2 0.50 0.33 1 1 1
Hour of Day 00:00 - 06:00 1 0.33 0.27 1 1 106:01 - 09:00 3 0.83 1.04 2 2 209:01 - 11:00 1 0.33 0.27 1 1 111:01 - 13:00 1 0.33 0.47 1 1 113:01 - 15:00 3 0.67 0.90 1 2 215:01 - 18:00 5 1.17 0.79 2 2 218:01 - 24:00 5 1.25 0.74 2 2 2
CATEGORY 8
4 Lane x 4 Lane Signalized Intersection, AADT/ Lane On Major Road < 7,500
EXPECTED ANNUAL ACCIDENT TABLE - HILLSBOROUGH
Total number of intersections Included - 4
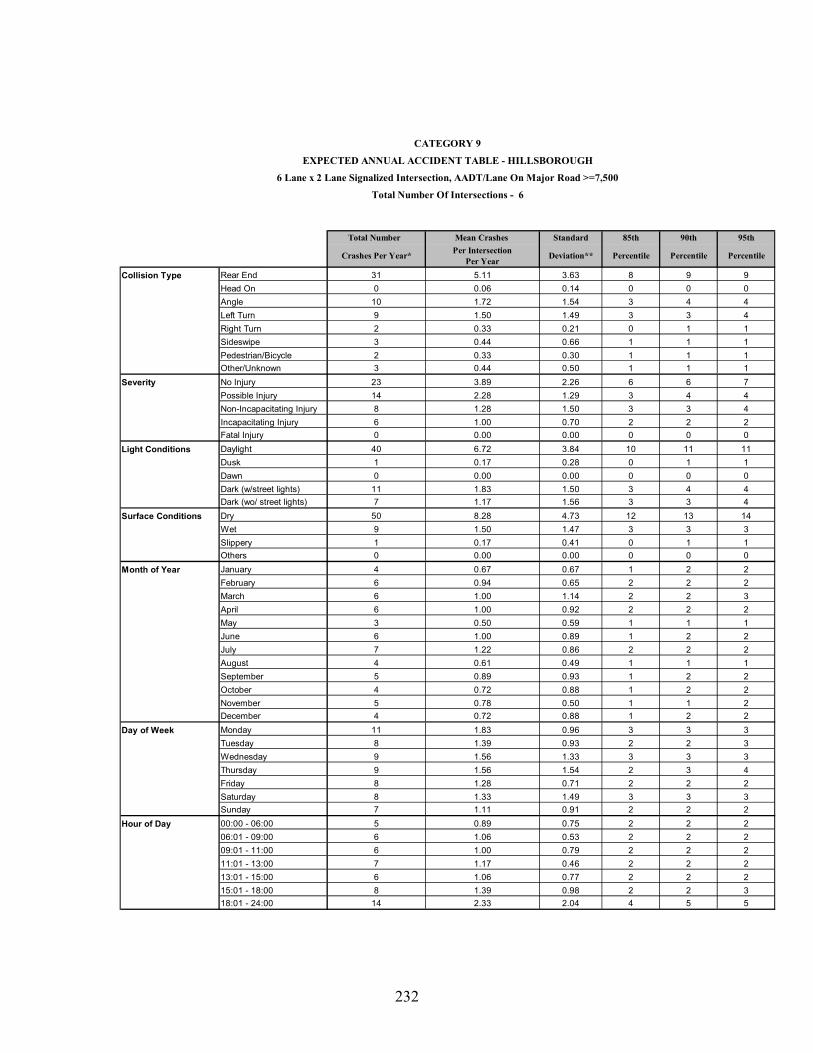
232
Total Number Mean Crashes Standard 85th 90th 95th
Crashes Per Year* Per IntersectionPer Year Deviation** Percentile Percentile Percentile
Collision Type Rear End 31 5.11 3.63 8 9 9Head On 0 0.06 0.14 0 0 0Angle 10 1.72 1.54 3 4 4Left Turn 9 1.50 1.49 3 3 4Right Turn 2 0.33 0.21 0 1 1Sideswipe 3 0.44 0.66 1 1 1Pedestrian/Bicycle 2 0.33 0.30 1 1 1Other/Unknown 3 0.44 0.50 1 1 1
Severity No Injury 23 3.89 2.26 6 6 7Possible Injury 14 2.28 1.29 3 4 4Non-Incapacitating Injury 8 1.28 1.50 3 3 4Incapacitating Injury 6 1.00 0.70 2 2 2Fatal Injury 0 0.00 0.00 0 0 0
Light Conditions Daylight 40 6.72 3.84 10 11 11Dusk 1 0.17 0.28 0 1 1Dawn 0 0.00 0.00 0 0 0Dark (w/street lights) 11 1.83 1.50 3 4 4Dark (wo/ street lights) 7 1.17 1.56 3 3 4
Surface Conditions Dry 50 8.28 4.73 12 13 14Wet 9 1.50 1.47 3 3 3Slippery 1 0.17 0.41 0 1 1Others 0 0.00 0.00 0 0 0
Month of Year January 4 0.67 0.67 1 2 2February 6 0.94 0.65 2 2 2March 6 1.00 1.14 2 2 3April 6 1.00 0.92 2 2 2May 3 0.50 0.59 1 1 1June 6 1.00 0.89 1 2 2July 7 1.22 0.86 2 2 2August 4 0.61 0.49 1 1 1September 5 0.89 0.93 1 2 2October 4 0.72 0.88 1 2 2November 5 0.78 0.50 1 1 2December 4 0.72 0.88 1 2 2
Day of Week Monday 11 1.83 0.96 3 3 3Tuesday 8 1.39 0.93 2 2 3Wednesday 9 1.56 1.33 3 3 3Thursday 9 1.56 1.54 2 3 4Friday 8 1.28 0.71 2 2 2Saturday 8 1.33 1.49 3 3 3Sunday 7 1.11 0.91 2 2 2
Hour of Day 00:00 - 06:00 5 0.89 0.75 2 2 206:01 - 09:00 6 1.06 0.53 2 2 209:01 - 11:00 6 1.00 0.79 2 2 211:01 - 13:00 7 1.17 0.46 2 2 213:01 - 15:00 6 1.06 0.77 2 2 215:01 - 18:00 8 1.39 0.98 2 2 318:01 - 24:00 14 2.33 2.04 4 5 5
EXPECTED ANNUAL ACCIDENT TABLE - HILLSBOROUGH
6 Lane x 2 Lane Signalized Intersection, AADT/Lane On Major Road >=7,500
Total Number Of Intersections - 6
CATEGORY 9

233
Total Number Mean Crashes Standard 85th 90th 95th
Crashes Per Year* Per IntersectionPer Year Deviation** Percentile Percentile Percentile
Collision Type Rear End 40 4.00 3.32 8 8 9Head On 1 0.10 0.22 0 0 1Angle 15 1.50 1.25 2 2 3Left Turn 12 1.17 1.43 2 2 3Right Turn 1 0.10 0.22 0 0 1Sideswipe 2 0.23 0.35 1 1 1Pedestrian/Bicycle 1 0.13 0.23 0 0 1Other/Unknown 5 0.47 0.55 1 1 1
Severity No Injury 29 2.93 2.60 6 6 7Possible Injury 15 1.50 1.14 3 3 3Non-Incapacitating Injury 10 1.00 0.70 2 2 2Incapacitating Injury 7 0.67 0.52 1 1 1Fatal Injury 0 0.03 0.11 0 0 0
Light Conditions Daylight 46 4.63 3.53 8 9 10Dusk 2 0.17 0.32 0 0 1Dawn 0 0.03 0.11 0 0 0Dark (w/street lights) 20 2.00 2.09 4 5 6Dark (wo/ street lights) 8 0.80 0.91 2 2 2
Surface Conditions Dry 64 6.40 5.13 13 14 14Wet 12 1.17 1.35 3 3 3Slippery 1 0.07 0.21 0 0 0Others 0 0.03 0.11 0 0 0
Month of Year January 8 0.77 0.77 1 1 2February 5 0.53 0.57 1 1 2March 6 0.57 0.63 1 1 2April 5 0.53 0.59 1 1 2May 9 0.93 1.03 2 2 3June 8 0.80 0.77 2 2 2July 5 0.50 0.42 1 1 1August 8 0.77 0.61 1 1 2September 6 0.60 0.60 1 1 2October 6 0.60 0.72 1 1 2November 4 0.43 0.45 1 1 1December 7 0.67 0.93 2 2 2
Day of Week Monday 10 0.97 0.53 1 1 2Tuesday 12 1.20 1.20 2 2 3Wednesday 9 0.93 0.73 2 2 2Thursday 15 1.50 1.87 4 4 5Friday 11 1.07 0.89 2 2 2Saturday 9 0.93 0.89 2 2 2Sunday 11 1.10 1.01 2 3 3
Hour of Day 00:00 - 06:00 6 0.63 0.55 1 1 206:01 - 09:00 5 0.47 0.45 1 1 109:01 - 11:00 4 0.40 0.41 1 1 111:01 - 13:00 5 0.53 0.50 1 1 113:01 - 15:00 8 0.77 0.69 2 2 215:01 - 18:00 16 1.57 1.46 3 3 418:01 - 24:00 23 2.30 1.89 4 5 6
* Crashes extracted for years 1999, 2000 and 2001 for long forms only.** Standard Deviation column represents the standard deviation for mean crashes per year per intersection.
CATEGORY 10
6 Lane x 2 Lane Signalized Intersection, AADT/ Lane On Major Road <7,500EXPECTED ANNUAL ACCIDENT TABLE - HILLSBOROUGH
Total number of intersections Included - 10

234
Total Number Mean Crashes Standard 85th 90th 95th
Crashes Per Year* Per IntersectionPer Year Deviation** Percentile Percentile Percentile
Collision Type Rear End 153 7.29 5.19 10 12 13Head On 4 0.17 0.27 0 0 1Angle 47 2.25 1.35 4 4 4Left Turn 48 2.27 2.13 4 5 7Right Turn 10 0.48 0.42 1 1 1Sideswipe 15 0.71 0.66 1 2 2Pedestrian/Bicycle 4 0.21 0.40 0 0 1Other/Unknown 14 0.67 0.61 1 1 2
Severity No Injury 127 6.05 4.01 10 11 12Possible Injury 54 2.59 1.82 4 5 5Non-Incapacitating Injury 32 1.54 1.17 3 3 3Incapacitating Injury 14 0.67 0.66 1 2 2Fatal Injury 1 0.05 0.12 0 0 0
Light Conditions Daylight 193 9.19 5.80 15 15 15Dusk 7 0.35 0.47 1 1 1Dawn 4 0.19 0.27 1 1 1Dark (w/street lights) 70 3.32 2.53 5 6 7Dark (wo/ street lights) 18 0.84 1.19 2 2 3
Surface Conditions Dry 249 11.87 6.86 18 19 19Wet 40 1.92 1.83 3 3 4Slippery 3 0.16 0.34 0 1 1Others 1 0.06 0.23 0 0 0
Month of Year January 25 1.19 0.90 2 2 3February 23 1.10 0.70 2 2 2March 21 1.00 0.84 2 2 3April 27 1.30 1.09 2 3 3May 23 1.11 0.76 2 2 2June 25 1.19 1.20 2 2 2July 23 1.08 0.88 2 2 3August 25 1.17 0.93 2 2 3September 26 1.24 0.85 2 2 3October 30 1.44 1.36 3 3 4November 24 1.16 1.11 2 3 3December 22 1.06 0.92 2 2 3
Day of Week Monday 50 2.37 1.49 4 4 5Tuesday 48 2.27 1.68 4 5 5Wednesday 43 2.05 1.28 3 3 3Thursday 45 2.14 1.57 4 4 4Friday 37 1.76 1.54 2 3 4Saturday 34 1.62 1.46 3 3 3Sunday 39 1.84 1.29 3 4 4
Hour of Day 00:00 - 06:00 19 0.90 0.83 2 2 206:01 - 09:00 25 1.19 0.87 2 2 209:01 - 11:00 22 1.05 0.76 2 2 211:01 - 13:00 20 0.97 0.80 1 2 213:01 - 15:00 31 1.46 1.08 3 3 315:01 - 18:00 53 2.51 1.96 4 5 618:01 - 24:00 71 3.40 2.59 6 6 7
* Crashes extracted for years 1999, 2000 and 2001 for long forms only.** Standard Deviation column represents the standard deviation for mean crashes per year per intersection.
CATEGORY 11
6 Lane x 4 Lane and 6 Lane x 6 Lane Signalized Intersection
EXPECTED ANNUAL ACCIDENT TABLE - HILLSBOROUGH
Total number of intersections Included - 21

235
Total Number Mean Crashes Standard 85th 90th 95th
Crashes Per Year* Per IntersectionPer Year Deviation** Percentile Percentile Percentile
Collision Type Rear End 26 2.89 2.88 6 7 8Head On 0 0.00 0.00 0 0 0Angle 5 0.59 0.66 1 1 2Left Turn 9 1.04 0.73 2 2 2Right Turn 1 0.07 0.15 0 0 0Sideswipe 2 0.19 0.56 0 0 1Pedestrian/Bicycle 0 0.04 0.11 0 0 0Other/Unknown 2 0.26 0.28 1 1 1
Severity No Injury 23 2.56 2.31 5 6 6Possible Injury 8 0.89 0.60 1 1 2Non-Incapacitating Injury 6 0.67 0.44 1 1 1Incapacitating Injury 2 0.19 0.24 0 0 1Fatal Injury 0 0.00 0.00 0 0 0
Light Conditions Daylight 31 3.41 2.89 5 6 8Dusk 2 0.22 0.24 0 0 1Dawn 1 0.07 0.15 0 0 0Dark (w/street lights) 7 0.81 1.02 1 1 2Dark (wo/ street lights) 4 0.48 0.73 1 1 2
Surface Conditions Dry 42 4.67 4.25 7 9 12Wet 3 0.37 0.39 1 1 1Slippery 0 0.00 0.00 0 0 0Others 0 0.00 0.00 0 0 0
Month of Year January 4 0.41 0.32 1 1 1February 5 0.52 0.50 1 1 1March 4 0.41 0.43 1 1 1April 3 0.33 0.44 1 1 1May 6 0.63 1.03 1 1 2June 5 0.59 0.57 1 1 1July 3 0.33 0.44 1 1 1August 4 0.48 0.60 1 1 1September 3 0.33 0.37 1 1 1October 4 0.41 0.40 1 1 1November 2 0.26 0.36 1 1 1December 3 0.37 0.61 1 1 1
Day of Week Monday 7 0.81 0.78 2 2 2Tuesday 7 0.81 0.60 1 1 2Wednesday 5 0.59 0.62 1 1 2Thursday 7 0.74 0.78 2 2 2Friday 10 1.07 1.15 1 2 3Saturday 4 0.48 0.63 1 1 1Sunday 5 0.56 0.62 1 1 2
Hour of Day 00:00 - 06:00 3 0.30 0.35 1 1 106:01 - 09:00 4 0.41 0.40 1 1 109:01 - 11:00 2 0.22 0.29 1 1 111:01 - 13:00 4 0.41 0.49 1 1 113:01 - 15:00 5 0.56 0.75 1 2 215:01 - 18:00 13 1.44 0.93 2 2 318:01 - 24:00 11 1.26 1.00 2 3 3
* Crashes extracted for years 1999, 2000 and 2001 for long forms only.** Standard Deviation column represents the standard deviation for mean crashes per year per intersection.
CATEGORY 12
T- Intersection, Signalized, AADT/ Lane On Major Road >=7500
EXPECTED ANNUAL ACCIDENT TABLE - HILLSBOROUGH
Total number of intersections Included - 9
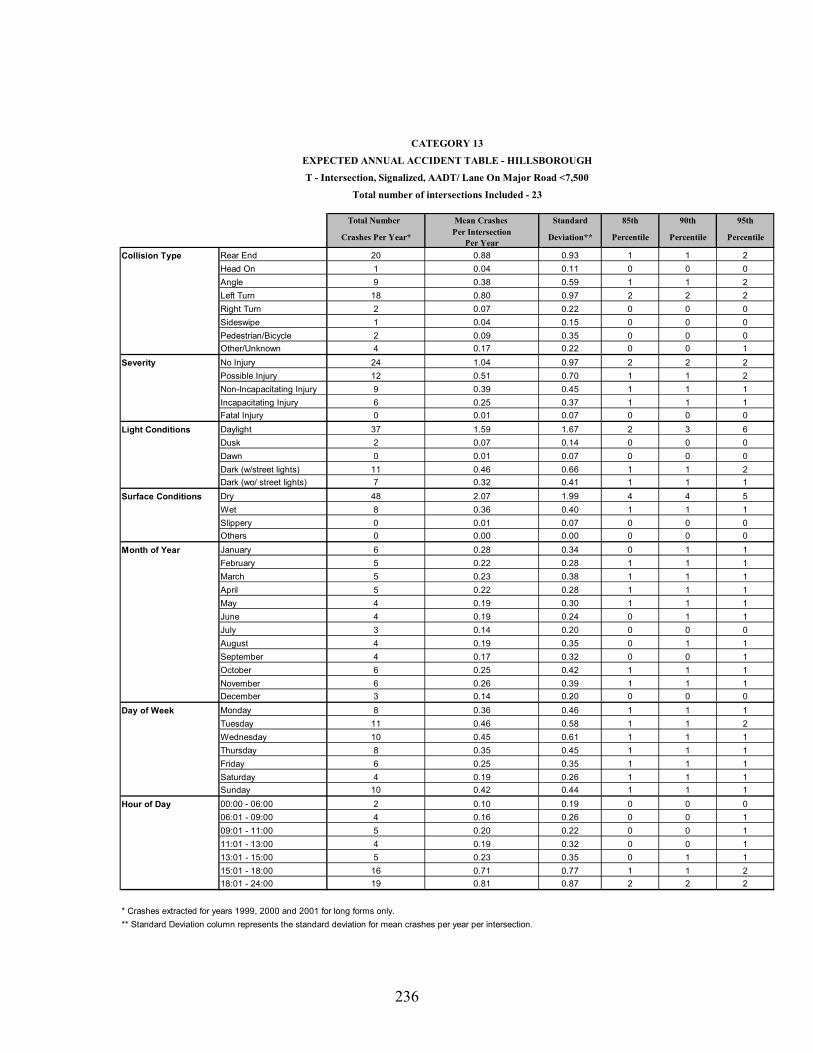
236
Total Number Mean Crashes Standard 85th 90th 95th
Crashes Per Year* Per IntersectionPer Year Deviation** Percentile Percentile Percentile
Collision Type Rear End 20 0.88 0.93 1 1 2Head On 1 0.04 0.11 0 0 0Angle 9 0.38 0.59 1 1 2Left Turn 18 0.80 0.97 2 2 2Right Turn 2 0.07 0.22 0 0 0Sideswipe 1 0.04 0.15 0 0 0Pedestrian/Bicycle 2 0.09 0.35 0 0 0Other/Unknown 4 0.17 0.22 0 0 1
Severity No Injury 24 1.04 0.97 2 2 2Possible Injury 12 0.51 0.70 1 1 2Non-Incapacitating Injury 9 0.39 0.45 1 1 1Incapacitating Injury 6 0.25 0.37 1 1 1Fatal Injury 0 0.01 0.07 0 0 0
Light Conditions Daylight 37 1.59 1.67 2 3 6Dusk 2 0.07 0.14 0 0 0Dawn 0 0.01 0.07 0 0 0Dark (w/street lights) 11 0.46 0.66 1 1 2Dark (wo/ street lights) 7 0.32 0.41 1 1 1
Surface Conditions Dry 48 2.07 1.99 4 4 5Wet 8 0.36 0.40 1 1 1Slippery 0 0.01 0.07 0 0 0Others 0 0.00 0.00 0 0 0
Month of Year January 6 0.28 0.34 0 1 1February 5 0.22 0.28 1 1 1March 5 0.23 0.38 1 1 1April 5 0.22 0.28 1 1 1May 4 0.19 0.30 1 1 1June 4 0.19 0.24 0 1 1July 3 0.14 0.20 0 0 0August 4 0.19 0.35 0 1 1September 4 0.17 0.32 0 0 1October 6 0.25 0.42 1 1 1November 6 0.26 0.39 1 1 1December 3 0.14 0.20 0 0 0
Day of Week Monday 8 0.36 0.46 1 1 1Tuesday 11 0.46 0.58 1 1 2Wednesday 10 0.45 0.61 1 1 1Thursday 8 0.35 0.45 1 1 1Friday 6 0.25 0.35 1 1 1Saturday 4 0.19 0.26 1 1 1Sunday 10 0.42 0.44 1 1 1
Hour of Day 00:00 - 06:00 2 0.10 0.19 0 0 006:01 - 09:00 4 0.16 0.26 0 0 109:01 - 11:00 5 0.20 0.22 0 0 111:01 - 13:00 4 0.19 0.32 0 0 113:01 - 15:00 5 0.23 0.35 0 1 115:01 - 18:00 16 0.71 0.77 1 1 218:01 - 24:00 19 0.81 0.87 2 2 2
* Crashes extracted for years 1999, 2000 and 2001 for long forms only.** Standard Deviation column represents the standard deviation for mean crashes per year per intersection.
CATEGORY 13
T - Intersection, Signalized, AADT/ Lane On Major Road <7,500
EXPECTED ANNUAL ACCIDENT TABLE - HILLSBOROUGH
Total number of intersections Included - 23

237
Total Number Mean Crashes Standard 85th 90th 95th
Crashes Per Year* Per IntersectionPer Year Deviation** Percentile Percentile Percentile
Collision Type Rear End 4 0.57 0.69 1 1 2Head On 1 0.10 0.16 0 0 0Angle 3 0.38 0.40 1 1 1Left Turn 4 0.62 1.11 1 2 2Right Turn 0 0.05 0.13 0 0 0Sideswipe 1 0.19 0.26 0 0 1Pedestrian/Bicycle 3 0.38 0.36 1 1 1Other/Unknown 1 0.14 0.26 0 0 1
Severity No Injury 7 1.00 1.22 2 2 3Possible Injury 3 0.48 0.57 1 1 1Non-Incapacitating Injury 4 0.52 0.69 1 1 2Incapacitating Injury 1 0.14 0.18 0 0 0Fatal Injury 0 0.00 0.00 0 0 0
Light Conditions Daylight 11 1.57 1.97 3 4 5Dusk 1 0.10 0.16 0 0 0Dawn 0 0.05 0.13 0 0 0Dark (w/street lights) 4 0.52 0.54 1 1 1Dark (wo/ street lights) 0 0.05 0.13 0 0 0
Surface Conditions Dry 14 2.05 2.06 4 4 5Wet 2 0.24 0.50 0 1 1Slippery 0 0.00 0.00 0 0 0Others 0 0.00 0.00 0 0 0
Month of Year January 2 0.33 0.47 0 1 1February 2 0.29 0.36 1 1 1March 0 0.05 0.13 0 0 0April 1 0.14 0.18 0 0 0May 1 0.10 0.16 0 0 0June 2 0.29 0.40 1 1 1July 1 0.14 0.18 0 0 0August 2 0.24 0.32 1 1 1September 1 0.14 0.18 0 0 0October 2 0.24 0.42 1 1 1November 2 0.24 0.16 0 0 0December 1 0.10 0.16 0 0 0
Day of Week Monday 2 0.29 0.30 1 1 1Tuesday 2 0.24 0.32 1 1 1Wednesday 3 0.48 0.47 1 1 1Thursday 1 0.19 0.33 1 1 1Friday 3 0.43 0.66 1 1 1Saturday 2 0.24 0.42 1 1 1Sunday 3 0.43 0.74 1 1 2
Hour of Day 00:00 - 06:00 1 0.10 0.16 0 0 006:01 - 09:00 2 0.33 0.43 1 1 109:01 - 11:00 1 0.19 0.33 1 1 111:01 - 13:00 3 0.38 0.52 1 1 113:01 - 15:00 1 0.19 0.38 0 1 115:01 - 18:00 4 0.52 0.94 1 2 218:01 - 24:00 4 0.57 0.57 1 1 1
EXPECTED ANNUAL ACCIDENT TABLE - HILLSBOROUGH
Major Road One -Way Intersection, Signalized
Total Numbe of Intersections Included - 7
CATEGORY 14

238
Total Number Mean Crashes Standard 85th 90th 95th
Crashes Per Year* Per IntersectionPer Year Deviation** Percentile Percentile Percentile
Collision Type Rear End 14 4.56 4.35 8 8 8Head On 0 0.00 0.00 0 0 0Angle 4 1.22 1.58 2 3 3Left Turn 3 0.89 0.77 1 1 1Right Turn 0 0.11 0.19 0 0 0Sideswipe 1 0.22 0.19 0 0 0Pedestrian/Bicycle 0 0.00 0.00 0 0 0Other/Unknown 2 0.56 0.96 1 1 2
Severity No Injury 11 3.67 3.21 6 6 6Possible Injury 4 1.33 1.15 2 2 2Non-Incapacitating Injury 1 0.44 0.38 1 1 1Incapacitating Injury 2 0.78 0.84 1 1 2Fatal Injury 0 0.00 0.00 0 0 0
Light Conditions Daylight 13 4.33 4.04 7 7 8Dusk 0 0.00 0.00 0 0 0Dawn 0 0.11 0.19 0 0 0Dark (w/street lights) 9 3.00 2.73 5 5 5Dark (wo/ street lights) 0 0.11 0.19 0 0 0
Surface Conditions Dry 17 5.78 5.83 10 10 11Wet 5 1.78 1.68 3 3 3Slippery 0 0.00 0.00 0 0 0Others 0 0.00 0.00 0 0 0
Month of Year January 2 0.78 0.69 1 1 1February 1 0.44 0.51 1 1 1March 1 0.44 0.51 1 1 1April 2 0.67 0.58 1 1 1May 1 0.33 0.33 1 1 1June 1 0.22 0.19 0 0 0July 3 0.89 0.77 1 1 1August 2 0.78 0.84 1 1 2September 3 1.00 1.45 2 2 2October 1 0.44 0.51 1 1 1November 2 0.56 0.51 1 1 1December 3 1.00 1.00 2 2 2
Day of Week Monday 3 1.00 1.20 2 2 2Tuesday 3 0.89 0.84 1 2 2Wednesday 3 0.89 0.84 1 2 2Thursday 5 1.56 1.39 2 3 3Friday 3 1.11 0.96 2 2 2Saturday 3 1.00 0.88 2 2 2Sunday 3 1.11 1.17 2 2 2
Hour of Day 00:00 - 06:00 2 0.56 0.51 1 1 106:01 - 09:00 3 1.00 1.00 2 2 209:01 - 11:00 2 0.56 0.69 1 1 111:01 - 13:00 3 0.89 0.84 1 2 213:01 - 15:00 2 0.56 0.51 1 1 115:01 - 18:00 3 1.00 1.00 2 2 218:01 - 24:00 7 2.33 2.03 4 4 4
* Crashes extracted for years 1999, 2000 and 2001 for long forms only.** Standard Deviation column represents the standard deviation for mean crashes per year per intersection.
CATEGORY 17
Ramp Intersection, Signalized, AADT/ Lane On Major Road >=7,500
EXPECTED ANNUAL ACCIDENT TABLE - HILLSBOROUGH
Total number of intersections Included - 3

239
Total Number Mean Crashes Standard 85th 90th 95th
Crashes Per Year* Per IntersectionPer Year Deviation** Percentile Percentile Percentile
Collision Type Rear End 4 0.73 0.98 2 2 2Head On 0 0.00 0.00 0 0 0Angle 2 0.47 0.56 1 1 1Left Turn 4 0.87 1.41 2 2 3Right Turn 0 0.00 0.00 0 0 0Sideswipe 0 0.07 0.15 0 0 0Pedestrian/Bicycle 0 0.00 0.00 0 0 0Other/Unknown 1 0.13 0.18 0 0 0
Severity No Injury 6 1.13 1.50 2 3 3Possible Injury 2 0.33 0.47 1 1 1Non-Incapacitating Injury 2 0.40 0.72 1 1 1Incapacitating Injury 1 0.20 0.30 0 1 1Fatal Injury 0 0.00 0.00 0 0 0
Light Conditions Daylight 6 1.27 1.64 2 3 3Dusk 1 0.13 0.30 0 0 1Dawn 0 0.00 0.00 0 0 0Dark (w/street lights) 4 0.73 0.95 1 2 2Dark (wo/ street lights) 1 0.13 0.18 0 0 0
Surface Conditions Dry 11 2.13 2.73 4 5 6Wet 1 0.13 0.30 0 0 1Slippery 0 0.00 0.00 0 0 0Others 0 0.00 0.00 0 0 0
Month of Year January 0 0.07 0.15 0 0 0February 1 0.20 0.30 0 1 1March 0 0.07 0.15 0 0 0April 2 0.33 0.58 1 1 1May 1 0.20 0.30 0 1 1June 1 0.13 0.30 0 0 1July 0 0.07 0.15 0 0 0August 1 0.27 0.43 1 1 1September 1 0.27 0.28 0 1 1October 3 0.53 1.02 1 2 2November 1 0.13 0.18 0 0 0December 3 0.67 0.78 1 2 2
Day of Week Monday 2 0.33 0.47 1 1 1Tuesday 2 0.33 0.47 1 1 1Wednesday 3 0.60 0.89 1 2 2Thursday 2 0.47 0.56 1 1 1Friday 0 0.07 0.15 0 0 0Saturday 1 0.13 0.18 0 0 0Sunday 2 0.33 0.58 1 1 1
Hour of Day 00:00 - 06:00 1 0.20 0.18 0 0 006:01 - 09:00 1 0.20 0.45 0 1 109:01 - 11:00 1 0.13 0.18 0 0 011:01 - 13:00 2 0.33 0.33 1 1 113:01 - 15:00 0 0.07 0.15 0 0 015:01 - 18:00 2 0.47 0.87 1 1 218:01 - 24:00 4 0.87 1.10 2 2 2
* Crashes extracted for years 1999, 2000 and 2001 for long forms only.** Standard Deviation column represents the standard deviation for mean crashes per year per intersection.
CATEGORY 18
Ramp Intersection, Signalized, AADT/ Lane On Major Road <7,500
EXPECTED ANNUAL ACCIDENT TABLE - HILLSBOROUGH
Total number of intersections Included - 5
240
APPENDIX E
19 CATEGORY CRASH PROFILE TABLES FOR ORANGE COUNTY

241
Total Number Mean Crashes Standard 85th 90th 95th
Crashes Per Year* Per IntersectionPer Year Deviation** Percentile Percentile Percentile
Collision Type Rear End 25 0.89 1.23 1.98 2.00 10.23Head On 3 0.11 0.25 0.48 0.50 1.33Angle 16 0.55 0.50 1.00 1.50 5.56Left Turn 16 0.55 0.70 1.00 2.00 5.91Right Turn 4 0.13 0.22 0.50 0.50 1.31Sideswipe 2 0.05 0.21 0.00 0.00 0.91Pedestrian/Bicycle 2 0.05 0.16 0.00 0.50 0.66Fixed Object 4 0.13 0.29 0.48 0.65 1.49Other 2 0.05 0.16 0.00 0.15 0.66
Severity PDO Crashes 19 0.68 0.71 1.50 1.65 7.05Possible Injury 26 0.91 0.65 1.98 2.00 8.99Non-Incapacitating Injury 21 0.73 0.84 1.48 2.50 7.71Incapacitating Injury 4 0.13 0.22 0.50 0.50 1.31Fatal Crashes 1 0.02 0.09 0.00 0.00 0.41
Light Conditions Daylight 47 1.68 1.39 3.48 3.65 17.03Dusk 1 0.04 0.13 0.00 0.15 0.50Dawn 2 0.05 0.21 0.00 0.15 0.91Dark (w/street lights) 9 0.32 0.39 0.98 1.00 3.28Dark (wo/street lights) 11 0.38 0.59 1.00 1.15 4.11Unknown 0 0.00 0.00 0.00 0.00 0.00
Weather Dry 55 1.95 1.41 3.48 4.50 19.46Cloudy 10 0.36 0.69 0.98 1.45 4.13Rain 5 0.16 0.31 0.50 0.65 1.81Fog 0 0.00 0.00 0.00 0.00 0.00Others 0 0.00 0.00 0.00 0.00 0.00Unknown 0 0.00 0.00 0.00 0.00 0.00
Surface Condition Dry 62 2.21 1.66 4.00 4.65 22.43Wet 7 0.25 0.37 0.50 1.00 2.63Others 0 0.00 0.00 0.00 0.00 0.00Unknown 0 0.00 0.00 0.00 0.00 0.00
Month of year January 7 0.25 0.52 0.50 0.65 3.15February 5 0.18 0.31 0.50 0.65 1.98March 9 0.30 0.37 0.50 0.65 3.29April 10 0.34 0.47 0.50 1.00 3.79May 6 0.20 0.28 0.50 0.50 2.14June 4 0.13 0.22 0.50 0.50 1.31July 5 0.18 0.46 0.48 1.00 2.33August 8 0.27 0.35 0.50 1.00 2.79September 7 0.23 0.29 0.50 0.50 2.46October 6 0.20 0.25 0.50 0.50 1.96November 5 0.18 0.43 0.50 0.65 2.33December 5 0.18 0.28 0.50 0.50 1.80
Day of week Monday 10 0.36 0.69 0.98 1.00 1.98Tuesday 5 0.16 0.31 0.50 0.50 0.82Wednesday 0 0.00 0.00 0.00 0.00 0.00Thursday 0 0.00 0.00 0.00 0.00 0.00Friday 0 0.00 0.00 0.00 0.00 0.00Saturday 5 0.16 0.59 0.00 0.00 1.30Sunday 55 1.95 1.41 3.48 3.80 4.50
Hour of day 00:00 - 06:00 4 0.13 0.26 0.50 0.50 1.4906:01 - 09:00 10 0.34 0.49 0.98 1.00 3.7909:01 - 11:00 3 0.09 0.24 0.00 0.50 1.1611:01 - 13:00 7 0.25 0.42 0.50 1.00 2.8013:01 - 15:00 9 0.30 0.34 0.50 1.00 3.1115:01 - 18:00 19 0.66 0.53 1.00 1.50 6.5418:01 - 24:00 25 0.89 1.00 1.50 3.00 9.52
* Crashes averaged for years 1999 and 2000 long forms only.** Standard Deviation column represents the standard deviation for mean crashes per year per intersection.
CATEGORY 1
EXPECTED ANNUAL ACCIDENT VALUE TABLE - ORANGE COUNTY
2 Lane x 2 Lane Intersection, Signalized, AADT/lane for Major Road >= 5,000
Total number Intersections Included - 28

242
Total Number Mean Crashes Standard 85th 90th 95th
Crashes Per Year* Per IntersectionPer Year Deviation** Percentile Percentile Percentile
Collision Type Rear End 2 0.25 0.38 0.50 0.65 0.83Head On 0 0.00 0.00 0.00 0.00 0.00Angle 5 0.63 0.79 1.48 1.65 1.83Left Turn 2 0.19 0.26 0.50 0.50 0.50Right Turn 0 0.00 0.00 0.00 0.00 0.00Sideswipe 0 0.00 0.00 0.00 0.00 0.00Pedestrian/Bicycle 0 0.00 0.00 0.00 0.00 0.00Fixed Object 1 0.06 0.18 0.00 0.15 0.33Other 1 0.13 0.35 0.00 0.30 0.65
Severity PDO Crashes 4 0.44 0.56 0.98 1.15 1.33Possible Injury 3 0.31 0.37 0.50 0.65 0.83Non-Incapacitating Injury 4 0.50 0.46 1.00 1.00 1.00Incapacitating Injury 1 0.06 0.18 0.00 0.15 0.33Fatal Crashes 0 0.00 0.00 0.00 0.00 0.00
Light Conditions Daylight 6 0.75 0.80 1.00 1.45 1.98Dusk 1 0.06 0.18 0.00 0.15 0.33Dawn 1 0.13 0.23 0.48 0.50 0.50Dark (w/street lights) 1 0.06 0.18 0.00 0.15 0.33Dark (wo/street lights) 3 0.31 0.46 0.98 1.00 1.00Unknown 0 0.00 0.00 0.00 0.00 0.00
Weather Dry 8 0.94 1.08 1.95 2.30 2.65Cloudy 3 0.31 0.37 0.50 0.65 0.83Rain 1 0.06 0.18 0.00 0.15 0.33Fog 0 0.00 0.00 0.00 0.00 0.00Others 0 0.00 0.00 0.00 0.00 0.00Unknown 0 0.00 0.00 0.00 0.00 0.00
Surface Condition Dry 9 1.06 1.05 1.98 2.30 2.65Wet 2 0.19 0.37 0.48 0.65 0.83Others 1 0.06 0.18 0.00 0.15 0.33Unknown 0 0.00 0.00 0.00 0.00 0.00
Month of year January 1 0.13 0.23 0.48 0.50 0.50February 1 0.06 0.18 0.00 0.15 0.33March 0 0.00 0.00 0.00 0.00 0.00April 1 0.06 0.18 0.00 0.15 0.33May 3 0.31 0.46 0.98 1.00 1.00June 1 0.06 0.18 0.00 0.15 0.33July 1 0.06 0.18 0.00 0.15 0.33August 3 0.31 0.59 0.95 1.15 1.33September 2 0.19 0.26 0.50 0.50 0.50October 1 0.13 0.23 0.48 0.50 0.50November 0 0.00 0.00 0.00 0.00 0.00December 0 0.00 0.00 0.00 0.00 0.00
Day of week Monday 3 0.31 0.37 0.50 0.65 0.83Tuesday 1 0.06 0.18 0.00 0.15 0.33Wednesday 0 0.00 0.00 0.00 0.00 0.00Thursday 0 0.00 0.00 0.00 0.00 0.00Friday 0 0.00 0.00 0.00 0.00 0.00Saturday 0 0.00 0.00 0.00 0.00 0.00Sunday 8 0.94 1.08 1.95 2.30 2.65
Hour of day 00:00 - 06:00 2 0.19 0.26 0.50 0.50 0.5006:01 - 09:00 3 0.31 0.26 0.50 0.50 0.5009:01 - 11:00 2 0.19 0.37 0.48 0.65 0.8311:01 - 13:00 0 0.00 0.00 0.00 0.00 0.0013:01 - 15:00 1 0.13 0.23 0.48 0.50 0.5015:01 - 18:00 2 0.19 0.26 0.50 0.50 0.5018:01 - 24:00 4 0.44 0.32 0.50 0.65 0.83
* Crashes averaged for years 1999 and 2000 long forms only.** Standard Deviation column represents the standard deviation for mean crashes per year per intersection.
CATEGORY 2
EXPECTED ANNUAL ACCIDENT VALUE TABLE - ORANGE COUNTY
2 Lane x 2 Lane Intersection, Signalized, AADT/lane for Major Road < 5,000
Total number Intersections Included - 8
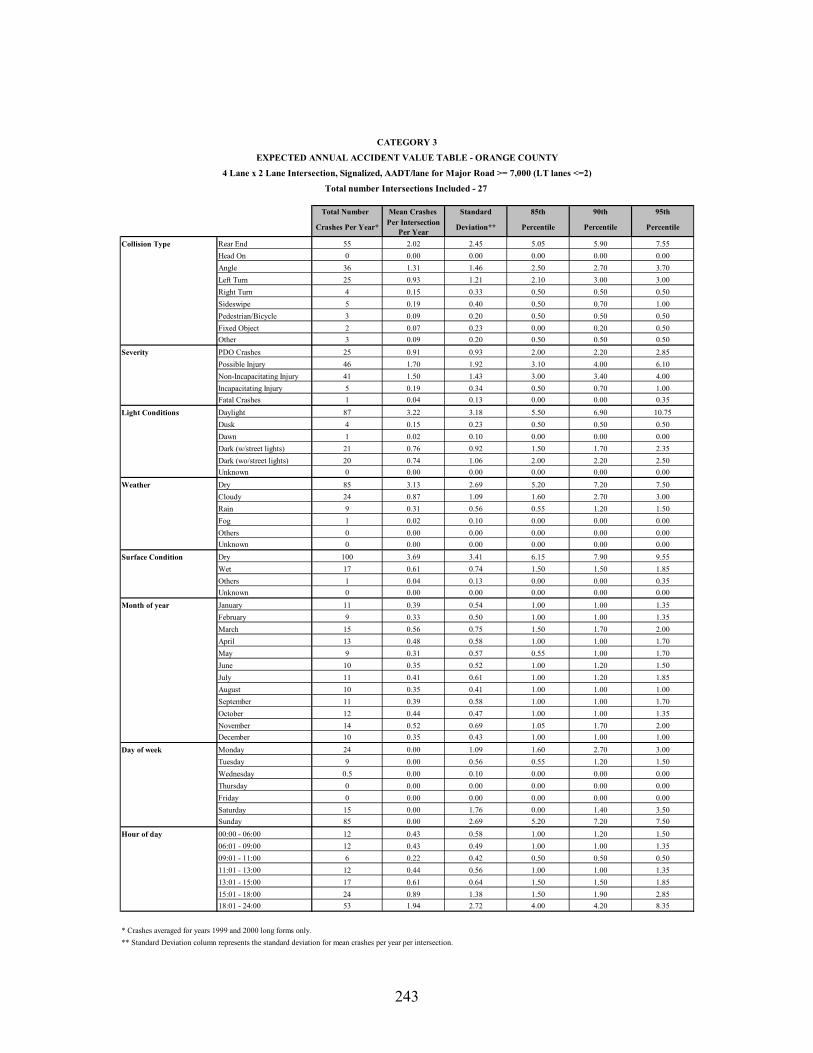
243
Total Number Mean Crashes Standard 85th 90th 95th
Crashes Per Year* Per IntersectionPer Year Deviation** Percentile Percentile Percentile
Collision Type Rear End 55 2.02 2.45 5.05 5.90 7.55Head On 0 0.00 0.00 0.00 0.00 0.00Angle 36 1.31 1.46 2.50 2.70 3.70Left Turn 25 0.93 1.21 2.10 3.00 3.00Right Turn 4 0.15 0.33 0.50 0.50 0.50Sideswipe 5 0.19 0.40 0.50 0.70 1.00Pedestrian/Bicycle 3 0.09 0.20 0.50 0.50 0.50Fixed Object 2 0.07 0.23 0.00 0.20 0.50Other 3 0.09 0.20 0.50 0.50 0.50
Severity PDO Crashes 25 0.91 0.93 2.00 2.20 2.85Possible Injury 46 1.70 1.92 3.10 4.00 6.10Non-Incapacitating Injury 41 1.50 1.43 3.00 3.40 4.00Incapacitating Injury 5 0.19 0.34 0.50 0.70 1.00Fatal Crashes 1 0.04 0.13 0.00 0.00 0.35
Light Conditions Daylight 87 3.22 3.18 5.50 6.90 10.75Dusk 4 0.15 0.23 0.50 0.50 0.50Dawn 1 0.02 0.10 0.00 0.00 0.00Dark (w/street lights) 21 0.76 0.92 1.50 1.70 2.35Dark (wo/street lights) 20 0.74 1.06 2.00 2.20 2.50Unknown 0 0.00 0.00 0.00 0.00 0.00
Weather Dry 85 3.13 2.69 5.20 7.20 7.50Cloudy 24 0.87 1.09 1.60 2.70 3.00Rain 9 0.31 0.56 0.55 1.20 1.50Fog 1 0.02 0.10 0.00 0.00 0.00Others 0 0.00 0.00 0.00 0.00 0.00Unknown 0 0.00 0.00 0.00 0.00 0.00
Surface Condition Dry 100 3.69 3.41 6.15 7.90 9.55Wet 17 0.61 0.74 1.50 1.50 1.85Others 1 0.04 0.13 0.00 0.00 0.35Unknown 0 0.00 0.00 0.00 0.00 0.00
Month of year January 11 0.39 0.54 1.00 1.00 1.35February 9 0.33 0.50 1.00 1.00 1.35March 15 0.56 0.75 1.50 1.70 2.00April 13 0.48 0.58 1.00 1.00 1.70May 9 0.31 0.57 0.55 1.00 1.70June 10 0.35 0.52 1.00 1.20 1.50July 11 0.41 0.61 1.00 1.20 1.85August 10 0.35 0.41 1.00 1.00 1.00September 11 0.39 0.58 1.00 1.00 1.70October 12 0.44 0.47 1.00 1.00 1.35November 14 0.52 0.69 1.05 1.70 2.00December 10 0.35 0.43 1.00 1.00 1.00
Day of week Monday 24 0.00 1.09 1.60 2.70 3.00Tuesday 9 0.00 0.56 0.55 1.20 1.50Wednesday 0.5 0.00 0.10 0.00 0.00 0.00Thursday 0 0.00 0.00 0.00 0.00 0.00Friday 0 0.00 0.00 0.00 0.00 0.00Saturday 15 0.00 1.76 0.00 1.40 3.50Sunday 85 0.00 2.69 5.20 7.20 7.50
Hour of day 00:00 - 06:00 12 0.43 0.58 1.00 1.20 1.5006:01 - 09:00 12 0.43 0.49 1.00 1.00 1.3509:01 - 11:00 6 0.22 0.42 0.50 0.50 0.5011:01 - 13:00 12 0.44 0.56 1.00 1.00 1.3513:01 - 15:00 17 0.61 0.64 1.50 1.50 1.8515:01 - 18:00 24 0.89 1.38 1.50 1.90 2.8518:01 - 24:00 53 1.94 2.72 4.00 4.20 8.35
* Crashes averaged for years 1999 and 2000 long forms only.** Standard Deviation column represents the standard deviation for mean crashes per year per intersection.
CATEGORY 3
EXPECTED ANNUAL ACCIDENT VALUE TABLE - ORANGE COUNTY
4 Lane x 2 Lane Intersection, Signalized, AADT/lane for Major Road >= 7,000 (LT lanes <=2)
Total number Intersections Included - 27

244
Total Number Mean Crashes Standard 85th 90th 95th
Crashes Per Year* Per IntersectionPer Year Deviation** Percentile Percentile Percentile
Collision Type Rear End 176 3.09 3.29 5.80 7.60 9.90Head On 6 0.11 0.25 0.50 0.50 0.50Angle 83 1.45 1.63 3.00 3.50 4.20Left Turn 57 1.00 1.27 2.00 2.50 3.30Right Turn 5 0.09 0.21 0.30 0.50 0.50Sideswipe 17 0.29 0.45 0.50 1.00 1.50Pedestrian/Bicycle 8 0.13 0.32 0.50 0.50 1.00Fixed Object 6 0.11 0.26 0.30 0.50 0.60Other 4 0.06 0.17 0.00 0.50 0.50
Severity PDO Crashes 69 1.20 1.41 2.00 2.50 4.00Possible Injury 98 1.71 2.09 3.30 4.70 5.80Non-Incapacitating Injury 87 1.53 1.81 3.50 4.20 4.60Incapacitating Injury 15 0.26 0.41 0.50 0.50 0.70Fatal Crashes 2 0.03 0.11 0.00 0.00 0.10
Light Conditions Daylight 242 4.24 4.10 8.10 9.50 12.20Dusk 5 0.09 0.25 0.00 0.50 0.60Dawn 2 0.04 0.13 0.00 0.00 0.50Dark (w/street lights) 64 1.12 1.37 2.00 3.70 4.10Dark (wo/street lights) 52 0.90 1.24 2.30 2.70 3.10Unknown 3 0.05 0.15 0.00 0.20 0.50
Weather Dry 183 3.21 3.30 6.80 8.20 9.50Cloudy 62 1.09 1.60 1.50 2.20 4.10Rain 24 0.41 0.60 1.00 1.50 1.50Fog 1 0.02 0.09 0.00 0.00 0.00Others 0 0.00 0.00 0.00 0.00 0.00Unknown 0 0.00 0.00 0.00 0.00 0.00
Surface Condition Dry 235 4.12 4.52 7.80 9.50 11.40Wet 33 0.58 0.80 1.50 1.70 2.10Others 0 0.00 0.00 0.00 0.00 0.00Unknown 0 0.00 0.00 0.00 0.00 0.00
Month of year January 22 0.38 0.54 1.00 1.00 1.50February 33 0.58 0.74 1.50 1.50 2.00March 31 0.54 0.58 1.00 1.50 1.50April 31 0.54 0.66 1.00 1.50 2.00May 30 0.53 0.59 1.00 1.20 1.50June 26 0.46 0.60 1.00 1.00 1.50July 35 0.61 0.81 1.50 1.50 1.50August 38 0.67 0.86 1.00 1.50 2.50September 28 0.49 0.70 1.50 1.50 2.00October 31 0.54 0.82 1.00 1.50 2.00November 32 0.55 0.73 1.50 1.50 1.60December 32 0.56 0.87 1.00 1.20 2.00
Day of week Monday 62 1.09 1.60 1.50 2.20 4.10Tuesday 24 0.41 0.60 1.00 1.50 1.50Wednesday 1 0.02 0.09 0.00 0.00 0.00Thursday 0 0.00 0.00 0.00 0.00 0.00Friday 0 0.00 0.00 0.00 0.00 0.00Saturday 98 1.71 2.91 4.10 5.00 8.40Sunday 183 3.21 3.30 6.80 8.20 9.50
Hour of day 00:00 - 06:00 28 0.48 0.73 1.00 1.50 1.6006:01 - 09:00 26 0.46 0.62 1.00 1.50 1.5009:01 - 11:00 18 0.31 0.52 0.80 1.00 1.5011:01 - 13:00 29 0.50 0.71 1.00 1.50 2.0013:01 - 15:00 35 0.61 0.77 1.30 1.50 2.1015:01 - 18:00 57 1.00 1.22 2.00 2.70 4.0018:01 - 24:00 177 3.10 3.51 5.60 7.40 10.30
* Crashes averaged for years 1999 and 2000 long forms only.** Standard Deviation column represents the standard deviation for mean crashes per year per intersection.
CATEGORY 4
EXPECTED ANNUAL ACCIDENT VALUE TABLE - ORANGE COUNTY
4 Lane x 2 Lane Intersection, Signalized, AADT/lane for Major Road >= 7,000 (LT lanes > 2)
Total number Intersections Included - 57

245
Total Number Mean Crashes Standard 85th 90th 95th
Crashes Per Year* Per IntersectionPer Year Deviation** Percentile Percentile Percentile
Collision Type Rear End 6 0.55 0.47 1.00 1.00 1.25Head On 1 0.02 0.20 0.25 0.50 0.50Angle 14 0.24 1.60 2.00 2.50 4.00Left Turn 7 0.11 0.74 1.50 1.50 1.75Right Turn 1 0.02 0.20 0.25 0.50 0.50Sideswipe 2 0.04 0.34 0.50 0.50 0.75Pedestrian/Bicycle 1 0.02 0.20 0.25 0.50 0.50Fixed Object 2 0.14 0.45 0.00 0.00 0.75Other 1 0.01 0.15 0.00 0.00 0.25
Severity PDO Crashes 9 0.77 0.72 1.00 1.00 1.75Possible Injury 10 0.18 1.00 2.25 2.50 2.50Non-Incapacitating Injury 12 0.21 1.30 2.25 3.00 3.50Incapacitating Injury 3 0.04 0.26 0.50 0.50 0.50Fatal Crashes 0 0.00 0.00 0.00 0.00 0.00
Light Conditions Daylight 20 1.82 1.81 4.00 5.00 5.00Dusk 2 0.04 0.25 0.50 0.50 0.50Dawn 1 0.02 0.20 0.25 0.50 0.50Dark (w/street lights) 8 0.13 0.87 1.00 1.50 2.25Dark (wo/street lights) 3 0.04 0.47 0.50 0.50 1.00Unknown 0 0.00 0.00 0.00 0.00 0.00
Weather Dry 23 2.05 2.41 4.25 5.50 6.50Cloudy 7 0.12 0.50 1.00 1.00 1.25Rain 3 0.05 0.34 0.50 0.50 0.75Fog 1 0.01 0.15 0.00 0.00 0.25Others 0 0.00 0.00 0.00 0.00 0.00Unknown 0 0.00 0.00 0.00 0.00 0.00
Surface Condition Dry 30 2.68 2.60 5.75 7.00 7.25Wet 4 0.06 0.46 0.50 0.50 1.00Others 0 0.00 0.00 0.00 0.00 0.00Unknown 0 0.00 0.00 0.00 0.00 0.00
Month of year January 3 0.27 0.26 0.50 0.50 0.50February 2 0.03 0.32 0.25 0.50 0.75March 3 0.04 0.41 0.75 1.00 1.00April 4 0.06 0.51 0.75 1.00 1.25May 4 0.06 0.34 0.50 0.50 0.75June 3 0.05 0.61 0.50 0.50 1.25July 3 0.04 0.47 0.50 0.50 1.00August 2 0.04 0.25 0.50 0.50 0.50September 4 0.07 0.45 1.00 1.00 1.00October 3 0.05 0.34 0.50 0.50 0.75November 3 0.04 0.41 0.75 1.00 1.00December 2 0.04 0.25 0.50 0.50 0.50
Day of week Monday 7 0.64 0.50 1.00 1.00 1.25Tuesday 3 0.27 0.34 0.50 0.50 0.75Wednesday 0.5 0.05 0.15 0.00 0.00 0.25Thursday 0 0.00 0.00 0.00 0.00 0.00Friday 0 0.00 0.00 0.00 0.00 0.00Saturday 0 0.00 0.00 0.00 0.00 0.00Sunday 23 2.05 2.41 4.25 5.50 6.50
Hour of day 00:00 - 06:00 2 0.14 0.23 0.50 0.50 0.5006:01 - 09:00 4 0.07 0.45 0.50 0.50 1.0009:01 - 11:00 4 0.06 0.51 0.75 1.00 1.2511:01 - 13:00 2 0.03 0.32 0.25 0.50 0.7513:01 - 15:00 5 0.08 0.54 1.00 1.00 1.2515:01 - 18:00 5 0.08 0.54 1.00 1.00 1.2518:01 - 24:00 15 0.25 1.08 2.00 2.50 3.25
* Crashes averaged for years 1999 and 2000 long forms only.** Standard Deviation column represents the standard deviation for mean crashes per year per intersection.
CATEGORY 5
EXPECTED ANNUAL ACCIDENT VALUE TABLE - ORANGE COUNTY
4 Lane x 2 Lane Intersection, Signalized, AADT/lane for Major Road < 7,000 (LT lanes <=2)
Total number Intersections Included - 11

246
Total Number Mean Crashes Standard 85th 90th 95th
Crashes Per Year* Per IntersectionPer Year Deviation** Percentile Percentile Percentile
Collision Type Rear End 26 0.88 1.02 1.50 1.70 3.10Head On 2 0.05 0.20 0.00 0.00 0.30Angle 23 0.79 0.70 1.40 1.50 2.10Left Turn 19 0.66 1.13 1.00 1.60 2.30Right Turn 1 0.02 0.09 0.00 0.00 0.00Sideswipe 2 0.05 0.15 0.00 0.10 0.50Pedestrian/Bicycle 4 0.12 0.22 0.50 0.50 0.50Fixed Object 4 0.14 0.26 0.50 0.50 0.50Other 3 0.10 0.21 0.50 0.50 0.50
Severity PDO Crashes 16 0.55 0.57 1.00 1.10 1.50Possible Injury 26 0.88 0.85 1.50 2.10 2.50Non-Incapacitating Injury 30 1.03 1.02 1.90 2.00 2.30Incapacitating Injury 3 0.09 0.27 0.00 0.10 0.80Fatal Crashes 1 0.03 0.13 0.00 0.00 0.30
Light Conditions Daylight 50 1.71 1.42 2.90 3.40 5.00Dusk 2 0.05 0.15 0.00 0.10 0.50Dawn 3 0.09 0.23 0.00 0.50 0.50Dark (w/street lights) 15 0.50 0.69 1.00 1.10 1.80Dark (wo/street lights) 15 0.52 0.70 0.90 1.20 2.30Unknown 0 0.00 0.00 0.00 0.00 0.00
Weather Dry 49 1.69 1.42 2.50 3.20 4.30Cloudy 20 0.67 0.68 1.50 1.50 1.80Rain 5 0.17 0.28 0.50 0.50 0.50Fog 1 0.03 0.13 0.00 0.00 0.30Others 1 0.02 0.09 0.00 0.00 0.00Unknown 0 0.00 0.00 0.00 0.00 0.00
Surface Condition Dry 65 2.22 1.78 3.00 3.50 5.80Wet 9 0.31 0.34 0.50 0.60 1.00Others 1 0.03 0.13 0.00 0.00 0.30Unknown 1 0.02 0.09 0.00 0.00 0.00
Month of year January 9 0.29 0.45 0.50 0.60 1.00February 6 0.21 0.28 0.50 0.50 0.50March 10 0.33 0.45 1.00 1.00 1.00April 5 0.17 0.41 0.50 0.50 1.10May 8 0.26 0.39 0.50 0.60 1.00June 7 0.24 0.39 0.50 0.60 1.00July 6 0.21 0.39 0.50 0.60 1.00August 8 0.26 0.37 0.50 0.50 0.80September 8 0.28 0.37 0.50 1.00 1.00October 8 0.28 0.41 0.50 1.00 1.00November 6 0.21 0.39 0.90 1.00 1.00December 4 0.14 0.26 0.50 0.50 0.50
Day of week Monday 20 0.67 0.68 1.50 1.50 1.80Tuesday 5 0.17 0.28 0.50 0.50 0.50Wednesday 1 0.03 0.13 0.00 0.00 0.30Thursday 0 0.00 0.00 0.00 0.00 0.00Friday 0 0.00 0.00 0.00 0.00 0.00Saturday 9 0.29 1.07 0.00 0.10 2.00Sunday 49 1.69 1.42 2.50 3.20 4.30
Hour of day 00:00 - 06:00 7 0.22 0.37 0.50 0.50 0.8006:01 - 09:00 10 0.33 0.56 0.90 1.00 1.0009:01 - 11:00 8 0.28 0.39 0.50 0.60 1.0011:01 - 13:00 4 0.14 0.26 0.50 0.50 0.5013:01 - 15:00 10 0.33 0.43 0.50 0.60 1.3015:01 - 18:00 14 0.47 0.60 1.00 1.50 1.5018:01 - 24:00 32 1.10 1.29 1.50 2.70 3.80
* Crashes averaged for years 1999 and 2000 long forms only.** Standard Deviation column represents the standard deviation for mean crashes per year per intersection.
CATEGORY 6
EXPECTED ANNUAL ACCIDENT VALUE TABLE - ORANGE COUNTY
4 Lane x 2 Lane Intersection, Signalized, AADT/lane for Major Road < 7,000 (LT lanes > 2)
Total number Intersections Included - 29

247
Total Number Mean Crashes Standard 85th 90th 95th
Crashes Per Year* Per IntersectionPer Year Deviation** Percentile Percentile Percentile
Collision Type Rear End 147 6.37 4.78 8.50 10.10 13.20Head On 3 0.11 0.26 0.35 0.50 0.50Angle 54 2.35 2.20 4.90 5.50 5.95Left Turn 37 1.59 1.36 3.35 3.50 3.50Right Turn 3 0.11 0.21 0.50 0.50 0.50Sideswipe 9 0.37 0.53 1.00 1.00 1.00Pedestrian/Bicycle 4 0.17 0.32 0.50 0.50 0.95Fixed Object 2 0.09 0.25 0.00 0.40 0.50Other 5 0.22 0.36 0.50 0.90 1.00
Severity PDO Crashes 58 2.50 1.96 4.85 5.00 5.45Possible Injury 86 3.72 3.44 7.00 7.00 7.00Non-Incapacitating Injury 60 2.59 2.28 5.55 6.00 6.90Incapacitating Injury 11 0.48 0.61 1.35 1.50 1.50Fatal Crashes 0 0.00 0.00 0.00 0.00 0.00
Light Conditions Daylight 166 7.20 4.65 9.50 12.70 13.95Dusk 5 0.22 0.33 0.50 0.50 0.95Dawn 6 0.26 0.37 0.50 0.90 1.00Dark (w/street lights) 57 2.48 2.40 4.90 6.30 7.40Dark (wo/street lights) 32 1.39 1.31 2.35 2.90 3.90Unknown 1 0.04 0.14 0.00 0.00 0.45
Weather Dry 143 6.20 5.18 10.00 11.60 13.35Cloudy 54 2.35 1.99 4.50 4.50 5.40Rain 16 0.70 0.75 1.00 1.40 1.95Fog 1 0.04 0.14 0.00 0.00 0.45Others 0 0.00 0.00 0.00 0.00 0.00Unknown 0 0.00 0.00 0.00 0.00 0.00
Surface Condition Dry 182 7.89 6.31 14.85 15.40 17.75Wet 31 1.33 1.23 2.70 3.40 3.50Others 2 0.07 0.23 0.00 0.00 0.45Unknown 0 0.00 0.00 0.00 0.00 0.00
Month of year January 19 0.83 0.76 1.35 1.50 2.40February 22 0.96 1.02 1.85 2.00 2.00March 14 0.61 0.66 1.00 1.40 1.95April 24 1.04 0.69 1.85 2.00 2.00May 24 1.04 0.80 2.00 2.00 2.45June 22 0.96 0.93 1.50 1.50 2.85July 23 1.00 1.00 2.20 2.90 3.00August 33 1.43 1.30 2.00 2.40 3.40September 22 0.93 0.70 2.00 2.00 2.00October 18 0.78 0.67 1.50 1.50 1.95November 22 0.93 0.99 2.00 2.00 2.90December 25 1.07 1.10 2.35 2.50 2.50
Day of week Monday 54 2.35 1.99 4.50 4.50 5.40Tuesday 16 0.70 0.75 1.00 1.40 1.95Wednesday 1 0.04 0.14 0.00 0.00 0.45Thursday 0 0.00 0.00 0.00 0.00 0.00Friday 0 0.00 0.00 0.00 0.00 0.00Saturday 53 2.30 3.77 5.85 7.20 7.95Sunday 143 6.20 5.18 10.00 11.60 13.35
Hour of day 00:00 - 06:00 25 1.09 1.03 2.35 2.50 2.5006:01 - 09:00 22 0.96 0.98 2.00 2.00 2.4509:01 - 11:00 21 0.91 1.10 1.50 1.90 2.0011:01 - 13:00 22 0.93 0.83 1.50 1.90 2.0013:01 - 15:00 20 0.85 0.87 1.85 2.00 2.4515:01 - 18:00 47 2.04 1.63 3.00 3.80 4.9018:01 - 24:00 111 4.80 3.87 7.85 8.40 13.45
* Crashes averaged for years 1999 and 2000 long forms only.** Standard Deviation column represents the standard deviation for mean crashes per year per intersection.
CATEGORY 7
EXPECTED ANNUAL ACCIDENT VALUE TABLE - ORANGE COUNTY
4 Lane x 4 Lane Intersection, Signalized, AADT/lane for Major Road >= 7,500
Total number Intersections Included - 23

248
Total Number Mean Crashes Standard 85th 90th 95th
Crashes Per Year* Per IntersectionPer Year Deviation** Percentile Percentile Percentile
Collision Type Rear End 44 2.42 2.72 3.50 4.40 7.17Head On 3 0.17 0.30 0.50 0.50 0.57Angle 39 2.17 1.81 4.73 5.15 5.50Left Turn 30 1.64 2.76 2.95 3.65 5.12Right Turn 2 0.11 0.21 0.50 0.50 0.50Sideswipe 4 0.19 0.30 0.50 0.50 0.57Pedestrian/Bicycle 4 0.19 0.30 0.50 0.50 0.57Fixed Object 0 0.00 0.00 0.00 0.00 0.00Other 2 0.08 0.26 0.00 0.15 0.57
Severity PDO Crashes 31 1.72 2.12 3.00 3.30 4.67Possible Injury 36 1.97 1.74 4.00 4.30 5.15Non-Incapacitating Injury 43 2.36 2.66 4.23 4.50 5.55Incapacitating Injury 8 0.44 0.64 1.00 1.00 1.23Fatal Crashes 0 0.00 0.00 0.00 0.00 0.00
Light Conditions Daylight 78 4.31 3.62 6.00 7.20 10.83Dusk 2 0.11 0.37 0.00 0.15 0.65Dawn 1 0.06 0.24 0.00 0.00 0.15Dark (w/street lights) 23 1.25 1.26 2.73 3.15 3.50Dark (wo/street lights) 25 1.36 2.74 1.50 1.80 3.92Unknown 1 0.03 0.12 0.00 0.00 0.07
Weather Dry 83 4.61 4.43 7.98 12.05 14.58Cloudy 27 1.50 1.46 3.23 3.65 4.08Rain 6 0.33 0.42 1.00 1.00 1.00Fog 1 0.03 0.12 0.00 0.00 0.07Others 1 0.03 0.12 0.00 0.00 0.07Unknown 0 0.00 0.00 0.00 0.00 0.00
Surface Condition Dry 102 5.64 5.24 10.53 14.20 17.08Wet 15 0.83 0.77 1.50 1.65 2.08Others 0 0.00 0.00 0.00 0.00 0.00Unknown 0 0.00 0.00 0.00 0.00 0.00
Month of year January 10 0.53 0.63 1.50 1.50 1.50February 10 0.56 0.87 1.00 1.45 2.58March 12 0.64 0.70 1.00 1.30 2.08April 15 0.81 0.81 1.73 2.00 2.08May 7 0.39 0.53 0.73 1.00 1.15June 13 0.72 0.69 1.00 1.15 1.73July 7 0.36 0.38 0.73 1.00 1.00August 11 0.61 0.74 1.73 2.00 2.00September 15 0.81 0.86 1.73 2.15 2.50October 13 0.69 0.69 1.50 1.65 2.00November 7 0.39 0.61 0.50 0.65 1.23December 11 0.61 1.02 1.00 1.60 3.08
Day of week Monday 27 1.50 1.46 3.23 3.65 4.08Tuesday 6 0.33 0.42 1.00 1.00 1.00Wednesday 0.5 0.03 0.12 0.00 0.00 0.07Thursday 0 0.00 0.00 0.00 0.00 0.00Friday 0 0.00 0.00 0.00 0.00 0.00Saturday 12 0.64 2.17 0.00 0.75 3.47Sunday 83 4.61 4.43 7.98 12.05 14.58
Hour of day 00:00 - 06:00 10 0.53 0.67 1.23 1.65 2.0006:01 - 09:00 15 0.83 1.04 1.73 2.00 2.3009:01 - 11:00 5 0.25 0.39 0.73 1.00 1.0011:01 - 13:00 12 0.67 0.87 1.23 1.50 1.8013:01 - 15:00 13 0.72 1.27 1.00 1.15 2.1015:01 - 18:00 25 1.36 1.10 2.50 2.65 3.0818:01 - 24:00 50 2.75 3.63 4.18 6.20 9.82
* Crashes averaged for years 1999 and 2000 long forms only.** Standard Deviation column represents the standard deviation for mean crashes per year per intersection.
CATEGORY 8
EXPECTED ANNUAL ACCIDENT VALUE TABLE - ORANGE COUNTY
4 Lane x 4 Lane Intersection, Signalized, AADT/lane for Major Road < 7,500
Total number Intersections Included - 18

249
Total Number Mean Crashes Standard 85th 90th 95th
Crashes Per Year* Per IntersectionPer Year Deviation** Percentile Percentile Percentile
Collision Type Rear End 64 3.02 2.28 3.50 4.50 7.50Head On 1 0.05 0.15 0.00 0.00 0.50Angle 36 1.71 1.08 2.50 3.00 3.00Left Turn 16 0.76 0.83 1.50 1.50 2.00Right Turn 1 0.05 0.15 0.00 0.00 0.50Sideswipe 6 0.26 0.41 0.50 0.50 1.00Pedestrian/Bicycle 6 0.26 0.46 1.00 1.00 1.00Fixed Object 4 0.19 0.37 0.50 0.50 0.50Other 2 0.10 0.26 0.00 0.50 0.50
Severity PDO Crashes 23 1.07 0.95 2.50 2.50 2.50Possible Injury 39 1.86 1.23 3.00 3.50 4.00Non-Incapacitating Injury 42 1.98 1.12 3.00 3.50 3.50Incapacitating Injury 6 0.26 0.49 0.50 0.50 1.00Fatal Crashes 1 0.05 0.15 0.00 0.00 0.50
Light Conditions Daylight 91 4.33 2.25 6.50 7.00 8.00Dusk 2 0.10 0.20 0.50 0.50 0.50Dawn 1 0.05 0.15 0.00 0.00 0.50Dark (w/street lights) 27 1.26 1.27 3.00 3.00 3.50Dark (wo/street lights) 16 0.76 1.06 1.50 1.50 2.00Unknown 0 0.00 0.00 0.00 0.00 0.00
Weather Dry 73 3.45 2.01 5.00 6.50 6.50Cloudy 25 1.17 0.93 2.00 2.50 2.50Rain 12 0.55 0.74 1.00 1.00 2.50Fog 1 0.02 0.11 0.00 0.00 0.00Others 1 0.02 0.11 0.00 0.00 0.00Unknown 0 0.00 0.00 0.00 0.00 0.00
Surface Condition Dry 91 4.31 2.28 7.00 7.00 7.50Wet 17 0.79 0.96 1.00 1.50 2.50Others 2 0.10 0.26 0.00 0.50 0.50Unknown 1 0.02 0.11 0.00 0.00 0.00
Month of year January 14 0.64 0.62 1.00 1.50 2.00February 10 0.45 0.47 1.00 1.00 1.00March 8 0.38 0.44 1.00 1.00 1.00April 16 0.74 0.72 1.50 1.50 2.00May 10 0.45 0.47 1.00 1.00 1.00June 12 0.57 0.36 1.00 1.00 1.00July 12 0.55 0.57 1.00 1.00 1.00August 11 0.50 0.61 1.00 1.00 1.00September 15 0.69 0.68 1.50 2.00 2.00October 13 0.60 0.70 1.50 1.50 2.00November 10 0.48 0.40 1.00 1.00 1.00December 10 0.48 0.49 1.00 1.00 1.50
Day of week Monday 25 1.17 0.93 2.00 2.50 2.50Tuesday 12 0.55 0.74 1.00 1.00 2.50Wednesday 1 0.05 0.15 0.00 0.00 0.50Thursday 0 0.00 0.00 0.00 0.00 0.00Friday 0 0.00 0.00 0.00 0.00 0.00Saturday 28 1.31 2.20 4.50 5.00 5.00Sunday 73 3.45 2.01 5.00 6.50 6.50
Hour of day 00:00 - 06:00 10 0.48 0.62 1.00 1.00 2.0006:01 - 09:00 14 0.64 0.59 1.00 1.50 1.5009:01 - 11:00 12 0.57 0.58 1.00 1.00 2.0011:01 - 13:00 16 0.74 0.60 1.50 1.50 1.5013:01 - 15:00 9 0.43 0.53 1.00 1.50 1.5015:01 - 18:00 23 1.07 0.90 2.00 2.50 3.0018:01 - 24:00 55 2.62 2.58 6.00 6.00 7.00
* Crashes averaged for years 1999 and 2000 long forms only.** Standard Deviation column represents the standard deviation for mean crashes per year per intersection.
CATEGORY 9
EXPECTED ANNUAL ACCIDENT VALUE TABLE - ORANGE COUNTY
6 Lane x 2 Lane Intersection, Signalized, AADT/lane for Major Road >= 7,500
Total number Intersections Included - 21
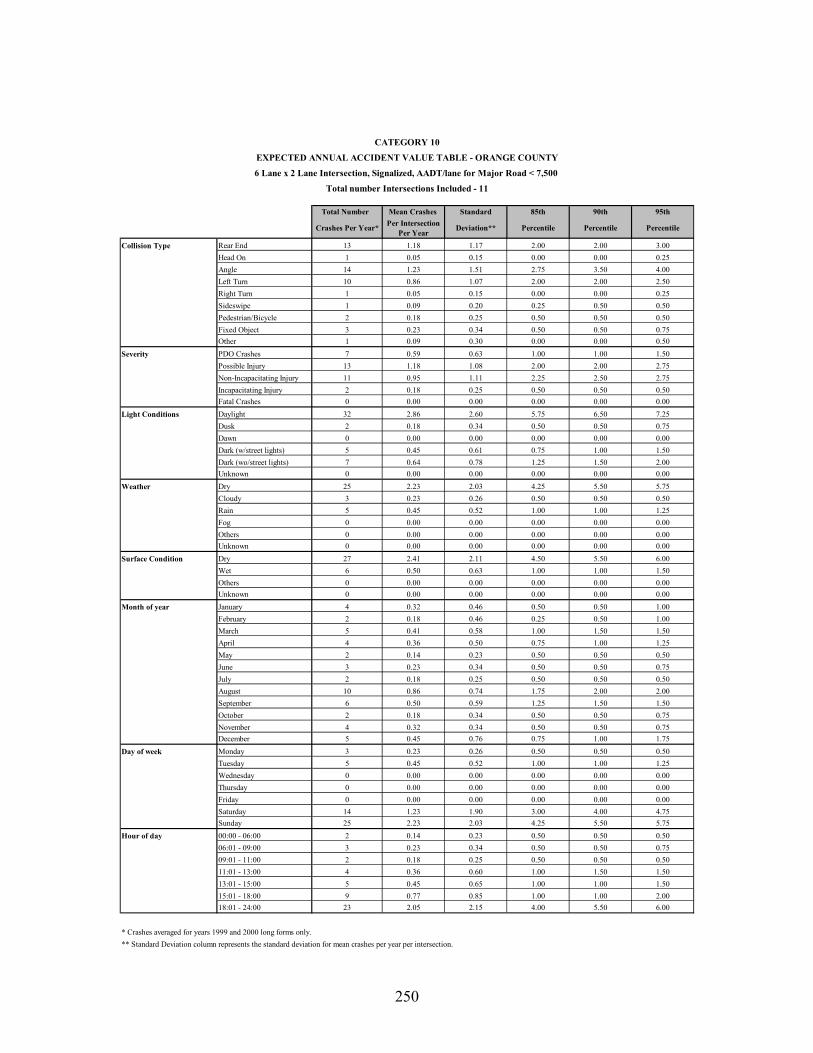
250
Total Number Mean Crashes Standard 85th 90th 95th
Crashes Per Year* Per IntersectionPer Year Deviation** Percentile Percentile Percentile
Collision Type Rear End 13 1.18 1.17 2.00 2.00 3.00Head On 1 0.05 0.15 0.00 0.00 0.25Angle 14 1.23 1.51 2.75 3.50 4.00Left Turn 10 0.86 1.07 2.00 2.00 2.50Right Turn 1 0.05 0.15 0.00 0.00 0.25Sideswipe 1 0.09 0.20 0.25 0.50 0.50Pedestrian/Bicycle 2 0.18 0.25 0.50 0.50 0.50Fixed Object 3 0.23 0.34 0.50 0.50 0.75Other 1 0.09 0.30 0.00 0.00 0.50
Severity PDO Crashes 7 0.59 0.63 1.00 1.00 1.50Possible Injury 13 1.18 1.08 2.00 2.00 2.75Non-Incapacitating Injury 11 0.95 1.11 2.25 2.50 2.75Incapacitating Injury 2 0.18 0.25 0.50 0.50 0.50Fatal Crashes 0 0.00 0.00 0.00 0.00 0.00
Light Conditions Daylight 32 2.86 2.60 5.75 6.50 7.25Dusk 2 0.18 0.34 0.50 0.50 0.75Dawn 0 0.00 0.00 0.00 0.00 0.00Dark (w/street lights) 5 0.45 0.61 0.75 1.00 1.50Dark (wo/street lights) 7 0.64 0.78 1.25 1.50 2.00Unknown 0 0.00 0.00 0.00 0.00 0.00
Weather Dry 25 2.23 2.03 4.25 5.50 5.75Cloudy 3 0.23 0.26 0.50 0.50 0.50Rain 5 0.45 0.52 1.00 1.00 1.25Fog 0 0.00 0.00 0.00 0.00 0.00Others 0 0.00 0.00 0.00 0.00 0.00Unknown 0 0.00 0.00 0.00 0.00 0.00
Surface Condition Dry 27 2.41 2.11 4.50 5.50 6.00Wet 6 0.50 0.63 1.00 1.00 1.50Others 0 0.00 0.00 0.00 0.00 0.00Unknown 0 0.00 0.00 0.00 0.00 0.00
Month of year January 4 0.32 0.46 0.50 0.50 1.00February 2 0.18 0.46 0.25 0.50 1.00March 5 0.41 0.58 1.00 1.50 1.50April 4 0.36 0.50 0.75 1.00 1.25May 2 0.14 0.23 0.50 0.50 0.50June 3 0.23 0.34 0.50 0.50 0.75July 2 0.18 0.25 0.50 0.50 0.50August 10 0.86 0.74 1.75 2.00 2.00September 6 0.50 0.59 1.25 1.50 1.50October 2 0.18 0.34 0.50 0.50 0.75November 4 0.32 0.34 0.50 0.50 0.75December 5 0.45 0.76 0.75 1.00 1.75
Day of week Monday 3 0.23 0.26 0.50 0.50 0.50Tuesday 5 0.45 0.52 1.00 1.00 1.25Wednesday 0 0.00 0.00 0.00 0.00 0.00Thursday 0 0.00 0.00 0.00 0.00 0.00Friday 0 0.00 0.00 0.00 0.00 0.00Saturday 14 1.23 1.90 3.00 4.00 4.75Sunday 25 2.23 2.03 4.25 5.50 5.75
Hour of day 00:00 - 06:00 2 0.14 0.23 0.50 0.50 0.5006:01 - 09:00 3 0.23 0.34 0.50 0.50 0.7509:01 - 11:00 2 0.18 0.25 0.50 0.50 0.5011:01 - 13:00 4 0.36 0.60 1.00 1.50 1.5013:01 - 15:00 5 0.45 0.65 1.00 1.00 1.5015:01 - 18:00 9 0.77 0.85 1.00 1.00 2.0018:01 - 24:00 23 2.05 2.15 4.00 5.50 6.00
* Crashes averaged for years 1999 and 2000 long forms only.** Standard Deviation column represents the standard deviation for mean crashes per year per intersection.
CATEGORY 10
EXPECTED ANNUAL ACCIDENT VALUE TABLE - ORANGE COUNTY
6 Lane x 2 Lane Intersection, Signalized, AADT/lane for Major Road < 7,500
Total number Intersections Included - 11

251
Total Number Mean Crashes Standard 85th 90th 95th
Crashes Per Year* Per IntersectionPer Year Deviation** Percentile Percentile Percentile
Collision Type Rear End 231 8.23 7.22 16.00 19.45 20.50Head On 6 0.20 0.31 0.50 0.50 0.82Angle 77 2.73 2.40 6.00 6.30 7.00Left Turn 46 1.64 1.70 3.00 3.15 4.15Right Turn 5 0.18 0.34 0.50 0.50 0.50Sideswipe 19 0.66 0.77 1.50 1.65 2.00Pedestrian/Bicycle 7 0.25 0.42 0.50 1.00 1.00Fixed Object 5 0.18 0.39 0.50 0.65 1.00Other 10 0.36 0.47 0.98 1.00 1.33
Severity PDO Crashes 94 3.36 3.08 6.43 6.95 8.33Possible Injury 120 4.27 3.24 7.98 8.80 10.15Non-Incapacitating Injury 91 3.23 2.73 5.48 6.65 8.63Incapacitating Injury 13 0.45 0.42 1.00 1.00 1.00Fatal Crashes 1 0.04 0.13 0.00 0.00 0.32
Light Conditions Daylight 255 9.11 7.18 18.48 20.00 21.63Dusk 7 0.23 0.42 0.50 1.00 1.00Dawn 6 0.21 0.53 0.50 0.65 1.00Dark (w/street lights) 76 2.70 2.52 5.50 6.15 6.50Dark (wo/street lights) 65 2.30 2.60 5.40 7.00 7.33Unknown 2 0.07 0.22 0.00 0.15 0.50
Weather Dry 229 8.18 5.80 15.88 16.60 18.33Cloudy 70 2.50 2.62 4.50 5.75 8.48Rain 18 0.63 0.55 1.00 1.50 1.50Fog 1 0.04 0.13 0.00 0.00 0.32Others 0 0.00 0.00 0.00 0.00 0.00Unknown 0 0.00 0.00 0.00 0.00 0.00
Surface Condition Dry 284 10.13 7.63 17.43 22.90 25.00Wet 32 1.14 1.09 2.50 2.65 3.33Others 2 0.05 0.16 0.00 0.15 0.50Unknown 1 0.02 0.09 0.00 0.00 0.00
Month of year January 36 1.27 1.08 2.50 2.65 3.33February 35 1.25 1.27 2.00 3.50 3.83March 34 1.21 1.08 2.48 3.00 3.33April 32 1.13 1.18 2.50 2.50 2.83May 29 1.04 1.15 2.48 2.50 2.50June 33 1.16 1.37 3.00 3.50 3.83July 36 1.29 1.38 2.50 2.80 3.83August 42 1.48 1.29 2.50 3.15 3.83September 35 1.25 1.21 2.00 2.65 3.33October 38 1.34 1.52 2.98 3.15 3.50November 33 1.18 1.18 2.00 2.65 3.33December 30 1.07 1.14 2.50 3.00 3.33
Day of week Monday 70 2.50 2.62 4.50 5.75 8.48Tuesday 18 0.63 0.55 1.00 1.50 1.50Wednesday 1 0.04 0.13 0.00 0.00 0.32Thursday 0 0.00 0.00 0.00 0.00 0.00Friday 0 0.00 0.00 0.00 0.00 0.00Saturday 93 3.32 4.70 8.95 10.95 12.00Sunday 229 8.18 5.80 15.88 16.60 18.33
Hour of day 00:00 - 06:00 34 1.20 1.18 2.50 2.80 3.5006:01 - 09:00 39 1.38 1.10 2.50 3.00 3.3309:01 - 11:00 22 0.77 0.88 1.50 1.65 2.0011:01 - 13:00 35 1.23 1.00 2.50 2.50 2.8313:01 - 15:00 33 1.16 1.09 2.48 2.65 3.0015:01 - 18:00 65 2.32 2.15 4.50 4.80 5.8318:01 - 24:00 186 6.63 6.71 14.90 16.85 20.00
* Crashes averaged for years 1999 and 2000 long forms only.** Standard Deviation column represents the standard deviation for mean crashes per year per intersection.
CATEGORY 11
EXPECTED ANNUAL ACCIDENT VALUE TABLE - ORANGE COUNTY
6 Lane x 4 Lane and 6 Lane x 6 Lane Intersection, Signalized
Total number Intersections Included - 28

252
Total Number Mean Crashes Standard 85th 90th 95th
Crashes Per Year* Per IntersectionPer Year Deviation** Percentile Percentile Percentile
Collision Type Rear End 30 1.36 1.23 2.50 2.95 3.48Head On 1 0.02 0.11 0.00 0.00 0.00Angle 12 0.52 0.73 1.00 1.45 1.50Left Turn 13 0.57 0.70 1.50 1.50 1.98Right Turn 1 0.05 0.15 0.00 0.00 0.48Sideswipe 1 0.05 0.15 0.00 0.00 0.48Pedestrian/Bicycle 1 0.02 0.11 0.00 0.00 0.00Fixed Object 1 0.05 0.21 0.00 0.00 0.00Other 1 0.05 0.15 0.00 0.00 0.48
Severity PDO Crashes 16 0.70 0.68 1.50 1.50 1.98Possible Injury 23 1.02 0.96 2.00 2.00 2.95Non-Incapacitating Injury 21 0.93 0.93 2.00 2.45 2.50Incapacitating Injury 1 0.05 0.15 0.00 0.00 0.48Fatal Crashes 0 0.00 0.00 0.00 0.00 0.00
Light Conditions Daylight 40 1.80 1.51 3.00 3.90 4.48Dusk 2 0.09 0.20 0.42 0.50 0.50Dawn 1 0.05 0.15 0.00 0.00 0.48Dark (w/street lights) 7 0.32 0.61 0.92 1.45 1.50Dark (wo/street lights) 10 0.45 0.53 0.92 1.00 1.48Unknown 0 0.00 0.00 0.00 0.00 0.00
Weather Dry 42 1.91 1.73 3.43 4.85 5.00Cloudy 11 0.48 0.52 1.00 1.00 1.48Rain 7 0.32 0.45 0.50 0.50 1.45Fog 0 0.00 0.00 0.00 0.00 0.00Others 0 0.00 0.00 0.00 0.00 0.00Unknown 0 0.00 0.00 0.00 0.00 0.00
Surface Condition Dry 52 2.36 1.90 4.43 5.40 5.98Wet 7 0.30 0.45 0.50 0.50 1.45Others 1 0.05 0.15 0.00 0.00 0.48Unknown 0 0.00 0.00 0.00 0.00 0.00
Month of year January 4 0.18 0.29 0.50 0.50 0.50February 3 0.11 0.21 0.50 0.50 0.50March 7 0.32 0.36 0.50 0.95 1.00April 6 0.25 0.48 0.50 0.95 1.48May 5 0.20 0.33 0.50 0.50 0.98June 6 0.25 0.37 0.50 0.95 1.00July 7 0.30 0.45 0.92 1.00 1.00August 4 0.18 0.29 0.50 0.50 0.50September 7 0.30 0.33 0.50 0.50 0.98October 3 0.14 0.28 0.50 0.50 0.50November 5 0.23 0.43 0.50 0.95 1.00December 6 0.25 0.40 0.92 1.00 1.00
Day of week Monday 11 0.48 0.52 1.00 1.00 1.48Tuesday 7 0.32 0.45 0.50 0.50 1.45Wednesday 0 0.00 0.00 0.00 0.00 0.00Thursday 0 0.00 0.00 0.00 0.00 0.00Friday 0 0.00 0.00 0.00 0.00 0.00Saturday 0 0.00 0.00 0.00 0.00 0.00Sunday 42 1.91 1.73 3.43 4.85 5.00
Hour of day 00:00 - 06:00 7 0.32 0.42 0.50 0.95 1.0006:01 - 09:00 5 0.23 0.40 0.50 0.50 0.9809:01 - 11:00 6 0.25 0.37 0.50 0.95 1.0011:01 - 13:00 4 0.18 0.33 0.50 0.50 0.9813:01 - 15:00 8 0.36 0.41 0.50 0.95 1.0015:01 - 18:00 15 0.66 0.70 1.50 1.50 1.9818:01 - 24:00 17 0.77 0.75 1.00 1.90 2.00
* Crashes averaged for years 1999 and 2000 long forms only.** Standard Deviation column represents the standard deviation for mean crashes per year per intersection.
CATEGORY 12
EXPECTED ANNUAL ACCIDENT VALUE TABLE - ORANGE COUNTY
T Intersection, Signalized, AADT/lane for Major Road >= 7,500
Total number Intersections Included - 22

253
Total Number Mean Crashes Standard 85th 90th 95th
Crashes Per Year* Per IntersectionPer Year Deviation** Percentile Percentile Percentile
Collision Type Rear End 11 0.79 1.07 2.03 2.35 2.68Head On 1 0.04 0.13 0.00 0.00 0.18Angle 5 0.32 0.37 0.52 0.85 1.00Left Turn 4 0.25 0.38 0.52 0.85 1.00Right Turn 1 0.04 0.13 0.00 0.00 0.18Sideswipe 1 0.04 0.13 0.00 0.00 0.18Pedestrian/Bicycle 0 0.00 0.00 0.00 0.00 0.00Fixed Object 1 0.04 0.13 0.00 0.00 0.18Other 1 0.04 0.13 0.00 0.00 0.18
Severity PDO Crashes 5 0.32 0.46 0.52 0.85 1.18Possible Injury 9 0.64 0.79 1.53 1.85 2.00Non-Incapacitating Injury 7 0.50 0.78 1.53 1.85 2.00Incapacitating Injury 1 0.07 0.18 0.02 0.35 0.50Fatal Crashes 0 0.00 0.00 0.00 0.00 0.00
Light Conditions Daylight 14 1.00 1.26 2.08 3.05 3.50Dusk 1 0.04 0.13 0.00 0.00 0.18Dawn 0 0.00 0.00 0.00 0.00 0.00Dark (w/street lights) 4 0.29 0.43 0.50 0.50 0.85Dark (wo/street lights) 3 0.21 0.38 0.52 0.85 1.00Unknown 0 0.00 0.00 0.00 0.00 0.00
Weather Dry 16 1.11 1.40 2.53 2.85 3.35Cloudy 3 0.21 0.32 0.50 0.50 0.68Rain 3 0.21 0.43 0.50 0.50 0.85Fog 0 0.00 0.00 0.00 0.00 0.00Others 0 0.00 0.00 0.00 0.00 0.00Unknown 0 0.00 0.00 0.00 0.00 0.00
Surface Condition Dry 17 1.21 1.41 2.53 2.85 3.35Wet 5 0.32 0.61 1.00 1.00 1.35Others 0 0.00 0.00 0.00 0.00 0.00Unknown 0 0.00 0.00 0.00 0.00 0.00
Month of year January 1 0.07 0.18 0.02 0.35 0.50February 2 0.14 0.36 0.05 0.70 1.00March 3 0.21 0.43 0.50 0.50 0.85April 1 0.04 0.13 0.00 0.00 0.18May 4 0.25 0.38 0.52 0.85 1.00June 3 0.18 0.42 0.50 0.50 0.85July 1 0.04 0.13 0.00 0.00 0.18August 4 0.25 0.47 0.52 0.85 1.18September 2 0.14 0.31 0.50 0.50 0.68October 1 0.04 0.13 0.00 0.00 0.18November 1 0.07 0.18 0.02 0.35 0.50December 2 0.11 0.21 0.50 0.50 0.50
Day of week Monday 3 0.21 0.32 0.50 0.50 0.68Tuesday 3 0.21 0.43 0.50 0.50 0.85Wednesday 0 0.00 0.00 0.00 0.00 0.00Thursday 0 0.00 0.00 0.00 0.00 0.00Friday 0 0.00 0.00 0.00 0.00 0.00Saturday 0 0.00 0.00 0.00 0.00 0.00Sunday 16 1.11 1.40 2.53 2.85 3.35
Hour of day 00:00 - 06:00 1 0.07 0.18 0.02 0.35 0.5006:01 - 09:00 4 0.25 0.67 0.50 0.50 1.2009:01 - 11:00 1 0.04 0.13 0.00 0.00 0.1811:01 - 13:00 1 0.04 0.13 0.00 0.00 0.1813:01 - 15:00 3 0.21 0.67 0.02 0.35 1.2015:01 - 18:00 6 0.39 0.49 1.00 1.00 1.1818:01 - 24:00 11 0.75 0.67 1.50 1.50 1.85
* Crashes averaged for years 1999 and 2000 long forms only.** Standard Deviation column represents the standard deviation for mean crashes per year per intersection.
CATEGORY 13
EXPECTED ANNUAL ACCIDENT VALUE TABLE - ORANGE COUNTY
T Intersection, Signalized, AADT/lane for Major Road < 7,500
Total number Intersections Included - 14

254
APPENDIX F
19 CATEGORY CRASH PROFILE TABLES FOR SEMINOLE
COUNTY

255
Total Number Mean Crashes Standard 85th 90th 95th
Crashes Per Year* Per IntersectionPer Year Deviation** Percentile Percentile Percentile
Collision Type Rear End 34 1.29 2.83 2.3 2.8 4.1Head On 1 0.03 0.09 0.0 0.0 0.3Angle 16 0.62 1.01 1.6 2.5 2.9Left Turn 14 0.54 1.05 1.0 1.5 2.8Right Turn 1 0.05 0.15 0.0 0.2 0.3Sideswipe 3 0.12 0.30 0.3 0.3 0.6Pedestrian/Bicycle 1 0.05 0.12 0.1 0.3 0.3Other 5 0.17 0.23 0.3 0.5 0.7
Severity PDO Crashes 36 1.40 2.68 2.3 3.8 4.8Injury 23 0.88 1.25 2.3 2.3 3.1Non-Incapacitating Injury 10 0.38 0.67 0.8 1.3 1.7Incapacitating Injury 6 0.22 0.35 0.4 0.7 0.9Fatal Crashes 0 0.00 0.00 0.0 0.0 0.0
Light Conditions Daylight 54 2.08 3.32 4.0 5.2 6.8Dusk 3 0.10 0.25 0.3 0.3 0.6Dawn 0 0.01 0.07 0.0 0.0 0.0Dark (w/street lights) 16 0.62 1.18 1.1 1.8 2.8Dark (wo/street lights) 2 0.06 0.16 0.1 0.3 0.3
Surface Condition Dry 64 2.45 3.89 4.6 6.7 9.8Wet 10 0.40 0.92 0.7 0.8 1.8Others 1 0.04 0.14 0.0 0.0 0.3
Month of year January 6 0.23 0.35 0.7 0.8 1.0February 5 0.19 0.34 0.7 0.7 0.7March 5 0.19 0.53 0.3 0.3 0.6April 6 0.22 0.49 0.3 0.7 1.3May 8 0.31 0.44 0.7 0.8 1.0June 4 0.17 0.27 0.3 0.5 0.7July 6 0.22 0.47 0.3 0.5 1.2August 5 0.21 0.66 0.3 0.3 0.6September 8 0.29 0.58 0.5 1.2 1.3October 6 0.23 0.50 0.4 0.8 1.3November 10 0.37 0.61 0.8 1.5 1.7December 7 0.26 0.46 0.4 0.8 1.0
Day of week Monday 7 0.28 0.56 0.7 0.7 0.9Tuesday 10 0.40 0.63 1.0 1.2 1.8Wednesday 14 0.55 0.93 1.2 1.7 1.9Thursday 11 0.41 0.78 0.4 1.3 2.3Friday 13 0.51 0.99 1.1 1.5 2.2Saturday 12 0.47 0.76 1.0 1.0 1.8Sunday 7 0.26 0.52 0.4 1.0 1.3
Hour of day 00:00 - 06:00 4 0.15 0.30 0.3 0.5 0.906:01 - 09:00 7 0.28 0.52 0.7 1.0 1.309:01 - 11:00 6 0.24 0.49 0.3 0.5 0.911:01 - 13:00 11 0.42 0.62 1.0 1.2 1.613:01 - 15:00 8 0.29 0.51 0.7 0.7 0.915:01 - 18:00 19 0.72 1.20 1.5 2.2 2.318:01 - 24:00 18 0.68 1.35 1.3 2.0 2.9
* Crashes averaged for years 1999, 2000 and 2001 long forms only.** Standard Deviation column represents the standard deviation for mean crashes per year per intersection.
CATEGORY 1
Total number of intersections Included - 26
EXPECTED ANNUAL ACCIDENT TABLE - SEMINOLE COUNTY2 Lane x 2 Lane Signalized Intersection, AADT/ Lane On Major Road ≥ 5,000

256
Total Number Mean Crashes Standard 85th 90th 95th
Crashes Per Year* Per IntersectionPer Year Deviation** Percentile Percentile Percentile
Collision Type Rear End 1 0.20 0.30 0.5 0.5 0.6Head On 0 0.07 0.15 0.1 0.2 0.3Angle 1 0.20 0.30 0.5 0.5 0.6Left Turn 1 0.13 0.18 0.3 0.3 0.3Right Turn 0 0.07 0.15 0.1 0.2 0.3Sideswipe 0 0.00 0.00 0.0 0.0 0.0Pedestrian/Bicycle 0 0.00 0.00 0.0 0.0 0.0Other 1 0.13 0.18 0.3 0.3 0.3
Severity PDO Crashes 2 0.33 0.24 0.5 0.5 0.6Injury 1 0.20 0.30 0.5 0.5 0.6Non-Incapacitating Injury 1 0.27 0.28 0.5 0.5 0.6Incapacitating Injury 0 0.00 0.00 0.0 0.0 0.0Fatal Crashes 0 0.00 0.00 0.0 0.0 0.0
Light Conditions Daylight 2 0.33 0.33 0.7 0.7 0.7
Dusk 0 0.07 0.15 0.1 0.2 0.3Dawn 0 0.07 0.15 0.1 0.2 0.3Dark (w/street lights) 1 0.27 0.28 0.5 0.5 0.6Dark (wo/street lights) 0 0.07 0.15 0.1 0.2 0.3
Surface Condition Dry 3 0.60 0.49 0.9 1.1 1.2
Wet 1 0.20 0.18 0.3 0.3 0.3Others 0 0.00 0.00 0.0 0.0 0.0
Month of year January 0 0.07 0.15 0.1 0.2 0.3
February 0 0.07 0.15 0.1 0.2 0.3March 0 0.07 0.15 0.1 0.2 0.3April 0 0.00 0.00 0.0 0.0 0.0May 0 0.07 0.15 0.1 0.2 0.3June 1 0.13 0.18 0.3 0.3 0.3July 0 0.07 0.15 0.1 0.2 0.3August 1 0.20 0.30 0.5 0.5 0.6September 0 0.07 0.15 0.1 0.2 0.3October 0 0.07 0.15 0.1 0.2 0.3November 0 0.06 0.14 0.1 0.2 0.3December 0 0.06 0.14 0.1 0.2 0.3
Day of week Monday 0 0.07 0.15 0.1 0.2 0.3
Tuesday 1 0.13 0.18 0.3 0.3 0.3Wednesday 0 0.07 0.15 0.1 0.2 0.3Thursday 1 0.20 0.30 0.5 0.5 0.6Friday 0 0.00 0.00 0.0 0.0 0.0Saturday 0 0.07 0.15 0.1 0.2 0.3Sunday 1 0.27 0.28 0.5 0.5 0.6
Hour of day 00:00 - 06:00 0 0.07 0.15 0.1 0.2 0.3
06:01 - 09:00 0 0.00 0.00 0.0 0.0 0.009:01 - 11:00 0 0.07 0.15 0.1 0.2 0.311:01 - 13:00 0 0.00 0.00 0.0 0.0 0.013:01 - 15:00 0 0.00 0.00 0.0 0.0 0.015:01 - 18:00 1 0.13 0.18 0.3 0.3 0.318:01 - 24:00 3 0.53 0.51 0.9 1.1 1.2
* Crashes averaged for years 1999, 2000 and 2001 long forms only.** Standard Deviation column represents the standard deviation for mean crashes per year per intersection.
CATEGORY 2EXPECTED ANNUAL ACCIDENT TABLE - SEMINOLE COUNTY
2 Lane x 2 Lane Intersection, Signalized, AADT/lane for Major Road < 5000 Total number Intersections Included - 5

257
Total Number Mean Crashes Standard 85th 90th 95th
Crashes Per Year* Per IntersectionPer Year Deviation** Percentile Percentile Percentile
Collision Type Rear End 89 2.71 3.05 4.6 5.7 8.0Head On 3 0.08 0.17 0.3 0.3 0.3Angle 32 0.96 1.16 2.1 3.2 3.5Left Turn 28 0.86 0.88 1.7 2.0 2.3Right Turn 2 0.06 0.13 0.3 0.3 0.3Sideswipe 13 0.40 0.66 1.0 1.3 1.5Pedestrian/Bicycle 7 0.20 0.32 0.4 0.7 1.0Other 10 0.30 0.29 0.7 0.7 0.7
Severity PDO Crashes 93 2.81 3.39 4.7 6.1 10.1Injury 60 1.81 1.63 3.4 3.9 4.9Non-Incapacitating Injury 25 0.77 0.62 1.7 1.7 1.7Incapacitating Injury 6 0.18 0.26 0.3 0.6 0.7Fatal Crashes 0 0.01 0.06 0.0 0.0 0.0
Light Conditions Daylight 127 3.85 3.79 6.7 6.9 11.7Dusk 6 0.19 0.22 0.3 0.3 0.7Dawn 2 0.05 0.12 0.1 0.3 0.3Dark (w/street lights) 41 1.25 1.38 2.3 2.6 4.1Dark (wo/street lights) 4 0.13 0.26 0.3 0.6 0.7
Surface Condition Dry 153 4.63 4.10 7.4 7.9 13.1Wet 24 0.73 1.04 1.4 1.7 2.9Others 7 0.21 0.38 0.7 0.7 0.8
Month of year January 15 0.45 0.52 0.7 1.3 1.5February 15 0.45 0.48 1.0 1.0 1.3March 13 0.39 0.44 1.0 1.0 1.3April 17 0.51 0.62 1.1 1.6 1.8May 16 0.48 0.57 1.3 1.3 1.5June 18 0.54 0.65 1.0 1.0 1.9July 13 0.40 0.53 0.7 1.0 1.3August 15 0.44 0.57 1.0 1.3 1.7September 15 0.44 0.51 1.0 1.3 1.5October 15 0.44 0.50 0.7 1.0 1.3November 16 0.47 0.44 0.7 0.9 1.1December 18 0.54 0.66 1.3 1.6 2.0
Day of week Monday 22 0.67 0.71 1.7 1.7 1.8Tuesday 29 0.89 0.92 1.3 1.6 2.6Wednesday 27 0.81 0.77 1.1 1.6 2.5Thursday 25 0.77 0.86 1.3 1.6 2.3Friday 32 0.98 1.02 1.7 2.5 2.7Saturday 29 0.88 1.07 1.7 2.0 3.3Sunday 19 0.59 0.66 1.3 1.3 1.3
Hour of day 00:00 - 06:00 8 0.25 0.38 0.7 0.9 1.006:01 - 09:00 20 0.62 0.73 1.3 1.6 1.809:01 - 11:00 13 0.38 0.44 1.0 1.0 1.111:01 - 13:00 22 0.68 0.90 1.4 1.9 2.013:01 - 15:00 25 0.76 0.91 1.4 1.7 2.115:01 - 18:00 39 1.17 1.31 2.0 2.5 3.318:01 - 24:00 50 1.53 1.27 2.7 2.9 3.7
* Crashes averaged for years 1999, 2000 and 2001 long forms only.** Standard Deviation column represents the standard deviation for mean crashes per year per intersection.
CATEGORY 4EXPECTED ANNUAL ACCIDENT TABLE - SEMINOLE COUNTY
4 Lane x 2 Lane Intersection, Signalized, AADT/lane for Major Road ≥ 7000 (LT lanes > 2)Total number Intersections Included - 33

258
Total Number Mean Crashes Standard 85th 90th 95th
Crashes Per Year* Per IntersectionPer Year Deviation** Percentile Percentile Percentile
Collision Type Rear End 0 0.00 0.00 0.0 0.0 0.0Head On 0 0.00 0.00 0.0 0.0 0.0Angle 0 0.00 0.00 0.0 0.0 0.0Left Turn 0 0.00 0.00 0.0 0.0 0.0Right Turn 0 0.00 0.00 0.0 0.0 0.0Sideswipe 0 0.00 0.00 0.0 0.0 0.0Pedestrian/Bicycle 0 0.00 0.00 0.0 0.0 0.0Other 0 0.00 0.00 0.0 0.0 0.0
Severity PDO Crashes 0 0.00 0.00 0.0 0.0 0.0Injury 0 0.00 0.00 0.0 0.0 0.0Non-Incapacitating Injury 0 0.00 0.00 0.0 0.0 0.0Incapacitating Injury 0 0.00 0.00 0.0 0.0 0.0Fatal Crashes 0 0.00 0.00 0.0 0.0 0.0
Light Conditions Daylight 0 0.00 0.00 0.0 0.0 0.0Dusk 0 0.00 0.00 0.0 0.0 0.0Dawn 0 0.00 0.00 0.0 0.0 0.0Dark (w/street lights) 0 0.00 0.00 0.0 0.0 0.0Dark (wo/street lights) 0 0.00 0.00 0.0 0.0 0.0
Surface Condition Dry 0 0.00 0.00 0.0 0.0 0.0Wet 0 0.00 0.00 0.0 0.0 0.0Others 0 0.00 0.00 0.0 0.0 0.0
Month of year January 0 0.00 0.00 0.0 0.0 0.0February 0 0.00 0.00 0.0 0.0 0.0March 0 0.00 0.00 0.0 0.0 0.0April 0 0.00 0.00 0.0 0.0 0.0May 0 0.00 0.00 0.0 0.0 0.0June 0 0.00 0.00 0.0 0.0 0.0July 0 0.00 0.00 0.0 0.0 0.0August 0 0.00 0.00 0.0 0.0 0.0September 0 0.00 0.00 0.0 0.0 0.0October 0 0.00 0.00 0.0 0.0 0.0November 0 0.00 0.00 0.0 0.0 0.0December 0 0.00 0.00 0.0 0.0 0.0
Day of week Monday 0 0.00 0.00 0.0 0.0 0.0Tuesday 0 0.00 0.00 0.0 0.0 0.0Wednesday 0 0.00 0.00 0.0 0.0 0.0Thursday 0 0.00 0.00 0.0 0.0 0.0Friday 0 0.00 0.00 0.0 0.0 0.0Saturday 0 0.00 0.00 0.0 0.0 0.0Sunday 0 0.00 0.00 0.0 0.0 0.0
Hour of day 00:00 - 06:00 0 0.00 0.00 0.0 0.0 0.006:01 - 09:00 0 0.00 0.00 0.0 0.0 0.009:01 - 11:00 0 0.00 0.00 0.0 0.0 0.011:01 - 13:00 0 0.00 0.00 0.0 0.0 0.013:01 - 15:00 0 0.00 0.00 0.0 0.0 0.015:01 - 18:00 0 0.00 0.00 0.0 0.0 0.018:01 - 24:00 0 0.00 0.00 0.0 0.0 0.0
* Crashes averaged for years 1999, 2000 and 2001 long forms only.** Standard Deviation column represents the standard deviation for mean crashes per year per intersection.
CATEGORY 5EXPECTED ANNUAL ACCIDENT TABLE - SEMINOLE COUNTY
4 Lane x 2 Lane Intersection, Signalized, AADT/lane for Major Road < 7000 (LT lanes ≤ 2)Total number Intersections Included - 2

259
Total Number Mean Crashes Standard 85th 90th 95th
Crashes Per Year* Per IntersectionPer Year Deviation** Percentile Percentile Percentile
Collision Type Rear End 16 0.59 0.72 1.0 1.6 2.2Head On 1 0.04 0.14 0.0 0.0 0.2Angle 10 0.37 0.53 0.7 0.8 1.2Left Turn 10 0.38 0.54 1.0 1.0 1.5Right Turn 1 0.04 0.11 0.0 0.1 0.3Sideswipe 1 0.02 0.09 0.0 0.0 0.2Pedestrian/Bicycle 1 0.04 0.11 0.0 0.1 0.3Other 3 0.10 0.20 0.3 0.3 0.6
Severity PDO Crashes 15 0.57 0.80 1.0 1.1 1.3Injury 18 0.67 0.75 1.7 1.8 2.0Non-Incapacitating Injury 10 0.36 0.45 1.0 1.0 1.2Incapacitating Injury 2 0.07 0.17 0.3 0.3 0.3Fatal Crashes 0 0.00 0.00 0.0 0.0 0.0
Light Conditions Daylight 30 1.12 1.27 2.0 2.5 2.9Dusk 2 0.09 0.18 0.3 0.3 0.3Dawn 1 0.02 0.09 0.0 0.0 0.2Dark (w/street lights) 10 0.37 0.55 1.0 1.0 1.5Dark (wo/street lights) 1 0.05 0.15 0.0 0.1 0.3
Surface Condition Dry 37 1.36 1.32 2.7 2.9 3.8Wet 8 0.28 0.57 0.4 0.7 1.1Others 1 0.02 0.09 0.0 0.0 0.2
Month of year January 3 0.12 0.25 0.4 0.7 0.7February 2 0.09 0.20 0.3 0.3 0.6March 3 0.10 0.18 0.3 0.3 0.3April 3 0.11 0.18 0.3 0.3 0.3May 4 0.16 0.28 0.3 0.3 0.3June 4 0.14 0.25 0.3 0.3 0.6July 3 0.11 0.23 0.3 0.5 0.7August 4 0.15 0.23 0.3 0.5 0.7September 5 0.20 0.30 0.7 0.7 0.7October 5 0.17 0.21 0.3 0.3 0.6November 5 0.19 0.31 0.3 0.5 0.7December 4 0.14 0.27 0.3 0.5 0.7
Day of week Monday 7 0.27 0.35 0.7 0.8 1.0Tuesday 7 0.27 0.41 0.7 0.8 1.0Wednesday 4 0.15 0.34 0.3 0.3 0.3Thursday 5 0.17 0.27 0.3 0.5 0.7Friday 9 0.33 0.40 0.7 0.7 1.1Saturday 9 0.33 0.53 1.0 1.3 1.3Sunday 4 0.14 0.25 0.3 0.3 0.6
Hour of day 00:00 - 06:00 1 0.05 0.12 0.0 0.3 0.306:01 - 09:00 7 0.25 0.38 0.7 0.7 0.709:01 - 11:00 2 0.09 0.20 0.3 0.3 0.611:01 - 13:00 5 0.20 0.35 0.4 0.7 0.913:01 - 15:00 4 0.16 0.23 0.3 0.5 0.715:01 - 18:00 13 0.47 0.48 1.0 1.0 1.518:01 - 24:00 12 0.46 0.57 1.0 1.1 1.8
* Crashes averaged for years 1999, 2000 and 2001 long forms only.** Standard Deviation column represents the standard deviation for mean crashes per year per intersection.
CATEGORY 6EXPECTED ANNUAL ACCIDENT TABLE - SEMINOLE COUNTY
4 Lane x 2 Lane Intersection, Signalized, AADT/lane for Major Road < 7000 (LT lanes > 2)Total number Intersections Included - 27

260
Total Number Mean Crashes Standard 85th 90th 95th
Crashes Per Year* Per IntersectionPer Year Deviation** Percentile Percentile Percentile
Collision Type Rear End 38 3.83 5.06 8.6 9.8 12.1Head On 1 0.07 0.14 0.2 0.3 0.3Angle 12 1.23 2.15 2.5 3.4 5.0Left Turn 11 1.07 1.39 2.3 2.8 3.4Right Turn 1 0.10 0.22 0.2 0.4 0.5Sideswipe 3 0.33 0.47 0.7 0.7 1.0Pedestrian/Bicycle 1 0.07 0.21 0.0 0.1 0.4Other 2 0.17 0.24 0.3 0.4 0.5
Severity PDO Crashes 36 3.63 4.73 9.3 10.8 11.6Injury 23 2.33 2.77 5.4 6.4 6.9Non-Incapacitating Injury 6 0.60 1.10 1.3 1.8 2.6Incapacitating Injury 3 0.27 0.34 0.6 0.7 0.9Fatal Crashes 0 0.03 0.11 0.0 0.0 0.2
Light Conditions Daylight 52 5.20 6.74 13.3 15.0 16.3Dusk 2 0.17 0.24 0.3 0.4 0.5Dawn 0 0.03 0.11 0.0 0.0 0.2Dark (w/street lights) 13 1.30 1.49 2.9 3.1 3.4Dark (wo/street lights) 1 0.07 0.14 0.2 0.3 0.3
Surface Condition Dry 59 5.93 7.17 13.7 14.2 16.6Wet 8 0.77 0.90 1.8 2.0 2.2Others 2 0.17 0.28 0.6 0.7 0.7
Month of year January 4 0.43 0.61 1.0 1.1 1.4February 4 0.40 0.72 1.1 1.4 1.7March 5 0.50 0.84 0.9 1.2 1.9April 7 0.73 0.83 1.7 1.7 1.9May 5 0.53 0.74 0.9 1.1 1.7June 5 0.53 0.83 1.7 2.0 2.0July 3 0.30 0.46 0.7 0.7 1.0August 7 0.70 1.33 0.9 1.3 2.8September 7 0.67 0.75 1.7 1.7 1.7October 8 0.83 1.08 2.2 2.4 2.5November 6 0.60 0.72 1.2 1.4 1.7December 6 0.63 0.92 1.8 2.0 2.2
Day of week Monday 5 0.53 0.71 1.2 1.4 1.7Tuesday 13 1.33 1.67 3.1 3.4 3.9Wednesday 11 1.07 1.25 2.7 2.7 2.9Thursday 10 1.00 1.42 3.0 3.3 3.3Friday 12 1.20 1.72 2.8 3.5 4.3Saturday 9 0.87 1.08 1.9 2.1 2.6Sunday 9 0.87 1.11 2.1 2.4 2.7
Hour of day 00:00 - 06:00 3 0.30 0.46 0.7 0.7 1.006:01 - 09:00 5 0.50 0.74 0.9 1.1 1.709:01 - 11:00 5 0.53 0.77 1.4 1.7 1.911:01 - 13:00 12 1.23 1.75 3.5 4.0 4.213:01 - 15:00 12 1.17 1.72 2.2 2.6 4.015:01 - 18:00 14 1.43 2.10 3.9 4.8 5.218:01 - 24:00 15 1.47 1.63 3.2 3.4 3.7
* Crashes averaged for years 1999, 2000 and 2001 long forms only.** Standard Deviation column represents the standard deviation for mean crashes per year per intersection.
CATEGORY 7EXPECTED ANNUAL ACCIDENT TABLE - SEMINOLE COUNTY
4 Lane x 4 Lane Intersection, Signalized AADT/lane for Major Road ≥ 7500 Total number Intersections Included - 10

261
Total Number Mean Crashes Standard 85th 90th 95th
Crashes Per Year* Per IntersectionPer Year Deviation** Percentile Percentile Percentile
Collision Type Rear End 16 1.78 1.15 2.7 2.7 2.9Head On 1 0.07 0.15 0.3 0.3 0.3Angle 6 0.63 0.70 1.3 1.4 1.5Left Turn 5 0.52 0.78 1.5 1.7 1.9Right Turn 0 0.00 0.00 0.0 0.0 0.0Sideswipe 1 0.07 0.15 0.3 0.3 0.3Pedestrian/Bicycle 1 0.07 0.15 0.3 0.3 0.3Other 2 0.22 0.29 0.6 0.7 0.7
Severity PDO Crashes 11 1.22 0.90 2.0 2.1 2.2Injury 12 1.33 0.97 2.3 2.4 2.5Non-Incapacitating Injury 5 0.59 0.55 1.3 1.3 1.3Incapacitating Injury 2 0.19 0.24 0.3 0.4 0.5Fatal Crashes 0 0.04 0.11 0.0 0.1 0.2
Light Conditions Daylight 21 2.37 1.58 3.9 4.0 4.0Dusk 0 0.04 0.11 0.0 0.1 0.2Dawn 1 0.07 0.15 0.3 0.3 0.3Dark (w/street lights) 5 0.59 0.62 0.9 1.2 1.6Dark (wo/street lights) 2 0.26 0.36 0.6 0.7 0.9
Surface Condition Dry 25 2.81 1.93 4.0 4.4 5.2Wet 3 0.37 0.42 0.9 1.0 1.0Others 2 0.19 0.34 0.3 0.5 0.7
Month of year January 3 0.33 0.37 0.7 0.7 0.9February 1 0.15 0.18 0.3 0.3 0.3March 3 0.37 0.35 0.7 0.7 0.9April 4 0.44 0.47 0.9 1.1 1.2May 3 0.30 0.45 0.6 0.8 1.1June 3 0.33 0.37 0.7 0.7 0.9July 2 0.22 0.24 0.3 0.4 0.5August 4 0.44 0.47 1.0 1.0 1.0September 3 0.30 0.31 0.3 0.5 0.7October 1 0.15 0.29 0.5 0.7 0.7November 2 0.22 0.47 0.5 0.8 1.1December 1 0.11 0.17 0.3 0.3 0.3
Day of week Monday 2 0.19 0.18 0.3 0.3 0.3Tuesday 4 0.48 0.38 0.9 1.0 1.0Wednesday 4 0.48 0.44 0.7 0.8 1.1Thursday 7 0.74 0.55 1.3 1.3 1.3Friday 4 0.48 0.41 0.7 0.8 1.1Saturday 5 0.56 0.53 1.3 1.3 1.3Sunday 4 0.44 0.44 0.7 0.8 1.1
Hour of day 00:00 - 06:00 1 0.11 0.17 0.3 0.3 0.306:01 - 09:00 3 0.37 0.39 0.7 0.7 0.909:01 - 11:00 2 0.19 0.24 0.3 0.4 0.511:01 - 13:00 3 0.33 0.44 0.9 1.0 1.013:01 - 15:00 6 0.63 0.72 0.9 1.3 1.815:01 - 18:00 7 0.74 0.57 1.3 1.4 1.518:01 - 24:00 9 0.96 0.98 1.8 2.2 2.6
* Crashes averaged for years 1999, 2000 and 2001 long forms only.** Standard Deviation column represents the standard deviation for mean crashes per year per intersection.
CATEGORY 8EXPECTED ANNUAL ACCIDENT TABLE - SEMINOLE COUNTY
4 Lane x 4 Lane Intersection, Signalized AADT/lane for Major Road < 7500 Total number Intersections Included - 9

262
Total Number Mean Crashes Standard 85th 90th 95th
Crashes Per Year* Per IntersectionPer Year Deviation** Percentile Percentile Percentile
Collision Type Rear End 70 4.12 3.48 7.3 8.9 11.4Head On 1 0.04 0.16 0.0 0.0 0.1Angle 20 1.18 0.87 2.0 2.1 2.4Left Turn 12 0.73 1.02 1.3 1.6 2.4Right Turn 2 0.10 0.20 0.3 0.3 0.4Sideswipe 9 0.53 0.67 0.9 1.1 1.6Pedestrian/Bicycle 2 0.12 0.20 0.3 0.3 0.4Other 9 0.51 0.50 1.0 1.0 1.1
Severity PDO Crashes 68 3.98 3.57 7.1 8.5 10.1Injury 38 2.25 1.58 3.3 3.6 4.5Non-Incapacitating Injury 14 0.80 0.55 1.0 1.1 1.5Incapacitating Injury 4 0.25 0.30 0.5 0.7 0.7Fatal Crashes 0 0.02 0.08 0.0 0.0 0.1
Light Conditions Daylight 90 5.29 3.93 9.9 10.8 11.7Dusk 3 0.18 0.24 0.3 0.5 0.7Dawn 1 0.04 0.11 0.0 0.1 0.3Dark (w/street lights) 25 1.49 1.58 2.7 3.5 4.2Dark (wo/street lights) 2 0.12 0.23 0.3 0.5 0.7
Surface Condition Dry 99 5.82 4.30 9.5 10.1 12.1Wet 20 1.18 1.18 1.9 2.9 3.7Others 5 0.29 0.45 0.7 0.7 0.9
Month of year January 13 0.75 0.85 1.9 2.0 2.1February 7 0.39 0.44 0.9 1.1 1.3March 11 0.67 0.53 1.2 1.3 1.5April 11 0.63 0.65 1.2 1.6 2.0May 13 0.76 1.01 1.5 1.9 2.6June 12 0.69 0.73 1.0 1.4 2.1July 9 0.51 0.53 0.7 0.9 1.5August 13 0.76 0.45 1.2 1.3 1.4September 7 0.41 0.43 0.7 0.8 1.1October 9 0.53 0.37 0.9 1.0 1.1November 10 0.59 0.69 0.9 1.3 1.9December 11 0.63 0.63 1.3 1.5 1.7
Day of week Monday 12 0.71 0.70 1.4 1.7 1.8Tuesday 22 1.31 1.11 2.0 2.3 3.1Wednesday 20 1.16 1.13 2.2 2.6 3.2Thursday 16 0.96 0.83 1.9 2.1 2.4Friday 21 1.24 1.02 2.2 2.5 2.8Saturday 18 1.06 0.96 1.7 1.9 2.6Sunday 15 0.88 0.69 1.2 1.5 1.9
Hour of day 00:00 - 06:00 6 0.33 0.47 0.3 0.7 1.406:01 - 09:00 12 0.73 0.79 1.4 1.9 2.409:01 - 11:00 10 0.59 0.65 0.9 1.4 2.111:01 - 13:00 14 0.82 0.71 1.5 1.7 1.913:01 - 15:00 17 1.00 0.78 1.5 1.9 2.415:01 - 18:00 27 1.57 1.41 3.0 3.4 4.118:01 - 24:00 30 1.76 1.67 2.9 4.1 5.5
* Crashes averaged for years 1999, 2000 and 2001 long forms only.** Standard Deviation column represents the standard deviation for mean crashes per year per intersection.
CATEGORY 9EXPECTED ANNUAL ACCIDENT TABLE - SEMINOLE COUNTY
6 Lane x 2 Lane Intersection, Signalized AADT/lane for Major Road ≥ 7500 Total number Intersections Included - 17

263
Total Number Mean Crashes Standard 85th 90th 95th
Crashes Per Year* Per IntersectionPer Year Deviation** Percentile Percentile Percentile
Collision Type Rear End 5 1.00 0.94 1.8 1.9 1.9Head On 0 0.07 0.15 0.1 0.2 0.3Angle 3 0.67 0.78 1.5 1.5 1.6Left Turn 1 0.27 0.15 0.3 0.3 0.3Right Turn 0 0.07 0.15 0.1 0.2 0.3Sideswipe 1 0.13 0.18 0.3 0.3 0.3Pedestrian/Bicycle 0 0.07 0.15 0.1 0.2 0.3Other 1 0.13 0.18 0.3 0.3 0.3
Severity PDO Crashes 4 0.87 0.69 1.5 1.5 1.6Injury 5 0.93 0.92 1.7 1.9 2.1Non-Incapacitating Injury 2 0.40 0.60 0.9 1.1 1.2Incapacitating Injury 1 0.13 0.18 0.3 0.3 0.3Fatal Crashes 0 0.07 0.15 0.1 0.2 0.3
Light Conditions Daylight 9 1.73 1.66 3.2 3.5 3.7Dusk 0 0.07 0.15 0.1 0.2 0.3Dawn 2 0.40 0.43 0.8 0.9 0.9Dark (w/street lights) 1 0.13 0.30 0.3 0.4 0.5Dark (wo/street lights) 1 0.20 0.30 0.5 0.5 0.6
Surface Condition Dry 11 2.13 1.68 3.5 3.5 3.6Wet 1 0.27 0.43 0.6 0.7 0.9Others 0 0.00 0.00 0.0 0.0 0.0
Month of year January 1 0.13 0.18 0.3 0.3 0.3February 2 0.33 0.41 0.6 0.7 0.9March 1 0.13 0.18 0.3 0.3 0.3April 1 0.27 0.43 0.6 0.7 0.9May 1 0.20 0.30 0.5 0.5 0.6June 1 0.27 0.37 0.7 0.7 0.7July 1 0.13 0.18 0.3 0.3 0.3August 0 0.07 0.15 0.1 0.2 0.3September 1 0.20 0.18 0.3 0.3 0.3October 0 0.07 0.15 0.1 0.2 0.3November 2 0.47 0.51 1.0 1.0 1.0December 1 0.13 0.18 0.3 0.3 0.3
Day of week Monday 2 0.47 0.69 0.9 1.1 1.4Tuesday 1 0.27 0.28 0.5 0.5 0.6Wednesday 1 0.13 0.30 0.3 0.4 0.5Thursday 1 0.20 0.30 0.5 0.5 0.6Friday 2 0.47 0.51 1.0 1.0 1.0Saturday 2 0.47 0.30 0.7 0.7 0.7Sunday 2 0.40 0.43 0.8 0.9 0.9
Hour of day 00:00 - 06:00 1 0.27 0.28 0.5 0.5 0.606:01 - 09:00 2 0.33 0.47 0.8 0.9 0.909:01 - 11:00 1 0.13 0.18 0.3 0.3 0.311:01 - 13:00 1 0.13 0.18 0.3 0.3 0.313:01 - 15:00 3 0.67 0.71 1.3 1.4 1.515:01 - 18:00 2 0.47 0.38 0.8 0.9 0.918:01 - 24:00 2 0.40 0.55 0.7 0.9 1.1
* Crashes averaged for years 1999, 2000 and 2001 long forms only.** Standard Deviation column represents the standard deviation for mean crashes per year per intersection.
CATEGORY 10EXPECTED ANNUAL ACCIDENT TABLE - SEMINOLE COUNTY
6 Lane x 2 Lane Intersection, Signalized AADT/lane for Major Road < 7500 Total number Intersections Included - 5

264
Total Number Mean Crashes Standard 85th 90th 95th
Crashes Per Year* Per IntersectionPer Year Deviation** Percentile Percentile Percentile
Collision Type Rear End 27 3.38 6.20 3.9 8.3 13.3Head On 0 0.00 0.00 0.0 0.0 0.0Angle 7 0.92 1.27 2.3 2.6 3.0Left Turn 2 0.29 0.38 0.7 0.8 0.9Right Turn 1 0.08 0.15 0.3 0.3 0.3Sideswipe 3 0.42 0.53 1.0 1.1 1.2Pedestrian/Bicycle 1 0.13 0.17 0.3 0.3 0.3Other 2 0.25 0.58 0.3 0.7 1.2
Severity PDO Crashes 22 2.71 4.03 3.6 6.2 9.1Injury 16 2.00 3.49 2.6 5.0 7.7Non-Incapacitating Injury 5 0.63 0.93 1.0 1.5 2.1Incapacitating Injury 1 0.13 0.25 0.3 0.4 0.6Fatal Crashes 0 0.04 0.12 0.0 0.1 0.2
Light Conditions Daylight 26 3.21 4.25 4.6 7.1 9.9Dusk 0 0.04 0.12 0.0 0.1 0.2Dawn 0 0.04 0.12 0.0 0.1 0.2Dark (w/street lights) 15 1.92 3.78 2.6 5.2 8.1Dark (wo/street lights) 2 0.21 0.47 0.3 0.6 1.0
Surface Condition Dry 37 4.58 7.60 5.0 10.3 16.5Wet 6 0.75 1.09 2.2 2.4 2.6Others 1 0.08 0.15 0.3 0.3 0.3
Month of year January 5 0.63 0.90 1.0 1.5 2.1February 4 0.54 0.73 1.0 1.3 1.7March 5 0.58 1.27 0.7 1.6 2.6April 5 0.58 1.08 1.3 1.8 2.4May 4 0.46 0.92 0.7 1.3 2.0June 4 0.46 0.67 0.7 1.1 1.5July 3 0.38 0.70 0.7 1.1 1.5August 3 0.38 0.52 1.0 1.0 1.0September 2 0.25 0.39 0.7 0.8 0.9October 2 0.25 0.39 0.7 0.8 0.9November 3 0.33 0.59 0.7 1.0 1.3December 5 0.63 1.06 1.3 1.8 2.4
Day of week Monday 5 0.63 0.98 1.3 1.7 2.2Tuesday 5 0.58 1.14 0.7 1.5 2.4Wednesday 6 0.75 1.19 1.6 2.2 2.8Thursday 6 0.79 1.59 0.7 1.9 3.3Friday 7 0.92 1.37 1.3 2.1 3.1Saturday 9 1.08 1.67 1.3 2.4 3.7Sunday 6 0.71 0.95 1.3 1.7 2.2
Hour of day 00:00 - 06:00 4 0.54 1.28 0.6 1.6 2.606:01 - 09:00 4 0.54 0.69 1.0 1.3 1.709:01 - 11:00 2 0.29 0.60 0.6 1.0 1.311:01 - 13:00 4 0.54 1.04 0.7 1.4 2.213:01 - 15:00 4 0.54 0.91 0.7 1.3 2.015:01 - 18:00 8 1.04 1.16 2.3 2.5 2.818:01 - 24:00 13 1.67 3.19 2.0 4.2 6.8
* Crashes averaged for years 1999, 2000 and 2001 long forms only.** Standard Deviation column represents the standard deviation for mean crashes per year per intersection.
CATEGORY 11EXPECTED ANNUAL ACCIDENT TABLE - SEMINOLE COUNTY
6 Lane x 4 Lane and 6 Lane x 6 Lane Intersection, SignalizedTotal number Intersections Included - 8
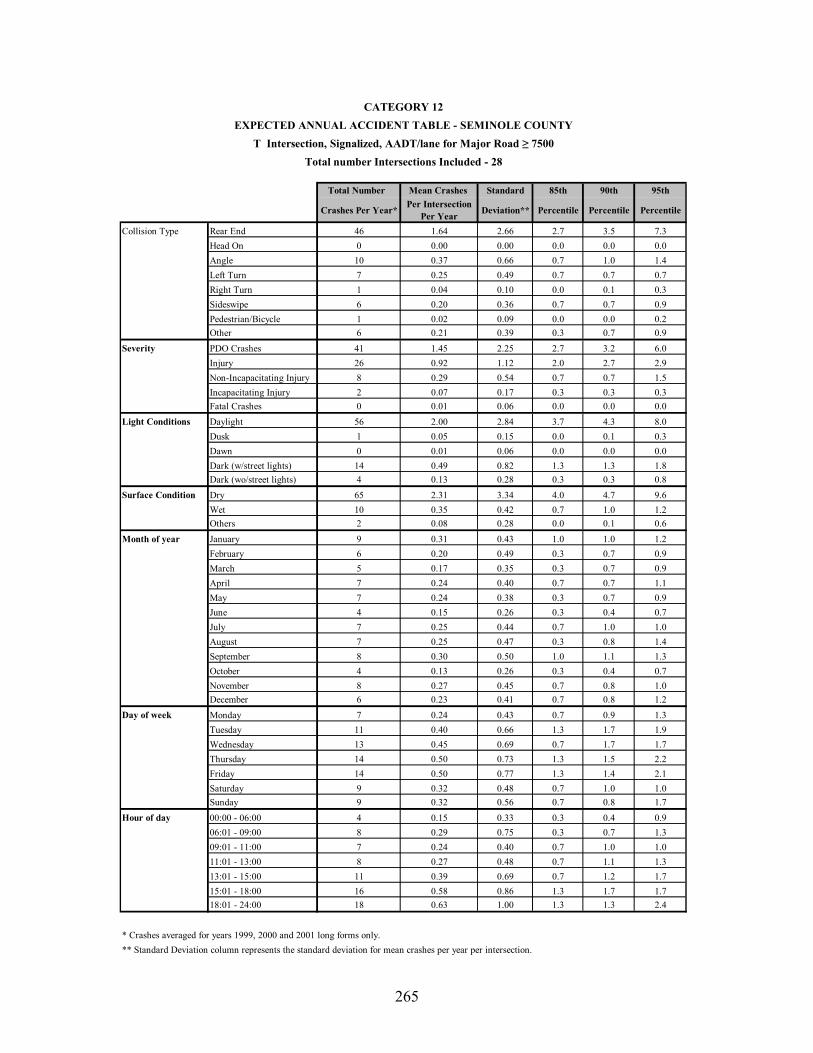
265
Total Number Mean Crashes Standard 85th 90th 95th
Crashes Per Year* Per IntersectionPer Year Deviation** Percentile Percentile Percentile
Collision Type Rear End 46 1.64 2.66 2.7 3.5 7.3Head On 0 0.00 0.00 0.0 0.0 0.0Angle 10 0.37 0.66 0.7 1.0 1.4Left Turn 7 0.25 0.49 0.7 0.7 0.7Right Turn 1 0.04 0.10 0.0 0.1 0.3Sideswipe 6 0.20 0.36 0.7 0.7 0.9Pedestrian/Bicycle 1 0.02 0.09 0.0 0.0 0.2Other 6 0.21 0.39 0.3 0.7 0.9
Severity PDO Crashes 41 1.45 2.25 2.7 3.2 6.0Injury 26 0.92 1.12 2.0 2.7 2.9Non-Incapacitating Injury 8 0.29 0.54 0.7 0.7 1.5Incapacitating Injury 2 0.07 0.17 0.3 0.3 0.3Fatal Crashes 0 0.01 0.06 0.0 0.0 0.0
Light Conditions Daylight 56 2.00 2.84 3.7 4.3 8.0Dusk 1 0.05 0.15 0.0 0.1 0.3Dawn 0 0.01 0.06 0.0 0.0 0.0Dark (w/street lights) 14 0.49 0.82 1.3 1.3 1.8Dark (wo/street lights) 4 0.13 0.28 0.3 0.3 0.8
Surface Condition Dry 65 2.31 3.34 4.0 4.7 9.6Wet 10 0.35 0.42 0.7 1.0 1.2Others 2 0.08 0.28 0.0 0.1 0.6
Month of year January 9 0.31 0.43 1.0 1.0 1.2February 6 0.20 0.49 0.3 0.7 0.9March 5 0.17 0.35 0.3 0.7 0.9April 7 0.24 0.40 0.7 0.7 1.1May 7 0.24 0.38 0.3 0.7 0.9June 4 0.15 0.26 0.3 0.4 0.7July 7 0.25 0.44 0.7 1.0 1.0August 7 0.25 0.47 0.3 0.8 1.4September 8 0.30 0.50 1.0 1.1 1.3October 4 0.13 0.26 0.3 0.4 0.7November 8 0.27 0.45 0.7 0.8 1.0December 6 0.23 0.41 0.7 0.8 1.2
Day of week Monday 7 0.24 0.43 0.7 0.9 1.3Tuesday 11 0.40 0.66 1.3 1.7 1.9Wednesday 13 0.45 0.69 0.7 1.7 1.7Thursday 14 0.50 0.73 1.3 1.5 2.2Friday 14 0.50 0.77 1.3 1.4 2.1Saturday 9 0.32 0.48 0.7 1.0 1.0Sunday 9 0.32 0.56 0.7 0.8 1.7
Hour of day 00:00 - 06:00 4 0.15 0.33 0.3 0.4 0.906:01 - 09:00 8 0.29 0.75 0.3 0.7 1.309:01 - 11:00 7 0.24 0.40 0.7 1.0 1.011:01 - 13:00 8 0.27 0.48 0.7 1.1 1.313:01 - 15:00 11 0.39 0.69 0.7 1.2 1.715:01 - 18:00 16 0.58 0.86 1.3 1.7 1.718:01 - 24:00 18 0.63 1.00 1.3 1.3 2.4
* Crashes averaged for years 1999, 2000 and 2001 long forms only.** Standard Deviation column represents the standard deviation for mean crashes per year per intersection.
CATEGORY 12EXPECTED ANNUAL ACCIDENT TABLE - SEMINOLE COUNTY
T Intersection, Signalized, AADT/lane for Major Road ≥ 7500Total number Intersections Included - 28

266
Total Number Mean Crashes Standard 85th 90th 95th
Crashes Per Year* Per IntersectionPer Year Deviation** Percentile Percentile Percentile
Collision Type Rear End 15 0.54 0.61 1.0 1.0 1.4Head On 1 0.04 0.10 0.0 0.1 0.3Angle 11 0.40 0.67 0.7 0.8 1.7Left Turn 6 0.23 0.35 0.7 0.8 1.0Right Turn 1 0.04 0.14 0.0 0.0 0.2Sideswipe 1 0.05 0.12 0.0 0.3 0.3Pedestrian/Bicycle 1 0.04 0.10 0.0 0.1 0.3Other 2 0.06 0.13 0.3 0.3 0.3
Severity PDO Crashes 18 0.64 0.85 1.3 1.8 2.0Injury 11 0.40 0.43 1.0 1.0 1.2Non-Incapacitating Injury 7 0.24 0.37 0.7 0.7 0.7Incapacitating Injury 2 0.08 0.20 0.3 0.3 0.6Fatal Crashes 0 0.01 0.06 0.0 0.0 0.0
Light Conditions Daylight 27 0.95 1.11 1.7 2.0 2.7Dusk 1 0.02 0.09 0.0 0.0 0.2Dawn 1 0.02 0.09 0.0 0.0 0.2Dark (w/street lights) 8 0.27 0.39 0.7 0.7 0.9Dark (wo/street lights) 2 0.07 0.21 0.0 0.3 0.3
Surface Condition Dry 32 1.15 1.37 2.0 2.4 3.3Wet 5 0.19 0.28 0.3 0.7 0.7Others 1 0.04 0.14 0.0 0.0 0.2
Month of year January 5 0.19 0.39 0.3 0.7 0.9February 3 0.12 0.21 0.3 0.3 0.6March 2 0.07 0.21 0.0 0.3 0.3April 1 0.02 0.09 0.0 0.0 0.2May 3 0.12 0.21 0.3 0.3 0.6June 3 0.12 0.21 0.3 0.3 0.6July 3 0.10 0.20 0.3 0.3 0.6August 5 0.18 0.26 0.3 0.4 0.7September 4 0.15 0.26 0.3 0.4 0.7October 3 0.10 0.18 0.3 0.3 0.3November 3 0.10 0.18 0.3 0.3 0.3December 3 0.12 0.24 0.3 0.3 0.6
Day of week Monday 4 0.13 0.40 0.3 0.3 0.6Tuesday 5 0.17 0.21 0.3 0.3 0.6Wednesday 5 0.19 0.32 0.3 0.5 1.0Thursday 7 0.25 0.38 0.7 0.8 1.0Friday 6 0.20 0.28 0.3 0.7 0.7Saturday 5 0.19 0.40 0.3 0.3 0.6Sunday 7 0.25 0.40 0.7 1.0 1.0
Hour of day 00:00 - 06:00 2 0.08 0.17 0.3 0.3 0.306:01 - 09:00 4 0.15 0.26 0.3 0.4 0.709:01 - 11:00 3 0.11 0.18 0.3 0.3 0.311:01 - 13:00 5 0.19 0.26 0.7 0.7 0.713:01 - 15:00 5 0.17 0.29 0.3 0.4 0.915:01 - 18:00 9 0.31 0.50 0.7 0.9 1.318:01 - 24:00 9 0.33 0.42 0.7 0.8 1.2
* Crashes averaged for years 1999, 2000 and 2001 long forms only.** Standard Deviation column represents the standard deviation for mean crashes per year per intersection.
CATEGORY 13EXPECTED ANNUAL ACCIDENT TABLE - SEMINOLE COUNTY
T Intersection, Signalized, AADT/lane for Major Road < 7500Total number Intersections Included - 28

267
APPENDIX G 19 CATEGORY CRASH PROFILE TABLES FOR THE COMBINED
DATABASE

268
Collision Type Rear End 161 1.41 2.16 3.00 3.50 4.00Head On 10 0.08 0.22 0.00 0.50 0.50Angle 85 0.75 1.01 1.50 2.35 3.00Left Turn 93 0.81 1.15 2.00 2.00 2.68Right Turn 13 0.11 0.25 0.50 0.50 0.50Sideswipe 28 0.25 0.60 0.50 0.50 1.35Pedestrian/Bicycle 8 0.07 0.18 0.00 0.50 0.50Other 41 0.36 0.74 0.50 1.00 1.50
Severity No Injury 203 1.78 0.35 3.53 4.50 5.35Possible Injury 90 0.79 0.00 1.50 2.00 2.50Non-Incapacitating Injury 59 0.52 0.00 1.00 1.50 2.18Incapacitating Injury 17 0.14 0.00 0.50 0.50 0.50Fatal Crashes 2 0.01 0.00 0.00 0.00 0.00
Light Conditions Daylight 286 2.50 2.89 5.00 6.35 7.00Dusk 12 0.10 0.26 0.50 0.50 0.50Dawn 6 0.05 0.17 0.00 0.00 0.50Dark (w/street lights) 107 0.94 1.60 2.00 2.35 4.68Dark (wo/street lights) 24 0.21 0.43 0.50 1.00 1.00
Surface Condition Dry 373 3.27 3.69 6.50 7.35 11.50Wet 54 0.47 0.81 1.00 1.50 2.00Slippery 3 0.02 0.10 0.00 0.00 0.00Others 2 0.01 0.08 0.00 0.00 0.00
Month of year January 36 0.32 0.52 0.50 1.00 1.18February 31 0.27 0.49 0.50 1.00 1.00March 41 0.36 0.60 1.00 1.00 1.50April 37 0.32 0.54 0.50 1.00 1.50May 33 0.29 0.47 0.52 1.00 1.00June 38 0.33 0.55 0.50 1.00 1.18July 36 0.32 0.58 1.00 1.00 1.50August 45 0.39 0.63 1.00 1.00 1.50September 35 0.30 0.46 0.50 1.00 1.00October 31 0.27 0.48 0.50 0.50 1.00November 35 0.30 0.57 0.50 1.00 1.50December 42 0.36 0.55 1.00 1.00 1.50
Day of week Monday 54 0.47 0.65 1.00 1.35 1.68Tuesday 67 0.59 0.78 1.50 1.50 2.00Wednesday 63 0.55 0.74 1.00 1.50 1.68Thursday 58 0.50 0.78 1.00 1.50 2.00Friday 67 0.59 0.91 1.50 1.50 2.18Saturday 65 0.57 0.93 1.00 1.85 2.50Sunday 63 0.55 0.84 1.50 1.85 2.50
Hour of day 00:00 - 06:00 40 0.35 0.63 0.50 1.00 1.5006:01 - 09:00 42 0.36 0.56 1.00 1.00 1.5009:01 - 11:00 24 0.21 0.40 0.50 0.50 1.0011:01 - 13:00 41 0.36 0.61 1.00 1.00 1.6813:01 - 15:00 41 0.36 0.51 1.00 1.00 1.1815:01 - 18:00 89 0.78 1.02 1.50 1.85 2.5018:01 - 24:00 106 0.93 1.29 2.00 2.50 3.50
Note: 1. Crashes extracted from years 2000 and 2001 for Brevard, City of Orlando, Hillsborough, Miami-Dade, and Seminole, and years 1999 and 2000 for Orange County. 2. Crashes represent only long forms. 3. Standard Deviation, 85th, 90th, and 95th Percentiles represent crash statistics per year per intersection.
85th Percentile 90th Percentile 95th Percentile
CATEGORY 1
EXPECTED ANNUAL ACCIDENT VALUE TABLE FOR SIX COUNTIES
2 Lane x 2 Lane Intersection, Signalized, AADT/lane for Major Road >= 5000
Total Number of Intersections -114
Number of crashes per year
Mean crashes per intersection per
year
Standard Deviation

269
Collision Type Rear End 33 0.54 0.87 1.00 2.00 2.00Head On 3 0.05 0.18 0.00 0.00 0.50Angle 34 0.56 0.76 1.00 1.50 2.00Left Turn 25 0.40 0.79 1.00 1.50 2.00Right Turn 2 0.03 0.12 0.00 0.00 0.50Sideswipe 3 0.05 0.18 0.00 0.00 0.50Pedestrian/Bicycle 3 0.04 0.14 0.00 0.00 0.50Other 8 0.13 0.34 0.50 0.50 0.50
Severity No Injury 56 0.92 1.29 2.50 3.00 3.50Possible Injury 19 0.31 0.46 1.00 1.00 1.50Non-Incapacitating Injury 23 0.38 0.48 1.00 1.00 1.00Incapacitating Injury 4 0.07 0.19 0.00 0.50 0.50Fatal Crashes 1 0.01 0.06 0.00 0.00 0.00
Light Conditions Daylight 74 1.21 1.50 3.00 3.50 4.50Dusk 3 0.04 0.14 0.00 0.00 0.50Dawn 2 0.03 0.12 0.00 0.00 0.50Dark (w/street lights) 23 0.37 0.64 1.00 1.50 1.50Dark (wo/street lights) 9 0.15 0.32 0.50 0.50 1.00
Surface Condition Dry 95 1.56 1.83 3.50 4.00 6.00Wet 14 0.22 0.37 0.50 1.00 1.00Slippery 2 0.02 0.11 0.00 0.00 0.00Others 0 0.00 0.00 0.00 0.00 0.00
Month of year January 12 0.19 0.36 0.50 0.50 0.50February 9 0.14 0.28 0.50 0.50 0.50March 8 0.13 0.30 0.50 0.50 0.50April 9 0.14 0.32 0.50 0.50 0.50May 12 0.19 0.36 0.50 0.50 1.00June 9 0.14 0.28 0.50 0.50 0.50July 6 0.09 0.21 0.50 0.50 0.50August 17 0.27 0.47 1.00 1.00 1.50September 10 0.16 0.32 0.50 0.50 1.00October 9 0.15 0.32 0.50 0.50 0.50November 6 0.09 0.23 0.00 0.50 0.50December 8 0.12 0.30 0.50 0.50 0.50
Day of week Monday 16 0.26 0.50 0.50 1.00 1.50Tuesday 16 0.26 0.45 0.50 1.00 1.00Wednesday 16 0.25 0.39 0.50 1.00 1.00Thursday 18 0.30 0.43 0.50 1.00 1.00Friday 14 0.23 0.41 0.50 1.00 1.00Saturday 12 0.19 0.37 0.50 0.50 1.00Sunday 19 0.31 0.48 0.50 1.00 1.00
Hour of day 00:00 - 06:00 9 0.14 0.38 0.50 0.50 0.5006:01 - 09:00 11 0.18 0.33 0.50 0.50 1.0009:01 - 11:00 9 0.14 0.34 0.50 0.50 0.5011:01 - 13:00 9 0.14 0.34 0.50 0.50 0.5013:01 - 15:00 18 0.30 0.50 0.50 1.00 1.5015:01 - 18:00 25 0.40 0.62 1.00 1.50 1.5018:01 - 24:00 31 0.51 0.72 1.00 1.50 2.00
Note: 1. Crashes extracted from years 2000 and 2001 for Brevard, City of Orlando, Hillsborough, Miami-Dade, and Seminole, and years 1999 and 2000 for Orange County. 2. Crashes represent only long forms. 3. Standard Deviation, 85th, 90th, and 95th Percentiles represent crash statistics per year per intersection.
85th Percentile 90th Percentile 95th Percentile
CATEGORY 2
EXPECTED ANNUAL ACCIDENT VALUE TABLE FOR SIX COUNTIES
2 Lane x 2 Lane Intersection, Signalized, AADT/lane for Major Road < 5000
Total Number of Intersections -61
Number of crashes per year
Mean crashes per intersection per
year
Standard Deviation

270
Collision Type Rear End 260 2.95 3.20 5.50 7.50 8.00Head On 10 0.11 0.32 0.00 0.50 0.50Angle 165 1.87 1.97 3.50 5.15 6.00Left Turn 96 1.09 1.23 2.48 3.00 3.33Right Turn 25 0.28 0.51 0.50 1.00 1.33Sideswipe 67 0.76 1.08 1.50 2.00 2.50Pedestrian/Bicycle 21 0.23 0.43 0.50 1.00 1.00Other 88 0.99 1.54 1.98 2.50 4.15
Severity No Injury 270 3.06 3.52 6.50 8.00 9.83Possible Injury 135 1.53 1.48 3.00 3.00 4.65Non-Incapacitating Injury 84 0.95 1.09 1.98 2.50 3.00Incapacitating Injury 15 0.17 0.32 0.50 0.50 1.00Fatal Crashes 2 0.02 0.09 0.00 0.00 0.00
Light Conditions Daylight 495 5.62 5.40 11.43 12.30 15.83Dusk 27 0.30 0.47 0.50 1.00 1.00Dawn 4 0.05 0.16 0.00 0.00 0.50Dark (w/street lights) 168 1.91 2.57 4.00 4.50 5.83Dark (wo/street lights) 33 0.37 0.73 1.00 1.00 2.00
Surface Condition Dry 600 6.82 6.74 12.95 15.50 18.65Wet 101 1.14 1.20 2.50 2.50 3.50Slippery 1 0.01 0.07 0.00 0.00 0.00Others 9 0.10 0.31 0.00 0.50 0.50
Month of year January 53 0.60 0.71 1.50 1.50 2.00February 53 0.60 0.78 1.50 1.50 2.50March 60 0.68 0.81 1.50 2.00 2.00April 64 0.73 0.89 1.50 2.00 2.83May 65 0.74 0.96 1.50 2.00 2.50June 59 0.66 0.82 1.50 2.00 2.33July 73 0.83 1.06 1.50 2.00 2.50August 64 0.73 0.84 1.50 2.00 2.50September 59 0.66 0.97 1.48 2.00 2.83October 63 0.71 0.90 1.50 1.50 2.50November 60 0.68 0.83 1.50 1.50 2.00December 58 0.65 0.84 1.00 1.50 2.00
Day of week Monday 96 1.09 1.20 2.00 2.65 3.50Tuesday 99 1.12 1.11 2.48 3.00 3.50Wednesday 101 1.14 1.45 2.00 2.65 5.00Thursday 108 1.22 1.15 2.00 3.00 3.50Friday 116 1.31 1.49 2.00 2.50 3.83Saturday 115 1.31 1.45 3.00 3.00 3.50Sunday 95 1.08 1.58 2.00 2.50 3.33
Hour of day 00:00 - 06:00 58 0.65 1.02 1.48 1.50 2.3306:01 - 09:00 47 0.53 0.70 1.00 1.50 1.5009:01 - 11:00 37 0.41 0.60 1.00 1.00 1.6511:01 - 13:00 47 0.53 0.60 1.00 1.15 2.0013:01 - 15:00 56 0.64 0.67 1.50 1.50 2.0015:01 - 18:00 126 1.43 1.37 2.98 3.50 4.0018:01 - 24:00 140 1.59 1.62 3.00 3.65 4.33
Note: 1. Crashes extracted from years 2000 and 2001 for Brevard, City of Orlando, Hillsborough, Miami-Dade, and Seminole, and years 1999 and 2000 for Orange County. 2. Crashes represent only long forms. 3. Standard Deviation, 85th, 90th, and 95th Percentiles represent crash statistics per year per intersection.
CATEGORY 3
EXPECTED ANNUAL ACCIDENT VALUE TABLE FOR SIX COUNTIES
4 Lane x 2 Lane Intersection, Signalized, AADT/lane for Major Road >= 7000 , LTL <=2
Total Number of Intersections - 88
90th Percentile 95th PercentileNumber of crashes per year
Mean crashes per intersection per
year
Standard Deviation 85th Percentile
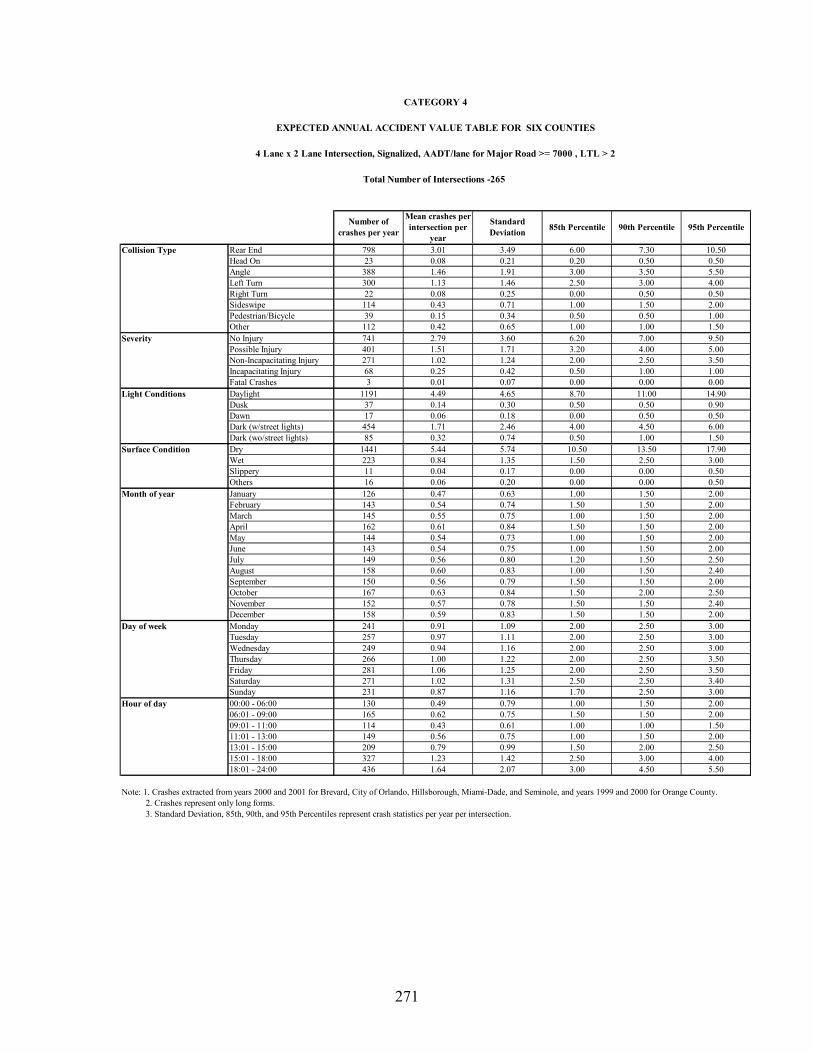
271
Collision Type Rear End 798 3.01 3.49 6.00 7.30 10.50Head On 23 0.08 0.21 0.20 0.50 0.50Angle 388 1.46 1.91 3.00 3.50 5.50Left Turn 300 1.13 1.46 2.50 3.00 4.00Right Turn 22 0.08 0.25 0.00 0.50 0.50Sideswipe 114 0.43 0.71 1.00 1.50 2.00Pedestrian/Bicycle 39 0.15 0.34 0.50 0.50 1.00Other 112 0.42 0.65 1.00 1.00 1.50
Severity No Injury 741 2.79 3.60 6.20 7.00 9.50Possible Injury 401 1.51 1.71 3.20 4.00 5.00Non-Incapacitating Injury 271 1.02 1.24 2.00 2.50 3.50Incapacitating Injury 68 0.25 0.42 0.50 1.00 1.00Fatal Crashes 3 0.01 0.07 0.00 0.00 0.00
Light Conditions Daylight 1191 4.49 4.65 8.70 11.00 14.90Dusk 37 0.14 0.30 0.50 0.50 0.90Dawn 17 0.06 0.18 0.00 0.50 0.50Dark (w/street lights) 454 1.71 2.46 4.00 4.50 6.00Dark (wo/street lights) 85 0.32 0.74 0.50 1.00 1.50
Surface Condition Dry 1441 5.44 5.74 10.50 13.50 17.90Wet 223 0.84 1.35 1.50 2.50 3.00Slippery 11 0.04 0.17 0.00 0.00 0.50Others 16 0.06 0.20 0.00 0.00 0.50
Month of year January 126 0.47 0.63 1.00 1.50 2.00February 143 0.54 0.74 1.50 1.50 2.00March 145 0.55 0.75 1.00 1.50 2.00April 162 0.61 0.84 1.50 1.50 2.00May 144 0.54 0.73 1.00 1.50 2.00June 143 0.54 0.75 1.00 1.50 2.00July 149 0.56 0.80 1.20 1.50 2.50August 158 0.60 0.83 1.00 1.50 2.40September 150 0.56 0.79 1.50 1.50 2.00October 167 0.63 0.84 1.50 2.00 2.50November 152 0.57 0.78 1.50 1.50 2.40December 158 0.59 0.83 1.50 1.50 2.00
Day of week Monday 241 0.91 1.09 2.00 2.50 3.00Tuesday 257 0.97 1.11 2.00 2.50 3.00Wednesday 249 0.94 1.16 2.00 2.50 3.00Thursday 266 1.00 1.22 2.00 2.50 3.50Friday 281 1.06 1.25 2.00 2.50 3.50Saturday 271 1.02 1.31 2.50 2.50 3.40Sunday 231 0.87 1.16 1.70 2.50 3.00
Hour of day 00:00 - 06:00 130 0.49 0.79 1.00 1.50 2.0006:01 - 09:00 165 0.62 0.75 1.50 1.50 2.0009:01 - 11:00 114 0.43 0.61 1.00 1.00 1.5011:01 - 13:00 149 0.56 0.75 1.00 1.50 2.0013:01 - 15:00 209 0.79 0.99 1.50 2.00 2.5015:01 - 18:00 327 1.23 1.42 2.50 3.00 4.0018:01 - 24:00 436 1.64 2.07 3.00 4.50 5.50
Note: 1. Crashes extracted from years 2000 and 2001 for Brevard, City of Orlando, Hillsborough, Miami-Dade, and Seminole, and years 1999 and 2000 for Orange County. 2. Crashes represent only long forms. 3. Standard Deviation, 85th, 90th, and 95th Percentiles represent crash statistics per year per intersection.
CATEGORY 4
EXPECTED ANNUAL ACCIDENT VALUE TABLE FOR SIX COUNTIES
4 Lane x 2 Lane Intersection, Signalized, AADT/lane for Major Road >= 7000 , LTL > 2
Total Number of Intersections -265
Number of crashes per year
Mean crashes per intersection per
year
Standard Deviation 85th Percentile 90th Percentile 95th Percentile

272
Collision Type Rear End 51 1.00 1.24 2.00 2.50 3.75Head On 4 0.08 0.25 0.00 0.50 0.50Angle 61 1.20 1.84 2.50 3.50 4.75Left Turn 30 0.59 0.91 1.25 1.50 2.50Right Turn 6 0.11 0.31 0.00 0.50 0.75Sideswipe 18 0.35 0.69 0.50 1.00 1.25Pedestrian/Bicycle 2 0.03 0.12 0.00 0.00 0.25Other 18 0.34 0.60 0.50 1.00 1.25
Severity No Injury 74 1.45 2.03 3.50 5.00 6.00Possible Injury 41 0.79 1.02 2.00 2.50 3.00Non-Incapacitating Injury 27 0.53 0.81 1.00 1.50 1.75Incapacitating Injury 7 0.13 0.24 0.50 0.50 0.50Fatal Crashes 1 0.01 0.07 0.00 0.00 0.00
Light Conditions Daylight 118 2.31 2.77 4.75 5.00 9.25Dusk 6 0.12 0.24 0.50 0.50 0.50Dawn 3 0.06 0.16 0.00 0.50 0.50Dark (w/street lights) 50 0.97 1.57 1.75 3.00 4.00Dark (wo/street lights) 9 0.18 0.41 0.50 0.50 1.25
Surface Condition Dry 152 2.98 3.65 6.50 7.50 10.00Wet 30 0.59 0.85 1.75 2.00 2.00Slippery 0 0.00 0.00 0.00 0.00 0.00Others 4 0.07 0.22 0.00 0.00 0.50
Month of year January 16 0.31 0.52 0.75 1.00 1.25February 15 0.28 0.43 0.50 1.00 1.00March 18 0.34 0.64 1.00 1.00 1.75April 16 0.30 0.51 0.75 1.00 1.25May 18 0.35 0.63 0.75 1.00 1.50June 17 0.32 0.54 1.00 1.00 1.50July 14 0.27 0.49 0.50 1.00 1.50August 15 0.29 0.41 1.00 1.00 1.00September 16 0.30 0.43 0.75 1.00 1.00October 17 0.33 0.52 1.00 1.00 1.00November 15 0.29 0.41 0.50 1.00 1.00December 14 0.27 0.46 0.50 1.00 1.25
Day of week Monday 31 0.60 0.82 1.00 1.50 2.25Tuesday 24 0.46 0.74 1.00 1.50 2.00Wednesday 21 0.41 0.54 0.75 1.00 1.75Thursday 31 0.60 0.84 1.25 2.00 2.00Friday 31 0.60 0.81 1.50 2.00 2.25Saturday 23 0.45 0.81 1.00 1.00 1.50Sunday 30 0.58 1.01 1.00 1.50 2.75
Hour of day 00:00 - 06:00 14 0.26 0.49 0.50 1.00 1.2506:01 - 09:00 24 0.46 0.67 1.00 1.50 2.0009:01 - 11:00 11 0.21 0.35 0.50 0.50 1.0011:01 - 13:00 11 0.22 0.36 0.50 0.50 1.0013:01 - 15:00 18 0.35 0.52 1.00 1.00 1.2515:01 - 18:00 30 0.58 0.84 1.50 1.50 2.2518:01 - 24:00 46 0.89 1.23 2.00 2.50 3.50
Note: 1. Crashes extracted from years 2000 and 2001 for Brevard, City of Orlando, Hillsborough, Miami-Dade, and Seminole, and years 1999 and 2000 for Orange County. 2. Crashes represent only long forms. 3. Standard Deviation, 85th, 90th, and 95th Percentiles represent crash statistics per year per intersection.
CATEGORY 5
EXPECTED ANNUAL ACCIDENT VALUE TABLE FOR SIX COUNTIES
4 Lane x 2 Lane Intersection, Signalized, AADT/lane for Major Road <7000 ,LTL <=2
Total Number of Intersections -51
Number of crashes per year
Mean crashes per intersection per
year
Standard Deviation 85th Percentile 90th Percentile 95th Percentile

273
Collision Type Rear End 174 1.28 1.75 2.50 3.00 4.00Head On 12 0.08 0.25 0.00 0.50 0.50Angle 157 1.15 1.87 2.38 2.75 4.00Left Turn 111 0.82 1.22 1.50 2.50 3.00Right Turn 7 0.05 0.18 0.00 0.00 0.50Sideswipe 24 0.17 0.44 0.50 0.50 1.00Pedestrian/Bicycle 14 0.10 0.30 0.00 0.50 0.50Other 43 0.31 0.61 0.50 1.00 1.50
Severity No Injury 214 1.57 0.11 3.00 3.75 5.63Possible Injury 127 0.93 2.39 1.50 2.00 3.00Non-Incapacitating Injury 90 0.66 1.34 1.50 1.50 2.00Incapacitating Injury 29 0.21 0.80 0.50 0.75 1.00Fatal Crashes 1 0.01 0.42 0.00 0.00 0.00
Light Conditions Daylight 4 0.03 3.40 0.00 0.00 0.13Dusk 357 2.63 0.28 5.00 6.25 7.13Dawn 20 0.14 0.15 0.50 0.50 0.50Dark (w/street lights) 6 0.04 1.74 0.00 0.00 0.50Dark (wo/street lights) 119 0.87 0.53 1.50 2.00 2.50
Surface Condition Dry 439 3.23 4.19 5.88 7.00 9.50Wet 77 0.56 1.09 1.00 1.00 2.00Slippery 4 0.03 0.13 0.00 0.00 0.00Others 6 0.04 0.20 0.00 0.00 0.50
Month of year January 54 0.39 0.73 1.00 1.00 1.50February 40 0.29 0.51 0.50 1.00 1.00March 50 0.37 0.63 1.00 1.00 1.50April 35 0.25 0.51 0.50 0.75 1.00May 40 0.29 0.60 0.50 1.00 1.50June 43 0.31 0.46 1.00 1.00 1.00July 48 0.35 0.63 1.00 1.00 1.50August 47 0.34 0.67 0.50 1.00 1.00September 47 0.35 0.54 1.00 1.00 1.13October 48 0.35 0.48 1.00 1.00 1.13November 45 0.33 0.57 0.50 1.00 1.13December 46 0.33 0.75 0.50 1.00 1.13
Day of week Monday 73 0.53 0.77 1.00 1.50 2.00Tuesday 72 0.53 0.81 1.00 1.50 2.00Wednesday 76 0.56 0.82 1.00 1.50 2.00Thursday 77 0.56 0.83 1.00 1.50 2.00Friday 80 0.59 0.94 1.00 1.50 2.13Saturday 79 0.58 1.00 1.00 1.50 2.00Sunday 85 0.62 1.05 1.50 1.50 2.63
Hour of day 00:00 - 06:00 38 0.28 0.60 0.50 1.00 1.0006:01 - 09:00 51 0.38 0.60 1.00 1.00 1.5009:01 - 11:00 37 0.27 0.46 0.50 1.00 1.0011:01 - 13:00 53 0.39 0.69 1.00 1.00 1.5013:01 - 15:00 57 0.42 0.56 1.00 1.50 1.5015:01 - 18:00 110 0.81 0.99 1.50 2.00 2.5018:01 - 24:00 134 0.98 1.40 1.50 2.25 3.50
Note: 1. Crashes extracted from years 2000 and 2001 for Brevard, City of Orlando, Hillsborough, Miami-Dade, and Seminole, and years 1999 and 2000 for Orange County. 2. Crashes represent only long forms. 3. Standard Deviation, 85th, 90th, and 95th Percentiles represent crash statistics per year per intersection.
CATEGORY 6
EXPECTED ANNUAL ACCIDENT VALUE TABLE FOR SIX COUNTIES
4 Lane x 2 Lane Intersection, Signalized, AADT/lane for Major Road <7000 ,LTL > 2
Total Number of Intersections -136
Number of crashes per year
Mean crashes per intersection per
year
Standard Deviation 85th Percentile 90th Percentile 95th Percentile

274
Collision Type Rear End 538 5.78 4.89 10.60 11.90 14.90Head On 14 0.15 0.36 0.50 0.50 0.70Angle 285 3.06 3.03 5.50 7.00 8.50Left Turn 195 2.09 2.09 4.00 4.00 6.00Right Turn 17 0.18 0.33 0.50 0.50 1.00Sideswipe 105 1.12 1.27 2.50 3.00 4.00Pedestrian/Bicycle 29 0.31 0.48 1.00 1.00 1.00Other 78 0.83 0.98 2.00 2.50 3.00
Severity No Injury 554 5.95 5.29 12.20 14.70 16.20Possible Injury 258 2.77 2.55 5.00 6.40 7.00Non-Incapacitating Injury 156 1.67 1.85 3.00 4.40 6.00Incapacitating Injury 46 0.49 0.59 1.00 1.50 2.00Fatal Crashes 2 0.02 0.10 0.00 0.00 0.00
Light Conditions Daylight 788 8.47 6.40 15.50 18.50 21.20Dusk 27 0.28 0.44 1.00 1.00 1.00Dawn 19 0.20 0.34 0.50 0.50 1.00Dark (w/street lights) 374 4.02 3.83 8.60 9.90 10.50Dark (wo/street lights) 47 0.51 0.91 1.50 1.50 2.20
Surface Condition Dry 1020 10.96 10.09 21.30 23.40 27.90Wet 163 1.75 1.71 3.50 3.50 4.00Slippery 5 0.05 0.15 0.00 0.00 0.50Others 16 0.17 0.42 0.50 0.50 1.00
Month of year January 82 0.88 0.90 1.50 2.00 3.00February 93 1.00 1.05 2.00 2.00 3.20March 94 1.01 1.05 2.50 2.50 3.00April 101 1.08 1.00 2.00 2.40 2.70May 106 1.13 1.10 2.10 2.50 3.00June 107 1.15 1.15 2.10 2.90 3.20July 105 1.12 1.08 2.00 2.50 3.00August 137 1.47 1.41 3.00 3.40 4.50September 107 1.15 1.06 2.00 2.50 3.00October 116 1.25 1.16 2.50 2.90 3.50November 105 1.13 1.07 2.10 3.00 3.00December 107 1.15 1.11 2.50 2.50 3.00
Day of week Monday 188 2.02 1.71 3.60 4.00 5.40Tuesday 185 1.98 1.71 4.00 4.40 5.50Wednesday 174 1.87 1.57 3.50 4.00 5.50Thursday 169 1.82 1.47 3.50 3.90 4.50Friday 198 2.12 1.92 4.50 4.90 5.70Saturday 171 1.83 1.71 3.50 4.00 5.50Sunday 174 1.87 1.67 3.50 4.00 5.00
Hour of day 00:00 - 06:00 143 1.54 1.62 3.10 3.50 4.4006:01 - 09:00 122 1.31 1.34 2.50 3.00 3.9009:01 - 11:00 87 0.94 0.93 2.00 2.00 2.5011:01 - 13:00 102 1.10 1.12 2.00 2.50 3.7013:01 - 15:00 107 1.15 1.18 2.10 2.50 3.0015:01 - 18:00 198 2.13 1.89 4.10 4.90 5.7018:01 - 24:00 296 3.18 2.86 6.00 6.50 7.50
Note: 1. Crashes extracted from years 2000 and 2001 for Brevard, City of Orlando, Hillsborough, Miami-Dade, and Seminole, and years 1999 and 2000 for Orange County. 2. Crashes represent only long forms. 3. Standard Deviation, 85th, 90th, and 95th Percentiles represent crash statistics per year per intersection.
CATEGORY 7
EXPECTED ANNUAL ACCIDENT VALUE TABLE FOR SIX COUNTIES
4 Lane x 4 Lane Intersection, Signalized, AADT/lane for Major Road >= 7,500
Total Number of Intersections- 93
Number of crashes per year
Mean crashes per intersection per
year
Standard Deviation 85th Percentile 90th Percentile 95th Percentile

275
Collision Type Rear End 211 3.19 3.69 5.50 7.50 2.38Head On 12 0.18 0.40 0.50 0.50 0.38Angle 179 2.70 3.55 4.63 5.50 1.75Left Turn 91 1.38 1.95 3.00 3.50 2.38Right Turn 15 0.23 0.54 0.50 0.50 0.38Sideswipe 59 0.89 2.52 1.63 2.00 0.50Pedestrian/Bicycle 18 0.27 0.54 0.50 0.75 1.25Other 60 0.90 1.28 1.50 2.25 1.00
Severity No Injury 233 3.52 4.26 7.13 9.50 0.75Possible Injury 134 2.02 2.28 3.50 4.00 4.25Non-Incapacitating Injury 77 1.17 1.68 2.00 2.50 0.88Incapacitating Injury 25 0.38 0.54 1.00 1.00 1.25Fatal Crashes 1 0.01 0.06 0.00 0.00 0.38
Light Conditions Daylight 444 6.73 8.31 13.13 15.25 3.00Dusk 14 0.20 0.52 0.50 0.50 0.38Dawn 5 0.08 0.20 0.00 0.50 0.00Dark (w/street lights) 143 2.17 2.99 3.63 5.25 2.63Dark (wo/street lights) 31 0.47 1.53 1.00 1.00 0.88
Surface Condition Dry 527 7.98 10.09 14.50 17.25 5.88Wet 84 1.27 1.71 2.13 3.00 0.88Slippery 2 0.03 0.15 0.00 0.00 0.00Others 13 0.20 0.42 0.50 0.75 0.00
Month of year January 50 0.75 0.99 1.50 1.75 1.00February 47 0.70 0.94 1.13 2.00 0.38March 52 0.78 1.14 1.63 2.00 0.50April 58 0.88 1.07 1.50 2.00 0.88May 50 0.76 1.13 1.50 1.75 0.88June 53 0.80 1.05 1.50 2.00 0.38July 56 0.84 1.39 1.50 2.25 0.88August 67 1.01 1.31 2.00 2.25 1.63September 60 0.90 1.17 1.50 2.25 1.25October 52 0.79 0.98 2.00 2.00 0.88November 44 0.66 1.08 1.50 1.50 0.50December 58 0.87 1.30 1.63 2.75 1.38
Day of week Monday 88 1.33 1.90 2.50 2.50 1.38Tuesday 88 1.33 2.02 2.50 2.75 0.88Wednesday 95 1.43 1.68 3.00 3.25 1.38Thursday 100 1.52 1.70 3.00 3.75 1.75Friday 96 1.45 1.97 2.50 3.25 1.88Saturday 102 1.55 2.10 3.00 4.25 1.63Sunday 75 1.13 1.44 2.00 3.00 0.88
Hour of day 00:00 - 06:00 38 0.57 0.68 1.50 1.75 0.7506:01 - 09:00 57 0.86 1.09 2.00 2.50 1.8809:01 - 11:00 35 0.52 0.65 1.00 1.00 1.0011:01 - 13:00 51 0.77 0.90 1.50 2.00 1.6313:01 - 15:00 54 0.81 1.04 2.00 2.25 0.8815:01 - 18:00 103 1.56 1.51 2.63 3.50 1.3818:01 - 24:00 140 2.11 2.61 3.63 4.25 2.38
Note: 1. Crashes extracted from years 2000 and 2001 for Brevard, City of Orlando, Hillsborough, Miami-Dade, and Seminole, and years 1999 and 2000 for Orange County. 2. Crashes represent only long forms. 3. Standard Deviation, 85th, 90th, and 95th Percentiles represent crash statistics per year per intersection.
CATEGORY 8
EXPECTED ANNUAL ACCIDENT VALUE TABLE FOR SIX COUNTIES
4 Lane x 4 Lane Intersection, Signalized, AADT/lane for Major Road < 7,500
Total Number of Intersections -66
Number of crashes per year
Mean crashes per intersection per
year
Standard Deviation 85th Percentile 90th Percentile 95th Percentile

276
Collision Type Rear End 494 4.84 4.11 9.00 10.00 11.98Head On 10 0.10 0.30 0.00 0.50 0.50Angle 194 1.90 1.69 3.50 4.00 5.00Left Turn 145 1.42 1.48 2.93 3.00 4.45Right Turn 16 0.15 0.31 0.50 0.50 0.50Sideswipe 90 0.88 1.02 1.93 2.00 2.97Pedestrian/Bicycle 27 0.26 0.44 0.50 1.00 1.00Other 69 0.67 0.79 1.43 1.50 2.00
Severity No Injury 438 4.29 4.03 7.50 8.00 11.98Possible Injury 230 2.25 1.69 3.50 4.45 5.00Non-Incapacitating Injury 146 1.43 1.10 2.50 3.00 3.50Incapacitating Injury 43 0.42 0.53 1.00 1.00 1.50Fatal Crashes 6 0.06 0.18 0.00 0.45 0.50
Light Conditions Daylight 725 7.11 5.45 10.93 12.45 16.00Dusk 19 0.18 0.38 0.50 0.50 0.97Dawn 9 0.08 0.20 0.42 0.50 0.50Dark (w/street lights) 260 2.55 2.40 5.43 5.95 7.00Dark (wo/street lights) 28 0.27 0.69 0.50 1.00 1.50
Surface Condition Dry 859 8.42 6.41 13.43 15.45 23.67Wet 145 1.42 1.54 2.93 3.50 4.00Slippery 6 0.05 0.20 0.00 0.00 0.50Others 6 0.06 0.20 0.00 0.00 0.50
Month of year January 80 0.78 0.75 1.50 2.00 2.00February 73 0.71 0.74 1.50 1.50 2.45March 85 0.83 0.79 1.50 2.00 2.47April 93 0.91 1.01 1.50 2.00 2.97May 84 0.82 0.82 1.50 2.00 2.50June 85 0.83 0.82 1.50 2.00 2.50July 92 0.90 0.92 2.00 2.50 2.50August 94 0.92 1.03 1.50 2.00 2.50September 87 0.85 0.94 1.50 2.00 2.97October 100 0.98 1.00 2.00 2.00 2.97November 89 0.87 0.93 1.50 2.00 2.97December 85 0.83 0.82 1.50 2.00 2.47
Day of week Monday 140 1.37 1.33 2.50 2.50 3.47Tuesday 157 1.54 1.20 2.50 3.00 3.50Wednesday 155 1.52 1.50 3.00 3.45 4.50Thursday 147 1.44 1.34 2.50 3.45 4.00Friday 163 1.60 1.38 3.00 3.00 4.00Saturday 154 1.51 1.31 2.50 3.00 3.50Sunday 127 1.25 1.15 2.50 3.00 3.95
Hour of day 00:00 - 06:00 82 0.80 0.96 1.93 2.00 2.9706:01 - 09:00 88 0.86 0.87 2.00 2.00 2.5009:01 - 11:00 79 0.77 0.85 1.50 2.00 2.0011:01 - 13:00 103 1.01 0.99 1.50 2.50 3.0013:01 - 15:00 115 1.12 1.24 2.00 2.50 4.0015:01 - 18:00 182 1.78 1.58 3.00 4.00 5.0018:01 - 24:00 224 2.20 1.91 4.00 4.50 6.45
Note: 1. Crashes extracted from years 2000 and 2001 for Brevard, City of Orlando, Hillsborough, Miami-Dade, and Seminole, and years 1999 and 2000 for Orange County. 2. Crashes represent only long forms. 3. Standard Deviation, 85th, 90th, and 95th Percentiles represent crash statistics per year per intersection.
CATEGORY 9
EXPECTED ANNUAL ACCIDENT VALUE TABLE FOR SIX COUNTIES
6 Lane x 2 Lane Intersection, Signalized, AADT/lane for Major Road >= 7,500
Total Number of Intersections -102
Number of crashes per year
Mean crashes per intersection per
year
Standard Deviation 85th Percentile 90th Percentile 95th Percentile

277
Collision Type Rear End 154 2.91 3.13 6.00 6.50 10.00Head On 5 0.09 0.24 0.10 0.50 0.50Angle 106 1.99 2.48 4.10 5.30 6.80Left Turn 68 1.27 1.68 3.50 3.90 4.70Right Turn 7 0.13 0.33 0.50 0.50 1.00Sideswipe 24 0.44 0.71 1.00 1.40 2.20Pedestrian/Bicycle 8 0.15 0.27 0.50 0.50 0.50Other 26 0.49 0.58 1.00 1.50 1.70
Severity No Injury 164 3.08 3.46 7.10 8.50 10.50Possible Injury 67 1.25 1.34 2.60 3.00 3.70Non-Incapacitating Injury 57 1.08 1.27 2.50 2.90 3.70Incapacitating Injury 15 0.28 0.42 0.50 1.00 1.00Fatal Crashes 2 0.03 0.12 0.00 0.00 0.20
Light Conditions Daylight 263 4.96 4.67 9.10 12.50 13.70Dusk 13 0.24 0.39 0.50 1.00 1.00Dawn 3 0.06 0.19 0.00 0.00 0.50Dark (w/street lights) 98 1.84 2.33 4.70 5.90 6.00Dark (wo/street lights) 17 0.32 0.58 0.60 1.00 1.70
Surface Condition Dry 326 6.14 6.16 13.70 14.90 18.70Wet 51 0.96 1.11 2.50 2.90 3.00Slippery 1 0.01 0.07 0.00 0.00 0.00Others 3 0.05 0.18 0.00 0.00 0.50
Month of year January 42 0.78 0.98 1.60 2.40 2.70February 31 0.58 0.73 1.10 1.50 2.20March 34 0.64 0.77 1.50 1.50 2.00April 37 0.69 0.83 1.50 1.50 2.50May 43 0.80 1.08 1.50 2.40 3.00June 31 0.58 0.78 1.10 1.50 2.20July 30 0.57 0.82 1.50 1.90 2.00August 40 0.75 1.01 1.60 2.40 2.70September 32 0.59 0.64 1.10 1.50 1.70October 23 0.42 0.62 1.00 1.40 1.50November 27 0.50 0.58 1.00 1.00 1.20December 30 0.57 0.81 1.10 1.50 2.50
Day of week Monday 52 0.97 1.04 2.00 2.00 3.20Tuesday 56 1.06 1.05 2.10 2.50 2.90Wednesday 55 1.03 1.35 1.60 2.50 3.20Thursday 60 1.13 1.36 2.10 2.90 4.00Friday 64 1.21 1.43 2.60 3.40 4.00Saturday 55 1.04 1.30 2.10 2.90 4.20Sunday 56 1.05 1.08 2.00 2.50 3.00
Hour of day 00:00 - 06:00 29 0.54 0.76 1.50 1.50 2.2006:01 - 09:00 35 0.65 0.85 1.50 1.50 2.5009:01 - 11:00 28 0.53 0.72 1.00 1.50 2.0011:01 - 13:00 30 0.57 0.79 1.50 1.50 2.0013:01 - 15:00 33 0.61 0.75 1.50 1.50 2.0015:01 - 18:00 74 1.39 1.47 2.50 3.00 3.9018:01 - 24:00 93 1.75 1.86 3.70 5.40 5.50
Note: 1. Crashes extracted from years 2000 and 2001 for Brevard, City of Orlando, Hillsborough, Miami-Dade, and Seminole, and years 1999 and 2000 for Orange County. 2. Crashes represent only long forms. 3. Standard Deviation, 85th, 90th, and 95th Percentiles represent crash statistics per year per intersection.
CATEGORY 10
EXPECTED ANNUAL ACCIDENT VALUE TABLE FOR SIX COUNTIES
6 Lane x 2 Lane Intersection, Signalized, AADT/lane for Major Road < 7,500
Total Number of Intersections -53
Number of crashes per year
Mean crashes per intersection per
year
Standard Deviation 85th Percentile 90th Percentile 95th Percentile

278
Collision Type Rear End 835 8.70 6.24 16.00 17.75 19.75Head On 21 0.22 0.40 0.50 0.50 1.00Angle 309 3.21 2.86 6.50 7.75 9.50Left Turn 245 2.55 2.75 5.00 6.25 7.50Right Turn 37 0.38 0.57 1.00 1.00 2.00Sideswipe 132 1.38 1.62 2.88 3.50 4.50Pedestrian/Bicycle 25 0.26 0.51 0.50 1.00 1.50Other 98 1.02 1.04 2.00 2.00 2.50
Severity No Injury 709 7.38 5.94 13.00 15.25 16.88Possible Injury 341 3.55 2.63 6.00 7.25 9.00Non-Incapacitating Injury 211 2.19 2.21 3.88 4.25 6.63Incapacitating Injury 48 0.50 0.57 1.00 1.00 1.50Fatal Crashes 5 0.05 0.15 0.00 0.00 0.50
Light Conditions Daylight 1075 11.19 7.59 19.00 22.00 23.63Dusk 41 0.43 0.59 1.00 1.50 1.50Dawn 21 0.21 0.43 0.50 0.75 1.00Dark (w/street lights) 468 4.87 4.28 8.88 10.75 13.38Dark (wo/street lights) 90 0.93 1.79 2.00 2.75 5.50
Surface Condition Dry 1364 14.20 9.67 25.00 26.75 29.50Wet 212 2.21 1.92 4.38 5.00 5.50Slippery 7 0.07 0.26 0.00 0.00 0.50Others 23 0.23 0.64 0.50 0.50 1.00
Month of year January 139 1.44 1.24 2.50 3.50 3.50February 140 1.45 1.29 2.50 3.50 4.00March 149 1.55 1.21 3.00 3.00 4.00April 129 1.34 1.18 2.50 3.00 3.25May 138 1.43 1.31 3.00 3.50 4.00June 137 1.42 1.30 2.50 3.50 4.00July 134 1.39 1.31 3.00 3.00 4.00August 156 1.63 1.35 3.00 3.50 4.00September 144 1.49 1.47 3.00 3.25 4.63October 158 1.64 1.53 3.38 3.50 4.50November 139 1.45 1.27 3.00 3.00 3.50December 142 1.47 1.34 3.00 3.00 4.13
Day of week Monday 240 2.49 1.88 4.50 5.00 6.00Tuesday 257 2.68 2.05 5.00 5.50 6.00Wednesday 248 2.58 1.90 4.50 5.00 6.00Thursday 233 2.43 2.09 5.00 5.00 5.63Friday 273 2.84 2.44 6.00 6.75 7.50Saturday 246 2.56 2.10 4.88 5.50 6.13Sunday 206 2.14 1.81 4.00 4.75 5.63
Hour of day 00:00 - 06:00 156 1.63 1.70 3.50 3.75 4.7506:01 - 09:00 141 1.46 1.23 2.50 3.00 3.5009:01 - 11:00 104 1.08 0.94 2.00 2.50 3.0011:01 - 13:00 136 1.42 1.17 2.50 3.00 3.5013:01 - 15:00 145 1.51 1.22 2.50 3.00 3.6315:01 - 18:00 271 2.82 2.16 5.50 5.50 6.1318:01 - 24:00 391 4.07 3.14 7.50 8.50 10.25
Note: 1. Crashes extracted from years 2000 and 2001 for Brevard, City of Orlando, Hillsborough, Miami-Dade, and Seminole, and years 1999 and 2000 for Orange County. 2. Crashes represent only long forms. 3. Standard Deviation, 85th, 90th, and 95th Percentiles represent crash statistics per year per intersection.
CATEGORY 11
EXPECTED ANNUAL ACCIDENT VALUE TABLE FOR SIX COUNTIES
6 x 4 and 6 x 6 Intersection, Signalized
Total Number of Intersections -96
Number of crashes per year
Mean crashes per intersection per
year
Standard Deviation 85th Percentile 90th Percentile 95th Percentile

279
Collision Type Rear End 307 2.60 3.63 4.23 7.00 10.68Head On 4 0.03 0.14 0.00 0.00 0.50Angle 104 0.88 1.68 1.50 2.00 3.50Left Turn 89 0.75 1.06 1.50 2.00 2.50Right Turn 8 0.07 0.18 0.00 0.50 0.50Sideswipe 53 0.44 0.75 1.00 1.15 2.00Pedestrian/Bicycle 15 0.12 0.38 0.50 0.50 0.50Other 58 0.49 0.78 1.00 1.50 2.18
Severity No Injury 268 2.27 2.71 4.50 6.00 9.18Possible Injury 138 1.17 1.20 2.50 3.00 3.50Non-Incapacitating Injury 84 0.71 0.94 1.50 2.00 2.68Incapacitating Injury 22 0.19 0.42 0.50 0.50 1.00Fatal Crashes 2 0.01 0.08 0.00 0.00 0.00
Light Conditions Daylight 436 3.69 4.51 7.23 9.50 13.53Dusk 22 0.18 0.33 0.50 0.50 1.00Dawn 5 0.04 0.15 0.00 0.00 0.50Dark (w/street lights) 143 1.21 1.93 2.50 3.50 5.35Dark (wo/street lights) 26 0.22 0.43 0.50 0.50 1.00
Surface Condition Dry 529 4.48 5.24 8.23 11.60 15.53Wet 90 0.76 1.27 1.50 2.00 3.85Slippery 5 0.04 0.17 0.00 0.00 0.50Others 10 0.08 0.25 0.00 0.50 0.67
Month of year January 51 0.43 0.62 1.00 1.50 1.68February 41 0.35 0.61 0.73 1.00 1.68March 54 0.45 0.66 1.00 1.15 2.00April 49 0.42 0.70 1.00 1.50 2.00May 59 0.50 0.77 1.00 1.50 2.00June 57 0.48 0.75 1.00 1.15 2.18July 52 0.44 0.66 1.00 1.15 1.85August 57 0.48 0.75 1.00 1.50 2.18September 57 0.48 0.70 1.00 1.50 2.00October 49 0.42 0.63 1.00 1.15 2.00November 54 0.45 0.75 1.00 1.50 2.00December 59 0.50 0.78 1.00 1.50 2.50
Day of week Monday 82 0.69 1.00 1.50 2.00 2.68Tuesday 93 0.78 1.06 1.50 2.00 2.68Wednesday 99 0.84 1.27 1.50 2.50 4.00Thursday 87 0.74 1.01 1.50 2.00 2.50Friday 101 0.86 1.00 1.50 2.00 3.18Saturday 97 0.82 1.23 1.73 2.50 3.68Sunday 77 0.65 0.96 1.50 1.65 3.00
Hour of day 00:00 - 06:00 50 0.42 0.77 1.00 1.00 1.5006:01 - 09:00 54 0.45 0.72 1.00 1.50 2.5009:01 - 11:00 38 0.32 0.49 1.00 1.00 1.1811:01 - 13:00 39 0.33 0.54 1.00 1.00 1.5013:01 - 15:00 73 0.61 0.85 1.00 1.50 2.5015:01 - 18:00 120 1.02 1.12 2.50 2.50 3.1818:01 - 24:00 145 1.23 1.45 2.73 3.15 5.00
Note: 1. Crashes extracted from years 2000 and 2001 for Brevard, City of Orlando, Hillsborough, Miami-Dade, and Seminole, and years 1999 and 2000 for Orange County. 2. Crashes represent only long forms. 3. Standard Deviation, 85th, 90th, and 95th Percentiles represent crash statistics per year per intersection.
CATEGORY 12
EXPECTED ANNUAL ACCIDENT VALUE TABLE FOR SIX COUNTIES
T Intersection , Signalized, AADT/lane for Major Road >= 7,500
Total Number of Intersections -118
Number of crashes per year
Mean crashes per intersection per
year
Standard Deviation 85th Percentile 90th Percentile 95th Percentile

280
Collision Type Rear End 131 1.06 1.43 2.00 2.85 4.43Head On 4 0.03 0.12 0.00 0.00 0.42Angle 48 0.39 0.66 1.00 1.00 1.93Left Turn 49 0.39 0.77 1.00 1.00 1.50Right Turn 7 0.06 0.23 0.00 0.00 0.50Sideswipe 15 0.12 0.31 0.50 0.50 0.50Pedestrian/Bicycle 5 0.04 0.17 0.00 0.00 0.42Other 27 0.22 0.47 0.50 0.50 1.00
Severity No Injury 122 0.98 1.54 2.00 2.00 3.00Possible Injury 65 0.52 0.74 1.00 1.50 2.00Non-Incapacitating Injury 47 0.38 0.55 1.00 1.00 1.50Incapacitating Injury 16 0.13 0.29 0.50 0.50 0.92Fatal Crashes 2 0.01 0.08 0.00 0.00 0.00
Light Conditions Daylight 174 1.40 1.85 2.50 3.50 5.00Dusk 11 0.09 0.23 0.27 0.50 0.50Dawn 2 0.01 0.08 0.00 0.00 0.00Dark (w/street lights) 76 0.61 1.05 1.00 1.50 3.00Dark (wo/street lights) 17 0.14 0.31 0.50 0.50 1.00
Surface Condition Dry 232 1.87 2.37 3.50 4.00 6.85Wet 46 0.37 0.75 1.00 1.00 1.50Slippery 3 0.02 0.12 0.00 0.00 0.00Others 0 0.00 0.00 0.00 0.00 0.00
Month of year January 35 0.28 0.49 0.50 1.00 1.00February 23 0.19 0.35 0.50 0.50 1.00March 26 0.21 0.38 0.50 0.85 1.00April 19 0.15 0.33 0.50 0.50 0.92May 28 0.23 0.44 0.50 0.50 1.00June 23 0.19 0.40 0.50 0.50 1.00July 17 0.13 0.30 0.50 0.50 0.50August 24 0.19 0.36 0.50 0.50 1.00September 22 0.17 0.33 0.50 0.50 1.00October 23 0.18 0.40 0.50 0.50 1.00November 28 0.23 0.42 0.50 0.50 1.00December 19 0.15 0.31 0.50 0.50 0.50
Day of week Monday 43 0.34 0.63 1.00 1.00 1.50Tuesday 40 0.32 0.50 1.00 1.00 1.50Wednesday 43 0.34 0.60 0.77 1.00 1.43Thursday 42 0.33 0.51 1.00 1.00 1.50Friday 46 0.37 0.67 0.77 1.00 1.50Saturday 33 0.27 0.47 0.50 1.00 1.50Sunday 40 0.32 0.62 0.50 1.00 1.50
Hour of day 00:00 - 06:00 26 0.21 0.54 0.50 0.50 1.0006:01 - 09:00 28 0.23 0.46 0.50 0.50 1.0009:01 - 11:00 20 0.16 0.29 0.50 0.50 0.5011:01 - 13:00 21 0.17 0.34 0.50 0.50 1.0013:01 - 15:00 36 0.29 0.52 0.77 1.00 1.5015:01 - 18:00 63 0.50 0.72 1.00 1.50 1.9318:01 - 24:00 74 0.59 0.77 1.50 1.50 2.43
Note: 1. Crashes extracted from years 2000 and 2001 for Brevard, City of Orlando, Hillsborough, Miami-Dade, and Seminole, and years 1999 and 2000 for Orange County. 2. Crashes represent only long forms. 3. Standard Deviation, 85th, 90th, and 95th Percentiles represent crash statistics per year per intersection.
CATEGORY 13
EXPECTED ANNUAL ACCIDENT VALUE TABLE FOR SIX COUNTIES
T Intersection , Signalized, AADT/lane for Major Road <7,500
Total Number of Intersections -124
Number of crashes per year
Mean crashes per intersection per
year
Standard Deviation 85th Percentile 90th Percentile 95th Percentile

281
Collision Type Rear End 127 1.49 2.37 2.50 3.00 5.00Head On 8 0.09 0.31 0.00 0.50 0.50Angle 185 2.18 3.01 4.00 4.50 9.70Left Turn 59 0.69 1.50 1.00 1.50 2.00Right Turn 5 0.06 0.20 0.00 0.00 0.50Sideswipe 93 1.09 1.18 2.20 2.50 3.80Pedestrian/Bicycle 26 0.30 0.54 0.50 0.80 1.50Other 79 0.93 1.17 1.70 2.00 2.50
Severity No Injury 262 3.08 3.98 4.70 5.80 9.50Possible Injury 75 0.88 1.05 1.50 2.00 2.90Non-Incapacitating Injury 38 0.44 0.62 1.00 1.30 2.00Incapacitating Injury 14 0.16 0.34 0.50 0.50 0.90Fatal Crashes 1 0.01 0.05 0.00 0.00 0.00
Light Conditions Daylight 379 4.45 5.28 8.50 9.00 10.00Dusk 15 0.17 0.31 0.50 0.50 1.00Dawn 6 0.06 0.25 0.00 0.00 0.50Dark (w/street lights) 179 2.11 3.21 3.50 4.50 5.50Dark (wo/street lights) 4 0.04 0.14 0.00 0.00 0.50
Surface Condition Dry 503 5.92 6.90 9.60 11.50 17.90Wet 66 0.77 1.40 1.50 2.00 2.40Slippery 13 0.15 0.45 0.50 0.50 0.50Others 0 0.00 0.00 0.00 0.00 0.00
Month of year January 43 0.51 0.77 1.00 1.30 1.90February 40 0.46 0.68 1.00 1.50 2.00March 64 0.75 1.02 1.50 2.00 2.50April 52 0.61 0.84 1.00 1.50 2.00May 45 0.53 0.91 1.00 1.30 1.90June 49 0.57 0.72 1.00 1.50 2.00July 53 0.62 0.77 1.20 1.50 2.00August 54 0.63 1.02 1.00 1.50 2.00September 53 0.62 1.07 1.00 1.30 2.30October 44 0.51 0.91 1.00 1.00 2.40November 47 0.55 0.97 1.00 1.30 2.00December 40 0.47 0.73 1.00 1.00 1.90
Day of week Monday 87 1.02 1.61 2.00 2.50 3.50Tuesday 77 0.90 1.23 2.00 2.30 3.40Wednesday 66 0.78 0.94 1.50 1.80 2.50Thursday 72 0.84 1.13 1.50 2.00 2.00Friday 102 1.20 1.69 2.00 2.50 3.40Saturday 90 1.05 1.52 2.00 2.50 4.00Sunday 89 1.04 1.46 2.00 2.30 3.00
Hour of day 00:00 - 06:00 77 0.91 1.35 1.50 2.00 3.0006:01 - 09:00 39 0.45 0.58 1.00 1.00 1.4009:01 - 11:00 32 0.38 0.59 1.00 1.00 1.4011:01 - 13:00 42 0.49 0.63 1.00 1.00 1.9013:01 - 15:00 48 0.56 0.74 1.50 1.50 2.0015:01 - 18:00 73 0.85 1.02 1.50 2.00 3.0018:01 - 24:00 94 1.11 1.92 2.00 2.80 3.40
Note: 1. Crashes extracted from years 2000 and 2001 for Brevard, City of Orlando, Hillsborough, Miami-Dade, and Seminole, and years 1999 and 2000 for Orange County. 2. Crashes represent only long forms. 3. Standard Deviation, 85th, 90th, and 95th Percentiles represent crash statistics per year per intersection.
CATEGORY 14
EXPECTED ANNUAL ACCIDENT VALUE TABLE FOR SIX COUNTIES
Signalized Intersection with Major Road One-way
Total Number of Intersections -85
Number of crashes per year
Mean crashes per intersection per
year
Standard Deviation 85th Percentile 90th Percentile 95th Percentile

282
Collision Type Rear End 71 1.97 2.38 4.00 6.00 7.25Head On 3 0.07 0.18 0.00 0.50 0.50Angle 119 3.31 3.42 7.25 7.50 10.88Left Turn 28 0.76 1.41 1.50 2.25 3.13Right Turn 3 0.07 0.34 0.00 0.00 0.13Sideswipe 26 0.71 1.09 1.50 2.00 2.13Pedestrian/Bicycle 4 0.10 0.23 0.38 0.50 0.50Other 24 0.67 0.61 1.00 1.50 1.63
Severity No Injury 123 3.42 3.17 6.63 7.00 8.25Possible Injury 57 1.58 1.64 2.50 3.50 4.75Non-Incapacitating Injury 30 0.82 1.06 1.50 1.75 3.50Incapacitating Injury 8 0.21 0.32 0.50 0.50 1.00Fatal Crashes 0 0.00 0.00 0.00 0.00 0.00
Light Conditions Daylight 189 5.25 5.49 8.00 10.75 15.25Dusk 9 0.25 0.41 0.50 1.00 1.00Dawn 2 0.04 0.18 0.00 0.00 0.13Dark (w/street lights) 75 2.08 2.14 3.50 5.75 6.25Dark (wo/street lights) 1 0.03 0.12 0.00 0.00 0.13
Surface Condition Dry 246 6.83 6.40 11.88 15.50 19.63Wet 25 0.68 1.02 1.00 2.00 2.50Slippery 1 0.03 0.12 0.00 0.00 0.13Others 4 0.11 0.27 0.38 0.50 0.63
Month of year January 21 0.58 0.69 1.50 1.50 2.00February 18 0.49 0.62 1.00 1.00 1.63March 26 0.72 0.91 1.75 2.00 2.63April 20 0.56 0.88 1.00 1.50 2.38May 22 0.60 0.76 1.38 1.50 2.13June 24 0.67 0.81 1.38 1.75 2.50July 22 0.60 0.84 1.00 1.50 2.25August 29 0.81 0.84 1.50 1.50 2.50September 20 0.54 0.72 1.38 1.50 1.63October 27 0.75 1.08 1.88 2.00 2.75November 28 0.76 0.83 1.88 2.00 2.50December 21 0.58 0.58 1.38 1.50 1.50
Day of week Monday 49 1.36 1.82 3.13 4.50 5.63Tuesday 34 0.94 1.24 1.88 2.00 3.00Wednesday 39 1.07 1.26 1.88 2.25 3.38Thursday 34 0.94 0.85 1.50 2.00 2.50Friday 46 1.26 1.39 2.38 3.00 3.88Saturday 41 1.13 1.34 2.38 3.00 4.13Sunday 34 0.94 1.08 2.38 2.75 3.00
Hour of day 00:00 - 06:00 30 0.83 1.01 1.50 1.75 2.5006:01 - 09:00 26 0.71 0.78 1.50 1.50 2.1309:01 - 11:00 23 0.64 0.74 1.50 2.00 2.0011:01 - 13:00 27 0.74 0.78 1.50 1.50 2.2513:01 - 15:00 30 0.83 0.87 1.88 2.25 2.5015:01 - 18:00 41 1.13 1.33 2.00 2.00 2.1318:01 - 24:00 53 1.46 1.76 2.75 3.75 5.00
Note: 1. Crashes extracted from years 2000 and 2001 for Brevard, City of Orlando, Hillsborough, Miami-Dade, and Seminole, and years 1999 and 2000 for Orange County. 2. Crashes represent only long forms. 3. Standard Deviation, 85th, 90th, and 95th Percentiles represent crash statistics per year per intersection.
CATEGORY 15
EXPECTED ANNUAL ACCIDENT VALUE TABLE FOR SIX COUNTIES
Signalized Intersection with Minor Road One-way
Total Number of Intersections -36
Number of crashes per year
Mean crashes per intersection per
year
Standard Deviation 85th Percentile 90th Percentile 95th Percentile

283
Collision Type Rear End 12 0.88 0.85 1.50 1.50 5.98Head On 1 0.08 0.19 0.10 0.40 0.68Angle 30 2.31 3.53 4.00 5.50 18.63Left Turn 5 0.38 1.12 0.20 0.80 4.35Right Turn 0 0.00 0.00 0.00 0.00 0.00Sideswipe 12 0.88 1.19 1.10 1.40 6.95Pedestrian/Bicycle 1 0.04 0.14 0.00 0.00 0.50Other 12 0.88 1.08 1.80 2.70 5.98
Severity No Injury 34 2.58 2.56 4.00 5.50 17.58Possible Injury 7 0.50 0.50 1.00 1.00 3.25Non-Incapacitating Injury 5 0.35 0.52 1.00 1.00 2.55Incapacitating Injury 1 0.08 0.19 0.10 0.40 0.68Fatal Crashes 0 0.00 0.00 0.00 0.00 0.00
Light Conditions Daylight 52 3.96 5.64 5.00 8.00 31.68Dusk 3 0.19 0.56 0.10 0.40 2.18Dawn 17 1.31 0.00 2.00 2.00 8.55Dark (w/street lights) 0 0.00 1.09 0.00 0.00 0.00Dark (wo/street lights) 71 5.46 0.00 7.00 10.00 42.40
Surface Condition Dry 61 4.69 5.83 6.40 9.10 35.65Wet 9 0.65 0.99 1.10 1.40 5.25Slippery 2 0.12 0.42 0.00 0.00 1.50Others 0 0.00 0.00 0.00 0.00 0.00
Month of year January 5 0.35 0.47 0.60 0.90 2.55February 4 0.27 0.70 0.50 0.50 2.85March 5 0.38 0.74 1.00 1.00 3.38April 7 0.54 0.56 1.00 1.00 3.75May 6 0.46 0.59 1.00 1.00 3.40June 6 0.42 0.61 1.00 1.00 3.23July 8 0.58 0.76 1.10 1.40 4.25August 9 0.69 0.95 0.90 2.10 5.10September 5 0.35 0.72 0.60 0.90 3.20October 7 0.50 0.65 1.10 1.40 3.58November 6 0.46 1.09 0.50 0.50 4.70December 6 0.46 0.66 1.50 1.50 3.08
Day of week Monday 6 0.46 0.69 1.10 1.40 3.40Tuesday 14 1.08 1.62 2.70 3.30 8.15Wednesday 12 0.88 1.21 1.50 1.50 6.95Thursday 9 0.65 1.25 1.10 1.40 5.90Friday 11 0.81 1.75 1.00 1.00 7.90Saturday 11 0.81 0.80 1.50 1.50 4.98Sunday 10 0.77 0.99 1.70 2.30 5.45
Hour of day 00:00 - 06:00 9 0.69 0.72 1.50 1.50 4.4506:01 - 09:00 7 0.50 0.68 1.10 1.40 3.5809:01 - 11:00 5 0.35 0.47 0.60 0.90 2.5511:01 - 13:00 9 0.69 0.72 1.20 1.80 4.4513:01 - 15:00 3 0.23 0.44 1.00 1.00 1.7015:01 - 18:00 14 1.04 1.23 1.90 3.10 7.0018:01 - 24:00 7 0.54 0.72 1.50 1.50 3.75
Note: 1. Crashes extracted from years 2000 and 2001 for Brevard, City of Orlando, Hillsborough, Miami-Dade, and Seminole, and years 1999 and 2000 for Orange County. 2. Crashes represent only long forms. 3. Standard Deviation, 85th, 90th, and 95th Percentiles represent crash statistics per year per intersection.
CATEGORY 16
EXPECTED ANNUAL ACCIDENT VALUE TABLE FOR SIX COUNTIES
Signalized Intersection with Both Major and Minor Road One-way
Total Number of Intersections -13
Number of crashes per year
Mean crashes per intersection per
year
Standard Deviation 85th Percentile 90th Percentile 95th Percentile

284
Collision Type Rear End 45 1.85 2.42 3.78 4.00 4.43Head On 1 0.02 0.10 0.00 0.00 0.00Angle 24 0.98 1.80 1.55 3.40 4.00Left Turn 11 0.44 0.54 1.00 1.00 1.00Right Turn 0 0.00 0.00 0.00 0.00 0.00Sideswipe 8 0.33 1.13 0.50 0.50 0.92Pedestrian/Bicycle 2 0.06 0.17 0.00 0.35 0.50Other 6 0.23 0.53 0.50 0.50 0.50
Severity No Injury 45 1.85 2.50 4.28 4.85 6.70Possible Injury 23 0.96 1.09 1.78 2.35 2.50Non-Incapacitating Injury 8 0.33 0.50 0.78 1.00 1.00Incapacitating Injury 5 0.19 0.46 0.50 0.50 0.92Fatal Crashes 0 0.00 0.00 0.00 0.00 0.00
Light Conditions Daylight 58 2.42 2.73 4.60 6.20 8.20Dusk 2 0.08 0.19 0.28 0.50 0.50Dawn 1 0.02 0.10 0.00 0.00 0.00Dark (w/street lights) 30 1.23 2.17 2.00 3.40 6.12Dark (wo/street lights) 3 0.10 0.21 0.50 0.50 0.50
Surface Condition Dry 71 2.96 4.13 4.28 5.90 12.88Wet 22 0.90 0.97 2.00 2.35 2.50Slippery 0 0.00 0.00 0.00 0.00 0.00Others 0 0.00 0.00 0.00 0.00 0.00
Month of year January 8 0.31 0.48 0.78 1.00 1.43February 5 0.21 0.33 0.50 0.50 0.92March 9 0.38 0.54 1.00 1.00 1.43April 8 0.33 0.43 0.78 1.00 1.00May 4 0.17 0.32 0.50 0.50 0.92June 7 0.27 0.53 0.50 0.85 1.43July 6 0.25 0.42 0.50 0.85 1.00August 9 0.35 0.58 0.78 1.35 1.50September 8 0.33 0.84 0.50 0.85 1.00October 9 0.38 0.47 1.00 1.00 1.00November 12 0.48 0.83 0.78 1.35 1.93December 11 0.46 0.76 1.05 1.50 2.35
Day of week Monday 16 0.65 0.97 1.28 1.85 2.85Tuesday 12 0.50 0.75 1.00 1.35 1.93Wednesday 12 0.50 0.66 1.00 1.00 1.85Thursday 11 0.46 0.85 0.78 1.70 2.43Friday 12 0.48 0.73 0.78 1.00 1.00Saturday 17 0.69 0.76 1.28 1.85 2.00Sunday 16 0.65 0.88 1.00 1.35 2.35
Hour of day 00:00 - 06:00 11 0.46 0.76 0.78 1.00 1.4306:01 - 09:00 10 0.40 0.74 1.00 1.35 1.5009:01 - 11:00 8 0.33 0.56 1.00 1.00 1.4311:01 - 13:00 10 0.40 0.55 1.00 1.00 1.0013:01 - 15:00 10 0.40 0.85 0.78 1.00 1.0015:01 - 18:00 16 0.67 0.70 1.50 1.50 1.5018:01 - 24:00 21 0.88 1.30 1.78 2.70 3.43
Note: 1. Crashes extracted from years 2000 and 2001 for Brevard, City of Orlando, Hillsborough, Miami-Dade, and Seminole, and years 1999 and 2000 for Orange County. 2. Crashes represent only long forms. 3. Standard Deviation, 85th, 90th, and 95th Percentiles represent crash statistics per year per intersection.
CATEGORY 17
EXPECTED ANNUAL ACCIDENT VALUE TABLE FOR SIX COUNTIES
Ramps, Signalized, AADT/lane for Major Road >= 7,500
Total Number of Intersections -24
Number of crashes per year
Mean crashes per intersection per
year
Standard Deviation 85th Percentile 90th Percentile 95th Percentile

285
Collision Type Rear End 10 0.41 0.69 1.00 1.00 1.90Head On 2 0.09 0.25 0.00 0.40 0.50Angle 17 0.74 1.30 1.70 2.40 3.85Left Turn 16 0.70 1.26 1.35 1.90 3.35Right Turn 0 0.00 0.00 0.00 0.00 0.00Sideswipe 1 0.04 0.21 0.00 0.00 0.00Pedestrian/Bicycle 0 0.00 0.00 0.00 0.00 0.00Other 3 0.11 0.00 0.00 0.40 0.50
Severity No Injury 16 0.70 1.51 1.35 1.50 4.65Possible Injury 11 0.46 0.86 1.00 1.40 1.95Non-Incapacitating Injury 12 0.50 1.06 1.35 1.50 1.95Incapacitating Injury 3 0.13 0.22 0.50 0.50 0.50Fatal Crashes 0 0.00 0.00 0.00 0.00 0.00
Light Conditions Daylight 31 1.35 2.32 3.75 4.90 5.00Dusk 2 0.07 0.23 0.00 0.00 0.45Dawn 1 0.02 0.10 0.00 0.00 0.00Dark (w/street lights) 12 0.50 0.83 1.20 1.90 2.00Dark (wo/street lights) 3 0.11 0.26 0.35 0.50 0.50
Surface Condition Dry 41 1.76 2.66 4.40 6.60 7.45Wet 6 0.24 0.67 0.35 0.90 1.00Slippery 1 0.02 0.10 0.00 0.00 0.00Others 1 0.02 0.10 0.00 0.00 0.00
Month of year January 5 0.20 0.45 0.50 0.50 1.40February 1 0.04 0.14 0.00 0.00 0.45March 5 0.22 0.36 0.50 0.90 1.00April 4 0.15 0.32 0.50 0.50 0.95May 4 0.17 0.39 0.50 0.50 0.95June 1 0.04 0.14 0.00 0.00 0.45July 4 0.17 0.47 0.35 0.50 0.95August 4 0.17 0.47 0.35 0.50 0.95September 8 0.33 0.73 0.50 1.30 1.50October 5 0.20 0.36 0.50 0.50 0.50November 7 0.30 0.63 0.50 0.50 0.50December 2 0.09 0.25 0.00 0.40 0.50
Day of week Monday 8 0.33 0.60 0.85 1.40 1.50Tuesday 9 0.37 0.73 1.00 1.00 1.45Wednesday 12 0.50 0.88 1.00 1.80 2.45Thursday 6 0.26 0.50 0.50 0.90 1.00Friday 5 0.20 0.36 0.50 0.90 1.00Saturday 8 0.33 0.67 0.85 1.40 1.50Sunday 3 0.11 0.30 0.00 0.40 0.95
Hour of day 00:00 - 06:00 4 0.15 0.38 0.35 0.50 0.9506:01 - 09:00 6 0.26 0.60 0.50 0.50 1.4009:01 - 11:00 2 0.09 0.33 0.00 0.00 0.4511:01 - 13:00 5 0.20 0.33 0.50 0.50 0.9513:01 - 15:00 3 0.11 0.21 0.50 0.50 0.5015:01 - 18:00 11 0.48 0.83 1.00 1.40 2.4018:01 - 24:00 14 0.61 1.09 1.00 1.40 3.30
Note: 1. Crashes extracted from years 2000 and 2001 for Brevard, City of Orlando, Hillsborough, Miami-Dade, and Seminole, and years 1999 and 2000 for Orange County. 2. Crashes represent only long forms. 3. Standard Deviation, 85th, 90th, and 95th Percentiles represent crash statistics per year per intersection.
CATEGORY 18
EXPECTED ANNUAL ACCIDENT VALUE TABLE FOR SIX COUNTIES
Ramps, Signalized, AADT/lane for Major Road < 7,500
Total Number of Intersections -23
Number of crashes per year
Mean crashes per intersection per
year
Standard Deviation 85th Percentile 90th Percentile 95th Percentile

286
Collision Type Rear End 23 1.61 1.18 2.55 3.20 3.68Head On 0 0.00 0.00 0.00 0.00 0.00Angle 15 1.04 0.93 2.00 2.00 2.35Left Turn 11 0.75 1.34 1.05 1.70 3.05Right Turn 1 0.04 0.13 0.00 0.00 0.18Sideswipe 16 1.11 0.79 1.53 1.85 2.18Pedestrian/Bicycle 4 0.25 0.38 0.52 0.85 1.00Other 11 0.79 0.80 1.53 1.85 2.18
Severity No Injury 28 2.00 1.24 3.50 3.50 3.85Possible Injury 7 0.46 0.57 1.03 1.35 1.50Non-Incapacitating Injury 6 0.39 0.63 0.55 1.20 1.68Incapacitating Injury 1 0.07 0.18 0.02 0.35 0.50Fatal Crashes 1 0.04 0.13 0.00 0.00 0.18
Light Conditions Daylight 54 3.82 3.22 6.55 7.20 9.08Dusk 2 0.14 0.23 0.50 0.50 0.50Dawn 3 0.18 0.25 0.50 0.50 0.50Dark (w/street lights) 20 1.39 0.90 2.05 2.70 3.00Dark (wo/street lights) 1 0.04 0.13 0.00 0.00 0.18
Surface Condition Dry 73 5.21 3.65 9.05 9.70 11.40Wet 4 0.29 0.43 1.00 1.00 1.00Slippery 0 0.00 0.00 0.00 0.00 0.00Others 1 0.07 0.18 0.02 0.35 0.50
Month of year January 5 0.32 0.32 0.50 0.50 0.68February 7 0.50 0.55 1.03 1.35 1.50March 10 0.71 0.83 1.53 1.85 2.18April 7 0.46 0.46 1.00 1.00 1.18May 6 0.43 0.58 1.03 1.35 1.50June 5 0.32 0.37 0.52 0.85 1.00July 8 0.57 0.70 1.05 1.70 2.00August 7 0.50 0.59 1.00 1.00 1.35September 8 0.57 0.58 1.50 1.50 1.50October 5 0.32 0.42 1.00 1.00 1.00November 5 0.32 0.42 1.00 1.00 1.00December 8 0.54 0.54 1.03 1.35 1.50
Day of week Monday 11 0.75 0.78 1.05 1.70 2.18Tuesday 11 0.75 0.61 1.50 1.50 1.68Wednesday 11 0.75 0.78 1.50 1.50 1.85Thursday 11 0.79 0.99 1.05 1.70 2.53Friday 12 0.82 1.08 1.53 1.85 2.70Saturday 11 0.79 0.58 1.50 1.50 1.50Sunday 13 0.93 0.81 2.00 2.00 2.18
Hour of day 00:00 - 06:00 8 0.57 0.55 1.00 1.00 1.3506:01 - 09:00 6 0.39 0.49 1.00 1.00 1.1809:01 - 11:00 3 0.21 0.47 0.52 0.85 1.1811:01 - 13:00 4 0.29 0.26 0.50 0.50 0.5013:01 - 15:00 5 0.32 0.46 0.52 0.85 1.1815:01 - 18:00 9 0.61 1.13 1.05 1.70 2.7018:01 - 24:00 8 0.57 0.43 1.00 1.00 1.18
Note: 1. Crashes extracted from years 2000 and 2001 for Brevard, City of Orlando, Hillsborough, Miami-Dade, and Seminole, and years 1999 and 2000 for Orange County. 2. Crashes represent only long forms. 3. Standard Deviation, 85th, 90th, and 95th Percentiles represent crash statistics per year per intersection.
CATEGORY 19
EXPECTED ANNUAL ACCIDENT VALUE TABLE FOR SIX COUNTIES
One Way and T Intersection, Signalized
Total Number of Intersections-14
Number of crashes per year
Mean crashes per intersection per
year
Standard Deviation 85th Percentile 90th Percentile 95th Percentile

287
APPENDIX H TESTS TO COMPARE THE CRASHES IN EACH COUNTY TO THE
CRASHES IN THE COMBINED DATABASE

288
BC CO HC OC SC DCCollision Type Rear End √ √ √
Head On √ √ √ √ √ √Angle √ √ √ √ √Left Turn √ √ √ √ √Right Turn √ √ √ √ √ √Sideswipe √ √ √ √ √Pedestrian/Bicycle √ √ √ √ √ √Other √ √ √
Severity No Injury √ √ √ √Possible Injury √ √ √Non-Incapacitating Injury √ √ √ √ √ √Incapacitating Injury √ √ √ √ √ √Fatal Crashes √ √ √ √ √ √
Light Conditions Daylight √ √ √ √Dusk √ √ √ √ √ √Dawn √ √ √ √ √ √Dark (w/street lights) √ √ √ √Dark (wo/street lights) √ √ √ √ √ √
Surface Conditions Dry √ √ √Wet √ √ √ √ √Others √ √ √ √ √ √
Month of year January √ √ √ √ √February √ √ √ √ √March √ √ √ √ √April √ √ √ √ √May √ √ √ √ √ √June √ √ √ √ √July √ √ √ √ √August √ √ √ √ √September √ √ √ √ √October √ √ √ √ √November √ √ √ √ √December √ √ √ √ √
Day of week Monday √ √ √ √ √Tuesday √ √ √ √Wednesday √ √ √ √ √Thursday √ √ √ √ √Friday √ √ √ √ √Saturday √ √ √ √ √Sunday √ √ √ √
Hour of day 00:00 - 06:00 √ √ √ √ √06:01 - 09:00 √ √ √ √ √ √09:01 - 11:00 √ √ √ √ √ √11:01 - 13:00 √ √ √ √ √ √13:01 - 15:00 √ √ √ √ √ √15:01 - 18:00 √ √ √ √ √18:01 - 24:00 √ √ √ √ √
√ represents the similarity in the county mean and the mean of the combined database.
2 Lane x 2 Lane Intersection, Signalized, AADT/lane for Major Road >= 5,000 Category 1
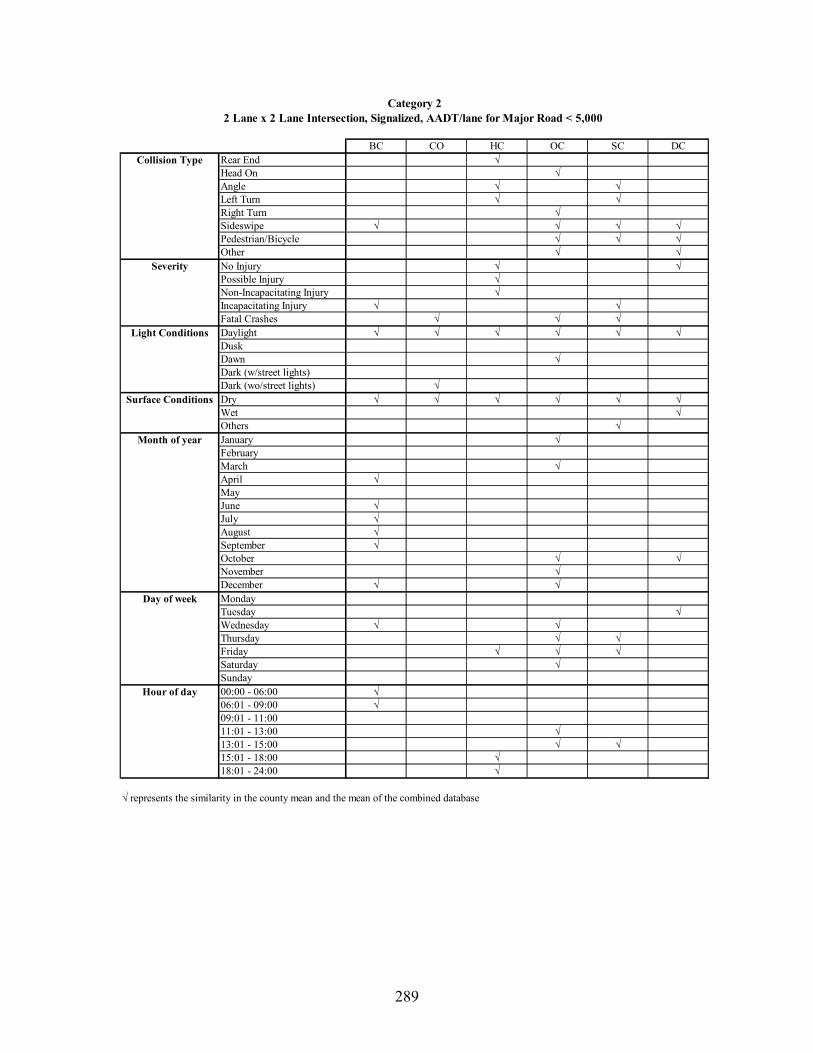
289
BC CO HC OC SC DCCollision Type Rear End √
Head On √Angle √ √Left Turn √ √Right Turn √Sideswipe √ √ √ √Pedestrian/Bicycle √ √ √Other √ √
Severity No Injury √ √Possible Injury √Non-Incapacitating Injury √Incapacitating Injury √ √Fatal Crashes √ √ √
Light Conditions Daylight √ √ √ √ √ √DuskDawn √Dark (w/street lights)Dark (wo/street lights) √
Surface Conditions Dry √ √ √ √ √ √Wet √Others √
Month of year January √FebruaryMarch √April √MayJune √July √August √September √October √ √November √December √ √
Day of week MondayTuesday √Wednesday √ √Thursday √ √Friday √ √ √Saturday √Sunday
Hour of day 00:00 - 06:00 √06:01 - 09:00 √09:01 - 11:0011:01 - 13:00 √13:01 - 15:00 √ √15:01 - 18:00 √18:01 - 24:00 √
√ represents the similarity in the county mean and the mean of the combined database
Category 22 Lane x 2 Lane Intersection, Signalized, AADT/lane for Major Road < 5,000

290
BC CO HC OC DCCollision Type Rear End √ √ √ √ √
Head On √ √Angle √ √ √Left Turn √ √Right Turn √ √Sideswipe √ √ √ √Pedestrian/Bicycle √Other √ √ √ √
Severity No Injury √ √ √ √ √Possible Injury √ √Non-Incapacitating Injury √Incapacitating InjuryFatal Crashes √ √ √
Light Conditions Daylight √ √ √ √ √Dusk √ √Dawn √Dark (w/street lights) √ √ √ √ √Dark (wo/street lights) √
Surface Conditions Dry √ √ √ √ √Wet √ √ √ √ √Others √ √ √ √ √
Month of year January √ √ √February √March √ √ √April √ √ √ √May √ √ √June √ √ √ √July √ √ √ √ √August √ √ √September √ √ √October √ √ √November √ √December √ √ √
Day of week Monday √ √ √ √Tuesday √ √ √ √Wednesday √ √ √Thursday √ √ √ √Friday √ √ √ √Saturday √ √ √ √Sunday √ √ √ √ √
Hour of day 00:00 - 06:00 √ √06:01 - 09:00 √ √09:01 - 11:00 √ √11:01 - 13:00 √ √13:01 - 15:00 √ √15:01 - 18:00 √ √ √18:01 - 24:00 √ √ √
√ represents the similarity in the county mean and the mean of the combined database
Category 34 Lane x 2 Lane Intersection, Signalized, AADT/lane for Major Road >= 7,000 (LTLs <= 2)

291
BC CO HC OC SC DCCollision Type Rear End √ √
Head On √Angle √ √ √ √Left Turn √ √ √ √Right Turn √Sideswipe √ √Pedestrian/BicycleOther √ √ √ √
Severity No Injury √ √ √ √ √ √Possible Injury √ √ √Non-Incapacitating Injury √ √ √Incapacitating Injury √ √Fatal Crashes
Light Conditions Daylight √ √ √ √ √DuskDawnDark (w/street lights) √ √ √ √ √Dark (wo/street lights) √ √
Surface Conditions Dry √ √ √ √ √ √Wet √ √Others √ √
Month of year January √ √February √ √March √ √April √May √June √July √ √August √ √ √September √ √October √November √December √
Day of week Monday √ √ √ √Tuesday √ √ √Wednesday √ √ √ √Thursday √ √ √Friday √ √ √ √ √Saturday √ √Sunday √ √ √
Hour of day 00:00 - 06:00 √ √06:01 - 09:00 √ √09:01 - 11:00 √11:01 - 13:00 √13:01 - 15:00 √ √15:01 - 18:00 √ √ √18:01 - 24:00 √ √ √ √ √
√ represents the similarity in the county mean and the mean of the combined database
Category 44 Lane x 2 Lane Intersection, Signalized, AADT/lane for Major Road >= 7,000 (LTLs > 2)
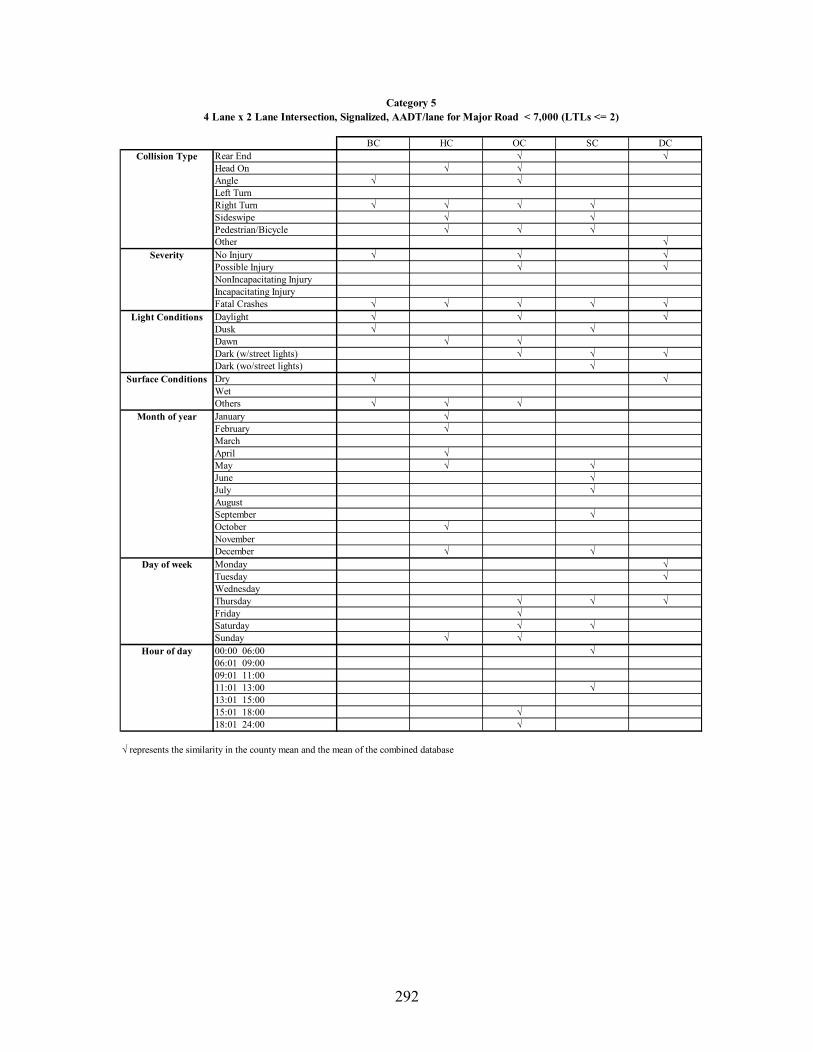
292
BC HC OC SC DCCollision Type Rear End √ √
Head On √ √Angle √ √Left TurnRight Turn √ √ √ √Sideswipe √ √Pedestrian/Bicycle √ √ √Other √
Severity No Injury √ √ √Possible Injury √ √NonIncapacitating InjuryIncapacitating InjuryFatal Crashes √ √ √ √ √
Light Conditions Daylight √ √ √Dusk √ √Dawn √ √Dark (w/street lights) √ √ √Dark (wo/street lights) √
Surface Conditions Dry √ √WetOthers √ √ √
Month of year January √February √MarchApril √May √ √June √July √AugustSeptember √October √NovemberDecember √ √
Day of week Monday √Tuesday √WednesdayThursday √ √ √Friday √Saturday √ √Sunday √ √
Hour of day 00:00 06:00 √06:01 09:0009:01 11:0011:01 13:00 √13:01 15:0015:01 18:00 √18:01 24:00 √
√ represents the similarity in the county mean and the mean of the combined database
Category 54 Lane x 2 Lane Intersection, Signalized, AADT/lane for Major Road < 7,000 (LTLs <= 2)

293
BC CO HC OC SC DCCollision Type Rear End √ √ √
Head On √ √Angle √ √Left TurnRight Turn √SideswipePedestrian/Bicycle √Other √ √
Severity No Injury √ √ √ √Possible Injury √Non-Incapacitating InjuryIncapacitating Injury √Fatal Crashes √ √ √ √ √ √
Light Conditions Daylight √ √ √ √DuskDawn √Dark (w/street lights) √ √ √Dark (wo/street lights)
Surface Conditions Dry √ √ √ √Wet √Others √
Month of year JanuaryFebruaryMarchAprilMayJuneJulyAugustSeptemberOctoberNovemberDecember
Day of week Monday √ √Tuesday √Wednesday √Thursday √Friday √SaturdaySunday √ √
Hour of day 00:00 - 06:0006:01 - 09:0009:01 - 11:0011:01 - 13:0013:01 - 15:0015:01 - 18:00 √18:01 - 24:00
Category 64 Lane x 2 Lane Intersection, Signalized, AADT/lane for Major Road < 7,000 (LTLs > 2)
√ represents the similarity in the county mean and the mean of the combined database

294
BC CO HC OC SC DCCollision Type Rear End √ √ √ √
Head On √Angle √ √ √ √Left Turn √ √ √ √Right Turn √ √Sideswipe √ √ √ √ √ √Pedestrian/Bicycle √Other √ √ √
Severity No Injury √ √ √ √Possible Injury √ √ √Non-Incapacitating Injury √Incapacitating Injury √Fatal Crashes √ √
Light Conditions Daylight √ √ √ √DuskDawn √Dark (w/street lights) √ √ √ √Dark (wo/street lights) √ √ √ √
Surface Conditions Dry √ √ √ √Wet √ √ √Others √ √
Month of year January √February √March √ √April √May √ √June √July √August √September √ √October √ √November √December √
Day of week Monday √ √Tuesday √ √Wednesday √ √ √Thursday √ √Friday √ √Saturday √Sunday √ √
Hour of day 00:00 - 06:00 √ √ √06:01 - 09:00 √ √09:01 - 11:00 √11:01 - 13:00 √13:01 - 15:00 √15:01 - 18:00 √ √18:01 - 24:00 √ √ √ √
Category 74 Lane x 4 Lane Intersection, Signalized, AADT/lane for Major Road >= 7,500
√ represents the similarity in the county mean and the mean of the combined database

295
BC CO HC OC SC DCCollision Type Rear End √ √ √ √ √
Head On √Angle √ √ √ √ √ √Left TurnRight Turn √ √ √Sideswipe √ √ √Pedestrian/BicycleOther √ √ √
Severity No Injury √ √ √ √ √ √Possible Injury √ √Non-Incapacitating Injury √ √Incapacitating InjuryFatal Crashes √ √ √
Light Conditions Daylight √ √ √ √ √ √DuskDawn √ √Dark (w/street lights) √ √ √ √ √Dark (wo/street lights) √
Surface Conditions Dry √ √ √ √ √ √Wet √ √ √Others √ √ √
Month of year January √February √ √March √ √April √ √May √June √July √ √ √August √September √October √November √December √
Day of week Monday √ √ √Tuesday √ √ √Wednesday √ √ √Thursday √ √ √ √Friday √ √ √ √ √Saturday √ √ √Sunday √ √ √
Hour of day 00:00 - 06:00 √ √ √06:01 - 09:00 √ √09:01 - 11:00 √ √11:01 - 13:00 √ √13:01 - 15:00 √ √15:01 - 18:00 √ √18:01 - 24:00 √ √ √ √
Category 84 Lane x 4 Lane Intersection, Signalized, AADT/lane for Major Road < 7,500
√ represents the similarity in the county mean and the mean of the combined database

296
CO HC OC SC DCCollision Type Rear End √ √ √
Head On √ √Angle √ √ √Left Turn √ √ √Right Turn √ √ √Sideswipe √ √Pedestrian/BicycleOther √ √ √
Severity No Injury √ √ √ √ √Possible Injury √ √ √ √Non-Incapacitating Injury √ √ √Incapacitating Injury √ √Fatal Crashes √ √ √
Light Conditions Daylight √ √ √ √DuskDawn √ √Dark (w/street lights) √ √ √Dark (wo/street lights) √
Surface Conditions Dry √ √ √Wet √ √ √Others √
Month of year JanuaryFebruary √ √March √ √AprilMay √ √June √ √July √ √ √August √September √October √ √ √November √ √December √ √
Day of week Monday √ √ √Tuesday √ √ √Wednesday √ √Thursday √ √ √Friday √ √ √Saturday √Sunday √ √
Hour of day 00:00 - 06:0006:01 - 09:00 √09:01 - 11:0011:01 - 13:00 √13:01 - 15:00 √15:01 - 18:00 √ √18:01 - 24:00 √
√ represents the similarity in the county mean and the mean of the combined database
Category 96 Lane x 2 Lane Intersection, Signalized, AADT/lane for Major Road >= 7,500

297
BC CO HC OC SC DCCollision Type Rear End √ √ √ √ √
Head OnAngle √ √ √ √ √Left Turn √ √ √Right Turn √Sideswipe √ √Pedestrian/BicycleOther √ √
Severity No Injury √ √ √ √ √Possible Injury √ √ √Non-Incapacitating Injury √ √ √Incapacitating Injury √ √Fatal Crashes √ √
Light Conditions Daylight √ √ √ √ √Dusk √Dawn √ √ √ √Dark (w/street lights) √ √ √ √Dark (wo/street lights) √ √ √
Surface Conditions Dry √ √ √ √ √ √Wet √ √ √Others √ √ √ √
Month of year January √ √ √February √March √ √April √May √JuneJuly √AugustSeptember √OctoberNovemberDecember √ √
Day of week MondayTuesday √ √ √Wednesday √ √ √Thursday √ √ √Friday √ √ √ √Saturday √ √Sunday √
Hour of day 00:00 - 06:00 √06:01 - 09:00 √ √09:01 - 11:00 √ √11:01 - 13:00 √13:01 - 15:0015:01 - 18:00 √18:01 - 24:00 √ √ √
Category 106 Lane x 2 Lane Intersection, Signalized, AADT/lane for Major Road < 7,500
√ represents the similarity in the county mean and the mean of the combined database

298
BC CO HC OC SC DCCollision Type Rear End √ √ √ √ √ √
Head On √Angle √ √ √ √ √Left Turn √ √ √Right Turn √ √ √Sideswipe √ √ √ √ √Pedestrian/Bicycle √Other √ √
Severity No Injury √ √ √ √ √ √Possible Injury √ √ √ √Non-Incapacitating Injury √ √ √Incapacitating Injury √ √ √Fatal Crashes √ √ √
Light Conditions Daylight √ √ √ √ √DuskDawnDark (w/street lights) √ √ √ √ √ √Dark (wo/street lights) √ √
Surface Conditions Dry √ √ √ √ √Wet √ √ √ √ √Others √ √ √
Month of year January √ √ √February √ √ √ √ √March √ √ √ √April √ √May √ √ √June √ √ √July √ √August √ √ √ √September √ √ √ √ √October √ √ √ √November √ √ √December √ √ √
Day of week Monday √ √ √Tuesday √ √ √ √ √Wednesday √ √ √ √ √Thursday √ √ √ √ √Friday √ √ √ √ √Saturday √ √ √ √Sunday √ √ √ √ √
Hour of day 00:00 - 06:00 √ √ √ √06:01 - 09:00 √ √ √09:01 - 11:00 √ √11:01 - 13:00 √ √ √13:01 - 15:00 √ √ √ √15:01 - 18:00 √ √ √ √18:01 - 24:00 √ √ √
Category 116 Lane x 4 Lane and 6 Lane x 6 Lane Intersection, Signalized
√ represents the similarity in the county mean and the mean of the combined database

299
BC CO HC OC SC DCCollision Type Rear End √ √ √ √
Head On √ √Angle √ √ √Left TurnRight Turn √ √ √Sideswipe √ √Pedestrian/Bicycle √Other √ √ √ √
Severity No Injury √ √ √ √ √Possible Injury √ √Non-Incapacitating Injury √Incapacitating Injury √ √Fatal Crashes √ √ √ √
Light Conditions Daylight √ √ √ √DuskDawn √ √ √Dark (w/street lights) √ √ √ √Dark (wo/street lights)
Surface Conditions Dry √ √ √ √Wet √ √ √Others √ √ √
Month of year January √February √March √April √May √ √June √ √July √August √ √September √October √November √ √December √
Day of week Monday √ √ √Tuesday √ √ √Wednesday √ √Thursday √ √Friday √ √ √Saturday √ √Sunday √ √ √ √
Hour of day 00:00 - 06:00 √06:01 - 09:00 √09:01 - 11:0011:01 - 13:0013:01 - 15:00 √ √15:01 - 18:00 √ √ √ √18:01 - 24:00 √ √ √
Category 12T Intersection, Signalized, AADT/lane for Major Road >= 7,500
√ represents the similarity in the county mean and the mean of the combined database

300
BC CO HC OC SC DCCollision Type Rear End √
Head On √ √Angle √Left TurnRight Turn √Sideswipe √Pedestrian/Bicycle √ √ √Other √
Severity No Injury √ √Possible Injury √Non-Incapacitating Injury √Incapacitating Injury √Fatal Crashes √ √
Light Conditions Daylight √ √ √DuskDawn √ √ √Dark (w/street lights) √Dark (wo/street lights) √
Surface Conditions Dry √ √ √ √Wet √Others √ √
Month of year January √February √MarchAprilMayJuneJulyAugustSeptemberOctoberNovember √ √December
Day of week Monday √TuesdayWednesday √ √Thursday √ √Friday √ √Saturday √ √Sunday
Hour of day 00:00 - 06:00 √06:01 - 09:0009:01 - 11:0011:01 - 13:0013:01 - 15:0015:01 - 18:00 √ √18:01 - 24:00
Category 13T Intersection, Signalized, AADT/lane for Major Road < 7,500
√ represents the similarity in the county mean and the mean of the combined database

301
CO HC DCCollision Type Rear End √ √ √
Head On √Angle √ √ √Left Turn √Right Turn √Sideswipe √ √Pedestrian/Bicycle √Other √ √ √
Severity No Injury √ √ √Possible Injury √ √Non-Incapacitating Injury √ √Incapacitating Injury √Fatal Crashes √ √
Light Conditions Daylight √ √ √Dusk √DawnDark (w/street lights) √ √ √Dark (wo/street lights) √
Surface Conditions Dry √ √ √Wet √ √Others
Month of year January √February √March √ √ √April √ √May √ √June √ √July √ √August √September √October √November √December √
Day of week Monday √ √ √Tuesday √ √ √Wednesday √ √Thursday √ √Friday √ √ √Saturday √ √Sunday √ √
Hour of day 00:00 - 06:00 √ √06:01 - 09:0009:01 - 11:0011:01 - 13:0013:01 - 15:0015:01 - 18:00 √18:01 - 24:00 √
√ represents the similarity in the county mean and the mean of the combined database
Category 14Signalized Intersection, One-way Major Road

302
CO DCCollision Type Rear End
Head On √AngleLeft TurnRight Turn √SideswipePedestrian/BicycleOther √ √
Severity No Injury √ √Possible Injury √Non-Incapacitating InjuryIncapacitating InjuryFatal Crashes √
Light Conditions Daylight √ √DuskDawn √Dark (w/street lights)Dark (wo/street lights)
Surface Conditions Dry √ √WetOthers
Month of year JanuaryFebruaryMarchAprilMayJuneJulyAugustSeptemberOctoberNovemberDecember
Day of week Monday √Tuesday √WednesdayThursdayFridaySaturdaySunday
Hour of day 00:00 - 06:0006:01 - 09:0009:01 - 11:0011:01 - 13:0013:01 - 15:0015:01 - 18:0018:01 - 24:00
√ represents the similarity in the county mean and the mean of the combined database
Category 15Signalized Intersection, One-way Minor Road

303
CO DCCollision Type Rear End
Head On √ √AngleLeft Turn √Right Turn √ √SideswipePedestrian/BicycleOther
Severity No Injury √Possible InjuryNon-Incapacitating InjuryIncapacitating Injury √ √Fatal Crashes √ √
Light Conditions Daylight √DuskDawn √ √Dark (w/street lights)Dark (wo/street lights) √ √
Surface Conditions Dry √WetOthers √
Month of year JanuaryFebruaryMarchAprilMayJuneJulyAugustSeptemberOctoberNovemberDecember
Day of week MondayTuesdayWednesdayThursdayFridaySaturdaySunday
Hour of day 00:00 - 06:0006:01 - 09:0009:01 - 11:0011:01 - 13:0013:01 - 15:0015:01 - 18:0018:01 - 24:00
√ represents the similarity in the county mean and the mean of the combined database
Category 16Signalized Intersection, Both Major and Minor Roads are One-way

304
BC HC DCCollision Type Rear End √ √ √
Head On √ √Angle √ √Left Turn √Right Turn √Sideswipe √ √Pedestrian/Bicycle √ √Other √ √
Severity No Injury √ √ √Possible Injury √ √ √Non-Incapacitating Injury √Incapacitating InjuryFatal Crashes √ √ √
Light Conditions Daylight √ √ √DuskDawn √Dark (w/street lights) √ √ √Dark (wo/street lights)
Surface Conditions Dry √ √ √Wet √ √Others
Month of year January √February √March √ √April √MayJune √July √ √August √ √September √ √October √ √November √December
Day of week Monday √ √Tuesday √ √Wednesday √ √Thursday √ √Friday √ √ √Saturday √ √Sunday √ √
Hour of day 00:00 - 06:00 √06:01 - 09:00 √ √ √09:01 - 11:00 √11:01 - 13:00 √13:01 - 15:00 √ √15:01 - 18:00 √ √18:01 - 24:00 √ √ √
√ represents the similarity in the county mean and the mean of the combined database
Category 17T Intersection, Signalized, AADT/lane for Major Road >= 7,500

305
BC HC DCCollision Type Rear End √
Head On √AngleLeft TurnRight Turn √ √Sideswipe √Pedestrian/BicycleOther
Severity No Injury √ √ √Possible Injury √Non-Incapacitating Injury √Incapacitating Injury √Fatal Crashes √ √ √
Light Conditions Daylight √ √Dusk √Dawn √ √Dark (w/street lights)Dark (wo/street lights) √
Surface Conditions Dry √ √WetOthers √ √ √
Month of year JanuaryFebruary √March √AprilMayJuneJulyAugustSeptemberOctoberNovemberDecember √
Day of week MondayTuesdayWednesdayThursdayFriday √SaturdaySunday
Hour of day 00:00 - 06:0006:01 - 09:0009:01 - 11:0011:01 - 13:0013:01 - 15:0015:01 - 18:0018:01 - 24:00
√ represents the similarity in the county mean and the mean of the combined database
Category 18T Intersection, Signalized, AADT/lane for Major Road < 7,500