Embed Size (px)
Citation preview
Identification of “Hot Spots” in Druggable Binding Pockets by
Computational Solvent Mapping of Proteins
Melissa R. Landon1, Jessamin Yu1, Spencer C. Thiel2, David R. Lancia2, Jr., Sandor Vajda1,3
1Bioinformatics Graduate Program, Boston University, Boston MA2SolMap Pharmaceuticals, Cambridge MA
3Department of Biomedical Engineering, Boston University, Boston MA
Terms• Druggability: the ability of a protein’s
binding pocket(s) to bind lead-like molecules with high affinity
• Hot Spots: specific residues within a binding pocket for which ligands display high affinity
Protein mapping and druggability
Hajduk PJ, Huth JR, Fesik SW: Druggability indices for protein targets derived from NMR-based screening data. J Med Chem (2005) 48(7):2518-2525.
Hajduk PJ, Huth JR, Tse C: Predicting protein druggability. Drug Discov Today (2005) 10(23-24):1675-1682.
Observation based on SAR by NMR:
• Druggable sites bind a variety of small molecules• Binding of probes is restricted to ligand binding sites • “Hit rate” in mapping is a predictor of druggability
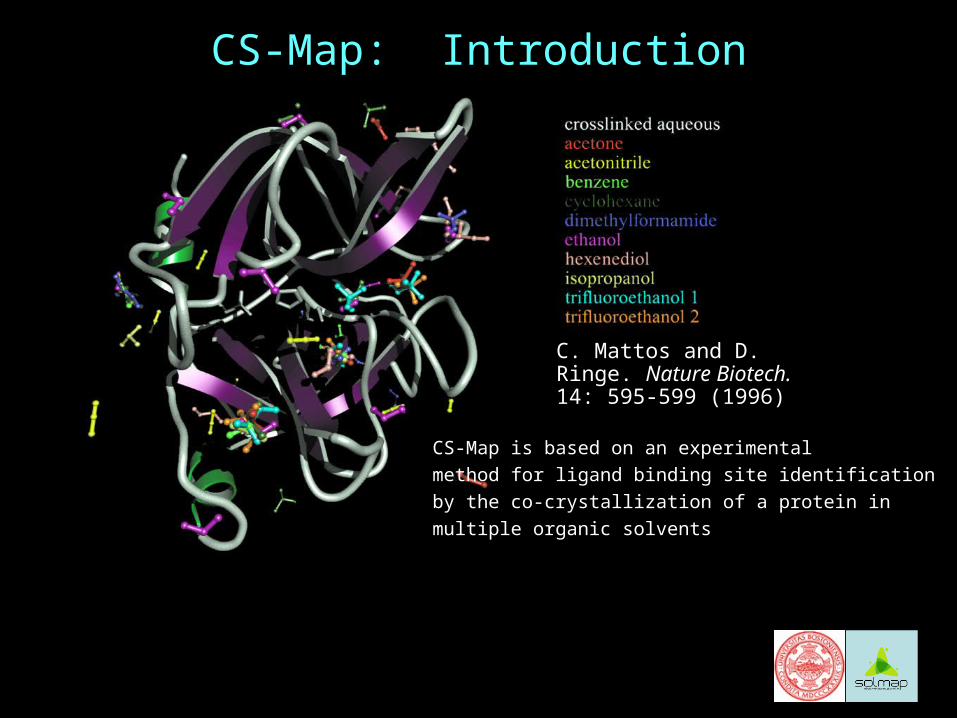
CS-Map is based on an experimental
method for ligand binding site identification
by the co-crystallization of a protein in
multiple organic solvents
C. Mattos and D. Ringe. Nature Biotech. 14: 595-599 (1996)
CS-Map: Introduction
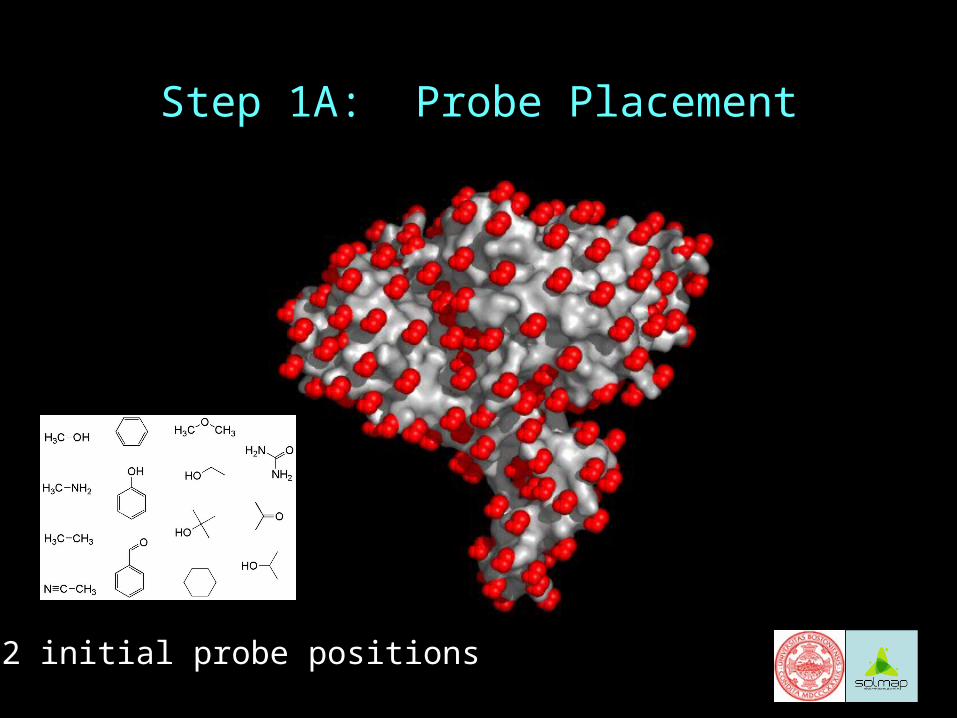
Step 1A: Probe Placement
222 initial probe positions
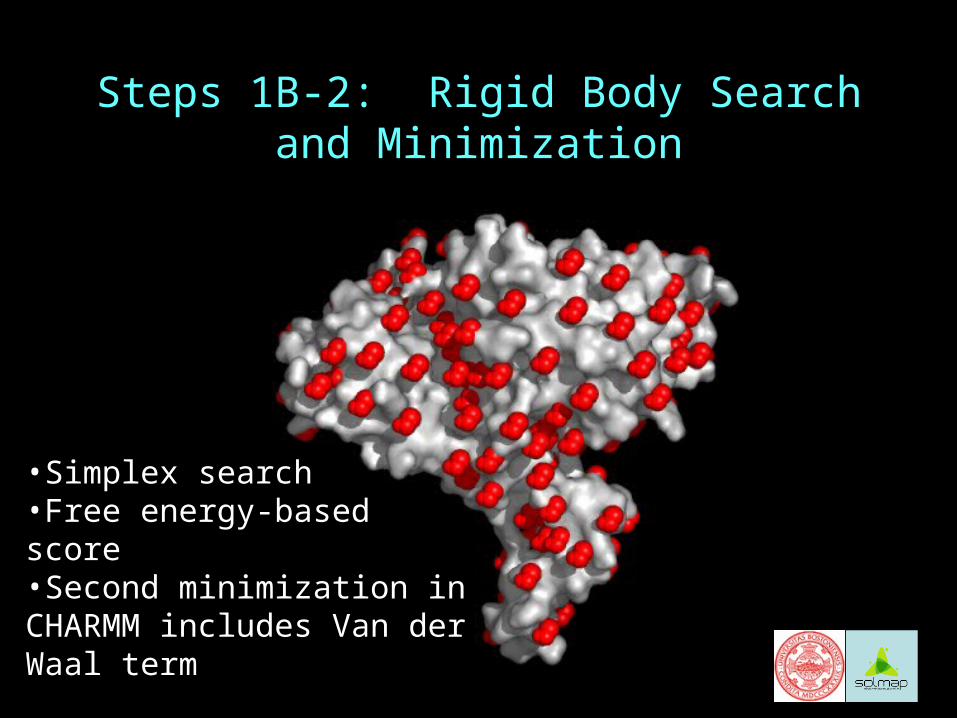
Steps 1B-2: Rigid Body Search and Minimization
•Simplex search•Free energy-based score•Second minimization in CHARMM includes Van der Waal term
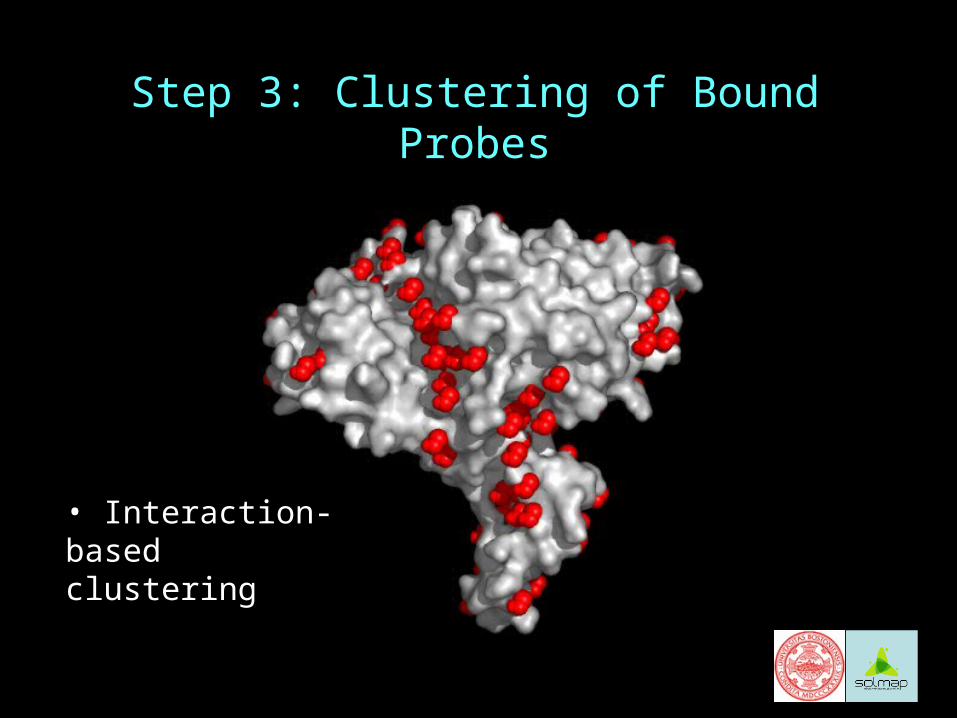
Step 3: Clustering of Bound Probes
• Interaction-based clustering
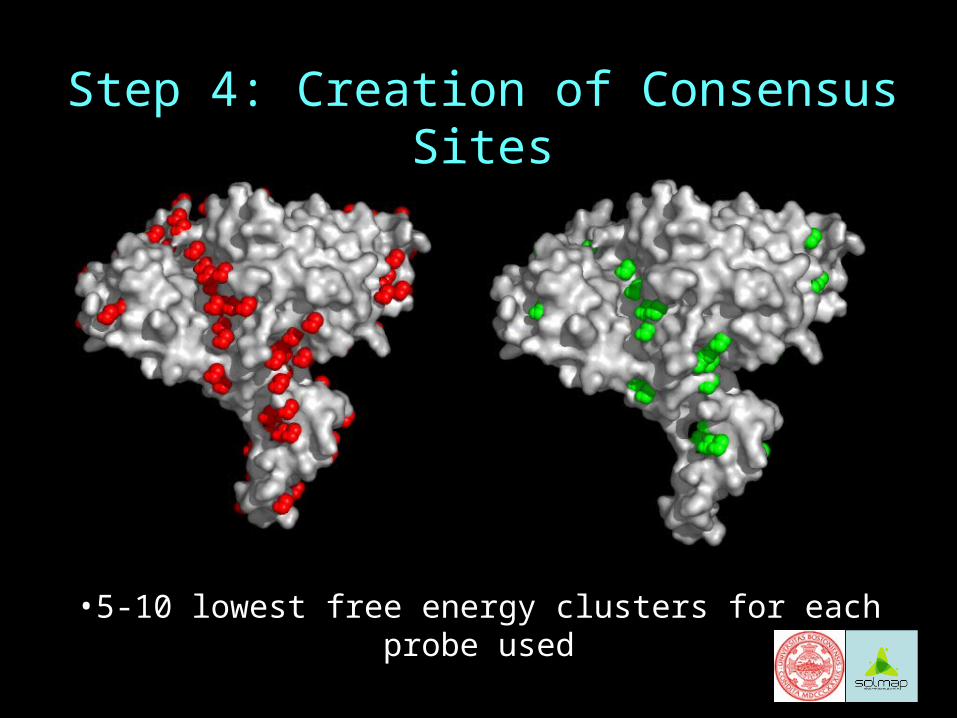
Step 4: Creation of Consensus Sites
•5-10 lowest free energy clusters for each probe used
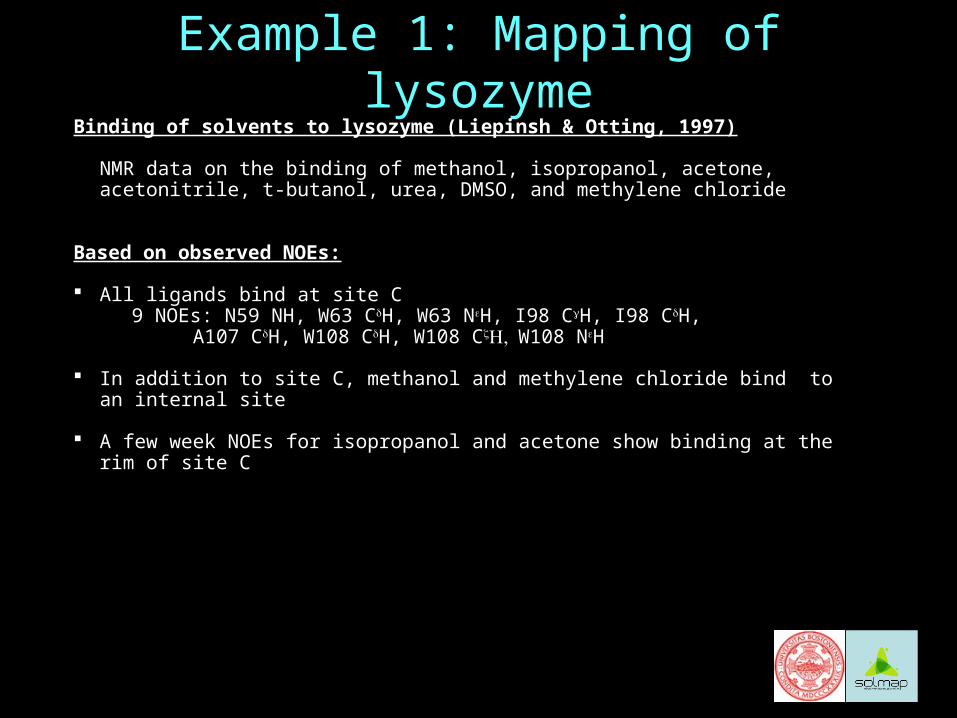
Example 1: Mapping of lysozymeBinding of solvents to lysozyme (Liepinsh & Otting, 1997)
NMR data on the binding of methanol, isopropanol, acetone, acetonitrile, t-butanol, urea, DMSO, and methylene chloride
Based on observed NOEs:
All ligands bind at site C 9 NOEs: N59 NH, W63 CH, W63 NH, I98 CH, I98 CH,
A107 CH, W108 CH, W108 CW108 NH
In addition to site C, methanol and methylene chloride bind to an internal site
A few week NOEs for isopropanol and acetone show binding at the rim of site C
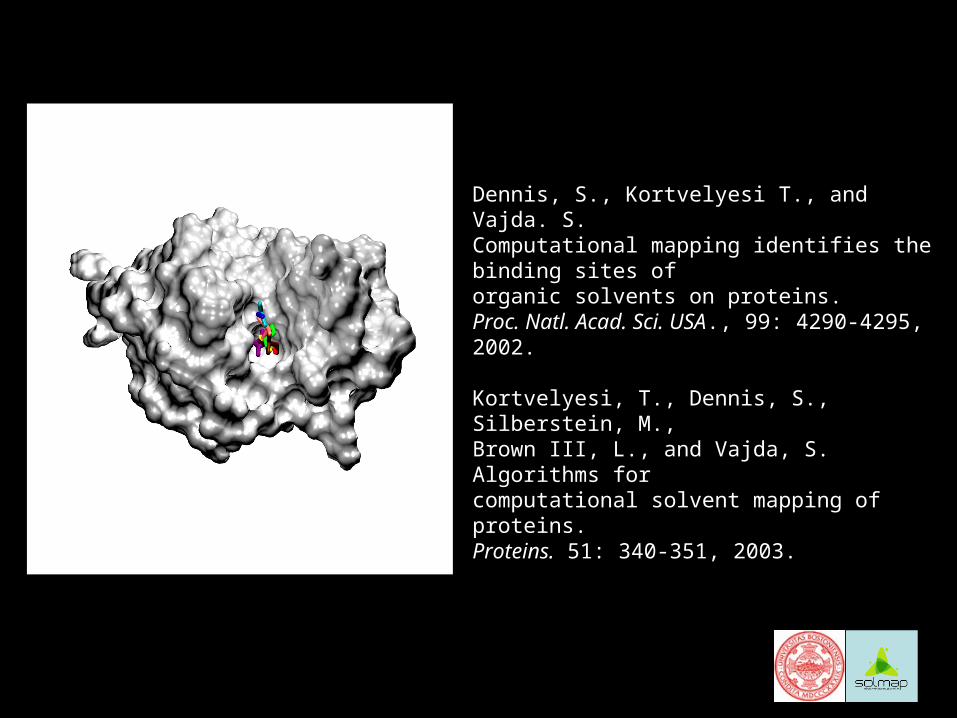
Dennis, S., Kortvelyesi T., and Vajda. S. Computational mapping identifies the binding sites of organic solvents on proteins. Proc. Natl. Acad. Sci. USA., 99: 4290-4295, 2002.
Kortvelyesi, T., Dennis, S., Silberstein, M., Brown III, L., and Vajda, S. Algorithms for computational solvent mapping of proteins. Proteins. 51: 340-351, 2003.
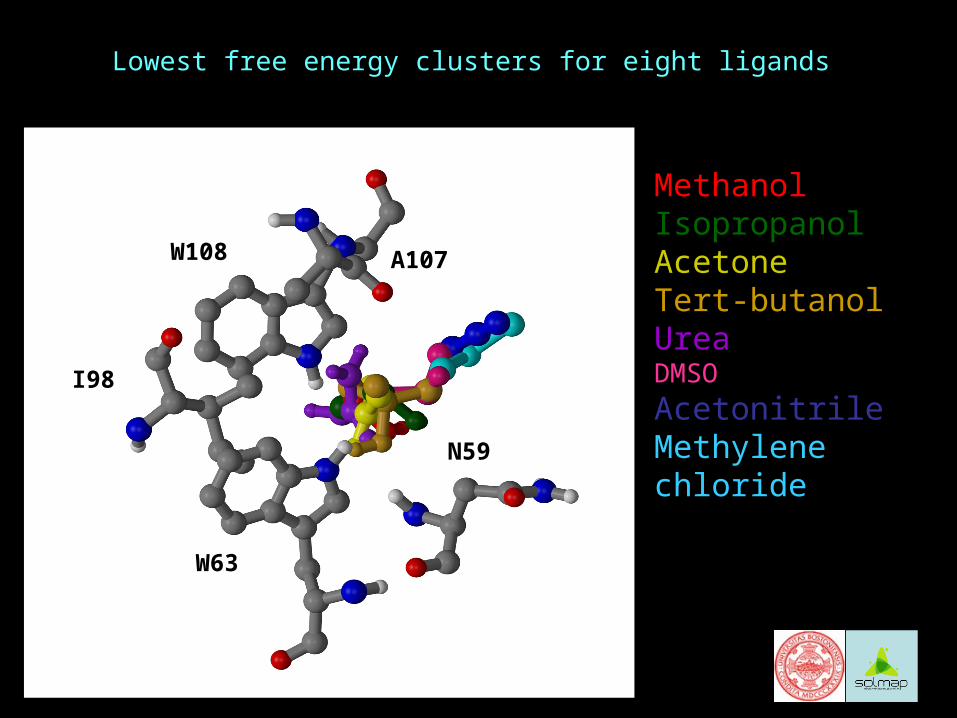
Lowest free energy clusters for eight ligands
MethanolIsopropanolAcetoneTert-butanolUreaDMSO
AcetonitrileMethylene chloride
A107
I98
W108
W63
N59
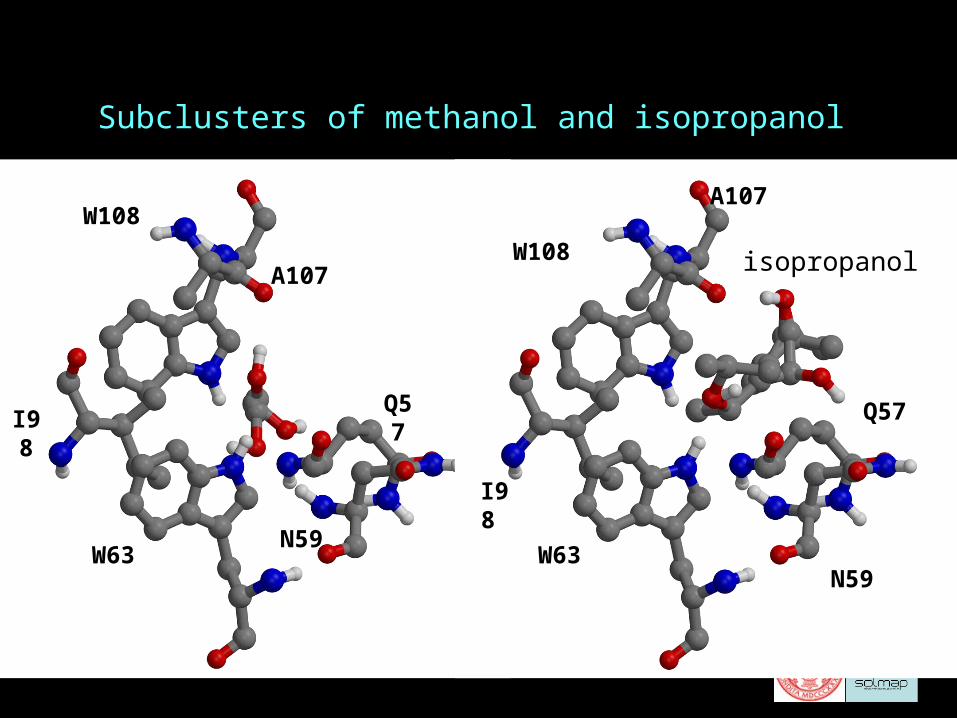
Subclusters of methanol and isopropanol
methanol
N59
Q57
W63
I98
W108
A107W108
A107
isopropanol
N59
Q57
W63
I98
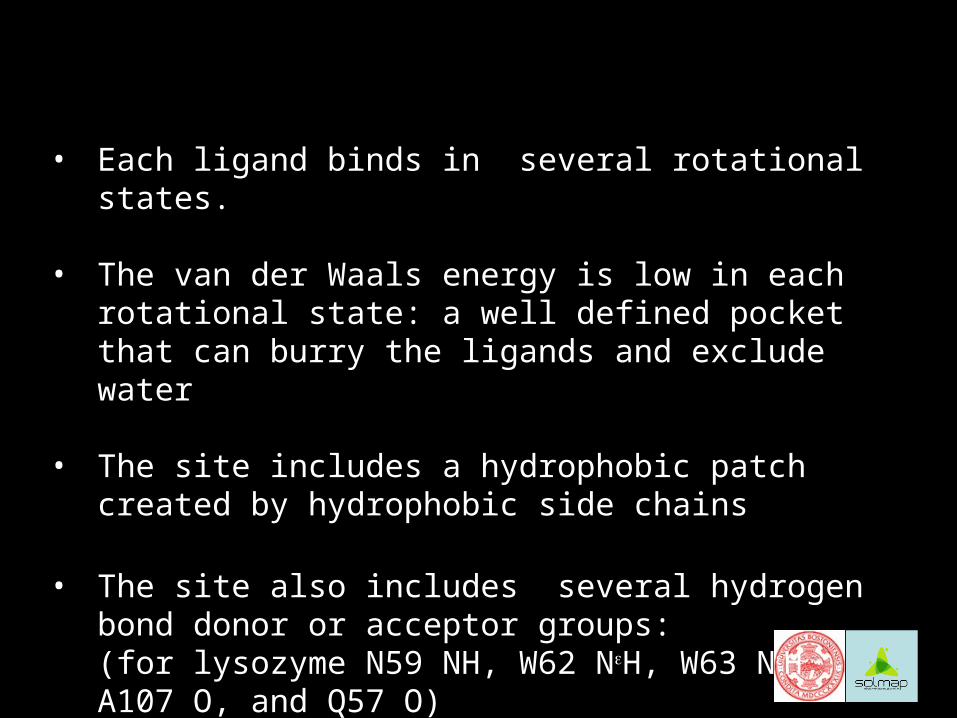
Conclusions I: The nature of binding sites
• Each ligand binds in several rotational states.
• The van der Waals energy is low in each rotational state: a well defined pocket that can burry the ligands and exclude water
• The site includes a hydrophobic patch created by hydrophobic side chains
• The site also includes several hydrogen bond donor or acceptor groups: (for lysozyme N59 NH, W62 NH, W63 NH, A107 O, and Q57 O)
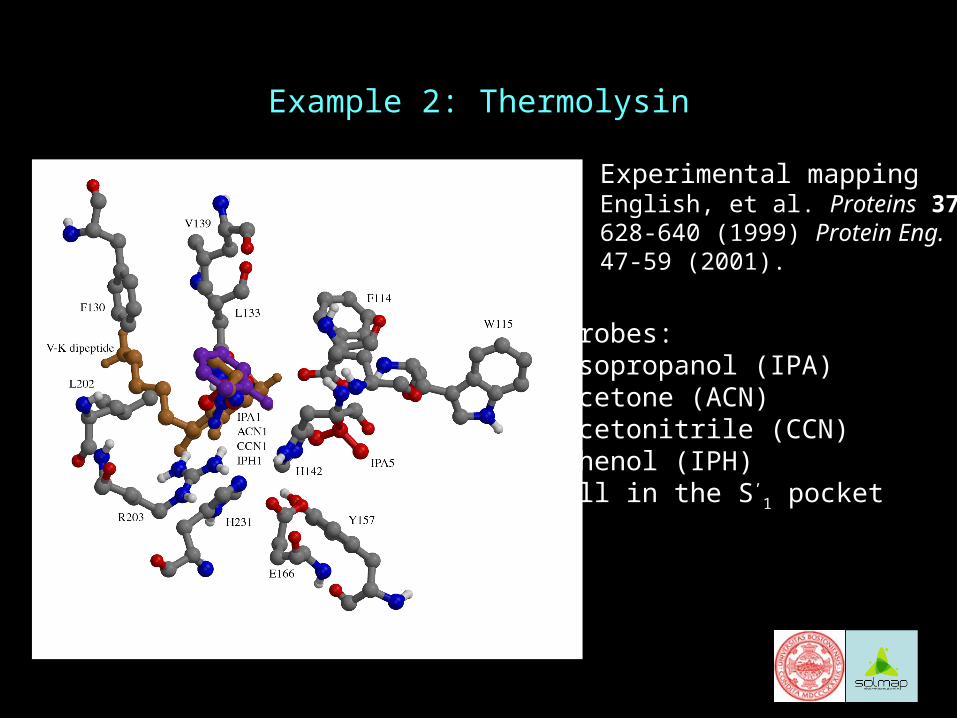
Example 2: Thermolysin
Probes:Isopropanol (IPA)Acetone (ACN)Acetonitrile (CCN)Phenol (IPH)All in the S’
1 pocket
Experimental mappingEnglish, et al. Proteins 37,628-640 (1999) Protein Eng. 14, 47-59 (2001).
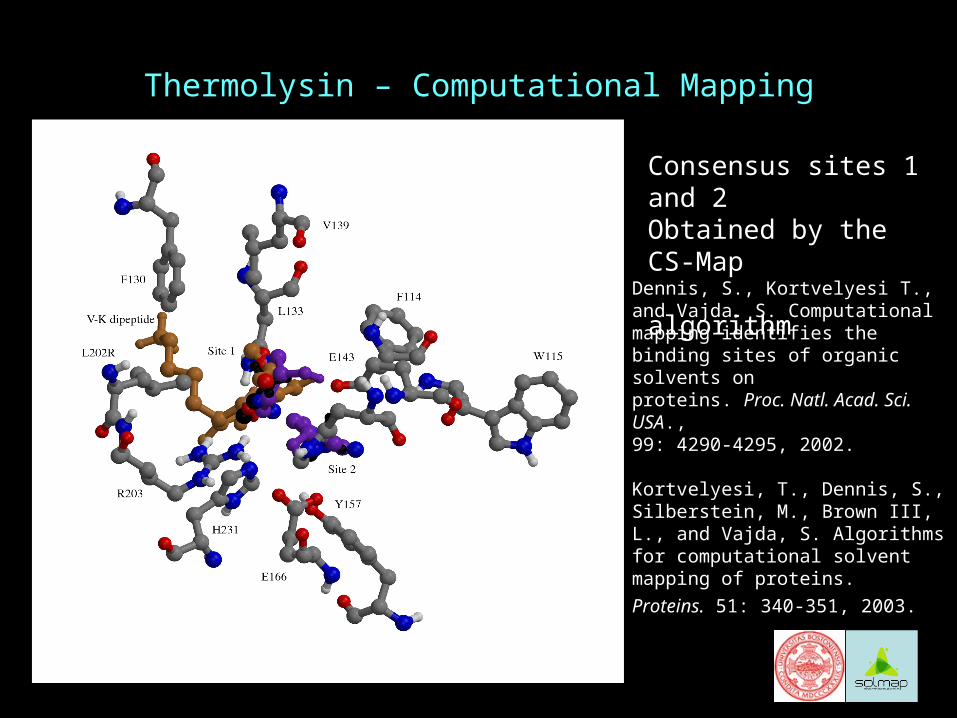
Thermolysin – Computational Mapping
Consensus sites 1 and 2Obtained by the CS-Map algorithm
Dennis, S., Kortvelyesi T., and Vajda. S. Computational mapping identifies the binding sites of organic solvents on proteins. Proc. Natl. Acad. Sci. USA., 99: 4290-4295, 2002.
Kortvelyesi, T., Dennis, S., Silberstein, M., Brown III, L., and Vajda, S. Algorithms for computational solvent mapping of proteins.
Proteins. 51: 340-351, 2003.
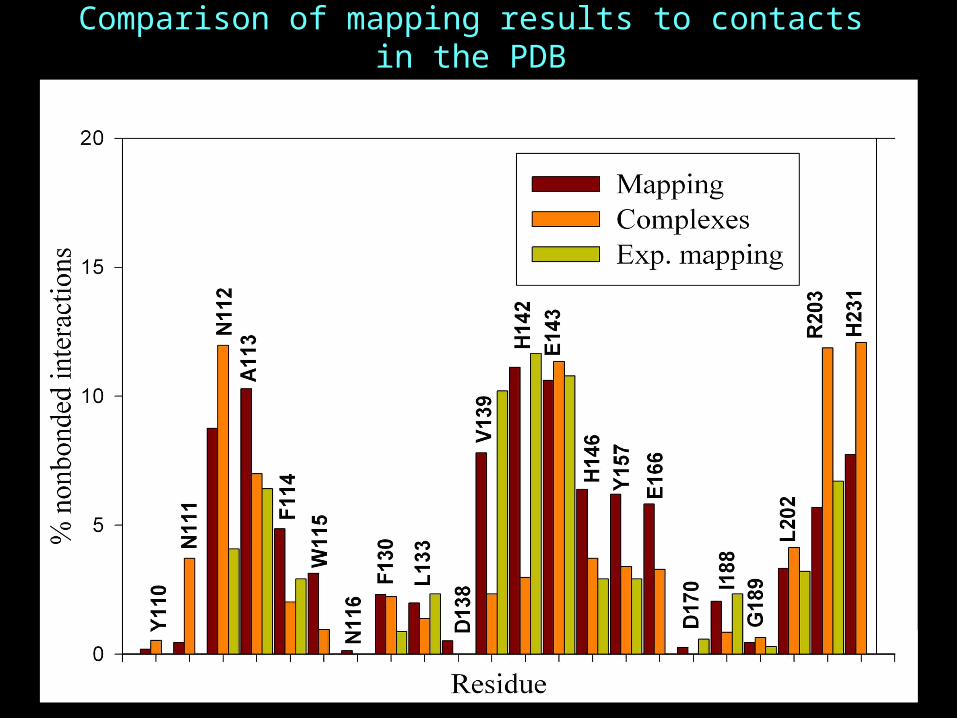
Comparison of mapping results to contacts in the PDB

Hydrogen bonds in thermolysin

Textbook-type representation of H-Bonds
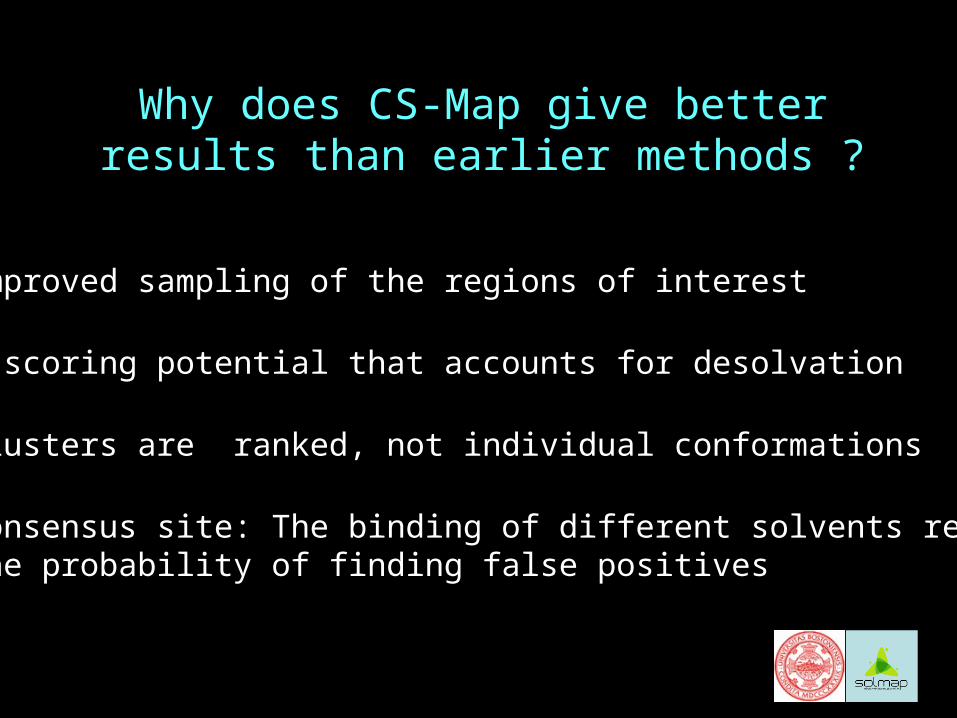
Why does CS-Map give better results than earlier methods ?
1. Improved sampling of the regions of interest
2. A scoring potential that accounts for desolvation
3. Clusters are ranked, not individual conformations
4. Consensus site: The binding of different solvents reducesthe probability of finding false positives

Detection of Hot Spots within Druggable Binding Pockets by CS-Map
• Purpose of study: To determine the predictive power of CS-Map toward the identification of hot spots within a binding pocket
• Comparisons are based on known ligand interactions and NMR data
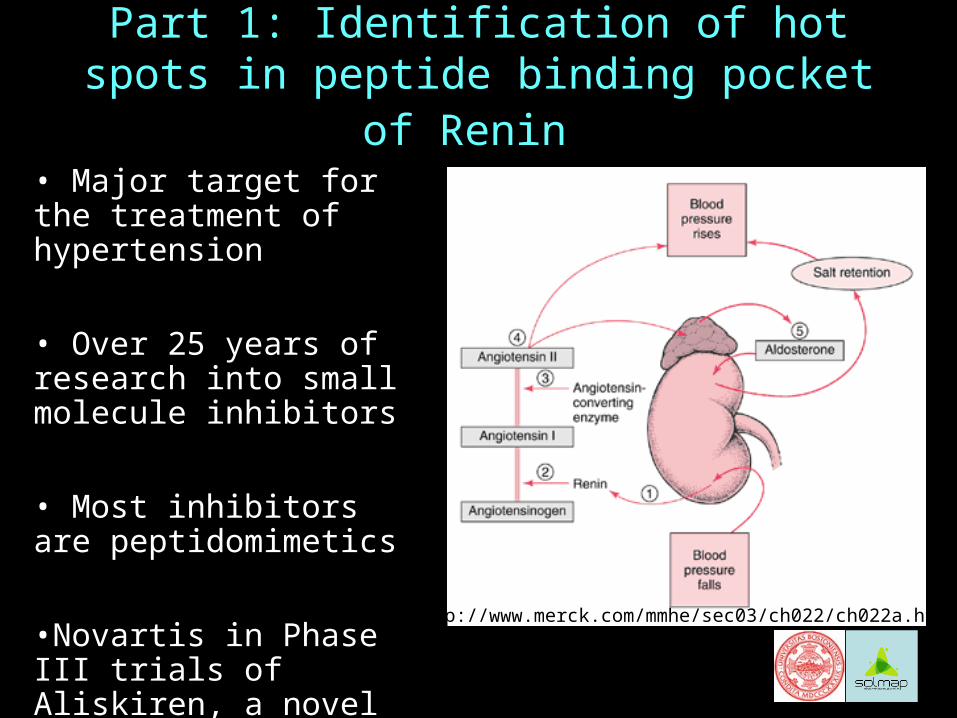
Part 1: Identification of hot spots in peptide binding pocket of Renin
http://www.merck.com/mmhe/sec03/ch022/ch022a.html
• Major target for the treatment of hypertension
• Over 25 years of research into small molecule inhibitors
• Most inhibitors are peptidomimetics
•Novartis in Phase III trials of Aliskiren, a novel non-peptidomimetic renin inhibitor
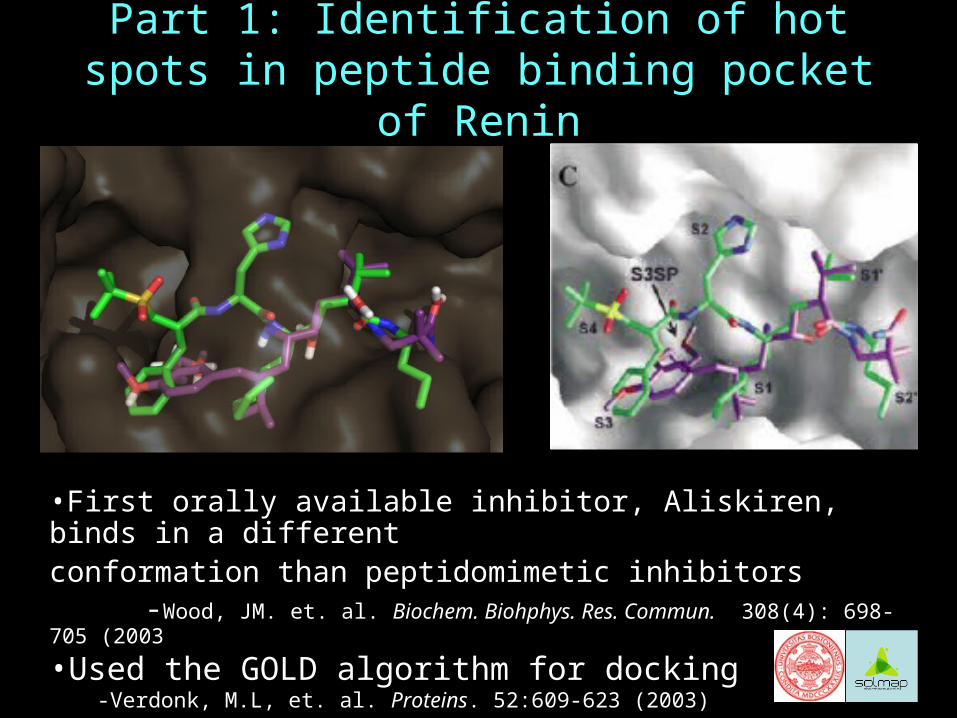
Part 1: Identification of hot spots in peptide binding pocket of Renin
•First orally available inhibitor, Aliskiren, binds in a different conformation than peptidomimetic inhibitors
-Wood, JM. et. al. Biochem. Biohphys. Res. Commun. 308(4): 698-705 (2003
•Used the GOLD algorithm for docking-Verdonk, M.L, et. al. Proteins. 52:609-623 (2003)
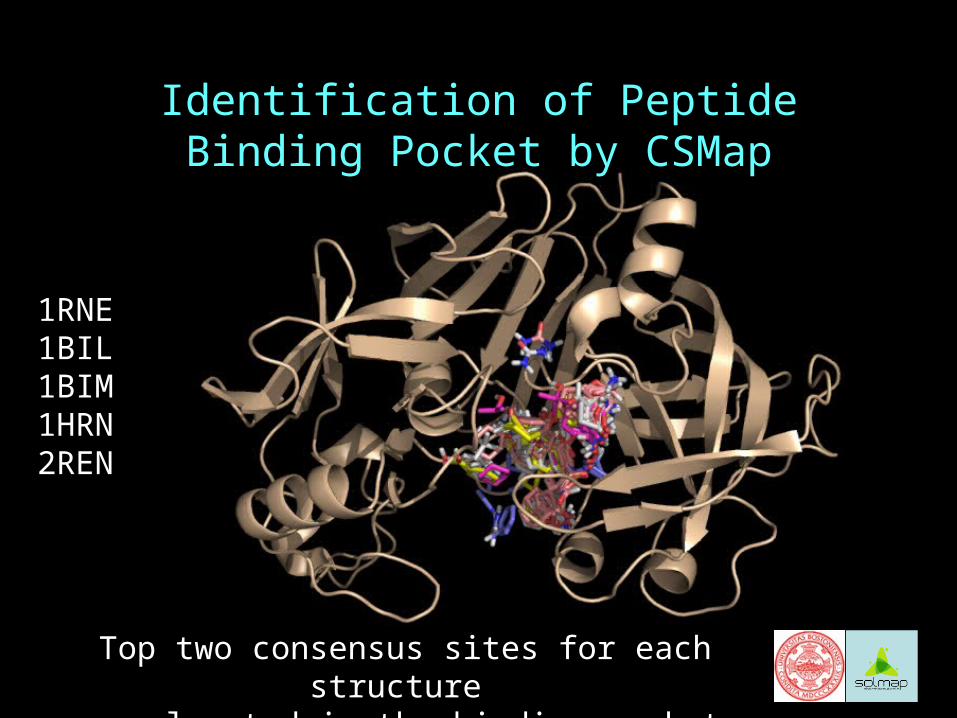
Identification of Peptide Binding Pocket by CSMap
Top two consensus sites for each structure are located in the binding pocket
1RNE1BIL1BIM1HRN2REN
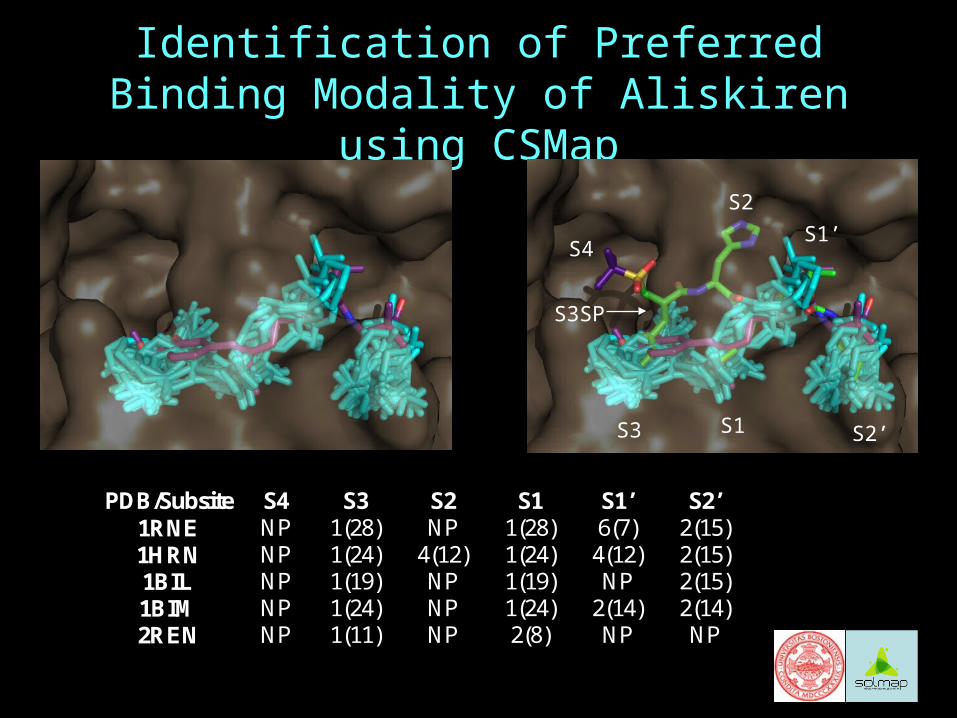
Identification of Preferred Binding Modality of Aliskiren using CSMap
PDB/Subsite S4 S3 S2 S1 S1’ S2’ 1RNE NP 1(28) NP 1(28) 6(7) 2(15) 1HRN NP 1(24) 4(12) 1(24) 4(12) 2(15) 1BIL NP 1(19) NP 1(19) NP 2(15) 1BIM NP 1(24) NP 1(24) 2(14) 2(14) 2REN NP 1(11) NP 2(8) NP NP
S4
S2
S3 S1
S1’
S2’
S3SP
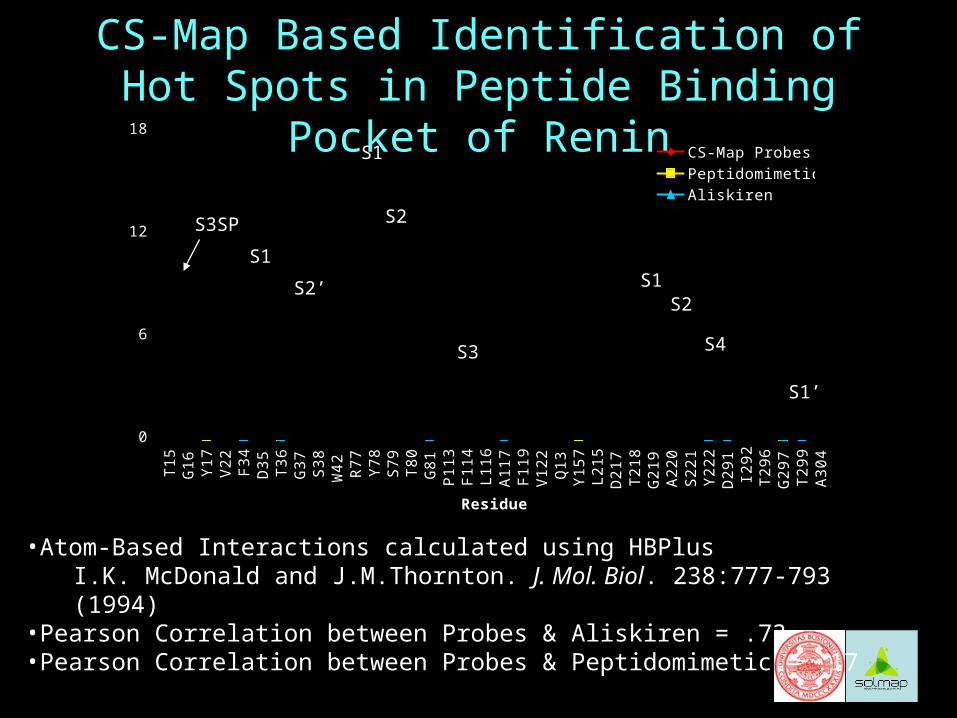
CS-Map Based Identification of Hot Spots in Peptide Binding Pocket of Renin
•Atom-Based Interactions calculated using HBPlusI.K. McDonald and J.M.Thornton. J. Mol. Biol. 238:777-793 (1994)
•Pearson Correlation between Probes & Aliskiren = .73•Pearson Correlation between Probes & Peptidomimetic = .17
0
6
12
18
T15
G16
Y17
V22
F34
D35
T36
G37
S38
W42
R77
Y78
S79
T80
G81
P113
F114
L116
A117
F119
V122
Q13
Y157
L215
D217
T218
G219
A220
S221
Y222
D291
I292
T296
G297
T299
A304
Residue
Perc
en
t A
tom
In
tera
cti
on
s (
%) CS-Map Probes
PeptidomimeticsAliskiren
S3SP
S1
S2’
S1
S2
S3
S1S2
S4
S1’
Conclusions IV
• Mapping results indicate the druggable pockets in the renin active site
• Pockets S2 and S4 are not “hot spots” and should not be targeted.
• The most important pockets are S1 and S3
• Pockets S1’ and S2’ are of intermediate importance, but contribute to the binding.
• Some of these regions, primarily S2’, is not utilized by Aliskiren, suggesting that a higher affinity drug may be developed.
Conclusions: Part 1
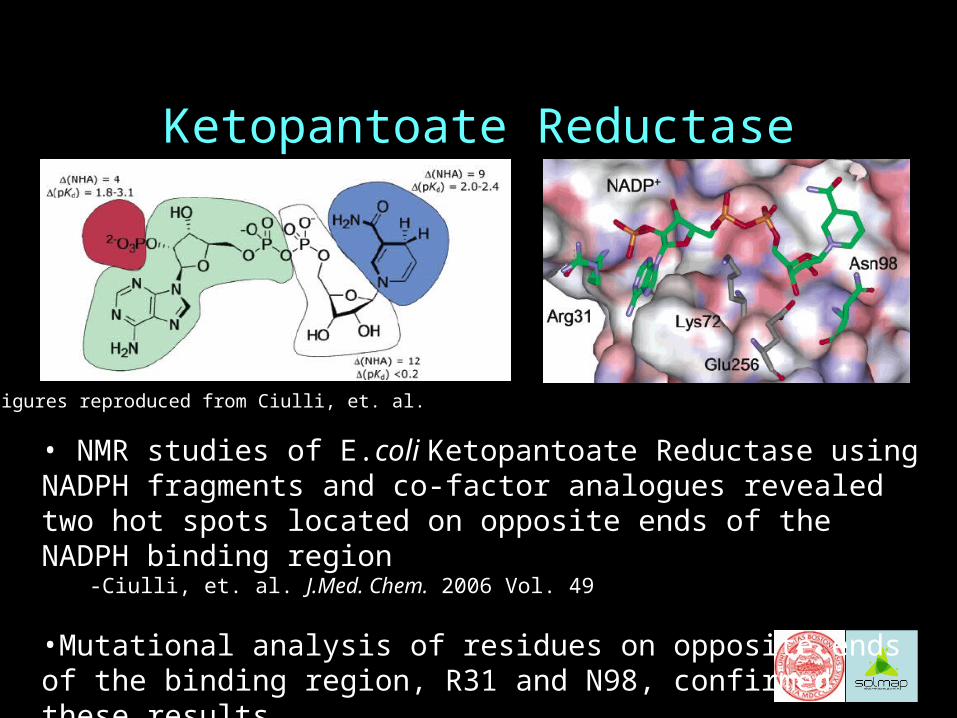
Ketopantoate Reductase
• NMR studies of E.coli Ketopantoate Reductase using NADPH fragments and co-factor analogues revealed two hot spots located on opposite ends of the NADPH binding region
-Ciulli, et. al. J.Med. Chem. 2006 Vol. 49
•Mutational analysis of residues on opposite ends of the binding region, R31 and N98, confirmed these results.
*Figures reproduced from Ciulli, et. al.
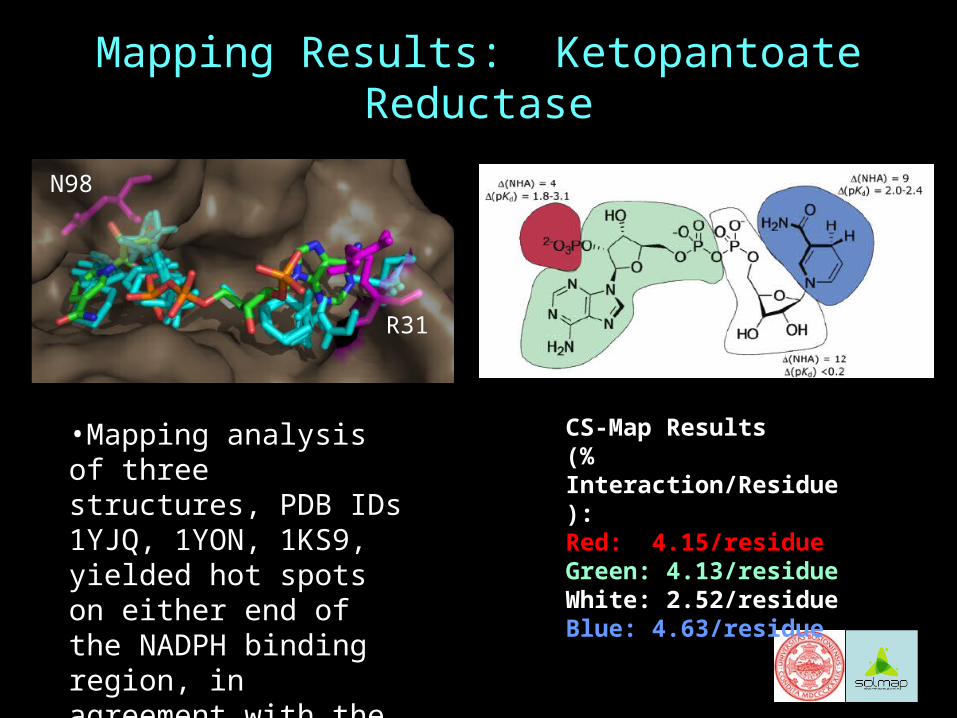
Mapping Results: Ketopantoate Reductase
CS-Map Results (% Interaction/Residue):Red: 4.15/residueGreen: 4.13/residueWhite: 2.52/residueBlue: 4.63/residue
N98
R31
•Mapping analysis of three structures, PDB IDs 1YJQ, 1YON, 1KS9, yielded hot spots on either end of the NADPH binding region, in agreement with the experimental study
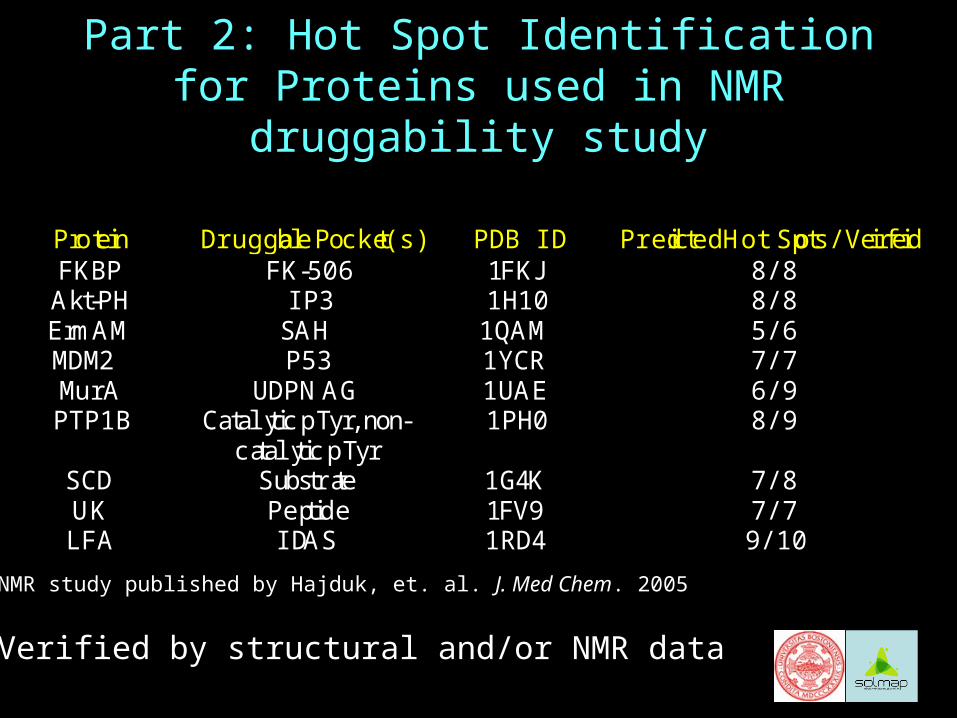
Protein Druggable Pocket(s) PDB ID Predicted Hot Spots/Verified FKBP FK-506 1FKJ 8/8
Akt-PH IP3 1H10 8/8 ErmAM SAH 1QAM 5/6 MDM2 P53 1YCR 7/7 MurA UDPNAG 1UAE 6/9 PTP1B Catalytic pTyr, non-
catalytic pTyr 1PH0 8/9
SCD Substrate 1G4K 7/8 UK Peptide 1FV9 7/7 LFA IDAS 1RD4 9/10
Part 2: Hot Spot Identification for Proteins used in NMR druggability study
*Verified by structural and/or NMR data
NMR study published by Hajduk, et. al. J. Med Chem. 2005
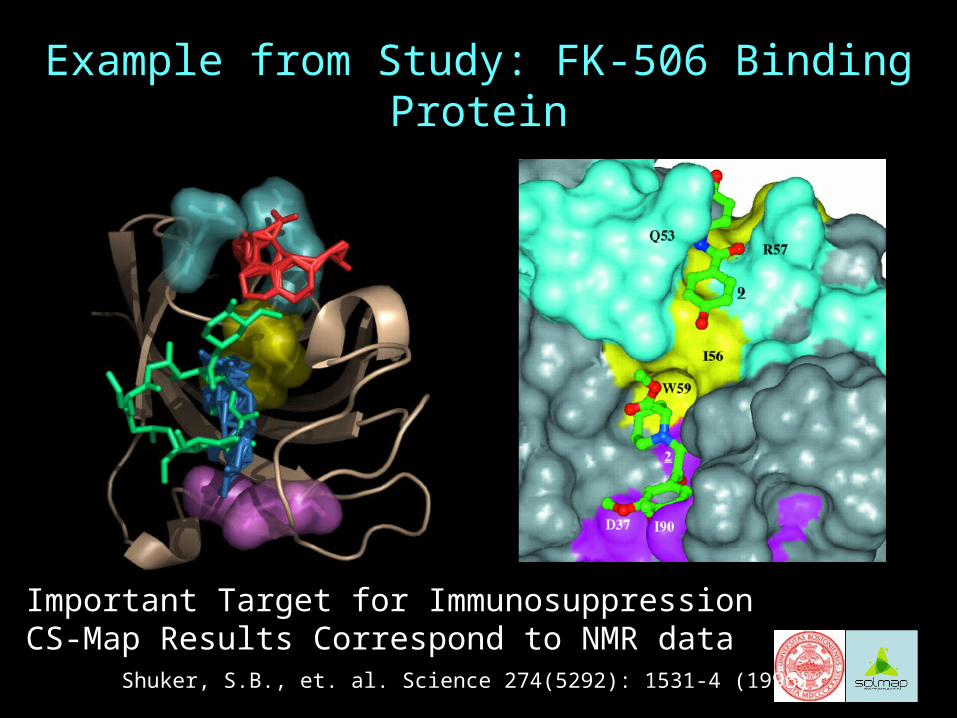
Example from Study: FK-506 Binding Protein
Important Target for ImmunosuppressionCS-Map Results Correspond to NMR data
Shuker, S.B., et. al. Science 274(5292): 1531-4 (1996)
0
3
6
9
12
15
18
Y2
6
G2
8
F36
D3
7
R4
2
F46
F48
Q5
3
E5
4
V5
5
I56
R5
7
W5
9
A8
1
Y8
2
H8
7
I90
I91
L97
F99
Residue
Perc
en
t A
tom
In
tera
cti
on
s (
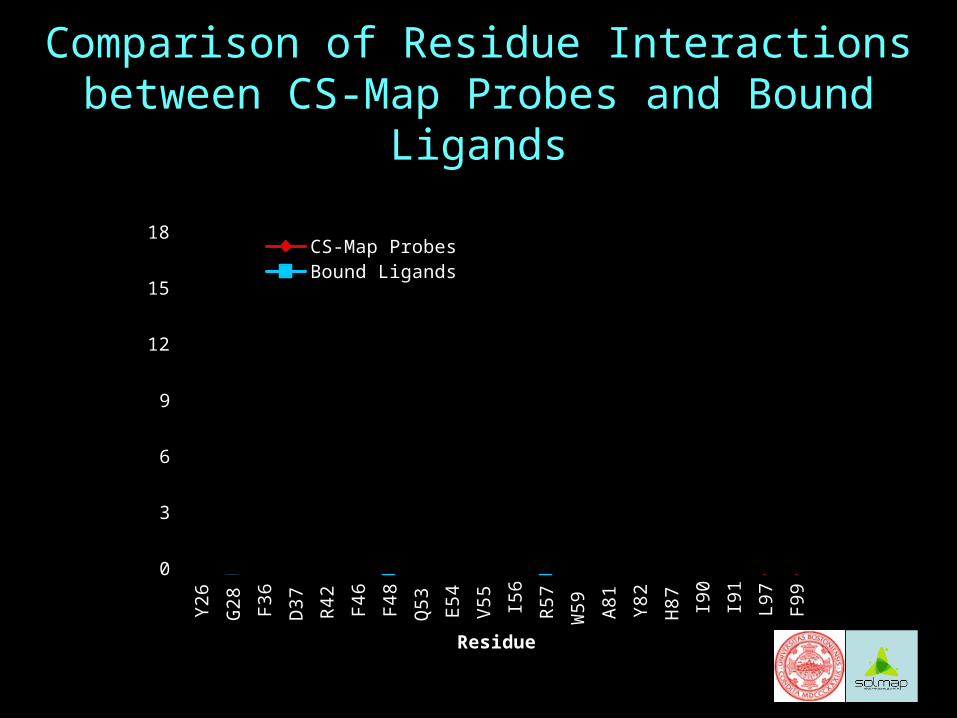
%) CS-Map Probes
Bound Ligands
Comparison of Residue Interactions between CS-Map Probes and Bound Ligands
Conclusions: Part 2
• CS-Map is capable of determining hot spots within binding pockets of druggable proteins, supported both by NMR and structural data
General Conclusions and Future Directions
• The computational prediction of residues important for ligand binding is crucial to structure-based drug design efforts, as well as providing further insight into protein-ligand interactions.
• Future work will focus on the use of CS-Map derived data to predict hot spots on proteins for which no experimental binding data exists, namely to build pharmacophore models of ligand interactions and to predict hydrogen bonding patterns.
Many Thanks
The Vajda Group:Melissa LandonKarl ClodfelterJessamin YuSpencer ThielDavid Lancia, Jr.
SolMap Pharmaceuticals:Frank GuarnieriPatrick Devaney
This work was funded by National Institutes of
HealthSolMap Pharmaceuticals