Embed Size (px)
Citation preview
Identification of direct residue contacts in protein-protein interaction by message passing
Martin Weigt1,2,†, Robert A. White1,3,†, Hendrik Szurmant3,
James A. Hoch3,*, Terence Hwa1,*
1Center for Theoretical Biological Physics and Department of Physics,
University of California at San Diego, La Jolla, CA 92093-0374
2Institute for Scientific Interchange, Viale S. Severo 65, I-10133 Torino, Italy
3Division of Cellular Biology, Department of Molecular and Experimental Medicine,
The Scripps Research Institute, La Jolla, CA 92037
†These authors contributed equally to the study
*Corresponding authors: email: [email protected], [email protected]
Running Title: Message passing identifies protein contact residues
Classification: Biological Sciences: Biophysics & Computational Biology
Key words: protein-protein interaction, mutual Information; co-variance; message
passing; two-component systems
Abbreviations: TCS: two-component signaling; SK: sensor kinase; RR: response
regulator; MI: mutual information; DI: direct information.
Text Pages: 23 pages (title, abstract, main text, references, figure captions)
Character count: 43209 with space (main text, references, figure captions);
Abstract: 236 words or 1729 character with space.
Figures: 3 (all 1 column, heights in cm: 12.17, 5.77, 11.94); equivalent to 5378
characters
Supplemental Material: 8 Figures, 1 Table, Supplemental Text

Abstract
Understanding the molecular determinants of specificity in protein-protein interaction is
an outstanding challenge of post-genome biology. The availability of large protein
databases generated from sequences of hundreds of bacterial genomes enables
various statistical approaches to this problem. In this context co-variance based
methods have been used to identify correlation between amino acid positions in
interacting proteins. However, these methods have an important shortcoming, in that
they cannot distinguish between directly and indirectly correlated residues. We
developed a novel method that combines co-variance analysis with global inference
analysis, adopted from use in statistical physics. Applied to a set of over 2500
representatives of the bacterial two-component signal transduction system, the
combination of covariance with global inference successfully and robustly identified
residue pairs that are proximal in space without resorting to ad hoc tuning parameters,
both for hetero-interactions between sensor kinase (SK) and response regulator (RR)
proteins and for homo-interactions between RR proteins. The spectacular success of
this approach illustrates the effectiveness of the global inference approach in identifying
direct interaction based on sequence information alone. We expect this method to be
applicable soon to interaction surfaces between proteins present in only one copy per
genome as the number of sequenced genomes continues to expand. Use of this
method could significantly increase the potential targets for therapeutic intervention,
shed light on the mechanism of protein-protein interaction, and establish the foundation
for the accurate prediction of interacting protein partners.
\body
Introduction
The large majority of cellular functions are executed and controlled by interacting
proteins. With up to several thousand types of proteins expressed in a typical bacterial
cell at a given time, their concerted specific interactions regulate the interplay of
biochemical processes that are the essence of life. Many protein interactions are
transient, allowing proteins to mate with several partners or travel in cellular space in
order to perform their functions. Understanding these transient interactions is one of the
outstanding challenges of systems biology (reviewed in (1)). The characterization of the
molecular details of the interface formed between known interacting proteins is a
requirement for understanding the molecular determinants of protein-protein interaction,
the knowledge of which may be important for a variety of applications including
synthetic biology, e.g., designing new specific interaction between proteins (reviewed in
(2)), and pharmaceutics, e.g., protein interaction surfaces as novel drug targets
(reviewed in (3)).
Experimental approaches to identify surfaces of interaction between proteins such
as surface scanning mutagenesis and co-crystal structure generation are arduous
and/or serendipitous. Co-crystal structures provide the best molecular resolution but are
particular challenging to obtain for transient interaction partners. In addition,
independent evidence is required to assure that the structure reflects an accurate
picture of the physiologically relevant interaction.
Given the challenges of these experimental approaches, it is clear that the
comprehensive identification of interaction surfaces between a large number of cellular
proteins may be significantly expedited by novel computational methods. Rapid
increase in the number of sequenced bacterial genomes in the past decade (resulting in
more than 700 completed genome projects to date (4)) has fueled the increasing use of
covariance based methods of sequence analysis for protein structure studies: Early on,
these methods were largely applied to single proteins (5-9), e.g., in attempts to provide
insight into tertiary structure. More recently, applications have also been made to
identify interacting residues between proteins (10-13). Co-variance methods rely on the
premise that amino acid substitution patterns between interacting residues are
constrained and hence correlated. To maintain protein function, the acceptance of a
deleterious substitution at one position must be compensated for by substitution(s) in
the residue(s) interacting with it (14). Traditional covariance methods identify interacting
residue position pairs as those exhibiting correlated substitution patterns. Applying this
idea to protein-protein interaction for which the structures of the individual protein
partners are known (11), one would simply look for correlation in substitution patterns
between residues of the interacting partners, and identify the surfaces defined by the
co-varying residues as the interacting surfaces.
However, the covariance approach has a number of shortcomings, which may
significantly affect its predictive power (15). One important problem stems from the fact
that correlation in amino acid substitution may arise from direct as well as indirect
interactions. For example, a substitution in one position of a protein may cause
conformational changes of other residues in the same protein. Such a substitution may
influence the interaction between two proteins without being directly at the interface and
can even occur without being proximal to the interaction surface residue at all. A classic
example of this type is the allosteric effect; but indirect correlations do not require large
conformational changes and may result also from cumulative effects arising from a web
of small direct interactions (see below).
Traditional co-variance methods are unable to distinguish between direct and
indirect correlation. A major focus of the present work is to develop a method to
disentangle these correlations. Our approach is based on two premises: (i) the direct
interactions are contained in the pairs of correlated residues as identified, e.g., by the
covariance method, and (ii) all detected correlations in substitutions are generated by
the set of direct interactions. One strategy to identifying the set of directly interacting
residue positions would be to try out all possible subsets of correlated residue pairs as
direct interactions. A formidable technical challenge with this approach is to work out the
expected statistical correlation generated by a given set of trial direct interactions, since
this itself is a very difficult global optimization problem (as exemplified by the notorious

“spin-glass” problem (16)). This challenge is dealt with here by applying a message-
passing approach (17, 18). In recent years, insights from spin-glass physics have led to
the development of generalized message-passing techniques, which have been applied
successfully to a number of hard combinatorial problems such as K-SAT (19-21).
A further problem for inference is the sparsity of the information to be retrieved. The
interaction surfaces are comprised of only a small subset of residues, each one being in
contact with only a few surface residues of the interaction partner, and only a fraction of
the interacting pairs exhibit covariance. Fortunately, for the many cases where the
monomer structures of the interacting domains are already known, reliable information
on even a limited number of interacting position pairs can already reveal the mode of
interaction. The computational challenge is therefore to extract these few pairings from
the large number of inter-protein position pairs (~104 for typical protein domains) which
constitute a substantial level of background noise.
In the absence of structure information, detection of correlation between variable
positions in interacting proteins therefore requires a large set of homologous protein
sequences with known interaction partners. The number of sequenced bacterial
genomes is soon to approach a number where such data could be extracted from
protein pairs that are ubiquitously found in only a single copy per sequenced genome.
At present however, analyses are still limited to proteins that are highly amplified in
individual genomes.
In this study, we will apply our method to reveal direct interactions within the
prototypical signal transduction system in bacteria, the two-component signaling (TCS)
system, which is highly amplified (~10 per genome on average (22)) in order to regulate
a flurry of adaptive responses to environmental and cellular cues; see (23) for a recent
review. Signal detection is achieved by the sensor histidine kinase (SK) and the cellular
response is mediated by the response regulator (RR), which most commonly is a
transcription factor (24). The signal between the two proteins is passed via the transfer
of a phosphoryl group, from a histidine residue located on the so-called HisKA domain
of the SK to an aspartate residue on the RR (25). The SK and RR proteins are believed
to interact specifically in most cases, and the coupled pairs are often revealed by
adjacency in chromosomal location (reviewed in (26)). Over 2500 such coupled SK-RR
pairs have been identified from ~300 sequenced bacterial genomes, making this system
ideally suited for statistical analysis (11, 12). In addition, a large base of existing genetic
and structural information — including numerous RR (e.g. (27)), two HisKA (e.g. (28))
and an exemplary co-crystal structure (29) — allows for critical evaluation of the results
of statistical sequence analysis.
We present here a detailed two-stage analysis on TCS proteins. The covariance
method is first used to identify the correlated residues, followed by a statistical message
passing approach to infer direct coupling between pairs of residue positions. Our
method distinguishes interacting residues from non-interacting ones for both SK/RR
hetero-dimer and RR/RR homo-dimer interactions, with vastly improved accuracy from
MI-based method without using any ad-hoc tuning parameters. We propose that this
method will be applicable for general protein interface determination given a sufficient
number of homologous protein sequences, a requirement that should soon be met by
proteins present at a single copy per genome.
Results and Discussion
Detection of constrained positions in interacting proteins
A multiple sequence alignment of M = 2546 homologue pairs was constructed for the
HisKA domain of the SK and its partner RR domain by aligning with the respective
hidden Markov models (see Methods). In the resulting database, chromosomally
adjacent SK and RR sequences are concatenated to single sequences
Aa
= (A1a ,A2
a,...,ANSK +N RR
a ) for a =1,...,M such that positions i =1,...,NSK with NSK = 88
correspond to the HisKA domain of SK, and i = NSK +1,...,NSK + NRR with NRR = 124 to the
RR domain. Alignment gaps are included as a separate letter, so entries A may assume
21 different values. Frequency counts fij(Ai,Aj) are introduced for the joint appearance of
amino acids Ai, Aj in each intra- and inter-domain pair of positions i and j, and fi(Ai) for
each single position i.
To identify correlated positions between the SK and RR proteins of the TCS system,
every position in the SK was compared with every position in the RR, and their mutual
information (MI) was evaluated. This raw MI was corrected for finite-sample size effects
by subtracting the average MI in a null model; see (11) and Supplementary Text. The
resulting MI between positions i and j, MIij = MIij(raw) – MIij(0), allows for comparison of
different pairs with respect to the statistical correlation of their amino-acid occupancies.
Unconstrained position pairs are expected to have values close to zero.
The value of the score introduces a ranking of all pairs of positions between the two
proteins. The histogram of scores allows for the self-consistent introduction of a
threshold of MI(t) separating relevant mutual information from an exponential
background signal (Supp. Fig. S1). We find 32 correlated position pairs with MI > MI(t).
These pairs, involving 12 SK positions and 12 RR positions (listed in Supp. Fig. S2)
constitute the starting point of our analysis. As will be shown below, the main results are
nevertheless insensitive to the precise value of MI(t) used. Also, very similar results (not
shown) are obtained when using other local pair-correlation measures, as e.g. a chi-
squared test if residue frequencies in interacting and non-interacting protein pairs are
drawn from the same distribution (13) and a likelihood ratio of the data under a
correlated and a factorized model (12). Both measures identified almost the same
pairings between the positions of the SK and RR domains as the high MI pairs (Fig. S2),
and comparable even if slightly shuffled sets of high-ranking position pairs.
Disentangling direct from indirect couplings
The statistically correlated pairs are candidates for positions in contact at the
protein-protein interface. However, statistical correlation does not automatically imply
strong direct interaction. Imagine that position i is coupled directly to j, and j to k. Then i
and k will also show correlation, without being directly coupled. The effect may become
even more pronounced if there are multiple paths of weak couplings connecting i and k.
A strong correlation may emerge without the existence of any strong direct coupling
linking these positions to any other residues position.
The MI score introduced above is a local one, in that it considers only one residue
pair at a time, and compares different pairs only at the end after scores are determined.
This approach is therefore unable to disentangle direct from indirect couplings; the
same is true for other local approaches, e.g., Refs. (12) and (13). To circumvent this
problem, we infer a global statistical model P(A1,...,ANSK +N RR) describing the joint
probability of the concatenated SK and RR sequence (A1,...,ANSK +N RR) . This statistical
model is required to satisfy two key conditions:
(i) It has to be consistent with the statistics of the data up to the level of residue
pairs, i.e. the marginal distributions of the model for one or two positions have to
coincide with the frequency counts fi(Ai) and fij(Ai,Aj) introduced above:
Pij (Ai , Aj ) = P(A1,..., AN ){Ak |k ≠ i, j}∑ ≡ fij (Ai , Aj ). [1]
This condition has to hold for all intra- and inter-protein pairs of positions (i,j),
i, j = 1,..., NSK + NRR . Note that in principle higher correlations of three or more positions
can be included in a similar way. However, the size of the available data set does not
allow for going beyond two-residue correlations. The 21×21 elements of fij(Ai,Aj) have to
be estimated from the M=2546 sequences in the database; frequency counts for more
than two positions would be very imprecise due to insufficient sample size.
(ii) To avoid over-fitting, the model has to show as few parameters as possible to
meet condition (i). Application of the maximum-entropy principle yields the simplest
possible (i.e. least constraint) model satisfying these conditions (30):
P(A1,..., AN ) =1Z
exp − eij (Ai , Aj ) + hi (Ai )i∑
i< j∑
⎧⎨⎪
⎩⎪
⎫⎬⎪
⎭⎪ [2]
Model parameters are direct couplings eij (Ai,A j ) between amino acid Ai in position i
and amino acid Aj in position j, and local biases hi(Ai) describing the preference for
amino acid Ai at position i. Determining these parameters to meet Eq. [1] is an
algorithmically hard task, and can be achieved using a two-step procedure. All technical
details are explained in the Supplemental Text:
1. Given a candidate set of model parameters, single- and two-residue
distributions Pi(Ai) and Pij(Ai,Aj) are estimated from Eq. [2]. This is
computationally expensive, the exact summation over all possible protein
sequences would require O(21N-2N2) steps. Approximations can be achieved
by MCMC sampling – which is expected to be very slow for 21-state variables
– or more efficiently by a semi-heuristic message-passing approach (31). We
use the latter approach; it reduces the computational complexity to O(212N4).
2. Once all Pij(Ai,Aj) are estimated, we can use gradient descent to adjust the
coupling strengths eij(Ai,Aj) (the hi(Ai) can be treated in a more efficient way
explained in the Supplementary Text):
eij(new) (Ai , Aj ) = eij
(old ) (Ai , Aj ) + Δ[ fij (Ai , Aj ) − Pij (Ai , Aj )] [3]
This equation can be derived variationally within a Bayesian approach, it
maximizes the joint probability of the data under Model [2], cf. Supp. Text.
Since this probability is convex, it is guaranteed to converge to a single global
maximum.
These two steps are iterated until Eq. [1] is satisfied within user-given precision. In the
inferred model, matrices eij(Ai,Aj) describe the direct coupling between residue positions
i and j. To compare different position pairs, we propose a scalar measure of the
coupling strength. For technical reasons (invariance with respect to gauge symmetries
of Model [2] and robustness with respect to a pseudo-count introduced to regularize
inference, cf. Supp. Text) a quantity called direct information (DI) is introduced. It
measures the part of the mutual information of a position pair, which is induced by the
direct coupling. Intuitively, it can be understood as the mutual information in a two-
variable model for positions i and j only, which has the correct statistics of the amino
acid occupancy of single positions, and coupling eij(Ai,Aj) in between. The full technical
definition is given in the Supp. Text.
Due to the scaling of the algorithmic complexity, the method cannot be applied
simultaneously to all 212 positions of the protein alignment. Therefore the 60 positions
of the protein alignment being involved in the 140 highest MI-ranking pairs (containing
the 32 candidates for contact pairs identified before) are selected. The results are
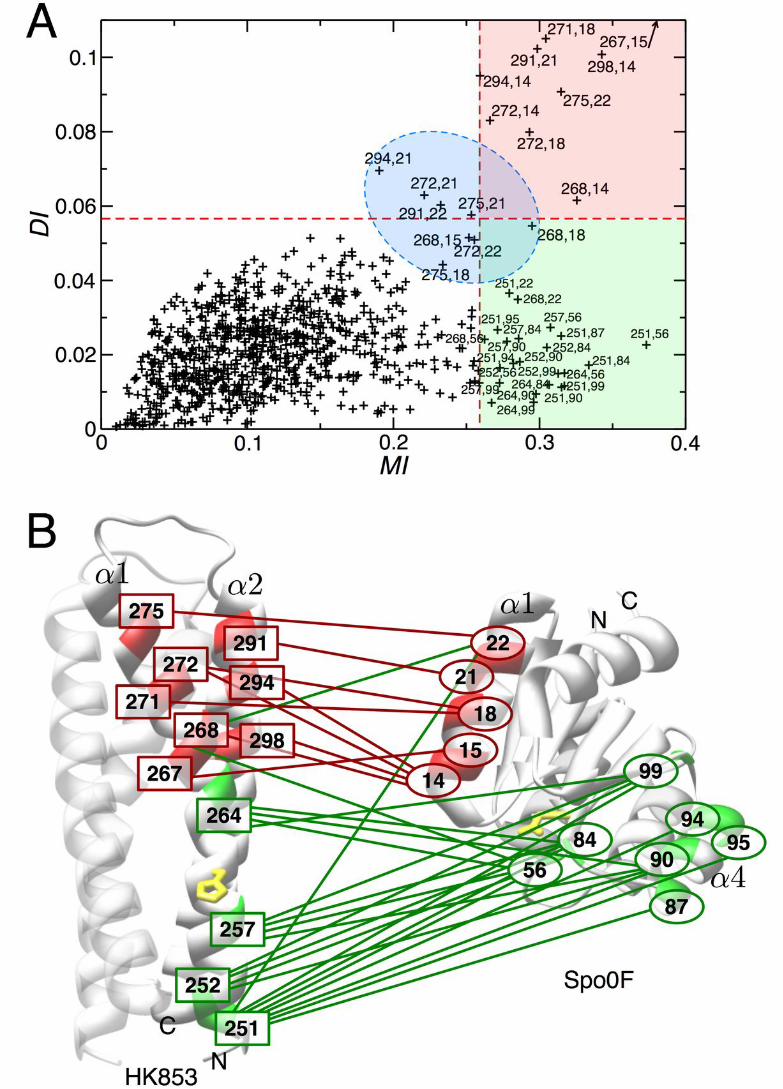
shown in Fig. 1A as a scatter plot of the full mutual information MI versus its direct
contribution DI for the 1770 considered position pairs (i,j). We observe that low MI
implies low DI (lower left quadrant of Fig. 1A), but high MI does not necessarily imply
high DI. DI can thus be used to rank the 32 potential links previously identified by MI.
This distinction allows us to identify two groups of position pairs:
Group I: This group, including the 9 pairs in the red quadrant in Fig. 1A, has both high MI and large direct coupling DI. It connects 8 SK positions with 5 RR positions. The strong links there are expected to represent physical interactions, i.e. direct contacts in the interface of the SK/RR dimer. Group II: This group, including the 22 pairs in the green quadrant in Fig. 1A, is densely connected by weak direct couplings (i.e. low DI). High MI between these pairs emerge from the cooperation of a multitude of such weak links. The second group contains 4 SK and 7 RR positions. They would not be expected to be in direct contact in the dimer, but instead might have a collective influence on the functionality of the SK/RR phospho-transfer interaction. An additional set of 8 pairings (including one of the 32 high-MI pairs) are found just
below the thresholds set for MI and/or DI. This group lies in the blue zone in Fig. 1A. It
is expected to contain both, direct contact pairings and a few distant pairs.
The network defined by these residue pairs is shown in Supp. Fig. S2. Note that it
contains many loops, so it cannot be found by dependence-tree based inference
methods (as used in (12)). Its structure is found to be robust with respect to the precise
details of the algorithm: The values of DI as inferred from half of the data set almost
coincide with the values as inferred from the full data set; a slightly smaller but similar
degree of coincidence is found if two disjoint half-size data sets are used (Supp.
Fig. S3). In particular the high-scoring DI values are well reproduced.
Even though for each species only one sequenced strain was included in the
database, sampling biases due to phylogenetic relations between the sequenced
species exists. To evaluate whether DI values are sensitive to this phylogentic
misdistribution, a reweighting procedure for potentially oversampled regions in
sequence space is introduced: For each interaction SK/RR pair Aa , the number na of
sequences having more than 80% sequence identity with Aa is determined, and the
contribution of Aa to the frequency counts fi and fij is assigned factor 1/(na+1). Global
model inference is applied to determine DI. The ranking by modified DI is found to
reproduce the original ranking: In between the 10 highest-ranking position pairs, one
finds 10 common pairs, in between the first 20 pairs 17, in between the first 30 ranks 25
common position pairs are found (Supp. Fig. S4). Only for reweighing with respect to
60% sequence identity did part of the information get modified (not shown). This result
illustrates that sampling has only small effects on the power of the proposed inference
method in predicting contact pairs in interacting protein domains.
The interaction surface of the SK/RR phospho-transfer interaction
The validity of the above sequence-based predictions can be tested utilizing
structural representatives of the SK HisKA domain (HK853 of Thermatoga maritima;
PDBID: 2C2A (28)) and of the RR domain (Spo0F from Bacillus subtilis; PDBID: 1PEY
(32)) as well as the co-crystal structure of Spo0F in complex with phospho-transfer
protein Spo0B, both part of the sporulation phospho-relay in B. subtilis (PDBID: 1F51
(29)). Phospho-transferase Spo0B is a protein evolutionary related to the SK and
features strong structural similarity, but is distinct in primary sequence (see below).
The HisKA domain exists as a homodimer of two helical hairpins, which form a four-
helix bundle. The conserved histidine residue (phospho-donor for the RR) lies on the
α1-helix and faces away from the homodimer core. Using HK853 numbering (Fig. 1B),
this residue (yellow) is at position 260. Roughly 20 residues downstream of H260 is a
hairpin turn that terminates the α1-helix and initiates the α2-helix that runs anti-parallel
to the α1-helix. Positions of strong directly coupled residues (Group I) predicted to form
direct contacts are 267, 268, 271, 272, 275 on the α1-helix and 291, 294 and 298 on the
α2-helix, indicated by the red boxes in Fig. 1B. They are all found C-terminal to the
active site histidine, in the vicinity of the hairpin and are exposed to the exterior of the
four-helix bundle.
The RR domain forms an α/β-fold consisting of a 5-stranded β-sheet surrounded by
5 α-helices with the catalytic aspartate (receptor in phopho-transfer) nestled on the
surface of one face of the fold, at position D54 using Spo0F numbering (indicated in
yellow). Group I residue positions are 14, 15, 18, 21 and 22, as indicated by the red
ellipses in Fig. 1B. These are all situated on the α1-helix and exposed to the exterior of
the RR domain.
SK residue positions belonging to the high MI but low DI Group II are 251, 252, 257,
264 (green boxes in Fig. 1B). Residue positions 257 and 264 are on the same face of
the helix as the phosphorylatable histidine residue one turn N- or C- terminal,
respectively. Positions 251 and 252 represent partially buried residues located at the
base of the four-helix bundle. RR residue positions belonging to Group II are 56, 84, 87,
90, 94, 95 and 99 (green ellipses); all but one (residue 56) are localized in or around the
α4-helix.
Mapping these coupled positions to the exemplary individual structures, it becomes
clear that Group I pairings (red lines in Fig. 1B) define a mode of spatial interaction
between the α1 and α2-helices of the SK and the α1-helix of the RR, bringing close
together the catalytic site residues. It is, however, impossible to spatially align also the
Group II residue positions (green lines in Fig. 1B), consistent with the notion that these
do not present direct interactions according to their DI ranking. [The high MI values of
Group II pairings likely reflect a dynamic role of these residues in arranging the active
sites for phosphotransfer (33).]
The precise interaction mode predicted by Group I coupled pairings is revealed by
the Spo0B/Spo0F co-crystal structure (29), which provides a structural example to
measure the distances of most coupled residues (see Supp. Fig. S5 for a structural
representation as well as detailed data on residue pair distances)1. All co-varying
residues of Group I that can be mapped to the Spo0B structure are located in close
proximity (≤ 6Å) at the interaction surface between Spo0B and Spo0F. Additionally, 5
out of 6 pairings that just miss the set thresholds for DIij and/or MIij depicted in the blue
zone in Fig. 1A are also within 6Å of each other.
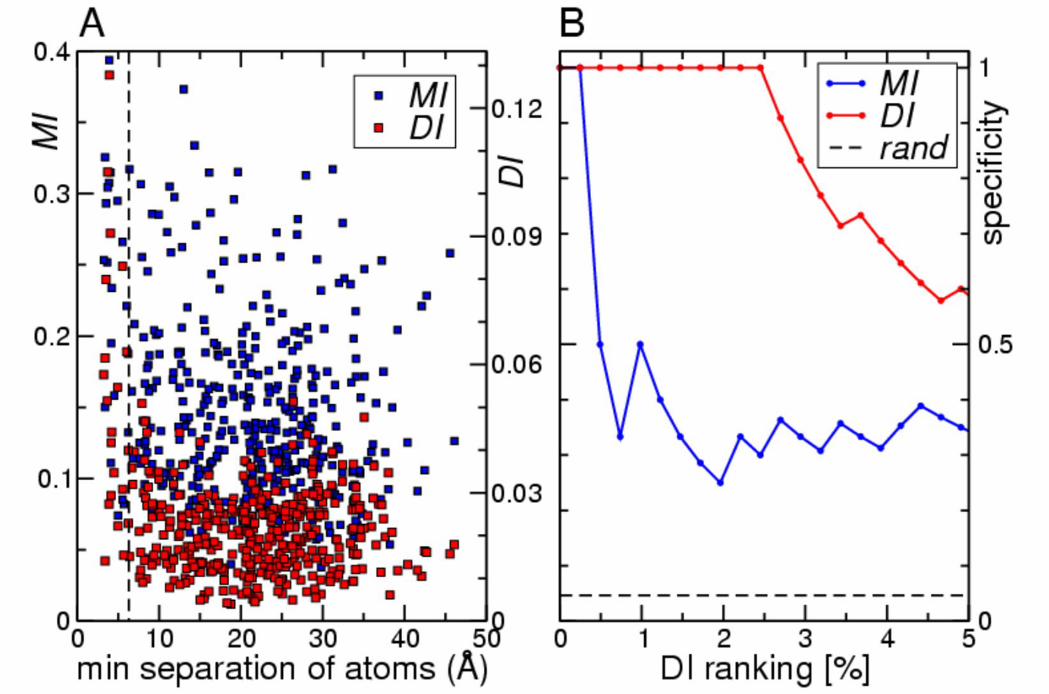
From the scatter plot of the distance between a pair of residues against their DI and
MI for the 408 position pairs matched to the co-crystal structure (Fig. 2A), the DI values
(red symbols) are clearly seen as anti-correlated with distance. Almost all strong direct
interactions correspond to short distances. Contrary, no strong correlation is observed
between the distance and the MI values (blue symbols) alone. To be more quantitative, 1 Despite significant structural homology, sequence homology between the Spo0B interaction domain and the HisKA domain is poor (E = 0.5 for HMM match to Spo0B) and only SK residues on the α1-helix can be reliably matched to Spo0B.
pairings were ranked according to their DI or MI values, and specificity (defined as the
fraction of pairings with a minimal distance of less than 6 Å) was displayed as a function
of scoring rank percentile (Fig. 2B). Whereas MI (blue line) produces the first false
positive after only one true positive and rapidly drops to specificities of 30-40%, DI (red
line) amazingly maintains specificity one for the top 2.5% of the 408 scoring pairs (=10
true positives).
It can then be concluded that the combination of covariance and message passing is
capable of identifying direct surface interactions from sequence data alone and that DI
is a much better indicator of proximity of residues than MI. This is particularly important
in instances where no clear overrepresentation of high MI scores can be observed. In
those instances the DI ranking alone can be used to infer proximity.
The interaction surface of RR homodimers
Many proteins perform their function in bacteria as homo-oligomers, an example
being transcription factors. Identifying their interaction surface poses considerable
problems beyond the ones discussed above: statistical couplings of residue positions
can result both from the role of a pairing as a residue contact inside the monomer
structure, and as an inter-monomer contact. It is not a priori clear that both mechanisms
lead to comparable statistical correlations, i.e. that both of them can be simultaneously
detected in analyzing large sample sets of dimer-forming proteins. Even if found to be
comparable, there is no intrinsic way to distinguish intra- and inter-monomer contacts:
Only the knowledge of the monomer structure allows selecting candidate pairs for the
interaction surface. On the other hand, the simultaneous detection of both types of
statistical coupling would aid other methods in predicting tertiary and quaternary
structures.
To test what kind of pairings are detectable, the global inference approach was
applied to probe RR/RR interactions. Significant experimental support for a
phosphorylation-dependent dimerization that increases transcription factor-DNA affinity
in the largest class of RR proteins, the OmpR/PhoB class, has previously emerged (34).
For probing of couplings within the phospho-transfer domains of RR proteins, the
database construction was hence limited to proteins that contain both a RR phospho-
transfer domain and a DNA binding domain of the OmpR/PhoB class (see Methods).
This search and alignment procedure identified more than 2000 proteins. MI scores
were calculated for the 123x124/2 possible combinations of RR/RR pairings. The
distribution plot of MI scores does not result in a clear anomalous tail (not shown),
unlike what was observed for the SK/RR analysis (Supp. Fig. S1). Message passing
was applied to calculate DI values for all pairings of the 60 positions contained in
maximual MI scores, and the results were ranked according to their DI values (see
Supp. Table S1 for the top 60 entries).
To evaluate the meaning of these DI rankings, the minimal atom distances of all
pairs were determined utilizing three structural examples of OmpR class RR; those of
Escherichia coli ArcA (PDBID: 1XHE (27)), PhoP (PDBID: 2PKX (35)) and
Streptococcus pneumoniae MicA (PDBID: 1NXW (36)). For illustration, the 15 top-
ranking pairs (excluding 3 pairs that were proximal in primary sequence) were mapped
onto the ArcA structure (Supp. Fig. S6). As for the SK/RR analysis, a strong correlation
between DI and minimal atom distance emerged (Supp. Fig. S7A), and the majority of
the 60 top-scoring pairs (Supp. Table S1) are in close proximity within the monomer
structures (i.e., within 6Å). Four dimer contacts are also identified (ranks 1, 3, 26 and
40). False positives (i.e. pairings with distances over 6Å) do not emerge until rank 24
and remain sparse within the top 60 pairs2. Quantification of specificity was determined
as for the SK/RR analysis and demonstrates again that DI impressively enhances the
predictive power over MI alone (Supp. Fig. S7B).
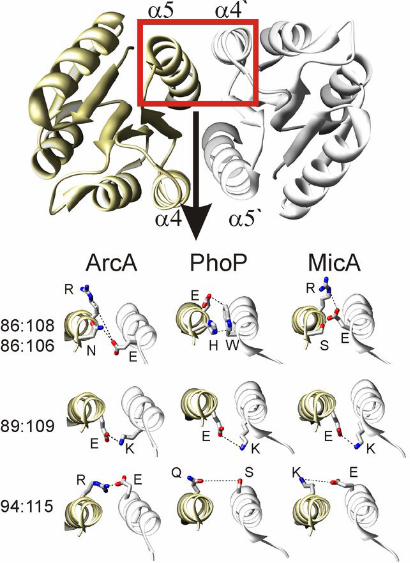
When mapping the four dimer contacts onto the three structural examples, it
becomes apparent that the interactions formed by some individual contact residues are
quite diverse (Fig. 3). The cluster involving pairings3 86:106 and 86:108 demonstrates
nicely the type of residue variation that is the foundation of the covariance-based
method: As shown in Fig. 3, a salt bridge is formed between E86 and R108, and a
2 Interestingly all false positives within the first 60 pairs include residues localized to the α-1 helix. A rational for the occurrence of these apparent false positives is given in the caption to Supp. Table S1. 3 ArcA numbering used throughout for clarity; for accurate MicA and PhoP numbering, deduct 2 from the ArcA numbering.
hydrogen bond connects E86 and S106 in the MicA structure. In PhoP, an aromatic
stacking interaction between a tryptophan and a histidine residue (W86 and H106) can
be observed. The ArcA dimer is stabilized by a hydrogen bond between E86 and N106;
an additional interaction (salt bridge) is predicted between E86 and R1084. Similar
variations exist in the pairing of residues 94 and 115, while the pairing between residues
89 and 109 is always a salt bridge between E and K. Of course, the appearance of the
pair 89:109 in the high DI list shows that E:K is not the conserved pairing between these
positions among all RRs, but only one of the popular residue pairings at these positions
(see Supp Fig. S8). Information derived from such analysis may be exploited to design
synthetic RR molecules with various degrees of cross talk with the endogenous system.
In summary, inter and intra monomer contacts lead to comparable statistical
correlations. DI calculations provide constraints that could aid de novo structure
prediction when applied to a single protein, or aid the verification or prediction of
quaternary structure in cases where the monomer structure is available.
Concluding Remarks
A novel computational method was introduced to infer structural details of protein-
protein interactions based on primary sequence information. The method takes
correlated residues from the covariance analysis as a starting point, and distangles
correlations arising from direct vs. indirect interactions using a global inference
approach implemented by a message-passing algorithm. The combination of
covariance analysis and global inference impressively enhances the specificity of
contact pair prediction as compared to more traditional, purely local covariance-based
approaches (e.g. MI). Currently, the applicability of the method relies on the existence of
~10 structurally homologous protein sequences contained in a typical bacterial genome,
due to the still limited number of sequenced genomes. With rapidly expanding genomic
databases — including genes obtained via shotgun sequencing of environmental
4 The possible E86-R108 salt bridge is not realized in the ArcA structure due to a likely crystallographic artifact. In the crystal lattice, residue R108 forms a salt bridge with an aspartyl residue in a neighboring ArcA dimer, a contact not available in solution (not shown).
samples by the emerging field of metagenomics (reviewed in (37)) — the sample
number should soon not be a limiting factor for the large majority of proteins that exist in
a single copy in a genome, as long as they are widely occurring across the bacterial
species.
The molecular details of the protein-protein interaction revealed may yield a large
number of potential targets for antibiotic drug design in the absence of precise structural
information. More broadly, the method of disentangling direct and indirect interactions
presented here may also be valuable in aiding the interpretation of correlations
observed in other large biological data sets, including mRNA and protein profiles, and
neuronal spike activities.
Material and Methods
Database construction
Domains were aligned and culled from the non-redundant refseq database (release 19)
(38) using HMMER (39). Only genomic data from unique species were included to avoid
over-sampling of organisms with multiple sequenced strains in the database. Two
overlapping sets of interacting domains, as defined by hidden Markov models (HMMs)
in the Pfam database (40), were used in this study. For the SK/RR interaction study the
accession numbers for the respective HMMs were PF00512 (SK) and PF00072 (RR).
Functional association of these domains is inferred from chromosomal adjacency
determined by GI numbers that differ by 1. For the RR/RR interaction the set of all
proteins containing a PF00072 domain was restricted by requiring that the proteins also
posses a specific DNA binding domain homologous to the OmpR-C domain (accession
number PF00486). All HMM searches used are detecting complete domains (in contrast
to a search for fragments of domains).
Mutual information (MI) calculation
MI was measured as previously described (11); see Supp. Text for a review.
Message passing
The computationally hard task in the suggested global inference is the estimation of
marginal distributions for single positions and pairs of positions in the sequence
alignment. We used the computationally efficient but semi-heuristic message passing
approach (17, 18). This approach would be exact on tree-like graphs of couplings
between positions, but it is known to work efficiently also for loopy graphs. The standard
formulation of message passing in terms of belief propagation (17, 18) estimates only
single-variable marginal distributions Pi(Ai). For estimating also two-variable
distributions Pij(Ai,Aj) a recently proposed extension called susceptibility propagation
(31) is used. Technical details are extensively exposed in the Supp. Text.
The computational cost of the approach is O(212N4) and therefore not feasible for
the full amino-acid sequences having N = 212 positions. Using a cutoff in MI, a subset
of up to ca. 60 positions involved in high MI values is selected, and all pairs of these
selected positions (intra- and inter-protein pairs) are considered. The inference of the
parameters of the reduced model requires about 4 days of computational time on a
single CPU of Dell dual quad-core 2.33GHz Xeon processor. A selection of 100
residues would require more than one month of computation. However, smaller residue
sets (N=32,40,50) demonstrate that the qualitative results given in Results and
Discussion do not depend on the choice of the MI cutoff, as soon as all nodes contained
in the network of coupled residues of Fig. 3 are included (not shown).
Direct information
In the inferred statistical model, the direct information
DIij = Pij(dir ) (Ai , Aj ) ln
Pij(dir ) (Ai , Aj )
fi (Ai ) f j (Aj )Ai ,Aj
∑ [4]
is calculated using the contribution Pij(dir)(Ai,Aj) of the direct coupling eij(Ai,Aj) between
sequence positions i and j to the two-residue distribution. This contribution can be
calculated in a hypothetical system containing only the two positions i and j: They are
coupled by eij(Ai,Aj) and have the correct single-variable marginals fi(Ai) and fi(Aj). DI
measures the direct coupling strength between i and j, see the Supp. Text for a
mathematical definition of Pij(dir)(Ai,Aj).
Acknowledgements
We wish to thank J. Cavanagh, U. Gerland, M. Mezard, A. Pagnani, E. van Nimwegen
and I. Zhulin for discussion, and A. Beath for careful reading of the manuscript. MW and
RAW are grateful to the hospitality of the NSF sponsored Center for Theoretical
Biological Physics (Grants No. PHY-0822283) at UCSD where this research was
initiated. This work was supported in part by the NIH through grant GM019416 to JAH
and by a grant from the NAS/Keck futures initiative to TH. RAW additionally
acknowledges the support of an NSF postdoctoral fellowship (DBI-0532925).

References
1. Cusick, M. E., Klitgord, N., Vidal, M. & Hill, D. E. (2005) Interactome: gateway into systems biology. Hum Mol Genet 14 Spec No. 2, R171-81.
2. Kortemme, T. & Baker, D. (2004) Computational design of protein-protein interactions. Curr Opin Chem Biol 8, 91-7.
3. Wells, J. A. & McClendon, C. L. (2007) Reaching for high-hanging fruit in drug discovery at protein-protein interfaces. Nature 450, 1001-9.
4. Liolios, K., Mavromatis, K., Tavernarakis, N. & Kyrpides, N. C. (2008) The Genomes On Line Database (GOLD) in 2007: status of genomic and metagenomic projects and their associated metadata. Nucleic Acids Res 36, D475-9.
5. Suel, G. M., Lockless, S. W., Wall, M. A. & Ranganathan, R. (2003) Evolutionarily conserved networks of residues mediate allosteric communication in proteins. Nat Struct Biol 10, 59-69.
6. Lockless, S. W. & Ranganathan, R. (1999) Evolutionarily conserved pathways of energetic connectivity in protein families. Science 286, 295-9.
7. Altschuh, D., Lesk, A. M., Bloomer, A. C. & Klug, A. (1987) Correlation of co-ordinated amino acid substitutions with function in viruses related to tobacco mosaic virus. Journal of Molecular Biology 193, 693-707.
8. Atchley, W. R., Wollenberg, K. R., Fitch, W. M., Terhalle, W. & Dress, A. W. (2000) Correlations among amino acid sites in bHLH protein domains: an information theoretic analysis. Mol Biol Evol 17, 164-78.
9. Göbel, U., Sander, C., Schneider, R. & Valencia, A. (1994) Correlated mutations and residue contacts in proteins. Proteins: Structure, Function, and Genetics 18, 309-317.
10. Kass, I., Horovitz, A. (2002) Mapping pathways of allosteric communication in GroEL by analysis of correlated mutations. Proteins: Structure, Function, and Genetics 48, 611-617.
11. White, R. A., Szurmant, H., Hoch, J. A. & Hwa, T. (2007) Features of protein-protein interactions in two-component signaling deduced from genomic libraries. Methods Enzymol 422, 75-101.
12. Burger, L. & van Nimwegen, E. (2008) Accurate prediction of protein-protein interactions from sequence alignments using a Bayesian method. Mol Syst Biol 4, 165.
13. Thattai, M., Burak, Y. & Shraiman, B. I. (2007) The origins of specificity in polyketide synthase protein interactions. PLoS Comput Biol 3, 1827-35.
14. Kortemme, T., et al. (2004) Computational redesign of protein-protein interaction specificity. Nat Struct Mol Biol 11, 371-9.
15. Fodor, A. A. & Aldrich, R. W. (2004) Influence of conservation on calculations of amino acid covariance in multiple sequence alignments. Proteins: Structure, Function, and Bioinformatics 56, 211-221.
16. Mezard, M., Parisi, G. & Virasoro, M. A. (1987) Spin Glass Theory and beyond. (World Scientific, Singapore).
17. Kschischang, F. R., Frey, B. J. & Loeliger, H.-A. (2001) Factor graphs and the sum-product algorithm. IEEE Transactions on Information Theory 47, 498-519.
18. Yedidia, J. S., Freeman, W. T. & Weiss, Y. (2001) Generalized belief propagation. NIPS 13, 689–695.
19. Mezard, M., Parisi, G. & Zecchina, R. (2002) Analytic and algorithmic solution of random satisfiability problems. Science 297, 812-5.
20. Hartmann, A. K. & Weigt, M. (2005) Phase Transitions in Combinatorial Optimization Problems. (Wiley-VCH, Weinheim).
21. Mezard, M. & Montanari, A. (2008) Information, Physics and Computation. (Oxford University Press, Oxford).
22. Ulrich, L. E. & Zhulin, I. B. (2007) MiST: a microbial signal transduction database. Nucl. Acids Res. 35, D386-390.
23. Mascher, T., Helmann, J. D. & Unden, G. (2006) Stimulus perception in bacterial signal-transducing histidine kinases. Microbiol Mol Biol Rev 70, 910-38.
24. Galperin, M. Y. (2006) Structural classification of bacterial response regulators: diversity of output domains and domain combinations. J Bacteriol 188, 4169-82.
25. Ninfa, A. J. & Magasanik, B. (1986) Covalent modification of the glnG product, NRI, by the glnL product, NRII, regulates the transcription of the glnALG operon in Escherichia coli. Proc Natl Acad Sci U S A 83, 5909-13.
26. Laub, M. T. & Goulian, M. (2007) Specificity in two-component signal transduction pathways. Annu Rev Genet 41, 121-45.
27. Toro-Roman, A., Mack, T. R. & Stock, A. M. (2005) Structural Analysis and Solution Studies of the Activated Regulatory Domain of the Response Regulator ArcA: A Symmetric Dimer Mediated by the [alpha]4-[beta]5-[alpha]5 Face. Journal of Molecular Biology 349, 11-26.
28. Marina, A., Waldburger, C. D. & Hendrickson, W. A. (2005) Structure of the entire cytoplasmic portion of a sensor histidine-kinase protein. Embo J 24, 4247-59.
29. Zapf, J., Sen, U., Madhusudan, Hoch, J. A. & Varughese, K. I. (2000) A transient interaction between two phosphorelay proteins trapped in a crystal lattice reveals the mechanism of molecular recognition and phosphotransfer in signal transduction. Structure 8, 851-62.
30. Bialek, W. & Ranganathan, R. (2007) Rediscovering the power of pairwise interactions. preprint arXiv, 0712.4397.
31. Mezard, M. & Mora, T. (2008) Constraint satisfaction and neural networks: a statistical-physics perspective. preprint arXiv, 0803.3061.
32. Mukhopadhyay, D., Sen, U., Zapf, J. & Varughese, K. I. (2004) Metals in the sporulation phosphorelay: manganese binding by the response regulator Spo0F. Acta Crystallogr D Biol Crystallogr 60, 638-45.
33. Szurmant, H., et al. (2008) Co-evolving motions at protein-protein interfaces of two-component signaling systems identified by covariance analysis. Biochemistry 47, 7782-4.
34. Fiedler, U. & Weiss, V. (1995) A common switch in activation of the response regulators NtrC and PhoB: phosphorylation induces dimerization of the receiver modules. Embo J 14, 3696-705.
35. Bachhawat, P. & Stock, A. M. (2007) Crystal structures of the receiver domain of the response regulator PhoP from Escherichia coli in the absence and presence of the phosphoryl analog beryllofluoride. J Bacteriol 189, 5987-95.
36. Bent, C. J., Isaacs, N. W., Mitchell, T. J. & Riboldi-Tunnicliffe, A. (2004) Crystal structure of the response regulator 02 receiver domain, the essential YycF two-component system of Streptococcus pneumoniae in both complexed and native states. J Bacteriol 186, 2872-9.
37. Schmeisser, C., Steele, H. & Streit, W. R. (2007) Metagenomics, biotechnology with non-culturable microbes. Appl Microbiol Biotechnol 75, 955-62.
38. Pruitt, K. D. & Maglott, D. R. (2001) RefSeq and LocusLink: NCBI gene-centered resources. Nucl. Acids Res. 29, 137-140.
39. Eddy, S. R. (1998) Profile hidden Markov models. Bioinformatics 14, 755-63. 40. Finn, R. D., et al. (2008) The Pfam protein families database. Nucleic Acids Res
36, D281-8.
Figure Legends
Figure 1. The combined co-variance/message passing approach detects two groups of correlated pairs. (A) Scatter plot of direct mutual information (DI) versus
total mutual information (MI) reveals two classes of co-varying residue pairs, those with
strong direct correlation found in the upper red quadrant (Group I) and those with low
direct correlation found in the lower green quadrant (Group II). A group of pairings just
around the border of the MI and/or the DI cutoff is highlighted in blue. (B) Direct and
indirect interaction pairs depicted on exemplary structures of the HisKA and RR domain.
All residues that appear in the network of pairings with MI > MI(t) were mapped onto the
structures of HK853 from T. maritima (HisKA domain) and Spo0F from B. subtilis (RR
domain). Those pairings showing strong direct correlation are depicted in red and
connected by a red line and those that show low direct correlation are depicted in green
and connected by a green line. Green lines connecting red residues represent low direct
correlation for that particular residue pairing. For orientation, the N- and C-termini and
relevant structural elements are labeled. The phosphotransfer sites H260 in HK853 and
D54 in Spo0F are shown in yellow.
Figure 2. Direct Information is inversely correlated with residue distance of pairs in the Spo0B/Spo0F co-crystal structure. (A) Minimal atom distance for all 408
pairings that could be mapped to the Spo0B/Spo0F co-crystal structure was determined
in Ångström and plotted either against direct information DI (red symbols) or total
mutual information MI (blue symbols). (B) Specificity vs. rank percentile for predicting
contact pairs via DI (red curve) and MI (blue curve). Specificity is defined as the fraction
of pairings at the given rank percentile that are within 6Å in the Spo0B/Spo0F co-crystal
structure.
Figure 3. Direct interaction between the identified dimer contact pairs. Four dimer
contact pairings (red entries in Table S1) are localized to the α4- and α5- helices and

are shown on the exemplary OmpR class RR structures of ArcA, PhoP and MicA as a
dashed line. Whereas contact pairing 89:109 (ArcA numbering, for PhoP and MicA
numbering deduct 2) happens to represent a salt bridge in all three structural examples
shown here, the pairing 94:115 and the cluster involving pairings 86:106 and 86:108
demonstrate nicely the type of residue variation that is the basis of the covariance
method; see text. Detailed analysis of the covariance among the residues involved in
these four pairings are given in Supp. Fig. S8.