Embed Size (px)
Citation preview
11th World Congress on Computational Mechanics (WCCM XI)
5th European Conference on Computational Mechanics (ECCM V)
6th European Conference on Computational Fluid Dynamics (ECFD VI)
E. Oñate, J. Oliver and A. Huerta (Eds)
IDENTIFICATION OF DEFECTS ORIGINATED DURING THE
FILLING OF CAST PIECES THROUGH PARTICLES MODELLING
JESÚS M. BLANCO†
*
, PRIMITIVO CARRANZA†, RAFAEL PINTOS
†, PEDRO
ARRIAGA†
AND LAKHDAR REMAKI††
† UPV/EHU University of the Basque Country; School of Engineering
Alameda Urquijo, s/n. 48013 Bilbao
[email protected]; http://www.ingeniaritza-bilbao.ehu.es/p224-home/es
††
BCAM (Basque Center for Applied Mathematics)
Alameda Mazarredo, 14. 48009 Bilbao
[email protected]; http://www.bcamath.org
Key Words: Cast pieces, Defects, Particles, Numerical analysis, Fluid dynamics.
Abstract. In casting processes, strong recirculation zones may trap air, gases and strip
particles of sand off the mold affecting seriously the quality of the cast pieces. Especially
during the filling of molten pieces with large surfaces, several faults were detected which are
responsible of considerable economic losses in such casting processes. The aim of this work
is focused on the correct identification of these physical phenomena, through Computational
Fluid Dynamics (CFD). A fully experimental work correlating a saline solution with similar
properties than the liquid alloy was carried out in order to guess the flow behavior inside the
mold. Different parameters such as filling time, temperature and velocity of the liquid alloy
together with the geometrical design of the mold were taken into account. The simulated
evolution profiles and propagation speeds were compared with the laboratory experiments
showing good agreement, validating thus the numerical model. Through an advanced particles
modeling feature from a commercial package, the potential to predict and later correct some
casting defects was demonstrated. As a conclusion, the mold together with supply channels
need to be carefully optimized in order to control the correct direction of solidification
avoiding the appearance of oxides but also to prevent stripping the sand off the walls.
1 INTRODUCTION
Physical phenomena directly associated to the filling of heavy cast pieces with great
surfaces; responsible of multiple defects, is a key factor that is crucial to understand in deep.
The fluid dynamics of the casting for these types of pieces has been carefully studied in order
to know the causes of the defects encountered which will be described later. For this reason,
preliminary tests on pilot-scale models were performed, which is indeed a time-consuming
and thus expensive activity. A full experimental campaign, including multiple changes in the
* Corresponding author (Jesús M. Blanco).
Jesús M. Blanco, Primitivo Carranza, Rafael Pintos, Pedro Arriaga and Lakhdar Remaki.
2
design of the feeding system was performed without any improvements. Some of the most
reputed research centers in Spain, especially in the Basque Country, in the field of metallurgy
were asked and confirmed us that the problem could be originated during the complex
procedures of filling the mold. To support the design process of such casting metal pieces,
with approaches for motion of dispersed particles, droplets and bubbles 1, computer
simulations can clearly be a useful tool. Over the years, researchers have developed numerical
models that describe liquid and solid flow at different levels of detail 2. When in the
fluidized state, the moving particles work effectively as a mixer, which results in a uniform
temperature distribution and a high mass transfer rate, resulting beneficial for the efficiency of
many physical and chemical processes, such as coating, granulation, drying, and the synthesis
of fuels and base chemicals 3. At present, the design and scale-up of such casting are mostly
fully empirical processes, owing to limited insight into the fundamentals of dense liquid-
particle flows at such scales, in which the phenomena related to effective liquid-particle
interactions (drag forces) and particle-particle interactions (collision forces) in particular are
not really well understood 4.
The Eulerian-Eulerian model 5 also referred to as the two-fluid model (TFM) can be
used. This model employs a continuum description for both the solid phase and the gas phase
and uses a finite difference code to describe the time evolution of both phases 6. The
interaction between the two phases is incorporated by drag force correlations, which depend
on the local relative velocity of the phases and the local solid’s volume fraction. The
drawback of this method is that it does not model properly the details of particle-particle and
particle-liquid interactions 7. The latter is taken care of by intermediate Euler-Lagrange
models, also called discrete particle models (DPMs), in which the solid phase is represented
by the actual particles 8, 9, as in the Lagrange-Lagrange models (LL). The basic philosophy
behind the multi-scale modelling approach is that the smaller scale models, which take into
account the abovementioned interactions with certain detail, are used to develop closure laws
that can represent the effective coarse-grained interactions in larger-scale models 10.
In this paper, a numerical approach is presented; simulating accurately the flow conditions
inside the mold and showing the potential for predicting some casting defects over a particular
type of cast pieces. The numerical approach is built through a commercial package and
consists of a finite volume based computational fluid dynamics (CFD) solver and a volume of
fluid algorithm which together solves the pressure and velocity couplings together with the
free surface 11, 12. This model treats the particles as discrete entities, which can collide,
coalesce, break up, shrink, and grow, using a turbulence closure scheme namely the
Renormalization Group (RNG) k– in a Reynolds-Averaged Navier-Stokes framework
(RANS).
Finally, a fully experimental work was carried out, using a saline fluid resulted of a
mixture of water and “Cl K” to perform the experiments and using the similitude theory in
order to demonstrate the flow behavior inside the mold, validating this way the computational
model. Scaled laboratory experiments have been widely used to understand this fluid
dynamics. Many studies have investigated various aspects by using lock-exchange
experiments. In some of the earlier experiments, gravity currents were commonly generated
by releasing dense fluid (d) into uniform ambient fluid (a) [13-16]. In such a case, the
Jesús M. Blanco, Primitivo Carranza, Rafael Pintos, Pedro Arriaga and Lakhdar Remaki.
3
gravity current will propagate along the bottom surface and is referred to as a Bottom
Boundary Gravity Current (BBGC).
2 AIM AND METHODOLOGY
During the filling of molten pieces with large surfaces, several faults were detected which
are responsible of considerable economic losses in such casting process. During the real
casting process tracking of solid particles in liquid alloy is very complicated due to high
temperature and non-transparent mould materials. Usually it’s only possible to verify final
distribution of particles in the solid cast. For this reason, in this study computer simulations
were performed. The aim of this work is focused on the correct identification of these
physical phenomena, through CFD focused on particle simulation that allows predicting the
fluid motion inside the mold.
The commercial package FLOW-3D Cast 17 was used, which contains a wide variety of
physical models specially designed for casting. When modeling die casting, the most difficult
challenge is to accurately track the liquid metal as it enters the cavity at great speeds. The
resulting jetting and splashing of the metal throughout the cavity presents the greatest obstacle
for predicting defects. A fully experimental work correlating a saline solution and liquid alloy
was carried out in order to validate the computational model focused to detect oxides and
erosion, the latest through particle modeling, considering different parameters such as time,
temperature, velocity and geometrical design of the mold.
3 PRELIMINARY OVERVIEW ON DEFECTOLOGY
A major challenge when designing a casting is determining whether or not the final piece
presents defects. Designers can often produce a good quality work by following best-practices
for designing gating, runners, risers, pour temperatures and chill sizing. With the aid of
powerful defect prediction tools, casting designers can quick and accurately identify and
locate defects, allowing parts to be produced with higher quality in a shorter amount of time,
so the savings come from quality management and cost avoidance 18.
Now, quality and productivity issues can be solved in less time and with lower costs by
evaluating alternative concepts with simulation before die steel is cut or molds are modified
19. And, the effectiveness of new tool development can be improved by solving the
problems before production begins. The most common defects appeared during casting
processes are briefly described next 20:
Entrained air; The amount of entrained air occurring in metal casting systems, such as
gravity-poured casting processes is based on simple physical mechanisms, such as gravity-
poured casting processes. It is assumed to be in the form of bubbles.
Core gas; Chemical binders in the sand can produce gas when heated by the molten metal
if not adequately vented; the gas may flow into the metal resulting in a gas porosity defect.
Micro porosity; Cast metal parts are sometimes useless because they have large internal
gas pockets, or porosity, that develops when the metal shrinks during solidification. Most
large-scale porosity can be eliminated by a careful design of the casting mold to keep extra
liquid metal in special regions for feeding the shrinkage.
Oxides; formed due to an exposed molten metal surface to air which can end up in
undesirable locations. The final distribution of such oxides depends on the overall flow
Jesús M. Blanco, Primitivo Carranza, Rafael Pintos, Pedro Arriaga and Lakhdar Remaki.
4
conditions as, turbulent mixing, fluid jetting, impingement etc. This defect has studied here
through a special feature.
Erosion; Metal pressure can drop several atmospheres below the metal vapor pressure in
areas of very fast flow, causing cavitation and stripping off particles of sands from the mold
walls and creating deposits in other places. This defect has also been carefully reported here
but now through particle modeling, allowing full interaction with the liquid alloy.
4 PROBLEM SETUP
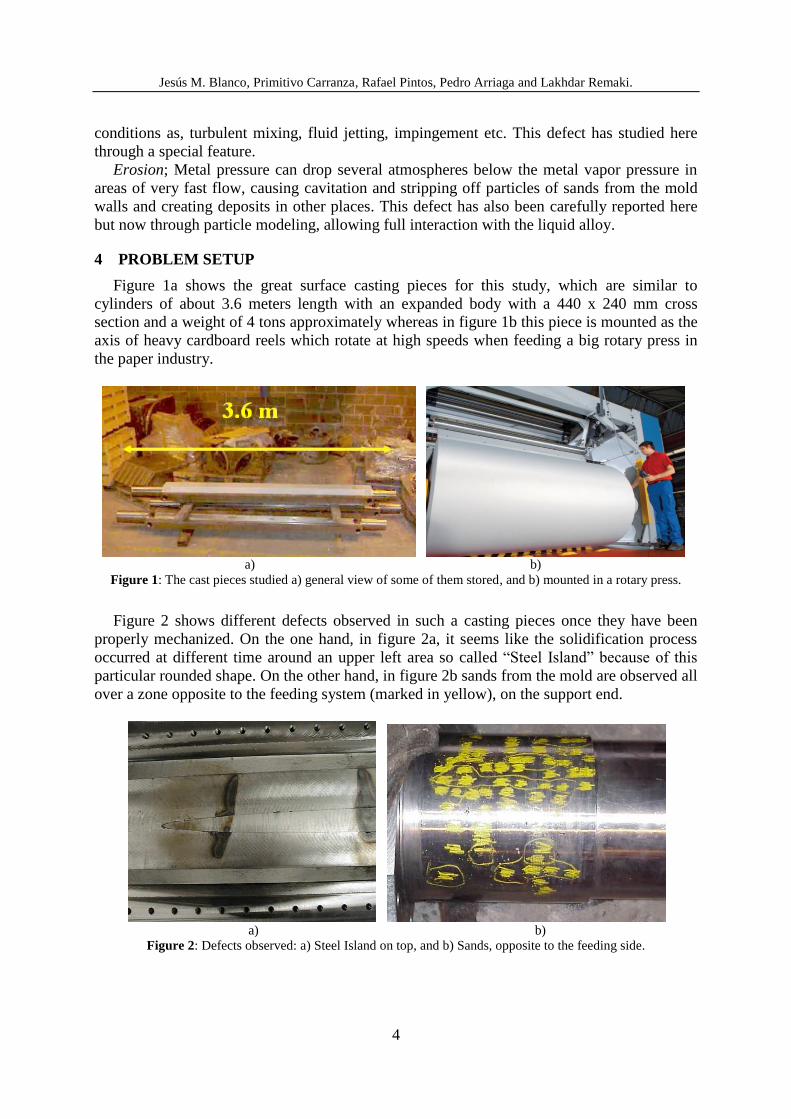
Figure 1a shows the great surface casting pieces for this study, which are similar to
cylinders of about 3.6 meters length with an expanded body with a 440 x 240 mm cross
section and a weight of 4 tons approximately whereas in figure 1b this piece is mounted as the
axis of heavy cardboard reels which rotate at high speeds when feeding a big rotary press in
the paper industry.
a) b)
Figure 1: The cast pieces studied a) general view of some of them stored, and b) mounted in a rotary press.
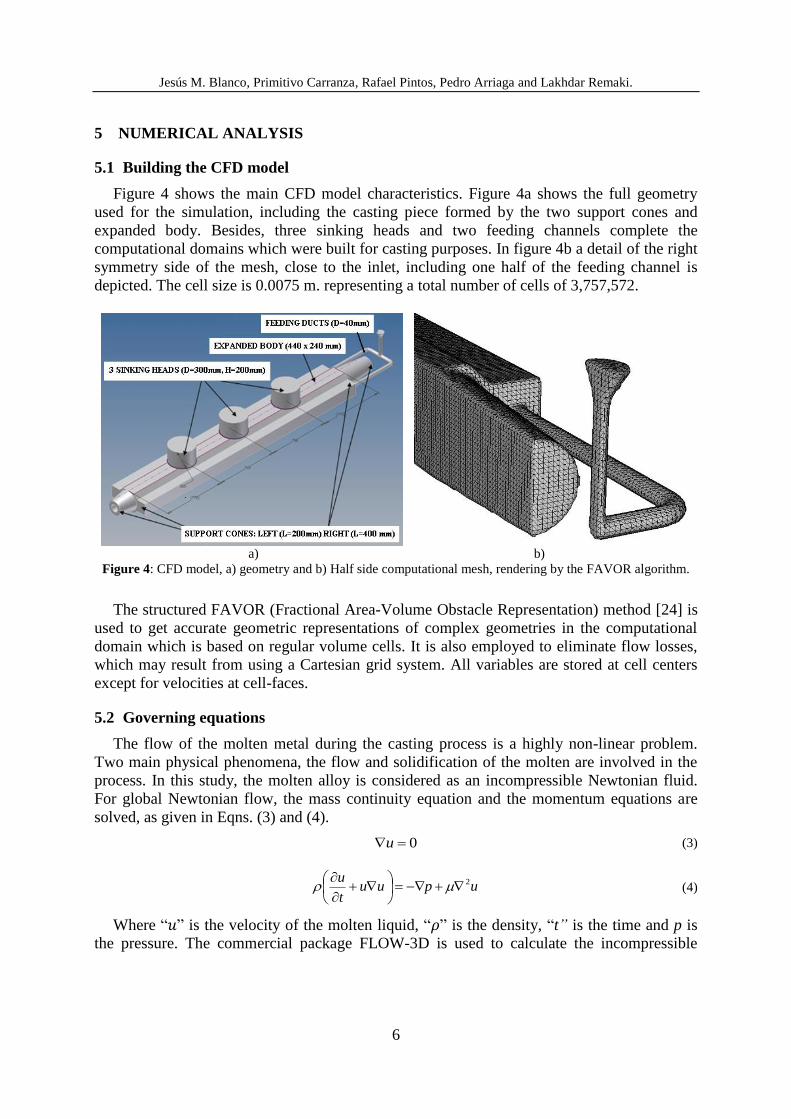
Figure 2 shows different defects observed in such a casting pieces once they have been
properly mechanized. On the one hand, in figure 2a, it seems like the solidification process
occurred at different time around an upper left area so called “Steel Island” because of this
particular rounded shape. On the other hand, in figure 2b sands from the mold are observed all
over a zone opposite to the feeding system (marked in yellow), on the support end.
a) b)
Figure 2: Defects observed: a) Steel Island on top, and b) Sands, opposite to the feeding side.

Jesús M. Blanco, Primitivo Carranza, Rafael Pintos, Pedro Arriaga and Lakhdar Remaki.
5
4 EXPERIMENTAL WORK
In order to visualize the flow inside the mold some experiments have been performed
through an experimental facility built “ad hoc”. Figure 3a shows the whole prototype
including, mold, saline fluid ducts and the platform for the elevated storage tank to provide
the necessary feeding pressure to the fluid. This picture was taken during the calibration of the
charge-coupled device (CCD) camera, and ready to capture high resolution images of the flow
inside the mold, whereas in figure 3b the prototype mould is depicted in detail. It consists
only in the right side of the whole mold, closed along the symmetry side by reinforced
transparent methacrylate in order to appreciate the fluid flow inside.
a) b)
Figure 3: Experimental facilities, a) during procedure for image capturing and b) detail of the mold prototype.
There are several analytical solutions for propagation speeds [21, 22]. They applied
Bernoulli’s principle along streamlines. For energy-conserving flows, the total water height in
the tank (h) [23] can be defined by Eq. (1):
2
'462.0
g
uh (1)
Where (u) is the propagation speed and (g’) is the reduced gravity, defined by Eq. (2):
a
adgg
' (2)
Table 1 shows the main characteristics for the high resolution camera used for image
capturing. The Sony TM-75 is the replacement for the popular Sony XC-75. Manual Gain
Control (MGC) is easily accessible on the camera’s rear panel.
Table 1: Properties of the Sony TM-75 High-Resolution CCD camera
Size (mm) 44.0 x 29.0 x 91.1 Cell size (µm) 8.4 x 9.8
Shutter speed range (s) 1/60 to 1/29,000
Pixel format 768 (H) x 494 (V)
Sync (Hz) 59.94
Jesús M. Blanco, Primitivo Carranza, Rafael Pintos, Pedro Arriaga and Lakhdar Remaki.
6
5 NUMERICAL ANALYSIS
5.1 Building the CFD model
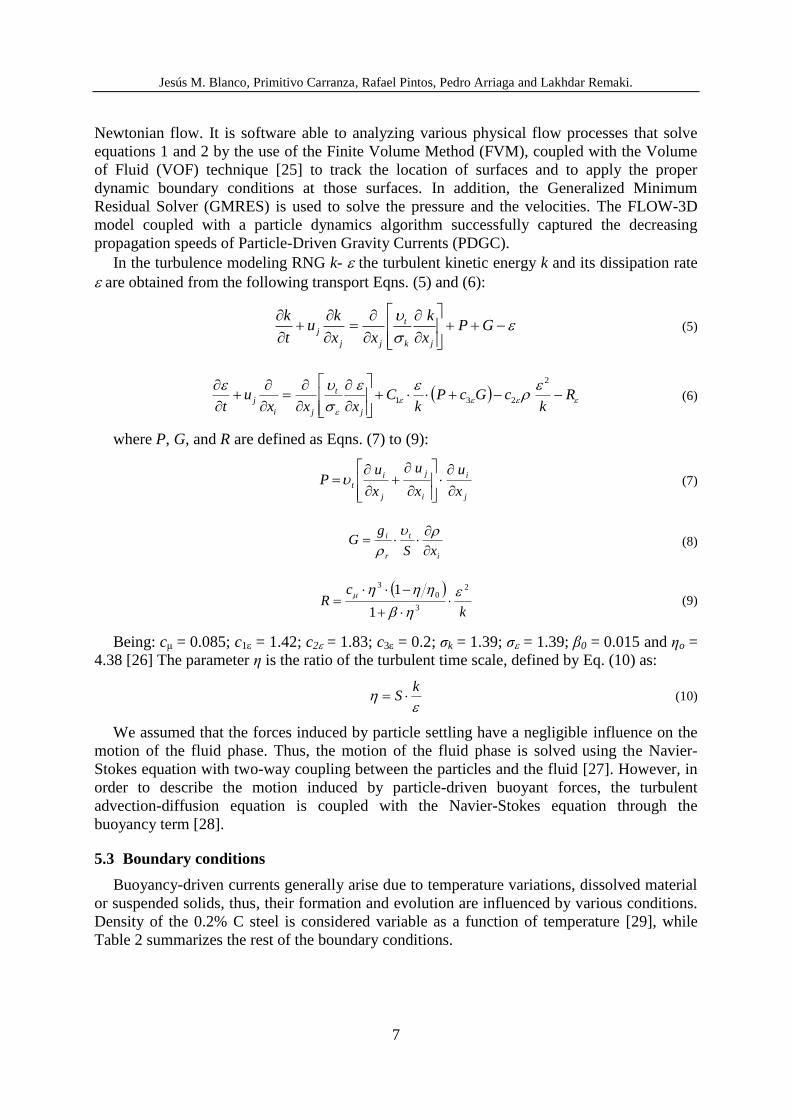
Figure 4 shows the main CFD model characteristics. Figure 4a shows the full geometry
used for the simulation, including the casting piece formed by the two support cones and
expanded body. Besides, three sinking heads and two feeding channels complete the
computational domains which were built for casting purposes. In figure 4b a detail of the right
symmetry side of the mesh, close to the inlet, including one half of the feeding channel is
depicted. The cell size is 0.0075 m. representing a total number of cells of 3,757,572.
a) b)
Figure 4: CFD model, a) geometry and b) Half side computational mesh, rendering by the FAVOR algorithm.
The structured FAVOR (Fractional Area-Volume Obstacle Representation) method [24] is
used to get accurate geometric representations of complex geometries in the computational
domain which is based on regular volume cells. It is also employed to eliminate flow losses,
which may result from using a Cartesian grid system. All variables are stored at cell centers
except for velocities at cell-faces.
5.2 Governing equations
The flow of the molten metal during the casting process is a highly non-linear problem.
Two main physical phenomena, the flow and solidification of the molten are involved in the
process. In this study, the molten alloy is considered as an incompressible Newtonian fluid.
For global Newtonian flow, the mass continuity equation and the momentum equations are
solved, as given in Eqns. (3) and (4).
0u (3)
upuut
u 2
(4)
Where “𝑢” is the velocity of the molten liquid, “𝜌” is the density, “t” is the time and p is
the pressure. The commercial package FLOW-3D is used to calculate the incompressible
Jesús M. Blanco, Primitivo Carranza, Rafael Pintos, Pedro Arriaga and Lakhdar Remaki.
7
Newtonian flow. It is software able to analyzing various physical flow processes that solve
equations 1 and 2 by the use of the Finite Volume Method (FVM), coupled with the Volume
of Fluid (VOF) technique [25] to track the location of surfaces and to apply the proper
dynamic boundary conditions at those surfaces. In addition, the Generalized Minimum
Residual Solver (GMRES) is used to solve the pressure and the velocities. The FLOW-3D
model coupled with a particle dynamics algorithm successfully captured the decreasing
propagation speeds of Particle-Driven Gravity Currents (PDGC).
In the turbulence modeling RNG k- the turbulent kinetic energy k and its dissipation rate
are obtained from the following transport Eqns. (5) and (6):
GP
x
k
xx
ku
t
k
jk
t
jj
j (5)
R
kcGcP
kC
xxxu
t j
t
ji
j
2
231 (6)
where P, G, and R are defined as Eqns. (7) to (9):
j
i
i
j
j
i
tx
u
x
u
x
uP
(7)
i
t
r
i
xS
gG
(8)
k
cR
2
3
0
3
1
1
(9)
Being: cμ = 0.085; c1 = 1.42; c2 = 1.83; c3 = 0.2; σk = 1.39; σ = 1.39; β0 = 0.015 and ηo =
4.38 [26] The parameter η is the ratio of the turbulent time scale, defined by Eq. (10) as:
kS (10)
We assumed that the forces induced by particle settling have a negligible influence on the
motion of the fluid phase. Thus, the motion of the fluid phase is solved using the Navier-
Stokes equation with two-way coupling between the particles and the fluid [27]. However, in
order to describe the motion induced by particle-driven buoyant forces, the turbulent
advection-diffusion equation is coupled with the Navier-Stokes equation through the
buoyancy term [28].
5.3 Boundary conditions
Buoyancy-driven currents generally arise due to temperature variations, dissolved material
or suspended solids, thus, their formation and evolution are influenced by various conditions.
Density of the 0.2% C steel is considered variable as a function of temperature [29], while
Table 2 summarizes the rest of the boundary conditions.
Jesús M. Blanco, Primitivo Carranza, Rafael Pintos, Pedro Arriaga and Lakhdar Remaki.
8
Table 2: Boundary conditions for the CFD model (liquid steel) for reference 0 Pa and 30 ºC
Feeding Pressure (Pa) 33,844.5
Feeding temperature (ºC) 1,590
Viscosity (Pa·s) 0.0059
Cp (J/kg K) 732
Thermal conductivity (W/m K) 26.9
Fusion latent heat (J/kg) 2.77 105
Turbulent length average (m) 0.0028
5.4 Validation procedure
Figure 5 shows the experimental grid used for validation. It was built on the vertical
symmetry plane of the mold and all the cells, of identical size and geometry, are numbered
consecutively, so the time when the flow reaches the respective cell was captured.
Figure 5: Experimental validation cells used for setting up the points where velocities are measured.
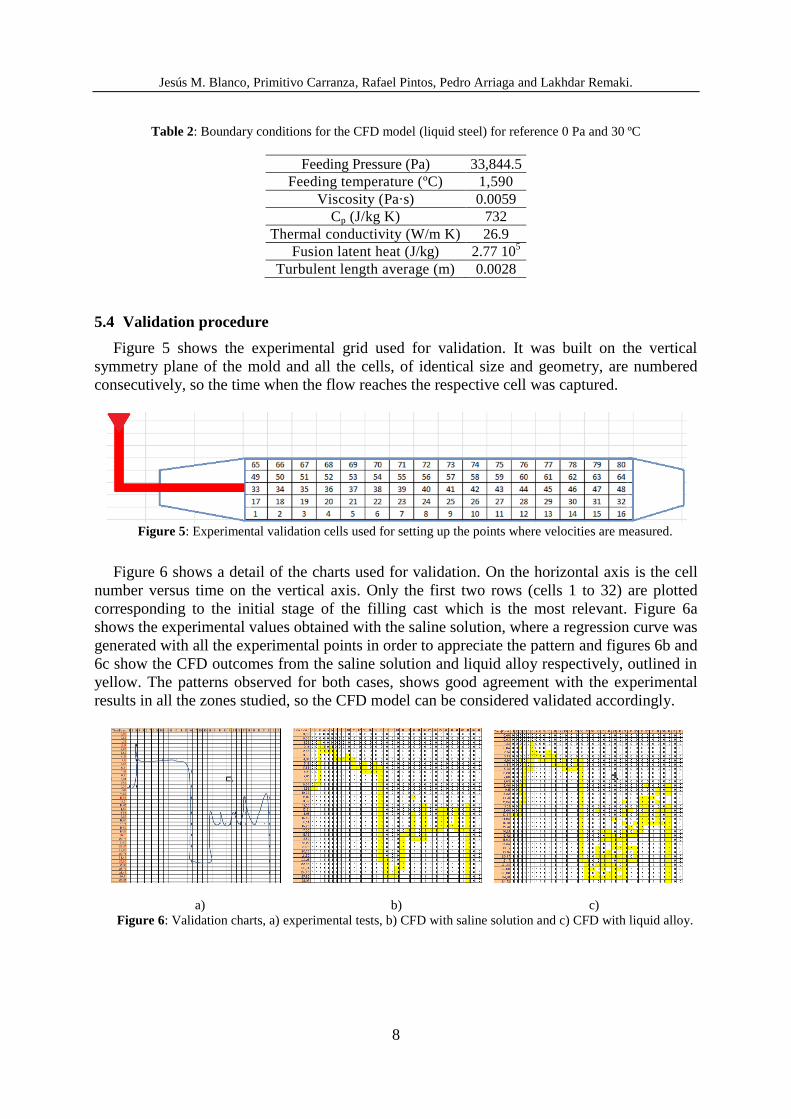
Figure 6 shows a detail of the charts used for validation. On the horizontal axis is the cell
number versus time on the vertical axis. Only the first two rows (cells 1 to 32) are plotted
corresponding to the initial stage of the filling cast which is the most relevant. Figure 6a
shows the experimental values obtained with the saline solution, where a regression curve was
generated with all the experimental points in order to appreciate the pattern and figures 6b and
6c show the CFD outcomes from the saline solution and liquid alloy respectively, outlined in
yellow. The patterns observed for both cases, shows good agreement with the experimental
results in all the zones studied, so the CFD model can be considered validated accordingly.
a) b) c) Figure 6: Validation charts, a) experimental tests, b) CFD with saline solution and c) CFD with liquid alloy.

Jesús M. Blanco, Primitivo Carranza, Rafael Pintos, Pedro Arriaga and Lakhdar Remaki.
9
5 RESULTS AND DISCUSSION
Figure 7 shows a free surface defect concentration (oxides), forming a preliminary shape of
“Steel Island” over the upper left side of the piece, opposite to the feeding ducts, as was
previously visualized on figure 2a. The contours are colored according to concentration, showing
this way only relative value for comparison purposes.
Figure 7: Relative oxides concentration observed at the end of the casting process.
Figure 8a shows the initial distribution for all the identical 10 mm diameter sand particles
along the lower surface of the mold, whereas figure 8b shows a detailed evolution of the
displacement for a specific particle inside the mold, as example, defined with the red arrows
depicted on the previous figure. As this particle strips the mold off, first moves backward and
forward showing a great oscillation around the “x” coordinate (main horizontal axis) but later
on, this movement becomes more stabilized with an average drag coefficient of 2.375.
a) b)
Figure 8: Mass weighted particles a) Initial distribution and b) Evolution observed for a specified particle.
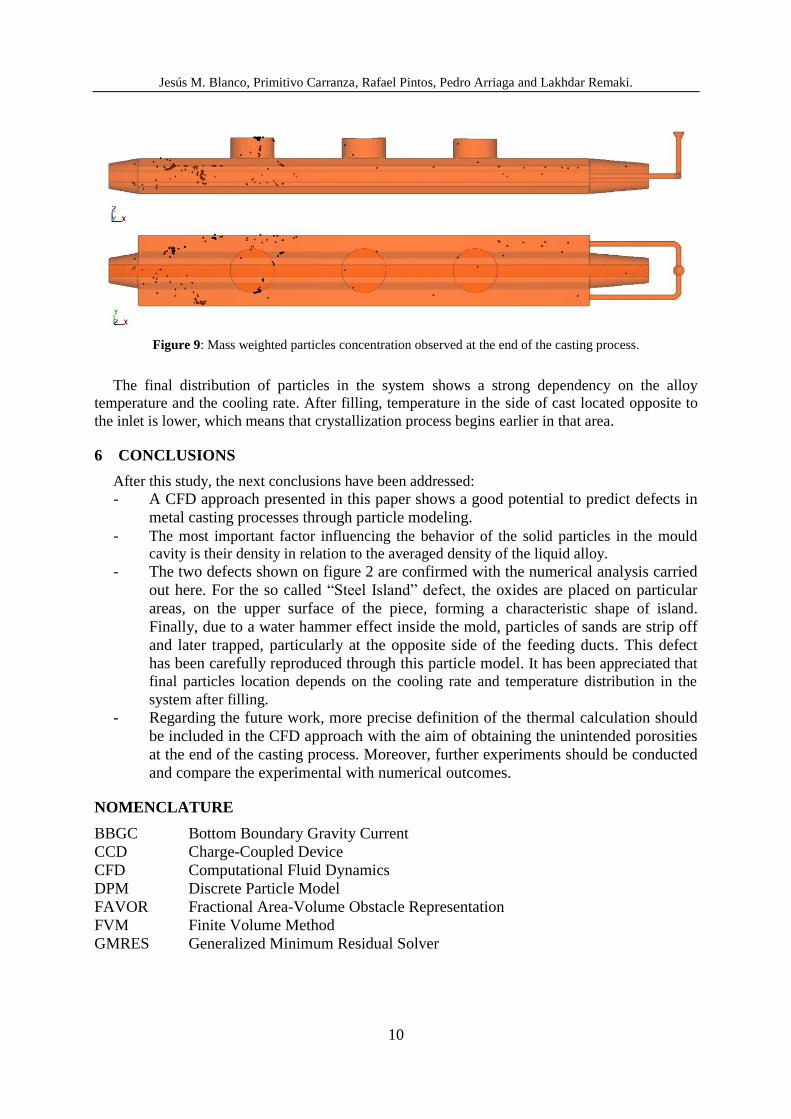
In figure 9 the final distribution of the particles of sands are depicted, which can be seen
mostly concentrated around the top left side of the piece, which shows good agreement with
the previously visualized sands, according to figure 2b. During the simulation, it is clearly
visible that particles of sand, with smaller densities (1,340 kg/m3) than liquid alloy (6,900
kg/m3), are floating on the top side from the very beginning of mould filling. This motion pattern
continues when the mould is completely filled and the process of cooling and solidification starts.
Jesús M. Blanco, Primitivo Carranza, Rafael Pintos, Pedro Arriaga and Lakhdar Remaki.
10
Figure 9: Mass weighted particles concentration observed at the end of the casting process.
The final distribution of particles in the system shows a strong dependency on the alloy
temperature and the cooling rate. After filling, temperature in the side of cast located opposite to
the inlet is lower, which means that crystallization process begins earlier in that area.
6 CONCLUSIONS
After this study, the next conclusions have been addressed:
- A CFD approach presented in this paper shows a good potential to predict defects in
metal casting processes through particle modeling.
- The most important factor influencing the behavior of the solid particles in the mould
cavity is their density in relation to the averaged density of the liquid alloy.
- The two defects shown on figure 2 are confirmed with the numerical analysis carried
out here. For the so called “Steel Island” defect, the oxides are placed on particular
areas, on the upper surface of the piece, forming a characteristic shape of island.
Finally, due to a water hammer effect inside the mold, particles of sands are strip off
and later trapped, particularly at the opposite side of the feeding ducts. This defect
has been carefully reproduced through this particle model. It has been appreciated that
final particles location depends on the cooling rate and temperature distribution in the
system after filling.
- Regarding the future work, more precise definition of the thermal calculation should
be included in the CFD approach with the aim of obtaining the unintended porosities
at the end of the casting process. Moreover, further experiments should be conducted
and compare the experimental with numerical outcomes.
NOMENCLATURE
BBGC Bottom Boundary Gravity Current
CCD Charge-Coupled Device
CFD Computational Fluid Dynamics
DPM Discrete Particle Model
FAVOR Fractional Area-Volume Obstacle Representation
FVM Finite Volume Method
GMRES Generalized Minimum Residual Solver
Jesús M. Blanco, Primitivo Carranza, Rafael Pintos, Pedro Arriaga and Lakhdar Remaki.
11
H Horizontal
LL Lagrange-Lagrange
MGC Manual Gain Control
PDGC Particle-Driven Gravity Currents
RANS Reynolds Averaged Navier Stokes
RNG Renormalization Group
S Mean strain time scale
TFM Two-Fluid Model
V Vertical
VOF Volume of Fluid technique
ds Particle’s diameter (µm)
h Water height in the tank (m)
u Velocity of the molten metal (m s-1
)
a Density of ambient fluid (kg m-3
)
d Density of molten fluid (kg m-3
)
g’ Reduced gravity (m s-2
)
t Time (s)
p Pressure (Pa)
η Ratio of the turbulent time scale
Dinamic viscosity (Pa s)
Kinematic viscosity =/ (m2 s
-1)
ACKNOWLEDGEMENTS
Authors acknowledge the financial support provided by Engineering Resources S.L. and
are grateful to Simulaciones y Proyectos S.L. for their valuable guidance during the hard and
tedious CFD simulations. Special gratitude must be given to the University of Basque
Country during the long testing experiments campaign carried out in its fluid mechanics
facilities.
REFERENCES
[1] Alhama, F. and Madrid, C.N. Análisis dimensional discriminado en mecánica de fluidos y
transferencia de calor, Ed. Reverté, (2012).
[2] Loth, E. Numerical approaches for motion of dispersed particles, droplets and bubbles.
Prog. Energy Combust. Sci. (2000) 26:161-223.
[3] Kunii, D. and Levenspiel, O. Fluid Engineering. Butterworth Heinemann Series in
Chemical Engineering. London: Butterworth Heinemann, (1991).
[4] Kuipers, J.A.M. and van Swaaij, W.P.M. Computational fluid dynamics applied to
chemical reaction engineering. Adv. Chem. Eng. (1994) 24:227-328.
[5] Cantero, M.I., Balachandar, S. and García, M.H. An Eulerian-Eulerian model for gravity
currents driven by inertial particles. Int J Multiphase Flow (2008), 34:484–501.
[6] Gidaspow, D. Multiphase Flow and Fluidization: Continuum and Kinetic Theory
Descriptions. Boston: Academic, (1994).
[7] Climent, E. and Maxey, M.R. Numerical simulation of random suspensions at finite
Jesús M. Blanco, Primitivo Carranza, Rafael Pintos, Pedro Arriaga and Lakhdar Remaki.
12
Reynolds numbers. Int. J. Multiphase Flow (2003) 29:579-601.
[8] Snider, D.M. An incompressible three-dimensional multiphase particle-in-cell model for
dense particle flows. J. Comp. Phys. (2001) 170:523-49.
[9] Georgoulas, A., Angelidis, B., Panagiotidis, T. and Kotsovinos, N. 3D numerical
modelling of turbidity currents. J Environ Fluid Mech, (2010), 10:603-635.
[10] Nastac, P., CFD Modeling of macro segregation and Shrinkage during solidification of
superalloy casting, ISIJ, (2012), 50(12): 1839-1834.
[11] Andersson, J., Hakansson, P., Mortensen, C., Sudiyo, I. and Van Wachem, K.
Computational fluid dynamics for engineers, Cambridge University Press, (2012).
[12] Magoules, C., Computational fluid dynamics, CRC Press, (2011).
[13] Keulegan, G.H. Thirteenth progress report on model laws for density currents an
experimental study of the motion of saline water from locks into fresh water channels.
U.S. Natl Bur Standards Rept 5168, (1957).
[14] Gardin, P., Domgin, J.F., Simonnet, M., Lehmann, J. Modeling of inclusion evolution in
a steel ladle or in RH degasser, Revue de Métallurgie, (2008), 2: 84-91.
[15] Härtel, C., Meiburg, E. and Necker, F. Analysis and direct numerical simulation of the
flow at a gravity-current head, Part I, Flow topology and front speed for slip and no-slip
boundaries. J Fluid Mech, (2000), 418:189-212.
[16] Shin, J.O., Dalziel, S.B. and Linden, P.F. Gravity currents produced by lock exchange. J
Fluid Mech, (2004), 521: 1-34.
[17] www.flow3d.com/apps/casting/flow3d-cast.html
[18] Härtel, C., Meiburg, E., Necker, F. Analysis and direct numerical simulation of the flow at
a gravity-current head, Part I, Flow topology and front speed for slip and no-slip
boundaries. J Fluids Mech., (2000), 418:189-212.
[19] Nakajima, N., Zhang, W., Oikawa, T., Ohno, F. and Jonsson, H. Methodological progress
for computer simulation of solidification and casting, ISIJ, (2012), 50(12): 1724-1734.
[20] Campbell, J., Complete casting handbook, Elsevier, (2011).
[21] Rooij, F., Linden, P.F. and Dalziel, S.B. Saline and particle-driven interfacial intrusions. J
Fluid Mech, (1999), 389: 303-334.
[22] Lowe, R.J., Linden, P.F. and Rottman, J.W., A laboratory study of the velocity structure
in an intrusive gravity current. J Fluid Mech, (2002), 456:33-48.
[23] Benjamin, T.B. Gravity currents and related phenomena. J Fluid Mech, 1968, 31:209-248.
[24] Hirt, C.W. Volume-fraction techniques: powerful tools for wind engineering. J Wind Eng
Ind Aerodyn (1993), 46/47: 327-338.
[25] Hirt, C.W. and Nichols, B.D. Volume of fluid (VOF) method for the dynamics of free
boundaries, J Comput Phys, (1981), 39:1-11.
[26] Necker, F., Hartel, C., Kleiser, L. and Meiburg, E., High-resolution simulations of
particle-driven gravity currents. Int J Multiphase Flow, (2002), 28: 279-300.
[27] Ungarish, M. An introduction to gravity currents and intrusions. CRC Press, Boca Raton,
(2009).
[28] Sutherland, B.R., Kyba, P.J. and Flynn, M.R., Intrusive gravity currents in two-layer
fluids. J Fluid Mech. (2004), 514: 327-353.
[29] Furumoto, T., Ueda, T., Amino, T. Kusunoki, D. Hosokawa, A. And Tanaka, R.,
Finishing performance of cooling channel with face protuberance inside the molding die,
Journal of Materials Processing Technology, (2012), 212: 2154-2160.