Embed Size (px)
Citation preview

International Journal of
Environmental Research
and Public Health
Article
Identification of COVID-19 Waves: Considerations for Researchand Policy
Andrés Ayala 1 , Pablo Villalobos Dintrans 2,* , Felipe Elorrieta 1 , Claudio Castillo 2 , Claudio Vargas 1 andMatilde Maddaleno 2
Citation: Ayala, A.; Villalobos
Dintrans, P.; Elorrieta, F.; Castillo, C.;
Vargas, C.; Maddaleno, M.
Identification of COVID-19 Waves:
Considerations for Research and
Policy. Int. J. Environ. Res. Public
Health 2021, 18, 11058. https://
doi.org/10.3390/ijerph182111058
Academic Editor: Paul B. Tchounwou
Received: 17 September 2021
Accepted: 19 October 2021
Published: 21 October 2021
Publisher’s Note: MDPI stays neutral
with regard to jurisdictional claims in
published maps and institutional affil-
iations.
Copyright: © 2021 by the authors.
Licensee MDPI, Basel, Switzerland.
This article is an open access article
distributed under the terms and
conditions of the Creative Commons
Attribution (CC BY) license (https://
creativecommons.org/licenses/by/
4.0/).
1 Departamento de Matemática y Ciencia de la Computación, Facultad de Ciencias, Universidad de Santiago,Santiago 9170022, Chile; [email protected] (A.A.); [email protected] (F.E.);[email protected] (C.V.)
2 Programa Centro Salud Pública, Facultad de Ciencias Médicas, Universidad de Santiago,Santiago 9170022, Chile; [email protected] (C.C.); [email protected] (M.M.)
* Correspondence: [email protected]
Abstract: The identification of COVID-19 waves is a matter of the utmost importance, both forresearch and decision making. This study uses COVID-19 information from the 52 municipalities ofthe Metropolitan Region, Chile, and presents a quantitative method—based on weekly accumulatedincidence rates—to define COVID-19 waves. We explore three different criteria to define the durationof a wave, and performed a sensitivity analysis using multivariate linear models to show theircommonalities and differences. The results show that, compared to a benchmark definition (a 100-daywave), the estimations using longer periods of study are worse in terms of the model’s overall fit(adjusted R2). The article shows that defining a COVID-19 wave is not necessarily simple, and hasconsequences when performing data analysis. The results highlight the need to adopt well-definedand well-justified definitions for COVID-19 waves, since these methodological choices can have animpact in research and policy making.
Keywords: COVID-19; waves; public health; public policy
1. Introduction
The COVID-19 pandemic became a major global event since its identification in2019. During 2020, countries around the world dealt with the crisis under a scenario ofuncertainty, including what will happen in 2021 [1,2]. The second year of the pandemicbrought new analyses and changes that need to be considered when looking at the impactof COVID-19 in different settings [3,4]. The availability of vaccines, the rise in new variants,and the lessons from the experiences of 2020 pose new challenges for policymakers aroundthe world.
Some of the issues that are relevant to extract lessons and think of solutions arewhether there have been several waves of the disease, how to identify them, and if theyare different [5–8]. From a policy perspective, the identification of “waves” is relevant togenerate data and analysis for decision making [9].
These differences in the evolution of the pandemic can be found between countriesand within geographical regions, where COVID-19 infections can be decomposed into a setof asynchronous sub-trajectories originating from different regions within a country [10].
Despite how popular the concept of “wave” has become, there is no standard definitionto identify them. This lack of an operational definition can lead to confusion when studyingand communicating about the pandemic. For this, it is important to dedicate efforts toestablishing objective methodologies to define COVID-19 waves, allowing both researchersand decision makers to determine and debate about them.
Chile represents an interesting case of study for several reasons. First, it is one ofthe countries that has been hit more severely by the pandemic [11]. Second, it has been
Int. J. Environ. Res. Public Health 2021, 18, 11058. https://doi.org/10.3390/ijerph182111058 https://www.mdpi.com/journal/ijerph
Int. J. Environ. Res. Public Health 2021, 18, 11058 2 of 8
actively proposing new strategies to deal with the pandemic, including the successful massvaccination process [12,13]. Third, it is a developing, Latin American, unequal countrythat can be viewed as a reference for the region and other countries. Particularly, it hasbeen shown in previous studies that the pandemic has had an uneven impact within theMetropolitan Region of Chile [14,15].
Considering these features, the goal of this study is—using data from the MetropolitanRegion, Chile—to propose a particular method to identify COVID-19 waves and show thenon-triviality of choosing different measures to define these waves. The results seek tohighlight the importance of defining a baseline method with explicit criteria to identifythese waves when performing research on COVID-19 in a determined time and location,and for evidence-based decision making. The results can be used to extend the analysisof the ongoing impact of COVID-19 in Chile, and can be applied—mutatis mutandis—inother contexts.
2. Methods and Materials2.1. Statistical Strategy
Based on the number of weekly cases—with a PCR-positive test—for each municipal-ity, cumulative incidence rates were calculated as the ratio between the number of caseseach week and the estimated population in each municipality, using the projections fromthe last available census [16] per 100,000 inhabitants. For each municipality, the followingthresholds were identified:
• Starting date: week of the first reported case.• End of first wave (criterion 1): first week (since the starting date) that fulfilled the
following conditions:
1. Weekly incidence rate lower than 70 cases per 100,000 people (70/100,000 cases);2. Negative growth incidence rate for at least two consecutive weeks.
• Start of second wave (criterion 2): first week (since the end of the first wave) thatfulfilled the following conditions:
1. Weekly incidence rate higher than 70/100,000 cases;2. Positive growth incidence rate in at least one week in which the municipality
presented over 70/100,000 cases.
• Average threshold (criterion 3): average week between the end of the first wave andthe start of the second wave.
The identification strategy contains the following two criteria: levels and changes.The criterion of 70 cases per 100,000 people was established following the government’sstrategy to define geographical COVID-19 measures, the so-called step-by-step plan (PlanPaso a Paso), in which geographically determined restrictions were set according to epi-demiological indicators [17]. According to this strategy, a daily incidence rate of 10 casesper 100,000 people was considered as positive and, consequently, it triggered advances interms of the stringency of measures [18]. In terms of changes, the use of more than oneweek with low/high cases allows a trend to be identified, avoiding defining a wave basedon outliers. Once these thresholds were defined, the duration of waves was calculated asthe difference between the starting and end dates for each unit of analysis (municipality),using the three different criteria described above.
To examine the potential effect of the choice between definitions, the cumulative inci-dence of confirmed cases and deaths due to COVID-19 was calculated for each municipalityover the three periods. These first six variables were calculated as the number of COVID-19confirmed cases/deaths per 100,000 people in each unit of analysis according to the periodstudied. Based on the above calculation, each of these was divided by the duration ofthe first wave in days (according to the corresponding criterion), thus obtaining variablesadjusted for the duration of each wave.
As an exercise to test the possible effects of the choice between the different definitions,a sensitivity analysis was performed, using the previously described variables as dependent

Int. J. Environ. Res. Public Health 2021, 18, 11058 3 of 8
variables in a series of multivariate linear regressions for the 52 municipalities of theMetropolitan Region, Chile. These models were estimated using ordinary least squares(OLS), where the explanatory variables correspond to different demographic, health andsocioeconomic factors of each unit of analysis, calculated from information from the CASEN2017 [19]. Then, for each model, an automatic selection algorithm (stepwise) of explanatoryvariables was used, simplifying the number of independent variables to the subset thatminimizes the AIC criterion. In addition, for the residuals of each estimated model, theMoran’s I test was calculated to detect the existence and degree of spatial autocorrelation.
Finally, the simplified models were compared with the results obtained in the previousstudy “COVID-19 incidence and mortality in the Metropolitan Region, Chile: Time, space,and structural factors” in order to analyze whether the results vary according to the choiceof criteria used to determine the duration of the wave.
2.2. Data
The study uses the number of cases—defined as the sum of confirmed and probablecases—as the main input to identify COVID-19 waves. According to the Chilean Ministry ofHealth, a confirmed case corresponds to a person who has a positive result of SARS-CoV-2from an RT-PCR test or who has a positive result from an antigen test for SARS-CoV-2, sinceit was a suspected case (has symptoms, possible reinfection or has a serious respiratoryinfection that requires hospitalization) [20,21].
The variable was collected weekly, starting on 30 March 2020 to 9 August 2021. Forthe study, official information coming from the Chilean Ministry of Health (MINSAL) andpublished by the Ministry of Science was used [22]. The number of deaths due COVID-19was obtained from open data provided weekly by the Department of Health Statisticsand Information (DEIS) [23]. All the data used for this study correspond to data comingfrom public and open sources, and consider information for the 52 municipalities in theMetropolitan Region, Chile.
3. Results
Table 1 shows the descriptive statistics of the sample, using the different criteriapreviously described. First, the wave’s duration varies, on average, between 130 and300 days, using the end of the first wave or the beginning of the second as the criterion.As expected, the cases and deaths follow the same pattern. When adjusting for eachmunicipality’s wave duration, the daily cases range between 15.27 and 25.79, and the dailydeaths between 0.59 and 0.95. Finally, the presence of spatial correlation is observed in allthe cases.
Table 1. Wave 1 statistics using different criteria.
Variable
Criterion 1: End of First Wave Criterion 2: Start of Second Wave Criterion 3: Average Threshold
Mean Max Min Moran I Mean Max Min Moran I Mean Max Min Moran I
Duration (days) 130.981 193 95 0.111 * 300.596 340 249 0.253 *** 215.481 240 186 0.070Cases 3403.787 6281.746 1406.369 0.381 *** 4536.999 6965.738 2689.269 0.336 *** 3940.650 6471.989 1914.770 0.374 ***
Deaths 125.465 271.645 33.464 0.431 *** 174.446 387.238 41.831 0.392 *** 153.225 336.377 33.464 0.411 ***Cases/duration 25.789 45.613 13.788 0.399 *** 15.270 24.595 8.704 0.426 *** 18.336 30.461 8.664 0.437 ***Deaths/duration 0.951 2.245 0.314 0.405 *** 0.586 1.340 0.137 0.445 *** 0.712 1.633 0.167 0.411 ***
Significance level: *** p < 0.01, * p < 0.1.
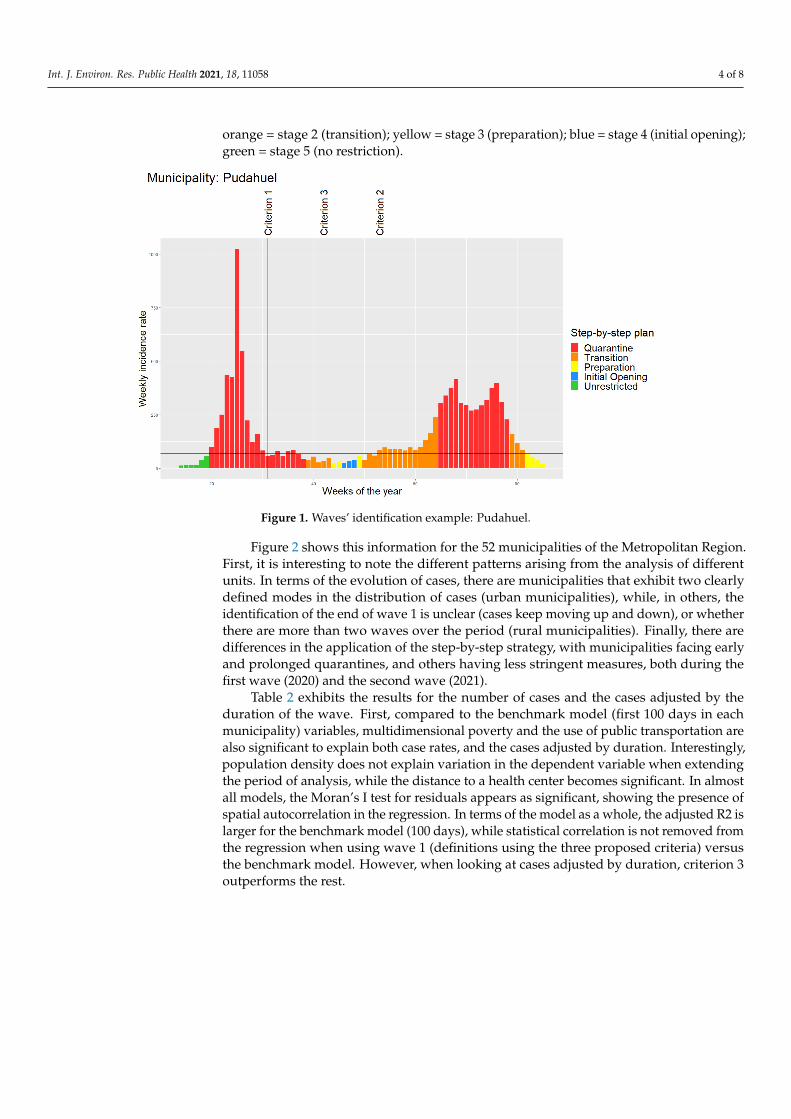
Figure 1 shows an example of the identification strategy, using the municipalityof Pudahuel (253,139 inhabitants) [16]. First, the x-axis registers the number of casesper 100,000 people in the municipality, while the weeks of the year are on the y-axis.Second, the horizontal line depicts the threshold of the 70/100,000 cases used to identifythe start/end of waves. Third, the vertical lines identify the thresholds for the wave’sduration, using the following three previously described criteria: blue = criterion 1; purple= criterion 2; green = criterion 3. Finally, the colors in the bars identify the different stagesof the step-by-step strategy, by level of stringency, as follows: red = stage 1 (quarantine);
Int. J. Environ. Res. Public Health 2021, 18, 11058 4 of 8
orange = stage 2 (transition); yellow = stage 3 (preparation); blue = stage 4 (initial opening);green = stage 5 (no restriction).
Int. J. Environ. Res. Public Health 2021, 18, x FOR PEER REVIEW 4 of 9
Table 1. Wave 1 statistics using different criteria.
Variable Criterion 1: End of First Wave Criterion 2: Start of Second Wave Criterion 3: Average Threshold
Mean Max Min Moran I Mean Max Min Moran I Mean Max Min Moran I
Duration (days) 130.981 193 95 0.111 * 300.596 340 249 0.253 *** 215.481 240 186 0.070
Cases 3403.787 6281.746 1406.369 0.381 *** 4536.999 6965.738 2689.269 0.336 *** 3940.650 6471.989 1914.770 0.374 ***
Deaths 125.465 271.645 33.464 0.431 *** 174.446 387.238 41.831 0.392 *** 153.225 336.377 33.464 0.411 ***
Cases/duration 25.789 45.613 13.788 0.399 *** 15.270 24.595 8.704 0.426 *** 18.336 30.461 8.664 0.437 ***
Deaths/duration 0.951 2.245 0.314 0.405 *** 0.586 1.340 0.137 0.445 *** 0.712 1.633 0.167 0.411 ***
Significance level: *** p < 0.01, * p < 0.1.
Figure 1 shows an example of the identification strategy, using the municipality of Pudahuel (253,139 inhabitants) [16]. First, the x-axis registers the number of cases per 100,000 people in the municipality, while the weeks of the year are on the y-axis. Second, the horizontal line depicts the threshold of the 70/100,000 cases used to identify the start/end of waves. Third, the vertical lines identify the thresholds for the wave’s dura-tion, using the following three previously described criteria: blue = criterion 1; purple = criterion 2; green = criterion 3. Finally, the colors in the bars identify the different stages of the step-by-step strategy, by level of stringency, as follows: red = stage 1 (quarantine); orange = stage 2 (transition); yellow = stage 3 (preparation); blue = stage 4 (initial open-ing); green = stage 5 (no restriction).
Figure 1. Waves’ identification example: Pudahuel.
Figure 2 shows this information for the 52 municipalities of the Metropolitan Re-gion. First, it is interesting to note the different patterns arising from the analysis of dif-ferent units. In terms of the evolution of cases, there are municipalities that exhibit two clearly defined modes in the distribution of cases (urban municipalities), while, in others, the identification of the end of wave 1 is unclear (cases keep moving up and down), or whether there are more than two waves over the period (rural municipalities). Finally, there are differences in the application of the step-by-step strategy, with municipalities
Figure 1. Waves’ identification example: Pudahuel.
Figure 2 shows this information for the 52 municipalities of the Metropolitan Region.First, it is interesting to note the different patterns arising from the analysis of differentunits. In terms of the evolution of cases, there are municipalities that exhibit two clearlydefined modes in the distribution of cases (urban municipalities), while, in others, theidentification of the end of wave 1 is unclear (cases keep moving up and down), or whetherthere are more than two waves over the period (rural municipalities). Finally, there aredifferences in the application of the step-by-step strategy, with municipalities facing earlyand prolonged quarantines, and others having less stringent measures, both during thefirst wave (2020) and the second wave (2021).
Table 2 exhibits the results for the number of cases and the cases adjusted by theduration of the wave. First, compared to the benchmark model (first 100 days in eachmunicipality) variables, multidimensional poverty and the use of public transportation arealso significant to explain both case rates, and the cases adjusted by duration. Interestingly,population density does not explain variation in the dependent variable when extendingthe period of analysis, while the distance to a health center becomes significant. In almostall models, the Moran’s I test for residuals appears as significant, showing the presence ofspatial autocorrelation in the regression. In terms of the model as a whole, the adjusted R2 islarger for the benchmark model (100 days), while statistical correlation is not removed fromthe regression when using wave 1 (definitions using the three proposed criteria) versusthe benchmark model. However, when looking at cases adjusted by duration, criterion 3outperforms the rest.

Int. J. Environ. Res. Public Health 2021, 18, 11058 5 of 8
Int. J. Environ. Res. Public Health 2021, 18, x FOR PEER REVIEW 5 of 9
facing early and prolonged quarantines, and others having less stringent measures, both during the first wave (2020) and the second wave (2021).
Figure 2. Cases, wave thresholds, and step-by-step stages in the Metropolitan Region. Figure 2. Cases, wave thresholds, and step-by-step stages in the Metropolitan Region.
Int. J. Environ. Res. Public Health 2021, 18, 11058 6 of 8
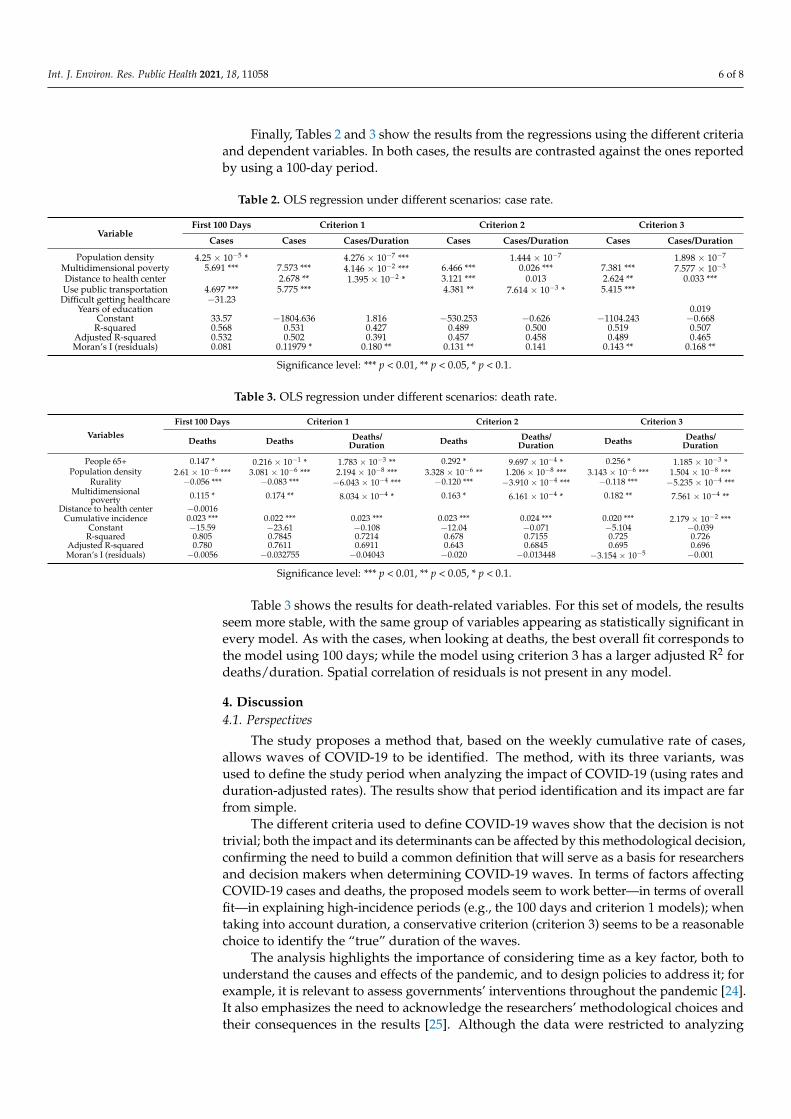
Finally, Tables 2 and 3 show the results from the regressions using the different criteriaand dependent variables. In both cases, the results are contrasted against the ones reportedby using a 100-day period.
Table 2. OLS regression under different scenarios: case rate.
VariableFirst 100 Days Criterion 1 Criterion 2 Criterion 3
Cases Cases Cases/Duration Cases Cases/Duration Cases Cases/Duration
Population density 4.25 × 10−5 * 4.276 × 10−7 *** 1.444 × 10⁻⁷ 1.898 × 10⁻⁷
Multidimensional poverty 5.691 *** 7.573 *** 4.146 × 10⁻² *** 6.466 *** 0.026 *** 7.381 *** 7.577 × 10⁻³
Distance to health center 2.678 ** 1.395 × 10−2 * 3.121 *** 0.013 2.624 ** 0.033 ***Use public transportation 4.697 *** 5.775 *** 4.381 ** 7.614 × 10−3 * 5.415 ***
Difficult getting healthcare −31.23Years of education 0.019
Constant 33.57 −1804.636 1.816 −530.253 −0.626 −1104.243 −0.668R-squared 0.568 0.531 0.427 0.489 0.500 0.519 0.507
Adjusted R-squared 0.532 0.502 0.391 0.457 0.458 0.489 0.465Moran’s I (residuals) 0.081 0.11979 * 0.180 ** 0.131 ** 0.141 0.143 ** 0.168 **
Significance level: *** p < 0.01, ** p < 0.05, * p < 0.1.
Table 3. OLS regression under different scenarios: death rate.
Variables
First 100 Days Criterion 1 Criterion 2 Criterion 3
Deaths Deaths Deaths/Duration Deaths Deaths/
Duration Deaths Deaths/Duration
People 65+ 0.147 * 0.216 × 10−1 * 1.783 × 10−3 ** 0.292 * 9.697 × 10−4 * 0.256 * 1.185 × 10−3 *Population density 2.61 × 10⁻⁶ *** 3.081 × 10⁻⁶ *** 2.194 × 10⁻⁸ *** 3.328 × 10⁻⁶ ** 1.206 × 10⁻⁸ *** 3.143 × 10⁻⁶ *** 1.504 × 10⁻⁸ ***
Rurality −0.056 *** −0.083 *** −6.043 × 10⁻⁴ *** −0.120 *** −3.910 × 10⁻⁴ *** −0.118 *** −5.235 × 10⁻⁴ ***Multidimensional
poverty 0.115 * 0.174 ** 8.034 × 10−4 * 0.163 * 6.161 × 10−4 * 0.182 ** 7.561 × 10⁻⁴ **Distance to health center −0.0016
Cumulative incidence 0.023 *** 0.022 *** 0.023 *** 0.023 *** 0.024 *** 0.020 *** 2.179 × 10⁻² ***Constant −15.59 −23.61 −0.108 −12.04 −0.071 −5.104 −0.039
R-squared 0.805 0.7845 0.7214 0.678 0.7155 0.725 0.726Adjusted R-squared 0.780 0.7611 0.6911 0.643 0.6845 0.695 0.696Moran’s I (residuals) −0.0056 −0.032755 −0.04043 −0.020 −0.013448 −3.154 × 10⁻⁵ −0.001
Significance level: *** p < 0.01, ** p < 0.05, * p < 0.1.
Table 3 shows the results for death-related variables. For this set of models, the resultsseem more stable, with the same group of variables appearing as statistically significant inevery model. As with the cases, when looking at deaths, the best overall fit corresponds tothe model using 100 days; while the model using criterion 3 has a larger adjusted R2 fordeaths/duration. Spatial correlation of residuals is not present in any model.
4. Discussion4.1. Perspectives
The study proposes a method that, based on the weekly cumulative rate of cases,allows waves of COVID-19 to be identified. The method, with its three variants, wasused to define the study period when analyzing the impact of COVID-19 (using rates andduration-adjusted rates). The results show that period identification and its impact are farfrom simple.
The different criteria used to define COVID-19 waves show that the decision is nottrivial; both the impact and its determinants can be affected by this methodological decision,confirming the need to build a common definition that will serve as a basis for researchersand decision makers when determining COVID-19 waves. In terms of factors affectingCOVID-19 cases and deaths, the proposed models seem to work better—in terms of overallfit—in explaining high-incidence periods (e.g., the 100 days and criterion 1 models); whentaking into account duration, a conservative criterion (criterion 3) seems to be a reasonablechoice to identify the “true” duration of the waves.
The analysis highlights the importance of considering time as a key factor, both tounderstand the causes and effects of the pandemic, and to design policies to address it; forexample, it is relevant to assess governments’ interventions throughout the pandemic [24].It also emphasizes the need to acknowledge the researchers’ methodological choices andtheir consequences in the results [25]. Although the data were restricted to analyzing

Int. J. Environ. Res. Public Health 2021, 18, 11058 7 of 8
COVID-19 in a particular setting, the analysis could be used—mutatis mutandis—in othersettings and for different health problems.
We hope that this method will contribute to the creation of a formal and commondefinition of a “wave”, allowing researchers and authorities to study and communicateabout the causes and consequences of the pandemic. The goal of the analysis is notto propose the method, but to highlight the need to have one method when studyingand deciding about COVID-19 waves. Other approaches have also been proposed (forexample, based on the effective reproduction number, R [26]); the study highlights theneed to advance towards adopting an objective measure as a way to enhance academicand policy dialogue.
4.2. Limitations
The study has several limitations that need to be considered when interpreting theresults. First, the initial motivation for the study was to highlight the need to have a“complete picture” for analyzing COVID-19 data; although the study extends the previous(restricted) definition of a period of 100 days, it needs to acknowledge that COVID-19 isstill ongoing, and future data can allow new and different types of results. Second, eventhough the general method to define waves can be replicated in other contexts, it requiresadaptation (e.g., the number of cases to define the threshold). Third, the criteria for definingwaves are based exclusively on the total number of confirmed cases. As previously stated,alternatively, the analysis can be performed using different variables, such as deaths orcases by COVID-19 variants, and considering testing in the region of study.
5. Conclusions
The information presented adds to the current literature on the causes and impactof COVID-19. It can be useful to monitor data; for example, to identify the rise in futurewaves in the country. We hope that these results motivate other researchers to assess otherways to solve these problems and contribute to fostering an evidence-based debate onCOVID-19.
Author Contributions: Conceptualization, A.A., P.V.D., F.E., C.C., C.V. and M.M.; methodology,A.A., P.V.D. and F.E.; software, A.A.; validation, A.A., P.V.D. and F.E.; formal analysis, A.A.; datacuration, A.A.; writing—original draft preparation, A.A. and P.V.D.; writing—review and editing,A.A., P.V.D., F.E., C.C., C.V. and M.M.; visualization, A.A.; project administration, F.E. and M.M.;funding acquisition, F.E. and M.M. All authors have read and agreed to the published version ofthe manuscript.
Funding: This research was funded by Universidad de Santiago, DICYT Asociativo Grant 022191MHDAS. The APC was funded by Universidad de Santiago, Dirección de Investigación Científica yTecnológica, Vicerrectoría de Investigación, Desarrollo e Innovación.
Institutional Review Board Statement: Not applicable.
Informed Consent Statement: Not applicable.
Data Availability Statement: Data used in the study is available at: https://github.com/MinCiencia/Datos-COVID19.
Acknowledgments: The authors thank the support of DICYT Asociativo Grant 022191MH DAS tocarry out the project “Understanding causes and consequences of COVID-19 and other diseases onpopulation health: multicausality, time, and space for decision-making”.
Conflicts of Interest: The authors declare no conflict of interest.
References1. Koffman, J.; Gross, J.; Etkind, S.N.; Selman, L. Uncertainty and COVID-19: How are we to respond? J. R. Soc. Med. 2020, 113,
211–216. [CrossRef] [PubMed]2. Rutter, H.; Wolpert, M.; Greenhalgh, T. Managing uncertainty in the covid-19 era. BMJ 2020, 370. [CrossRef] [PubMed]

Int. J. Environ. Res. Public Health 2021, 18, 11058 8 of 8
3. Van Damme, W.; Dahake, R.; Delamou, A.; Ingelbeen, B.; Wouters, E.; Vanham, G.; Van De Pas, R.; Dossou, J.-P.; Ir, P.;Abimbola, S.; et al. The COVID-19 pandemic: Diverse contexts; different epidemics—How and why? BMJ Glob. Health 2020, 5,e003098. [CrossRef] [PubMed]
4. Glenn, J.; Chaumont, C.; Villalobos Dintrans, P. Public health leadership in the times of COVID-19: A comparative case study ofthree countries. Int. J. Public Leadersh. 2020, 17, 81–94. [CrossRef]
5. Iftimie, S.; López-Azcona, A.F.; Vallverdú, I.; Hernández-Flix, S.; De Febrer, G.; Parra, S.; Hernández-Aguilera, A.; Riu, F.; Joven,J.; Andreychuk, N.; et al. First and second waves of coronavirus disease-19: A comparative study in hospitalized patients in Reus,Spain. PLoS ONE 2021, 16, e0248029. [CrossRef]
6. Soriano, V.; Ganado-Pinilla, P.; Sanchez-Santos, M.; Gómez-Gallego, F.; Barreiro, P.; De Mendoza, C.; Corral, O. Main differencesbetween the first and second waves of COVID-19 in Madrid, Spain. Int. J. Infect. Dis. 2021, 105, 374–376. [CrossRef] [PubMed]
7. Salyer, S.J.; Maeda, J.; Sembuche, S.; Kebede, Y.; Tshangela, A.; Moussif, M.; Ihekweazu, C.; Mayet, N.; Abate, E.; Ouma, A.O.; et al.The first and second waves of the COVID-19 pandemic in Africa: A cross-sectional study. Lancet 2021, 397, 1265–1275. [CrossRef]
8. Jain, V.K.; Iyengar, K.P.; Vaishya, R. Differences between First wave and Second wave of COVID-19 in India. Diabetes Metab. Syndr.2021, 15, 1047–1048. [CrossRef] [PubMed]
9. Coccia, M. The impact of first and second wave of the COVID-19 pandemic in society: Comparative analysis to support controlmeasures to cope with negative effects of future infectious diseases. Environ. Res. 2021, 197, 111099. [CrossRef] [PubMed]
10. Chowell, G.; Rothenberg, R.; Roosa, K.; Tariq, A.; Hyman, J.M.; Luo, R. Sub-epidemic model forecasts for COVID-19 pandemicspread in the USA and European hotspots. MedRxiv 2020. [CrossRef]
11. COVID-19 Explorer. Available online: https://worldhealthorg.shinyapps.io/covid/ (accessed on 20 August 2021).12. Available online: https://coronavirus.jhu.edu (accessed on 20 August 2021).13. Castillo, C.; Villalobos Dintrans, P.; Maddaleno, M. The successful COVID-19 vaccine rollout in Chile: Factors and challenges.
Vaccine X 2021, 9. [CrossRef]14. Villalobos Dintrans, P.; Castillo, C.; De La Fuente, F.; Maddaleno, M. COVID-19 incidence and mortality in the Metropolitan
Region, Chile: Time, space, and structural factors. PLoS ONE 2021, 16, e0250707. [CrossRef]15. Mena, G.E.; Martinez, P.P.; Mahmud, A.S.; Marquet, P.A.; Buckee, C.O.; Santillana, M. Socioeconomic status determines COVID-19
incidence and related mortality in Santiago, Chile. Science 2021, 372, eabg5298. [CrossRef]16. Proyecciones de Población. Available online: https://www.ine.cl/estadisticas/sociales/demografia-y-vitales/proyecciones-de-
poblacion (accessed on 20 August 2021).17. Actualización al Plan PASO a PASO Nos Cuidamos. Available online: https://s3.amazonaws.com/gobcl-prod/public_files/
Campa~nas/Corona-Virus/documentos/paso-a-paso/Documento_actualizacion_Paso_a_Paso.pdf (accessed on 20 August2021).
18. Actualización de la Estrategia Gradual “Paso a Paso nos Cuidamos”. Available online: http://www.seguridadciudadana.gob.cl/media/2021/01/210111-Actualizacion-Paso-a-Paso.pdf (accessed on 20 August 2021).
19. Encuesta de Caracterización Socioeconómica Nacional CASEN 2017. Available online: http://observatorio.ministeriodesarrollosocial.gob.cl/encuesta-casen-2017 (accessed on 20 August 2021).
20. Actualización de la Definición de Caso Sospechoso, Probable y Confirmado Para Vigilancia Epidemiológica Ante Pandemiade COVID-19 en Chile. Available online: https://www.minsal.cl/wp-content/uploads/2021/02/ORD-536-04-02-2021.pdf(accessed on 20 August 2021).
21. Plan de Acción Coronavirus COVID-19: Tipo de Caso y Contacto COVID19. Available online: https://saludresponde.minsal.cl/tipos-de-caso-y-contacto-covid19/#:~:text=Si%20por%20cualquier%20motivo%2C%20un,realizar%20aislamiento%20como%20caso%20confirmado (accessed on 20 August 2021).
22. MinCiencia/Datos-COVID19. Available online: https://github.com/MinCiencia/Datos-COVID19 (accessed on 9 August 2021).23. Available online: https://deis.minsal.cl/#datosabiertos (accessed on 9 August 2021).24. Hale, T.; Angrist, N.; Hale, A.J.; Kira, B.; Majumdar, S.; Petherick, A.; Phillips, T.; Sridhar, D.; Thompson, R.N.; Webster, S.; et al.
Government responses and COVID-19 deaths: Global evidence across multiple pandemic waves. PLoS ONE 2021, 16, e0253116.[CrossRef] [PubMed]
25. Villalobos Dintrans, P.; Chaumont, C. Examining the relationship between human resources and mortality: The effects ofmethodological choices. Int. J. Public Health 2017, 62, 361–370. [CrossRef] [PubMed]
26. Zhang, S.X.; Arroyo Marioli, F.; Gao, R.; Wang, S. A Second Wave? What Do People Mean by COVID Waves?–A WorkingDefinition of Epidemic Waves. Risk Manag. Healthc. Policy 2021, 14, 3775–3782. [CrossRef] [PubMed]