Embed Size (px)
Citation preview
International Journal on Asian Language Processing 20 (2):43-61 43
Identification of Closely-Related Indigenous Languages:
An Orthographic Approach
Ng Ee-Lee
1, Beatrice Chin
2, Alvin W. Yeo
3, Bali Ranaivo-Malançon
4
Faculty of Computer Science and Information Technology, Universiti Malaysia Sarawak,
Sarawak, Malaysia1,2,3
Faculty of Information Technology, Multimedia University, Cyberjaya, Malaysia4
[email protected], [email protected]
3,
_________________________________________________________________________
Abstract
The main focus of this study is to identify the closely related languages among the
indigenous languages of Sarawak, Malaysia (on the island of Borneo) and major languages
such as Bahasa Melayu (the national language of Malaysia) and English. The indigenous
languages involved in this study include Iban (standard), Bidayuh (Bau-Jagoi), Kelabit
(Bario), Melanau (Matu-Daro), Sa’ban (Long Banga) and Penan (East Baram). The
relationship between the languages is established via the proportion of cognates in the
Swadesh list of the language pairs. The orthographic approach, which primarily examines
the spelling of the vocabulary words, is used. The outcome of this study reveals that some
indigenous languages are more closely-related to Bahasa Melayu than the others. The
findings from this research serve as an initial solution to answer the greater challenges in
computational linguistics, such as the use of closely-related languages as pivot solutions in
problems related to the under-resourced languages.
Keywords
Closely-related languages, under-resourced languages, cognates
_________________________________________________________________________
1. Introduction
According to the Ethnologue, there are 6,912 known living languages in this world.
However, only about 30 out of all these languages have been successful in maintaining
their Information Communication and Technologies (ICTs) presence (Scannell 2007). For
example, it is crucial for a language to have modern language technologies and tools such
as machine translation (MT) and speech recognition. In fact, many languages lack access to
basic computational linguistic resources that would make it an available option for its use in
the development of applications. It has been observed that the unavailability of a native
language as a functional language in ICTs has been one of the factors causing the native
languages to be replaced by a second language for daily usage (language shift) within the
speaker communities. As a result of the language shift, the native languages are bound to
become extinct if human language technologies are not implemented in time for these
44 Ng Ee-Lee, Beatrice Chin, Alvin Wee Yeo, Bali Ranaivo-Malançon
languages. In Sarawak, a state in Malaysia (located on the island of Borneo), the 63 known
indigenous languages spoken by the indigenous communities also lack the ICT presence
and the language technologies necessary to maintain them. These languages are often
referred to as the under-resourced languages (URLs). In addition, there are very few
linguists who are experts in these languages. The fact that only sparse linguistic resources
and literature are available for these languages makes the creation and development of any
applications that is based on these languages even more difficult. A plausible solution to
alleviate this resource sparseness problem is to take advantage of the properties of closely-
related languages (CRLs), where the resources of one language is used to generate more
linguistic materials for the URLs, which are CRLs. These resources can be used in the
application development of the URLs. Therefore, there is a need to identify the closely
related languages that can bridge the resource gap of the URLs and hence enable their
application developments.
2. Related Work
Languages which share similar linguistic properties, be it in the aspect of phonology,
morphology or syntax, are called closely-related languages (CRLs). In determining the
relationship between the languages, Lexicostatistics [3], a statistical-based method which
analyses lexical cognates is often used. The higher the proportion of cognacy, the closer the
languages are said to be related. Cognates by definition are words that are derived from a
common origin. However, in the context of this study, cognates denote words that have
similar meaning and form, that is, orthographically and semantically similar but do not
differentiate between genetically related and borrowed words (Kondrak 2001). In corpus
linguistics, cognates have been used for a variety of purposes including aligning bi-text and
extracting translation lexicons. In the experiment conducted by Simard et al. (1992), French
and English bi-texts are obtained by manually aligning a small texts of the Canadian
Hansards based on cognates. In their experiment, they assumed that French-English word
pairs are cognates if their first four characters are identical. They, then, modified the length-
based program to take advantage of the cognate information. The result shows that using
cognate as the alignment criterion yields better results than the length-based criterion.
Traditionally, the cognacy of the word pairs of the two languages is identified based on
the phonetic similarity. Rohani (2003) has conducted a study to identify the relationship
between Bahasa Melayu and Iban using the lexicostatistics approach. The phonetic
components of the 100 (Bahasa Melayu – Iban) word pairs were examined to determine
whether they are cognates. The proportion of cognate was found to be 69%, suggesting that
the two languages are indeed very close, as compared to other languages in the same
family, namely Jawa, Tagalog, Aceh and Sunda, of which the scores are between 35% and
40%.
The use of the phonetic component to determine the cognacy and hence the level of
similarity of the languages, however, pre-supposes extensive linguistic knowledge of the
languages being investigated. As an alternative to that, the orthographic approach which
examines the spelling similarity of the word pairs has been used.
Identification of Closely-Related Indigenous Languages: An Orthographic Approach 45
2.1. Orthographic Approach
The orthographic approach deals with the spelling system of a language and is commonly
used in corpus linguistics. According to Kondrak (2001), in determining word pairs which
are orthographically similar, it is assumed that words in one language tend to go through
certain changes in spelling when they are being introduced into another language. Several
orthographic similarity measurements are described below.
2.1.1. Levenshtein Distance
Levenshtein distance (Levenshtein, 1965) is a distance metric that measures the amount the
difference (edit distance) between two strings. The Levenshtein distance calculates the
minimum number of insertion, deletion or substitution operations of a character required to
change the source string into a target string. The algorithm considers one character of the
string at a time. It assigns cost to each of the edit operations. The algorithm weights the cost
of each operation and chooses the operation with the lowest cost and then moves on to the
next character. For two strings with length m and n, the number of comparisons is the larger
of m and n.
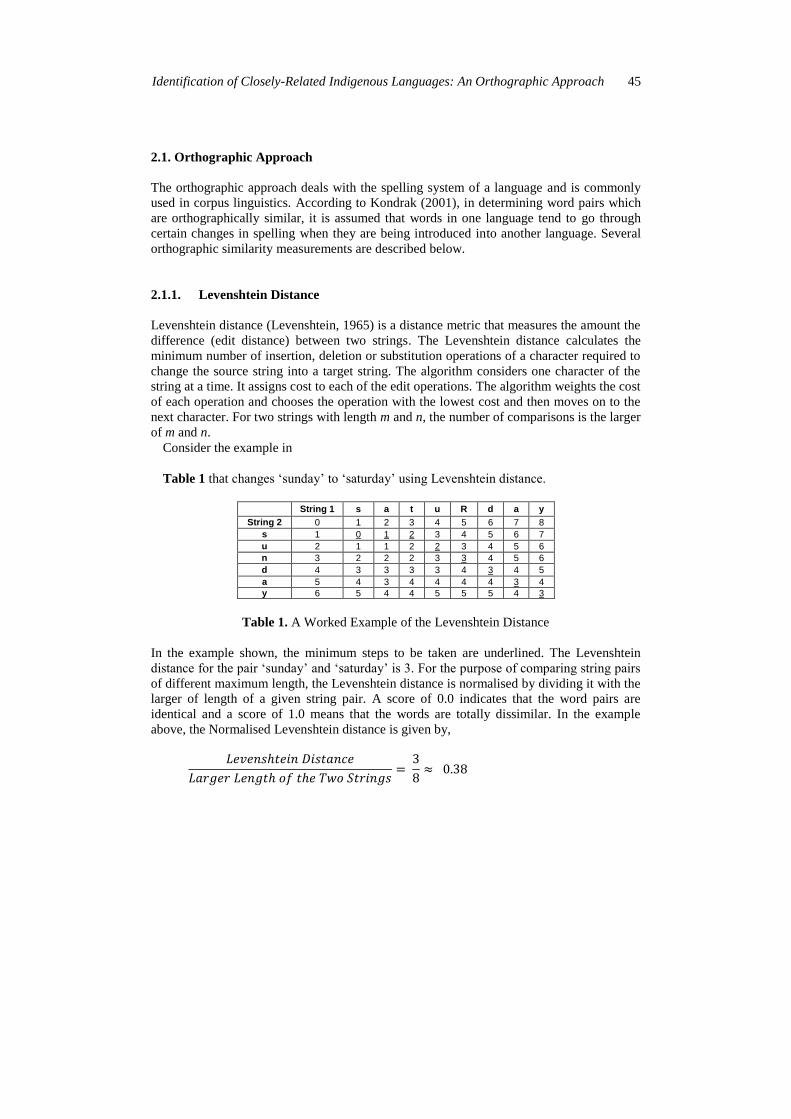
Consider the example in
Table 1 that changes „sunday‟ to „saturday‟ using Levenshtein distance.
String 1 s a t u R d a y
String 2 0 1 2 3 4 5 6 7 8
s 1 0 1 2 3 4 5 6 7
u 2 1 1 2 2 3 4 5 6
n 3 2 2 2 3 3 4 5 6
d 4 3 3 3 3 4 3 4 5
a 5 4 3 4 4 4 4 3 4
y 6 5 4 4 5 5 5 4 3
Table 1. A Worked Example of the Levenshtein Distance
In the example shown, the minimum steps to be taken are underlined. The Levenshtein
distance for the pair „sunday‟ and „saturday‟ is 3. For the purpose of comparing string pairs
of different maximum length, the Levenshtein distance is normalised by dividing it with the
larger of length of a given string pair. A score of 0.0 indicates that the word pairs are
identical and a score of 1.0 means that the words are totally dissimilar. In the example
above, the Normalised Levenshtein distance is given by,
46 Ng Ee-Lee, Beatrice Chin, Alvin Wee Yeo, Bali Ranaivo-Malançon
2.1.2. Longest Common Subsequence
The Longest Common Subsequence (LCS) (Wagner and Fischer, 1974) is a string
similarity measurement that is based on the longest common substring in a given string
pair. The rationale is that, parts of the string may be similar while their prefixes or suffixes
differ. The algorithm finds the longest common character sequence (the LCS), between a
string pair. The characters in the LCS do not necessarily need to be contiguous in the
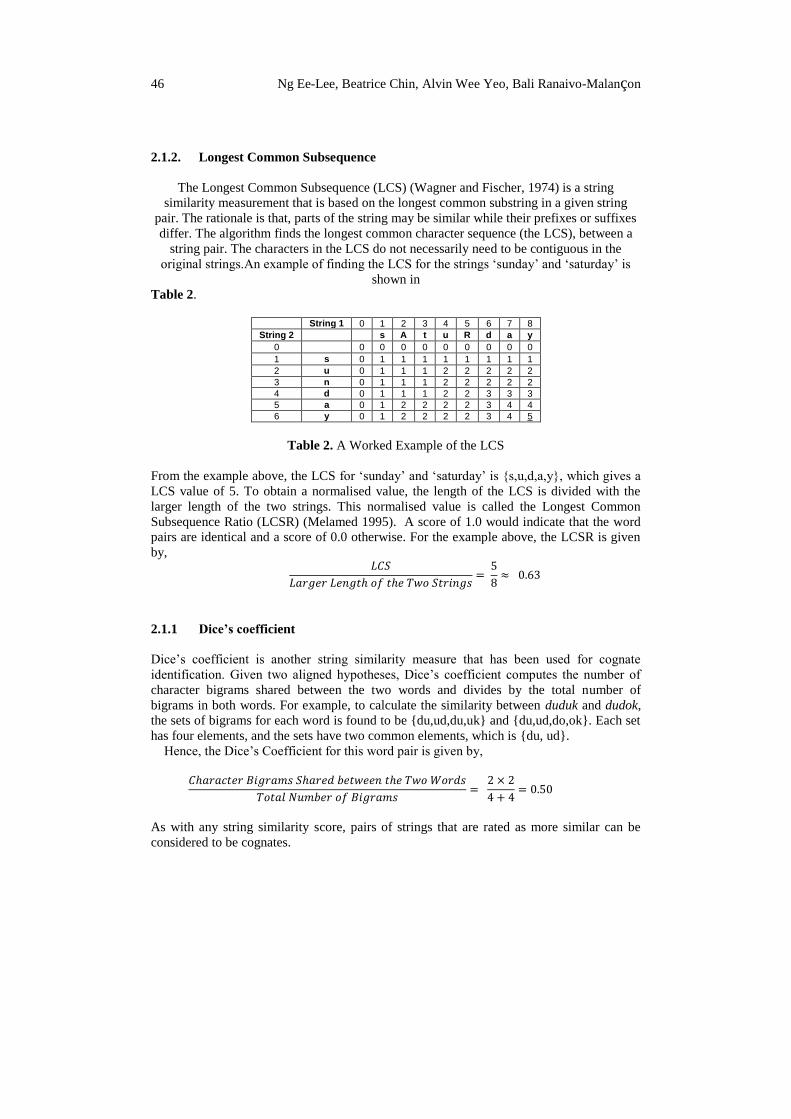
original strings.An example of finding the LCS for the strings „sunday‟ and „saturday‟ is
shown in
Table 2.
String 1 0 1 2 3 4 5 6 7 8
String 2 s A t u R d a y
0 0 0 0 0 0 0 0 0 0
1 s 0 1 1 1 1 1 1 1 1
2 u 0 1 1 1 2 2 2 2 2
3 n 0 1 1 1 2 2 2 2 2
4 d 0 1 1 1 2 2 3 3 3
5 a 0 1 2 2 2 2 3 4 4
6 y 0 1 2 2 2 2 3 4 5
Table 2. A Worked Example of the LCS
From the example above, the LCS for „sunday‟ and „saturday‟ is {s,u,d,a,y}, which gives a
LCS value of 5. To obtain a normalised value, the length of the LCS is divided with the
larger length of the two strings. This normalised value is called the Longest Common
Subsequence Ratio (LCSR) (Melamed 1995). A score of 1.0 would indicate that the word
pairs are identical and a score of 0.0 otherwise. For the example above, the LCSR is given
by,
2.1.1 Dice’s coefficient
Dice‟s coefficient is another string similarity measure that has been used for cognate
identification. Given two aligned hypotheses, Dice‟s coefficient computes the number of
character bigrams shared between the two words and divides by the total number of
bigrams in both words. For example, to calculate the similarity between duduk and dudok,
the sets of bigrams for each word is found to be {du,ud,du,uk} and {du,ud,do,ok}. Each set
has four elements, and the sets have two common elements, which is {du, ud}.
Hence, the Dice‟s Coefficient for this word pair is given by,
As with any string similarity score, pairs of strings that are rated as more similar can be
considered to be cognates.
Identification of Closely-Related Indigenous Languages: An Orthographic Approach 47
3. Methodology
Based on the background study, the orthographic approach has been used to achieve the
objective of this research. The orthographic approach identifies the positive cognates based
on the similarity of spellings or phonetic transcriptions by string and pattern matching. The
advantage of this method is that it can be readily applied to standard text. In addition, the
algorithms for string and pattern matching, namely, Levenshtein Distance, LCSR and
Dice‟s coefficient are relatively straightforward. Furthermore, unlike the phonological
approach, which presupposes the phonetic transcriptions of words into the phonetic or
phonemic representation, for instance, using the International Phonetic Alphabets (IPA),
the orthographic approach does not require phonological or phonetic information. This
makes the orthographic approach suitable for analysts who are not acquainted with the IPA.
The orthographic method is also said to be empirical, as it does not require insights from
the linguists. The following sections explain briefly the overall procedure to establish the
relative closeness between languages using the orthographic approach.
3.1 Overall Procedure
3.1.1 Word List Elicitation
For each language, a word list consisting of the translation equivalents of the vocabulary
items in the Swadesh list is prepared. A Swadesh list is a list of vocabulary with „basic‟
meanings, developed by Morris Swadesh in the 1940–50s. The basic vocabulary is chosen
because it changes at a slower rate than other aspects of the lexicon (Swadesh, 1952), and is
less likely to be borrowed between languages (Embleton, 1986).
Concern has been raised regarding the use of the Swadesh list as the reference list for
lexicostatistics (Embleton, 1986; Gudschinsky, 1956; Hoijer, 1956; Kessler, 2001;
Renfrew, 2002). It was argued that the list is not universal and culture-free. However, in the
context of Sarawak, where the speaker communities are not isolated (that is the speakers,
can be found within an island), the concepts that are present in the languages most likely
will be similar albeit different terms might be used. Hence, the use of the Swadesh list is
justifiable. In this study, the 200-item Swadesh list is used. It is possible that the list used
for comparison is less than 200 words. This is necessarily true because some of the
concepts in the original English Swadesh list might not exist in the indigenous languages.
Typically, the word lists are prepared by dictionary lookup for the translation equivalents.
In cases where dictionaries are not available, the words can be elicited from the speakers of
the languages. The elicited words are the phonetic transcriptions written with the Latin
alphabet. In this study, all the indigenous languages concerned use the Latin alphabet.
3.1.2 Orthographic Similarity Analysis
The orthographic similarity analysis is carried out next. The Normalised Levenshtein
Distance (NLD) is used to measure the similarity of the word pairs. In this experiment
setting, the cost of each character operation is set as 1 for insertion and deletion and 0 for
substitution.
To compare the cognacy decision derived using the NLD, a similarity metric is
considered. The reason for using a similarity metric instead of a second distance metric is
48 Ng Ee-Lee, Beatrice Chin, Alvin Wee Yeo, Bali Ranaivo-Malançon
based on the rationale that the distance metric can be viewed as the inverse function of the
similarity metric, that is, shorter distance (lower distance score) means higher similarity and
vice versa. Both the distance and similarity metric can serve to crosscheck the cognacy
decisions.
Considering the fact that some of the languages selected for this study are inflective, for
instance, Bahasa Melayu (BM) and Iban, a string similarity measurement that is able to
overcome the influence of the affixes in the cognacy decision would be appropriate. In view
of this, the LCSR was chosen and thus, the LCSR for each word pairs are calculated in this
step.
3.1.3 Identify Cognate
In this step, the threshold value which determines the cut-off point between positive
cognate and negative cognate is calculated. To calibrate the orthographic similarity
measurements, a preliminary study would be conducted on the BM and Iban language pair
to obtain the threshold values. The BM - Iban language pair is used mainly because only
Iban has a standardised spelling system among the under-resourced languages and that BM
and Iban have been known to be closely related. The preliminary study would identify the
threshold values that the orthographic similarity measurements perform most closely to the
manual cognate identification by a linguist.
The thresholds are applied to the resultant distance/similarity score from Section 3.1.2.
For NLD, the word pairs that are below the threshold (that is, lower distance) are classified
as positive cognates whereas those above the threshold are classified as negative cognates.
Contrary to the NLD, word pairs that have LCSR above the threshold (that is, higher
similarity) are classified as positive cognate and are assigned negative cognate if they fall
below the threshold.
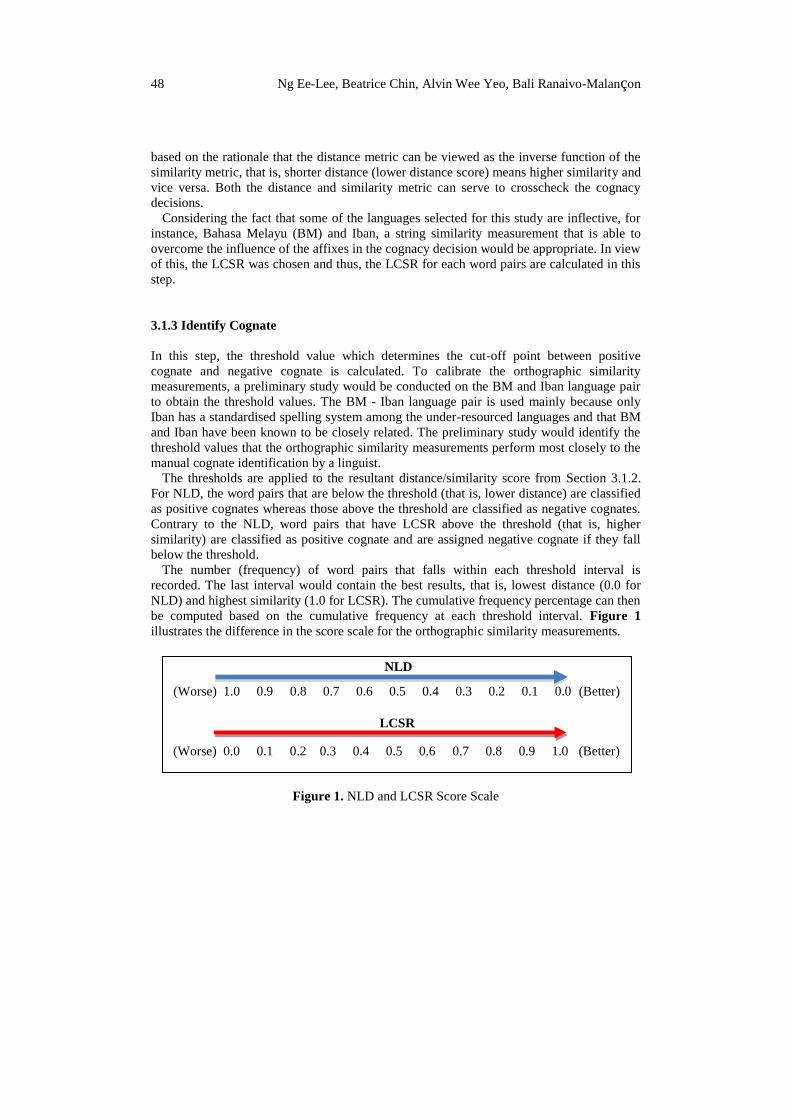
The number (frequency) of word pairs that falls within each threshold interval is
recorded. The last interval would contain the best results, that is, lowest distance (0.0 for
NLD) and highest similarity (1.0 for LCSR). The cumulative frequency percentage can then
be computed based on the cumulative frequency at each threshold interval. Figure 1
illustrates the difference in the score scale for the orthographic similarity measurements.
Figure 1. NLD and LCSR Score Scale
NLD
LCSR
(Worse) 1.0 0.9 0.8 0.7 0.6 0.5 0.4 0.3 0.2 0.1 0.0 (Better)
(Worse) 0.0 0.1 0.2 0.3 0.4 0.5 0.6 0.7 0.8 0.9 1.0 (Better)
Identification of Closely-Related Indigenous Languages: An Orthographic Approach 49
3.1.4 Calculate Percentage of Cognate
The positive cognates identified in Section 3.1.3 are then used to calculate the percentage of
cognate for the language pairs. The percentage of cognates relates to the proportion of the
word pairs that are considered positive cognates with respect to the total number of word
pairs examined. It measures the relative closeness of a particular pair of languages. The
cognate percentage calculation is given by the formula,
For n languages that are being compared, a n × n table with its lower triangular filled with
percentage of cognates will be produced.
3.1.5 Establish Relative Closeness between Languages
The cognate percentages obtained from D are used to establish the relationship between
languages. The higher the cognate percentage, the closer are the languages and vice versa.
To visualise the relationship among the languages, the Unweighted Pair Group Method
with Arithmetic mean (UPGMA) method is used to construct a rooted tree based on the
pair-wise distance of the languages. The UPGMA method is a bottom-up clustering method
that is often used in the field of bioinformatics to create phylogenetic trees. In historical
linguistics, the UPGMA method is used to picture the linguistic distance between
languages.
3.1.6 Evaluation
The result of the cognacy assessment is evaluated via the following two methods:
i. Evaluation metrics, namely, precision and recall
ii. Evaluation by linguist
3.1.6.1 Evaluation Metrics
The cognacy decision is a form of statistical classification. To evaluate the performance of
the orthographic similarity measurements, two evaluation metrics: precision and recall are
used. The terms true positives, true negatives, false positives and false negatives are used to
compare the classification results (class labels) obtained from a classifier to the actual
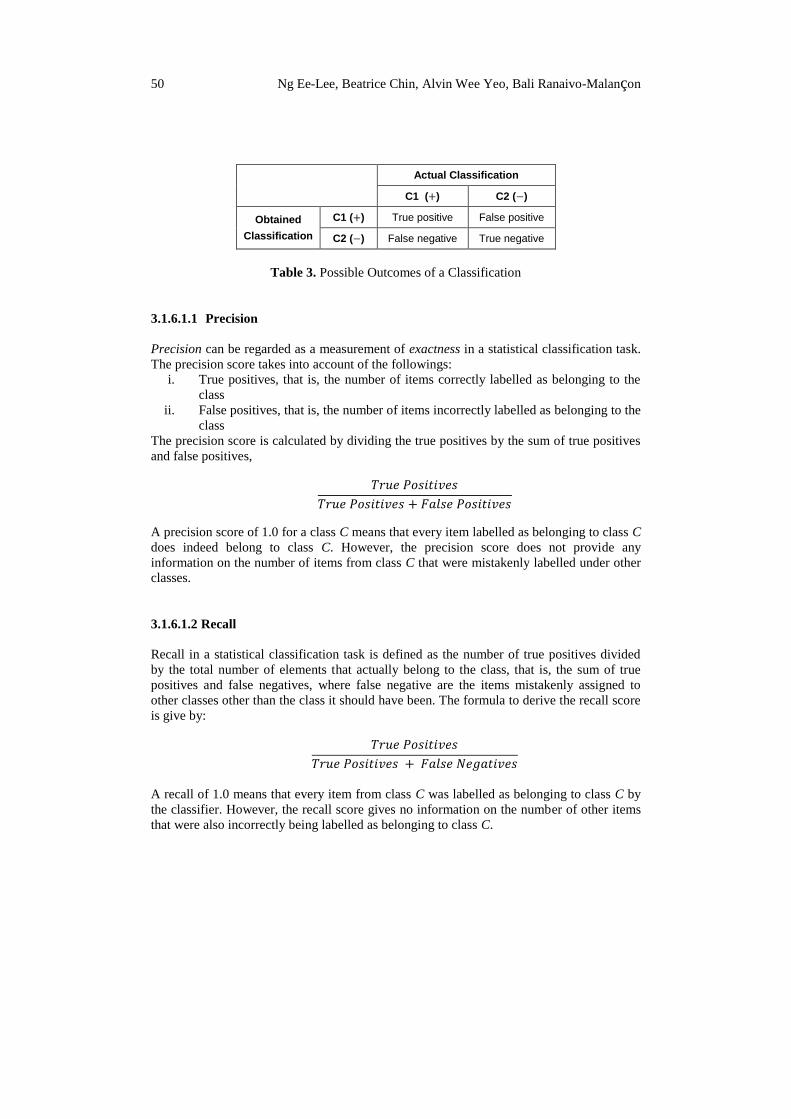
classification, that is, the actual class that the item belongs to. Table 3 illustrates the
possible outcomes. The (+) sign indicates positive cognates, whereas the (-) sign denotes
negative cognates.
50 Ng Ee-Lee, Beatrice Chin, Alvin Wee Yeo, Bali Ranaivo-Malançon
Actual Classification
C1 ( ) C2 ( )
Obtained
Classification
C1 ( ) True positive False positive
C2 ( ) False negative True negative
Table 3. Possible Outcomes of a Classification
3.1.6.1.1 Precision
Precision can be regarded as a measurement of exactness in a statistical classification task.
The precision score takes into account of the followings:
i. True positives, that is, the number of items correctly labelled as belonging to the
class
ii. False positives, that is, the number of items incorrectly labelled as belonging to the
class
The precision score is calculated by dividing the true positives by the sum of true positives
and false positives,
A precision score of 1.0 for a class C means that every item labelled as belonging to class C
does indeed belong to class C. However, the precision score does not provide any
information on the number of items from class C that were mistakenly labelled under other
classes.
3.1.6.1.2 Recall
Recall in a statistical classification task is defined as the number of true positives divided
by the total number of elements that actually belong to the class, that is, the sum of true
positives and false negatives, where false negative are the items mistakenly assigned to
other classes other than the class it should have been. The formula to derive the recall score
is give by:
A recall of 1.0 means that every item from class C was labelled as belonging to class C by
the classifier. However, the recall score gives no information on the number of other items
that were also incorrectly being labelled as belonging to class C.

Identification of Closely-Related Indigenous Languages: An Orthographic Approach 51
3.1.6.2 Evaluation By The Linguist
Traditionally, cognacy assessment is made by a trained linguist who has the knowledge of
the languages concerned. The linguist employs a different approach to cognate
identification, that is, they use the phonological component of the languages as the
comparison criteria instead of the orthographic component. The cognacy decisions made by
a linguist will not have false positive. Therefore, to validate the results of the cognacy
assessment via the orthographic approach obtained in this study, several linguists are
engaged. The first linguist, Associate Professor Dr. Rohani Mohd. Yusof, is from the
Academy of Malay Studies, Universiti Malaya. She is an expert in the field of Malay
language studies. The second linguist is Salbiah Hassan, a lecturer from the Centre of
Language Studies, Universiti Malaysia Sarawak. Her main research is in the area of
Melanau language studies.
3.2 The Languages
In the context of Sarawak, indigenous languages such as Kelabit (Bario), Melanau (Matu-
Daro), Penan (East Baram), Sa‟ban (Long Banga), Bidayuh (Bau-Jagoi), among others, are
considered URLs. These languages have limited online resources as well as literature that
could possibly be used to extract linguistic information necessary for human language
technology development. These languages have not been studied before for their
relationship among each other and thus will be the focus of this research.
Table 4 summarises these languages.
Language Dialect Location in Sarawak
Iban - Third Division, Sadong River north to Bintulu, Sibu, one village in Tawau.
Bidayuh Bau-Jagoi Bau, Jagoi
Kelabit - Bario
Melanau Matu-Daro Matu, Daro, Pulau Beruit, Batang Lasa
Sa’ban - Long Banga
Penan Timur
Baram
Long Lamai
Table 4. Indigenous Languages of Sarawak and their Locations
The languages concerned in this study can be essentially grouped into two categories,
namely, major language and minority/under-resourced language. Among which, Bahasa
Melayu and the indigenous languages belongs to the Austronesian family, whereas English
belongs to the West Germanic group of Indo-European languages. Comparison is done
between languages from different language family in this research as a way to test the
system for its efficacy in identifying false positives cognates.
Amongst the URLs listed in
Table 4, only Iban language, which is spoken by the largest ethnic community in
Sarawak, has been taught in both primary and secondary schools and it has been recently
introduced as one of the examination papers in the Malaysia Certificate of Education, a

52 Ng Ee-Lee, Beatrice Chin, Alvin Wee Yeo, Bali Ranaivo-Malançon
national examination taken by all fifth form students in Malaysia. As for the other
languages, although none of them is taught in school, some of them have more resources
like the Bidayuh who has literature books, dictionaries, storybooks and so on whilst other
languages such as the Kelabit, Melanau and Sa‟ban only has existing phrasebooks. As for
the Penan language, this language is selected in this research due to the current
implementation of rural ICT projects by the university that takes place in the Penan area
and therefore it facilitates the data collection process from the community.
3.3 Orthography
English, Bahasa Melayu and Iban are written using Latin alphabets based on a standardised
orthography system. However, Kelabit, Melanau, Bidayuh, Penan and Sa‟ban do not have
standardised spelling system. Words are pronounced and spelled based on individual‟s
preferences. For example, in the Kelabit language, the word „two‟, could be spelled as dueh
or duweh. In this study, in the absence of standardised spelling, the spellings were based on
the interviewee, who is a native speaker.
3.4 Assumption
Since this study involves the under-resourced languages, where the linguistic resources are
not common, it is necessary to elicit data from the speakers of the languages. The data
collector may have an oral conversation with the informant and the conversation might be
recorded. The words spoken by the informant are then transcribed (not necessarily by the
data collector). Hence, it is necessary to make assumption regarding the transcribed data. It
is assumed that the informant pronounced the words correctly and that the words are
transcribed correctly by the person who is engaged to do the transcription. According to Dr.
Rohani, the assumption holds as long as the data is properly elicited from an informant who
is knowledgeable of the language and that the data transcription is consistent (preferably by
the same person).
4 Result and Analysis
To ensure the performance of NLD and LCSR resembles the linguist cognancy decisions as
closely as possible, the thresholds for these two methods are determined by conducting a
preliminary study using the BM and Iban 100-items Swadesh lists.
4.1 Word List
In order to verify the classification results of the orthographic similarity analysis against the
cognacy decisions made by a linguist, the word selection is based on (Rohani 2003).

Identification of Closely-Related Indigenous Languages: An Orthographic Approach 53
4.1.1 Identifying Thresholds
4.1.1.1 Normalised Levenshtein Distance (NLD)
For NLD, the threshold level is set at 1.0 in the beginning and decreases by 0.1 each time
until it reaches 0.0. The threshold levels and its corresponding cognate percentages,
precision and recall values are tabulated in
Table 5.
NLD
Threshold Cognate Percentage Precision Recall
1.00 100 0.69 1.00
0.90 94 0.73 1.00
0.80 85 0.84 0.99
0.70 80 0.85 0.99
0.60 78 0.93 0.96
0.50 70 0.97 0.90
0.40 61 1.00 0.86
0.30 54 1.00 0.78
0.20 50 1.00 0.54
0.10 32 1.00 0.46
0.00 32 1.00 0.46
Table 5. Cognate Percentage, Precision and Recall for each NLD Threshold
From
Table 5, it is observed that the precision values peak at the threshold of 0.40 and below,
whereas the recall values settle highest at the threshold of 0.90 and above. To obtain a clear
view of the precision-recall trend, the two metric values are plotted.
Figure 2 illustrates the precision-recall curve for the NLD.
54 Ng Ee-Lee, Beatrice Chin, Alvin Wee Yeo, Bali Ranaivo-Malançon
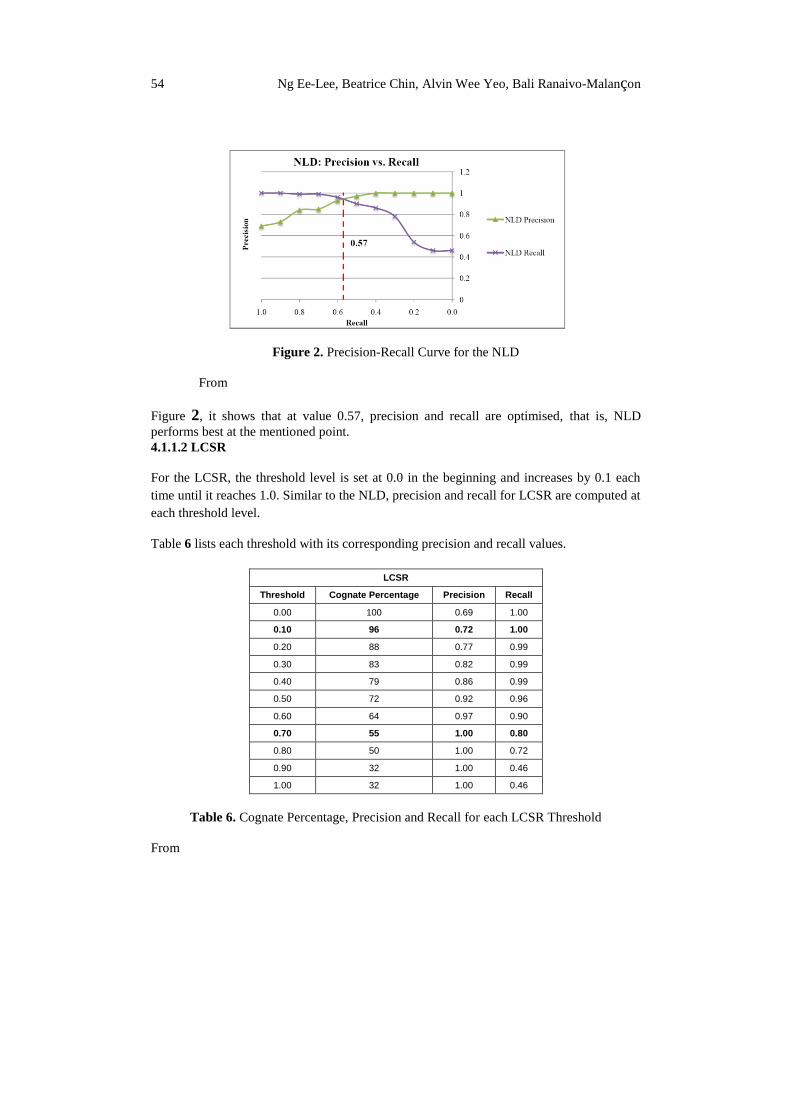
Figure 2. Precision-Recall Curve for the NLD
From
Figure 2, it shows that at value 0.57, precision and recall are optimised, that is, NLD
performs best at the mentioned point.
4.1.1.2 LCSR
For the LCSR, the threshold level is set at 0.0 in the beginning and increases by 0.1 each
time until it reaches 1.0. Similar to the NLD, precision and recall for LCSR are computed at
each threshold level.
Table 6 lists each threshold with its corresponding precision and recall values.
LCSR
Threshold Cognate Percentage Precision Recall
0.00 100 0.69 1.00
0.10 96 0.72 1.00
0.20 88 0.77 0.99
0.30 83 0.82 0.99
0.40 79 0.86 0.99
0.50 72 0.92 0.96
0.60 64 0.97 0.90
0.70 55 1.00 0.80
0.80 50 1.00 0.72
0.90 32 1.00 0.46
1.00 32 1.00 0.46
Table 6. Cognate Percentage, Precision and Recall for each LCSR Threshold
From
Identification of Closely-Related Indigenous Languages: An Orthographic Approach 55
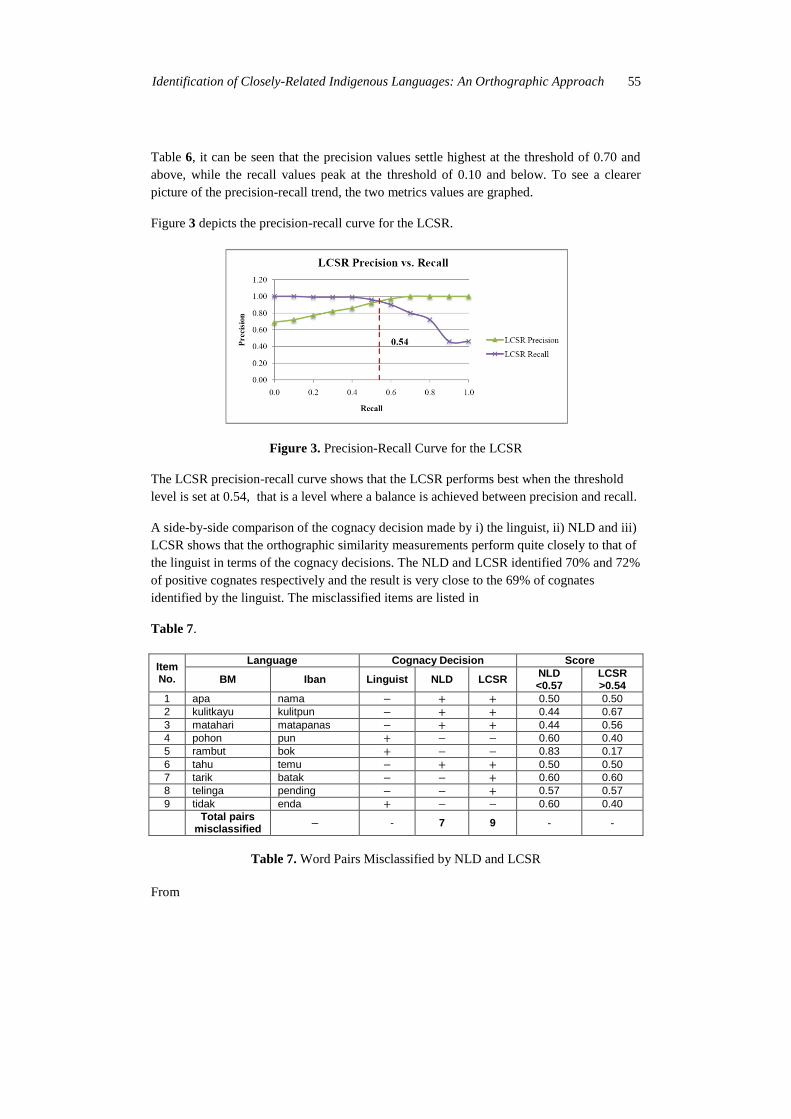
Table 6, it can be seen that the precision values settle highest at the threshold of 0.70 and
above, while the recall values peak at the threshold of 0.10 and below. To see a clearer
picture of the precision-recall trend, the two metrics values are graphed.
Figure 3 depicts the precision-recall curve for the LCSR.
Figure 3. Precision-Recall Curve for the LCSR
The LCSR precision-recall curve shows that the LCSR performs best when the threshold
level is set at 0.54, that is a level where a balance is achieved between precision and recall.
A side-by-side comparison of the cognacy decision made by i) the linguist, ii) NLD and iii)
LCSR shows that the orthographic similarity measurements perform quite closely to that of
the linguist in terms of the cognacy decisions. The NLD and LCSR identified 70% and 72%
of positive cognates respectively and the result is very close to the 69% of cognates
identified by the linguist. The misclassified items are listed in
Table 7.
Item No.
Language Cognacy Decision Score
BM Iban Linguist NLD LCSR NLD <0.57
LCSR >0.54
1 apa nama 0.50 0.50
2 kulitkayu kulitpun 0.44 0.67
3 matahari matapanas 0.44 0.56
4 pohon pun 0.60 0.40
5 rambut bok 0.83 0.17
6 tahu temu 0.50 0.50
7 tarik batak 0.60 0.60
8 telinga pending 0.57 0.57
9 tidak enda 0.60 0.40
Total pairs
misclassified - 7 9 - -
Table 7. Word Pairs Misclassified by NLD and LCSR
From
56 Ng Ee-Lee, Beatrice Chin, Alvin Wee Yeo, Bali Ranaivo-Malançon
Table 7, it can be seen that the orthographic similarity analysis using NLD misclassified
seven pairs, while using LCSR misclassified nine pairs. Among the list of misclassified
word pairs, most of the misclassification occurs as false positives. Item 4, 5 and 9 were
mistakenly classified as negative cognates (false negatives). These word pairs do not have
apparent spelling similarities that suggest they are positive cognates, therefore by
examining the orthography alone cannot distinguish these word pairs as positive cognates.
In addition, the percentage of misclassification for both orthographic similarity measures is
below 10%, which, in this study is considered acceptable for the purpose of establishing
relative closeness between languages.
4.2 Complete Analysis
The orthographic similarity analysis is conducted for all the language pairs by using the
threshold levels obtained in section 4.1.
Table 8 summarises the languages pairs and the size of the word list used respectively.
Language BM Iban English Kelabit Melanau Bidayuh Sa’ban
Iban 200 - - - - - -
English 200 174 - - - - -
Kelabit 199 179 142 - - - -
Melanau 196 200 174 199 - - -
Bidayuh 179 142 196 174 199 - -
Sa’ban 179 142 196 174 160 129 -
Penan 172 179 142 196 132 176 142
Table 8. Language Pairs and their corresponding Word List Size
The difference in the word lists size is due to the unavailability of translation equivalents
for some of the words in the Swadesh list. Although some of the lists are shorter than the
other, however, in general, the number of word pairs compared is still sufficiently large
(129 for Sa‟ban-Bidayuh being the least). In addition, a shorter word list will not be
penalised because of its length since the calculations are independent of the word list size.
Thirdly, it is also fair for the other languages that have obtained the complete list to be
analysed fully without being affected by the restriction that allows only overlapping words
across the languages to be compared.
4.2.1 Percentage of Cognates
Table 9 displays the percentage of cognates for all language pairs derived using NLD and
LCSR. The tables are sorted in descending order of percentage of cognates with respect to
BM.
Language BM Iban Melanau Bidayuh Kelabit Penan Sa’ban English
Iban 61.0 - - - - - - -
Melanau 40.7 34.7 - - 26.4 - - 0.5
Identification of Closely-Related Indigenous Languages: An Orthographic Approach 57
Bidayuh 33.5 24.0 30.2 - 22.5 - - 0.6
Kelabit 25.3 17.2 - - - - - 1.7
Penan 20.5 20.0 27.7 13.1 26.3 - 16.3 0.0
Sa’ban 11.3 10.6 15.5 9.9 28.7 - - 0.7
English 1.5 0.5 - - - - - -
Table 9. Percentage of Cognates for all Language Pairs using NLD
Language BM Iban Melanau Bidayuh Kelabit Penan Sa’ban English
Iban 62.5 - - - - - - -
Melanau 43.2 37.7 - - 29.3 - - 2.0
Bidayuh 36.9 26.3 33.0 - 26.3 - - 3.4
Kelabit 26.4 20.7 - - - - - 3.5
Penan 24.6 25.1 30.3 16.6 31.6 - 22.7 1.0
Sa’ban 19.7 16.2 22.5 16.7 44.2 - - 1.4
English 3.5 3.5 - - - - - -
Table 10. Percentage of Cognates for all Language Pairs using LCSR
From the results in shown in
Table 9 and
Table 10, the NLD and LCSR both established the same sequence of relative closeness with
respect to BM. For instance, when compared to BM in NLD, the sequence of relative
closeness is Iban, Melanau, Bidayuh, Kelabit, Penan, Sa‟ban and English, which is the
same for LCSR, despite the cognate percentage difference. This result is important such
that it illustrates the coherency of the orthographic similarity measurements.
It is also observed that the LCSR constantly produces higher percentage of cognates. A
possible explanation to this is that the LCSR considers the common character subsequence
between the word pairs rather than strict character matching in NLD, where it introduces a
higher probability that a word pair will be regarded as a positive cognate.
According to the percentage of cognates obtained from the orthographic similarity
analysis, the relative closeness between the indigenous languages as well as the two major
languages, namely, BM and English are visualised in a tree structure using the UPGMA
method. The figures in the following page depict the tree constructed for the languages.
58 Ng Ee-Lee, Beatrice Chin, Alvin Wee Yeo, Bali Ranaivo-Malançon
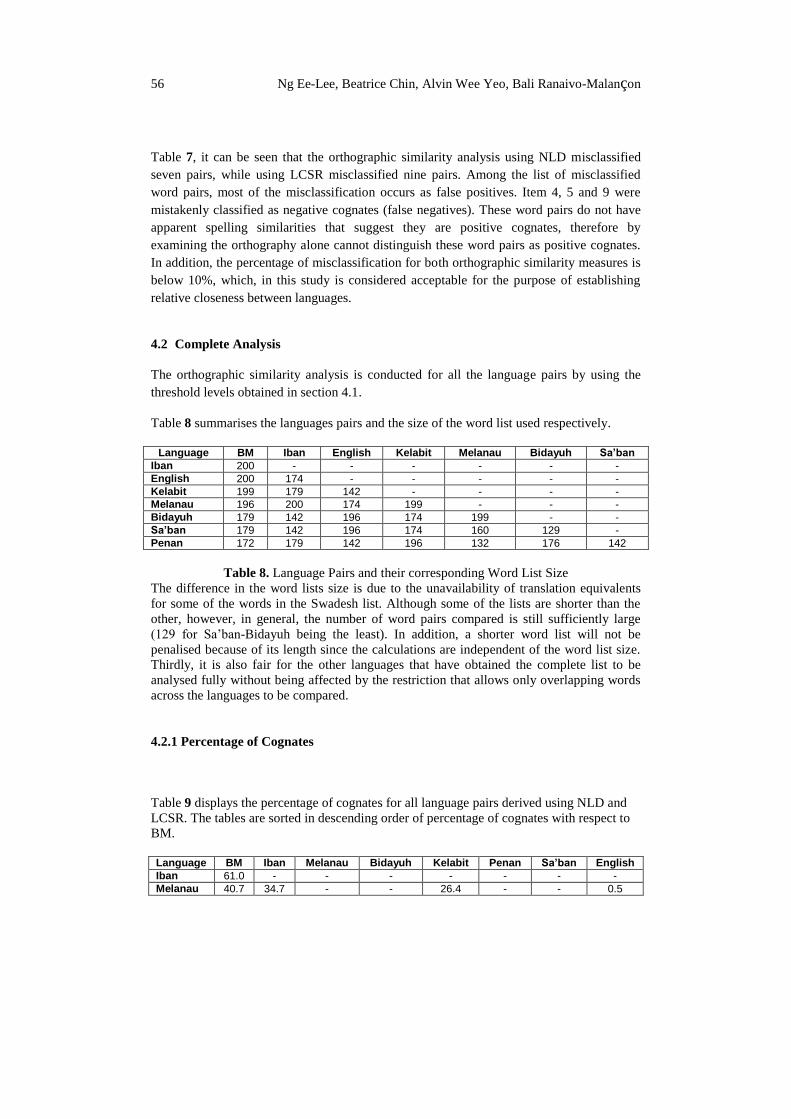
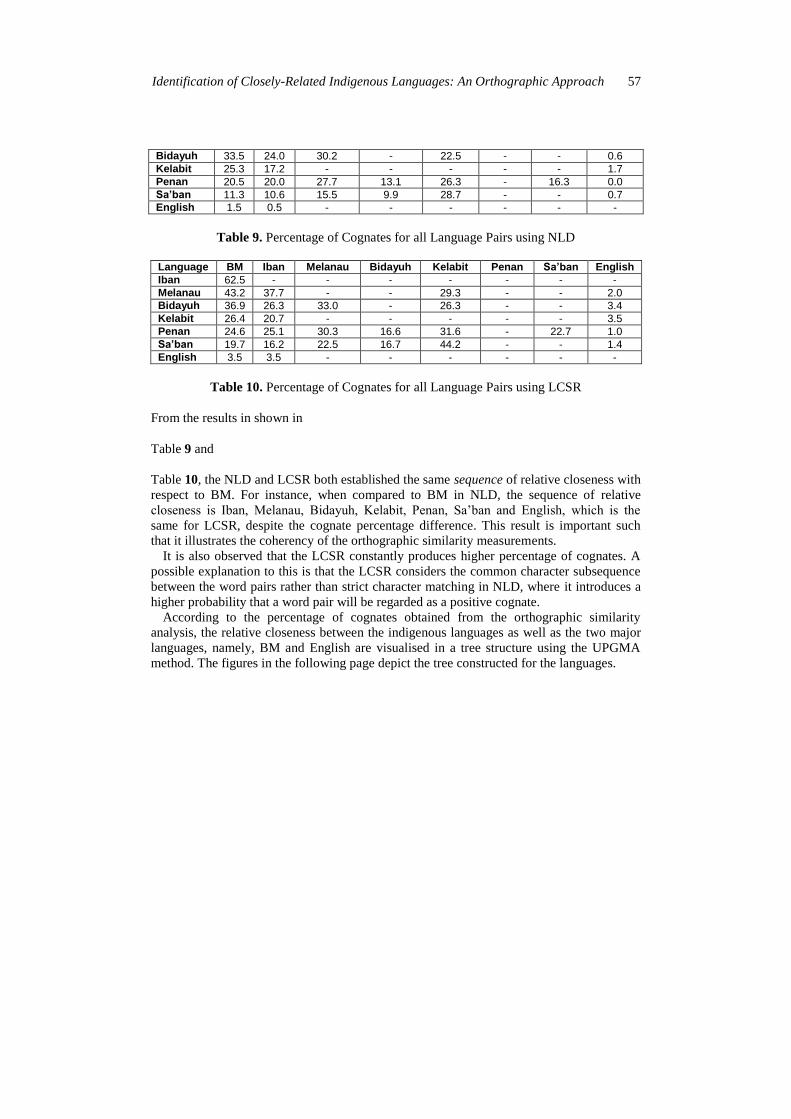
Figure 4. Relative Language Closeness in Tree Representation (NLD)
Figure 5. Relative Language Closeness in Tree Representation (LCSR)
Figure 4 and
Figure 5 show the language trees constructed using the UPGMA method. From the
diagrams showed, the languages can be clustered into three language clusters according to
their pair-wise average cognate percentage. These are:
Cluster 1: Kelabit, Sa‟ban and Penan
Cluster 2: Bahasa Melayu, Iban, Melanau (Matu-Daro) and Bidayuh (Bau-Jagoi)
Cluster 3: English
Identification of Closely-Related Indigenous Languages: An Orthographic Approach 59
The member languages in a cluster are closely related albeit at different levels of closeness.
It is also observed that both trees (from NLD and LCSR) produce the same clusters despite
the differences in the cognate percentage.
The UPGMA trees can be interpreted as follows:
i. In Cluster 1, Kelabit and Sa‟ban are more closely related to each other than Penan
is to either of them.
ii. In Cluster 2, Bahasa Melayu and Iban are more closely related to each other than
Melanau (Matu-Daro) and Bidayuh (Bau-Jagoi) are to either of them.
iii. Cluster 1 and Cluster 2 are more closely related to each other than Cluster 3 is to
either of them.
It is worth to highlighting at this point that in the context of this study, the UPGMA trees
constructed for the languages do not represent the genetic relationship amongst the
languages as it usually does in historical linguistics but another means to visualise the
relationship between the languages concerned.
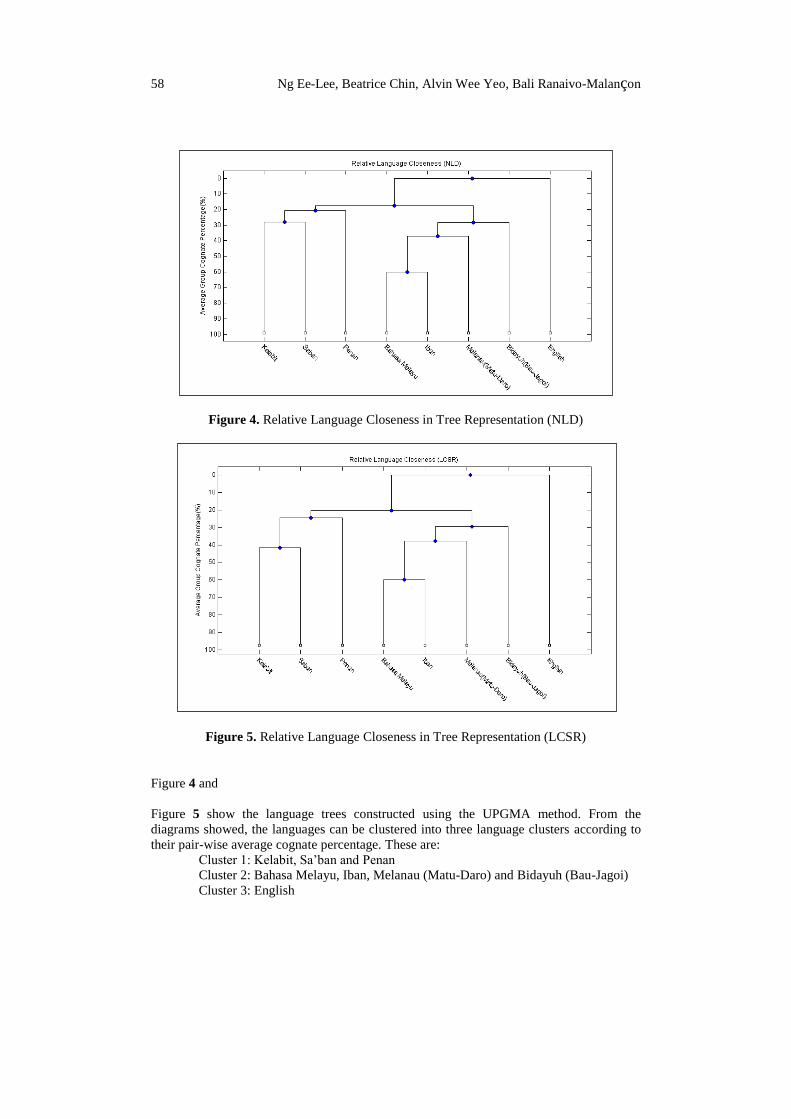
4.2.2 Cumulative Frequency Percentage Curves
A Cumulative Frequency Percentage curve against the orthographic similarity score for
each of the language pair is plotted. For a pair of languages that has higher frequency of
cognates (that is, more similar/closely related), the Cumulative Frequency Percentage curve
would be a concaving curve, as illustrated in
Figure 6 (a). Contrary to that, language pair with lower frequency of cognates generally
produces Cumulative Frequency Percentage curves that are convex in shape, as depicted in
Figure 6 (b).
(a) An example of language pair with high similarity/ more closely related.
(b) An example of language pair with low similarity/ less closely related.
Interpretation Approximately 40% of the word pairs have NLD
below 0.50.
Interpretation Aproximately 99% of the word pairs have
NLD below 0.50.
Figure 6. General Cumulative Frequency Percentage Curves with Interpretation
60 Ng Ee-Lee, Beatrice Chin, Alvin Wee Yeo, Bali Ranaivo-Malançon
Identification of Closely-Related Indigenous Languages: An Orthographic Approach 61
Figure 7 and
Figure 8 depict the complete multiple Cumulative Frequency Percentage curves for all 28
language pairs. It can be seen that the lines form three subgroups. The general groupings
are:
Group A: English-paired lines;
Group B: Indigenous languages-paired lines; and
Group C: BM-paired lines.
Figure 7. Graph of Multiple Cumulative Frequency Percentage vs. NLD
Figure 8. Graph of Multiple Cumulative Frequency Percentage vs. LCSR
A B
C
A B
C
62 Ng Ee-Lee, Beatrice Chin, Alvin Wee Yeo, Bali Ranaivo-Malançon

Identification of Closely-Related Indigenous Languages: An Orthographic Approach 63
5. Discussion
The computational orthographic method was able to establish the relationship between
the indigenous languages of Sarawak and it was found that the indigenous languages are
closely related albeit at different levels of closeness. The result (Iban-Bahasa Melayu) was
correctly determined and it was observed that Bahasa Melayu is more closely related to the
indigenous languages than English is. This is reasonable because English comes under the
Indo-European family and is considered a distance language to all the other languages
concerned in this study. As per the interview with linguist Salbiah Hassan (personal
communication, March 29, 2009), who involved extensively in the Melanau language
studies, it was revealed that she has had the experience of working on the Swadesh lists for
the BM- Melanau language pair. She remarked that even though the Swadesh list is subject
to controversies, the researchers in the linguistic field still use it because it is the only pre-
existing reference. It was also highlighted to Salbiah the fact that the invalid comparisons
such as the compound words and inflected words that would be otherwise excluded from
the traditional phonological evaluation were not taken off from the orthographic similarity
analysis since the analyst is assumed to have no linguistic background. She agreed to the
reasoning and commented that the cognacy percentages would have been even closer to the
actual ones if the invalid comparisons could be excluded.
Despite the fact that the orthographic approach is straightforward and simplistic, it is
sufficient to offer valuable insights into the relationship between languages. The crux
benefit of the orthographic approach lies in that it does not presupposes a linguistic
background (for example, the knowledge of the International Phonetic Alphabets and
historical linguistics) in order to work with it. Even a computer scientist (the author, for
instance) can perform the analysis. This approach is practical especially when working on
URLs in Borneo, in which lack of resources and unavailability of linguists of the languages
are the main challenges. Nonetheless, the orthographic approach is proven to be a quick and
dirty method to complement the manual cognate identification process and serves as an
initial solution towards the more sophisticated methods for cognate identification as well as
other computational linguistics challenges.
6. Conclusion
In this study, the relationships between the Sarawak languages were established
computationally, and (potentially in future) without initial assistance from a linguist. The
identified relationship is useful to answer greater challenges in computational linguistics,
especially in the dealings with the under-resourced languages. Closely related under-
resourced languages can support each other in terms of generating additional linguistic
information from the existing resources or materials. This is particularly useful in human
language development where the core resources are the linguistics materials. A possible
solution to enhance the reliability and accuracy of this research, particularly in the task of
cognate identification, is to consider the phonological elements of the languages. The future
research methodology could be such that the uttered words are recorded and saved in an
audio file format, for example as a wave file (.wav). The “word” in the audio file is then
analysed to obtain its phonological transliteration in Latin alphabets and IPA via an
automated approach. Subsequently, the transliterated word is used to extract the phonemes
and convert it into graphemes, which eventually are used as the basic units for comparison
by the methods of the phonological approach. The results obtained from the phonological
analysis can then be used together with the outcome from the orthographic approach.

64 Ng Ee-Lee, Beatrice Chin, Alvin Wee Yeo, Bali Ranaivo-Malançon
Optimistically, combining both approaches would give a more comprehensive solution
compared to using either approach alone.
7. References
Embleton, S. (1986). Principles of Historical Linguistics. Diachronica 3(2), pp. 203.
Gudschinsky, S. (1956).The ABCs of Lexicostatistics.
Hassan, S. (2009). Personal Communication.
Hoijer, H. (1956). Lexicostatistics: A Critique. Language, 32, pp. 49–60.
Kessler, B. (2001). The Significance of Word Lists. Center for the Study of Language and
Information, Stanford, CA.
Kondrak, G. (2001). Identifying Cognates by Phonetic and Semantic Similarity. In:
Proceedings of the 2nd Meeting of the North American Chapter of the Association of
Computational Linguistics, pp. 103 – 110.
Krauwer, S.(2003).The Basic Language Resource Kit (BLARK) as the First Milestone for
the Language Resources Roadmap. In: Proceedings of SPECOM 2003, Moscow, pp. 8.
Levenshtein, V.I. (1965). Binary Codes Capable of Correcting Deletions, Insertions and
Reversals. Doklady Akademii Nauk SSSR, 163(4): pp. 845 – 848.
Mann, G. et al. (2001). Multipath Translation Lexicon Induction via Bridge Languages. In:
Proceedings of NAACL 2001: 2nd Meeting of the North American Chapter of the
Association for Computational Linguistics, pp. 151 – 158.
Melamed. I.D. (1999). Bitext Maps and Alignment via Pattern
Recognition.ComputationalLinguistics,25(1): pp. 107–130.
Renfrew, C. et al. (2000). Time – Depth in Historical Linguistics. Cambridge: McDonald
Institute for Archaeological Research.
Rohani, M.Y. (2003). Perkaitan Bahasa Melayu dan Bahasa Iban: Satu Tinjauan Ringkas.
Jurnal Bahasa. 3( 3).
Scannell, K.P. (2007). The Crúbadán Project: Corpus Building for Under Resourced
Languages. Cahiers du Cental, pp.5.
Simard, M. et al. (1992). Using Cognates to Align Sentences in Bilingual Corpora. In:
Proceedings of the 4th International Conference on Theoretical and Methodological
Issues in Machine Translation, Montreal, Canada, pp. 67 – 81.
Swadesh, M. (1952). Lexicostatistical Dating of Prehistoric Ethnic Contacts. In:
Proceedings of American Philosophical Society, pp. 452 – 463.
Wagner, R. and Fischer, M. (1974). The String-to-String Correction Problem. Journal of the
Association for Computing Machinery, 21: pp. 168 – 173.