Embed Size (px)
Citation preview
1 3
Cancer Chemother Pharmacol (2016) 78:313–323DOI 10.1007/s00280-016-3077-8
ORIGINAL ARTICLE
Identification of clinically achievable combination therapies in childhood rhabdomyosarcoma
Elliot Kahen1 · Diana Yu1 · Douglas J. Harrison5 · Justine Clark1 · Pooja Hingorani6 · Christopher L. Cubitt1,2 · Damon R. Reed1,2,3,4
Received: 10 March 2016 / Accepted: 3 June 2016 / Published online: 20 June 2016 © The Author(s) 2016. This article is published with open access at Springerlink.com
management of RMS and 3 biologically targeted agents with novel mechanisms of action, the Wee1 inhibitor AZD1775, the tyrosine kinase inhibitor cabozantinib, and the proteasome inhibitor bortezomib. All were tested indi-vidually at clinically achievable concentrations for activity in 4 RMS cell lines and then for potential synergy in two-drug combinations.Results We found single-agent activity in five of the agents (or their active metabolites) that constitute the standard of care in RMS and for AZD1775 with mean IC50 values of 207 ng/ml, well below clinically achievable levels. In addition, the combination of individual cytotoxic chemo-therapeutics currently used for RMS demonstrated largely synergistic activity with higher, but clinically achievable concentrations of AZD1775 in our assays.Conclusions Prioritization of chemotherapeutics in RMS is possible using an in vitro system that can define novel drug combinations worthy of future investigation. AZD1775 exhibits single-agent activity, as well as synergy with con-ventional cytotoxic chemotherapy, and is a novel targeted agent that warrants further study in RMS.
Keywords Rhabdomyosarcoma · Combination chemotherapy · Clinically achievable concentrations · AZD1775 · Cyclophosphamide · Etoposide · Irinotecan
Introduction
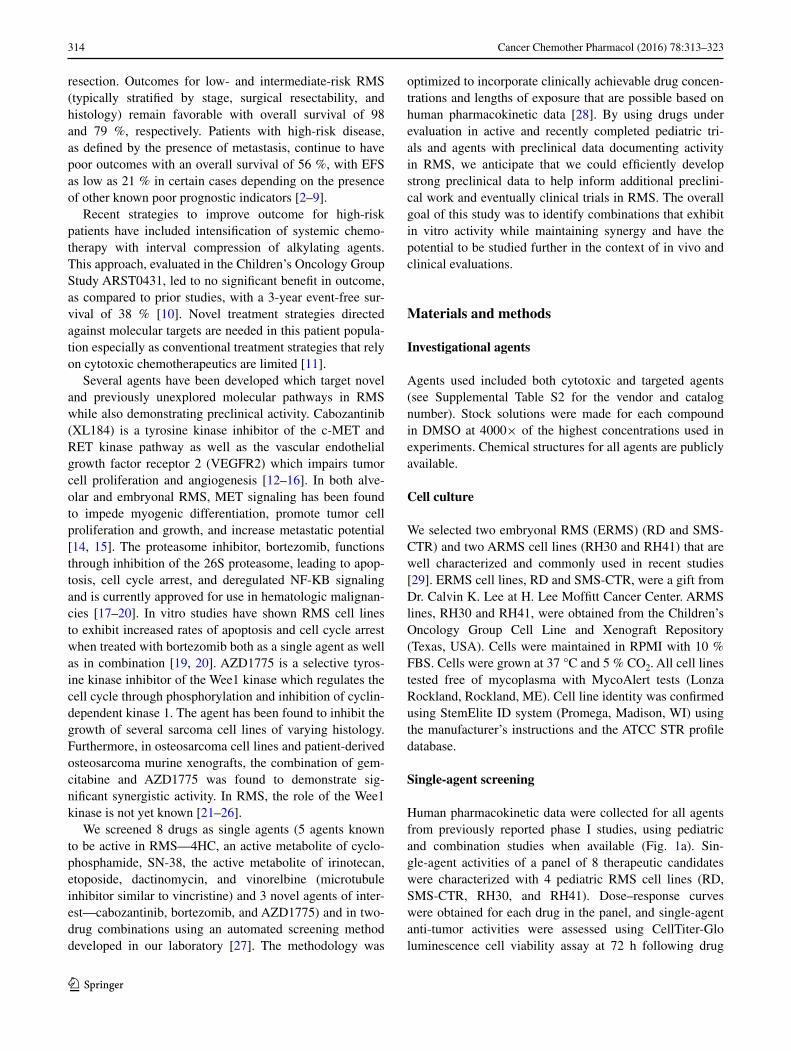
Rhabdomyosarcoma (RMS) is the most common soft-tissue sarcoma (STS) in children and young adults with approximately 350 patients diagnosed each year in the USA [1]. Treatment is multimodal and includes systemic chemotherapy and local control of bulk disease which usu-ally employs radiation therapy and in certain cases, surgical
Abstract Purpose Systemic therapy has improved rhabdomyosar-coma event-free and overall survival; however, approxi-mately 40 % of patients will have progressive or recurrent disease which is difficult to cure and remains a considera-ble challenge. Minimal progress has been made in improv-ing outcomes for metastatic or relapsed RMS due to a lack of effective therapeutic agents. Targeted therapies are likely to be incorporated into regimens which rely on conven-tional cytotoxic chemotherapy. A system to evaluate novel combinations of interest is needed.Methods In this study, we explored 8 agents, 5 that are routinely used or similar to agents used in the clinical
Elliot Kahen and Diana Yu have contributed equally to this work.
Electronic supplementary material The online version of this article (doi:10.1007/s00280-016-3077-8) contains supplementary material, which is available to authorized users.
* Damon R. Reed [email protected]
1 Sunshine Project Translational Research Lab, H. Lee Moffitt Cancer Center and Research Institute, Tampa, FL, USA
2 Chemical Biology and Molecular Medicine Program, H. Lee Moffitt Cancer Center and Research Institute, Tampa, FL, USA
3 Sarcoma Department, H. Lee Moffitt Cancer Center and Research Institute, Tampa, FL, USA
4 Adolescent and Young Adult Program, H. Lee Moffitt Cancer Center and Research Institute, 12902 Magnolia Drive, 33612 Tampa, FL, USA
5 Division of Pediatrics, MD Anderson Cancer Center, Houston, TX, USA
6 Center for Cancer and Blood Disorders, Phoenix Children’s Hospital, Phoenix, AZ, USA
314 Cancer Chemother Pharmacol (2016) 78:313–323
1 3
resection. Outcomes for low- and intermediate-risk RMS (typically stratified by stage, surgical resectability, and histology) remain favorable with overall survival of 98 and 79 %, respectively. Patients with high-risk disease, as defined by the presence of metastasis, continue to have poor outcomes with an overall survival of 56 %, with EFS as low as 21 % in certain cases depending on the presence of other known poor prognostic indicators [2–9].
Recent strategies to improve outcome for high-risk patients have included intensification of systemic chemo-therapy with interval compression of alkylating agents. This approach, evaluated in the Children’s Oncology Group Study ARST0431, led to no significant benefit in outcome, as compared to prior studies, with a 3-year event-free sur-vival of 38 % [10]. Novel treatment strategies directed against molecular targets are needed in this patient popula-tion especially as conventional treatment strategies that rely on cytotoxic chemotherapeutics are limited [11].
Several agents have been developed which target novel and previously unexplored molecular pathways in RMS while also demonstrating preclinical activity. Cabozantinib (XL184) is a tyrosine kinase inhibitor of the c-MET and RET kinase pathway as well as the vascular endothelial growth factor receptor 2 (VEGFR2) which impairs tumor cell proliferation and angiogenesis [12–16]. In both alve-olar and embryonal RMS, MET signaling has been found to impede myogenic differentiation, promote tumor cell proliferation and growth, and increase metastatic potential [14, 15]. The proteasome inhibitor, bortezomib, functions through inhibition of the 26S proteasome, leading to apop-tosis, cell cycle arrest, and deregulated NF-KB signaling and is currently approved for use in hematologic malignan-cies [17–20]. In vitro studies have shown RMS cell lines to exhibit increased rates of apoptosis and cell cycle arrest when treated with bortezomib both as a single agent as well as in combination [19, 20]. AZD1775 is a selective tyros-ine kinase inhibitor of the Wee1 kinase which regulates the cell cycle through phosphorylation and inhibition of cyclin-dependent kinase 1. The agent has been found to inhibit the growth of several sarcoma cell lines of varying histology. Furthermore, in osteosarcoma cell lines and patient-derived osteosarcoma murine xenografts, the combination of gem-citabine and AZD1775 was found to demonstrate sig-nificant synergistic activity. In RMS, the role of the Wee1 kinase is not yet known [21–26].
We screened 8 drugs as single agents (5 agents known to be active in RMS—4HC, an active metabolite of cyclo-phosphamide, SN-38, the active metabolite of irinotecan, etoposide, dactinomycin, and vinorelbine (microtubule inhibitor similar to vincristine) and 3 novel agents of inter-est—cabozantinib, bortezomib, and AZD1775) and in two-drug combinations using an automated screening method developed in our laboratory [27]. The methodology was
optimized to incorporate clinically achievable drug concen-trations and lengths of exposure that are possible based on human pharmacokinetic data [28]. By using drugs under evaluation in active and recently completed pediatric tri-als and agents with preclinical data documenting activity in RMS, we anticipate that we could efficiently develop strong preclinical data to help inform additional preclini-cal work and eventually clinical trials in RMS. The overall goal of this study was to identify combinations that exhibit in vitro activity while maintaining synergy and have the potential to be studied further in the context of in vivo and clinical evaluations.
Materials and methods
Investigational agents
Agents used included both cytotoxic and targeted agents (see Supplemental Table S2 for the vendor and catalog number). Stock solutions were made for each compound in DMSO at 4000× of the highest concentrations used in experiments. Chemical structures for all agents are publicly available.
Cell culture
We selected two embryonal RMS (ERMS) (RD and SMS-CTR) and two ARMS cell lines (RH30 and RH41) that are well characterized and commonly used in recent studies [29]. ERMS cell lines, RD and SMS-CTR, were a gift from Dr. Calvin K. Lee at H. Lee Moffitt Cancer Center. ARMS lines, RH30 and RH41, were obtained from the Children’s Oncology Group Cell Line and Xenograft Repository (Texas, USA). Cells were maintained in RPMI with 10 % FBS. Cells were grown at 37 °C and 5 % CO2. All cell lines tested free of mycoplasma with MycoAlert tests (Lonza Rockland, Rockland, ME). Cell line identity was confirmed using StemElite ID system (Promega, Madison, WI) using the manufacturer’s instructions and the ATCC STR profile database.
Single‑agent screening
Human pharmacokinetic data were collected for all agents from previously reported phase I studies, using pediatric and combination studies when available (Fig. 1a). Sin-gle-agent activities of a panel of 8 therapeutic candidates were characterized with 4 pediatric RMS cell lines (RD, SMS-CTR, RH30, and RH41). Dose–response curves were obtained for each drug in the panel, and single-agent anti-tumor activities were assessed using CellTiter-Glo luminescence cell viability assay at 72 h following drug
315Cancer Chemother Pharmacol (2016) 78:313–323
1 3
application, a time which was optimized based on cell line growth characteristics. The fraction affected (FA) was cal-culated as FA = 1 − (CT-glo signal with drug treatment)/(CT-glo signal without drug treatment). This reflects the reduction in the cellular metabolism (a correlate of cell via-bility) due to the drug treatment.
Two‑drug combination screening
A 5 × 5 checker-board matrix format was used to assess all two-drug combinations at five clinically achievable con-centrations. Notably, these concentrations were selected at clinically achievable ranges along a range that allowed for less than optimal effect on cells in order to detect synergy. A full description of the methods was published previously [27]. Briefly, each combination was evaluated at multiple drug ratios to identify synergy (Supplemental Table S2). In cases where the same dilution factors were used for both drugs of the combination, diagonals of the 5 × 5 checker-board matrix provide the effects of the drug combination at constant drug ratio. Full dose–response curves were obtained for each individual drug, and the combination
index (CI) for all combinations was calculated using Cal-cuSyn 2.0 and custom-designed analysis package based on the Chou-Talalay method.
Cell viability assays
The activity levels of single agents and combinations were determined by a high-throughput CellTiter-Glo cell via-bility assay (Promega). Cells (1–2 × 10³) were plated in each well of 384-well plates using a Precision XS liquid handling station (Bio-Tek Instruments, Winooski, VT) and incubated overnight. Drug source plates were prepared in 96-well Megatiter plates (Neptune Scientific, San Diego, CA), and the Precision XS station was used to transfer drugs to four replicate wells with an additional four con-trol wells receiving DMSO vehicle control without drug. At the end of the drug incubation period, CellTiter-Glo or Caspase-Glo reagent was added to each well at 1:1 ratio (v/v) with media. The luminescence of the product of via-ble cells was measured with a Synergy 4 microplate reader (Bio-Tek Instruments). The luminescence data were trans-ferred to Microsoft Excel to calculate percent viability.
a
AZD1775
Concentra�on (ng/ml)1 100 10000
0
0.2
0.4
0.6
0.8
1
AZD1775 Cmax
SN-38
Concentra�on (ng/ml)0.01 1 100
-0.1
0.1
0.3
0.5
0.7
0.9
Vinorelbine
Concentra�on (ng/ml)0.01 1 100
0
0.2
0.4
0.6
0.8
1
Vinor Cmax
Cabozan�nib
Concentra�on (ng/ml)100 1000 10000 100000
-0.1
0.1
0.3
0.5
0.7
0.9
Cabo Cmax
Etoposide
Concentra�on (ng/ml)1 100 10000
-0.1
0.1
0.3
0.5
0.7
0.9
Etop Cmax
Ac�nomycin D
Concentra�on (ng/ml)0.0001 0.01 1 100
0
0.2
0.4
0.6
0.8
1
Ac� Cmax
Bortezomib
Concentra�on (ng/ml)10 100
-0.1
0.1
0.3
0.5
0.7
0.9
4HC
Concentra�on (ng/ml)1000 10000
0
0.2
0.4
0.6
0.8
1
4HC Cmax
SN-38 Cmax Etop Cmax
Bort Cmax
RD SMS-CTR RH30 RH41 Average IC50
Summary of Agents, Pharmacokine�cs, and Concentra�ons
Agent Target of Inhibi�on / Mechanism
Cmax (ng/ml)
AUC (hr*ng/ml) Source
Average IC50s Across 4 Cell Lines Mean ± Standard Error ( ng/ml) % of Cmax
4HC DNA Crosslinking 6900 27700¹-33000² McCune et al. (2009), J Clin Pharmacol 1860 ± 270 27 Ac�nomycin D DNA intercala 130 600 Hill et al. (2014), Clin Pharmacokinet 1.7 ± 0.57 1.3
AZD1775 Wee1 830 12,000² Do et al. (2015), J Clin Oncol 207 ± 41 25 Bortezomib Proteasome 120 160 Velcade Data Sheet 13 ± 2.2 11
Cabozan�nib TK (c-Met; VEGFR2) 2000 41,600 Kurzrock et al. (2011), J Clin Oncol 6630 ± 2030 330 Etoposide Topoisomerase II 20000 157,000 Kaul et al. (1995), J Clin Oncol 818 ± 344 4.1
SN-38 Topoisomerase IB 30 190² Ma et al. (2000), Clin Cancer Res 6.53 ± 2.4 22 Vinorelbine Microtubule polymeriza on 140 1220 Bourgeois et al. (2007), Cancer Chemother Pharmacol 1.53 ± 0.61 1.1
¹Median cumula ve 72-hour AUC ²AUC es mate was determined by our independent computer modeling of available pharmacokine c data
b Fr
ac�o
n
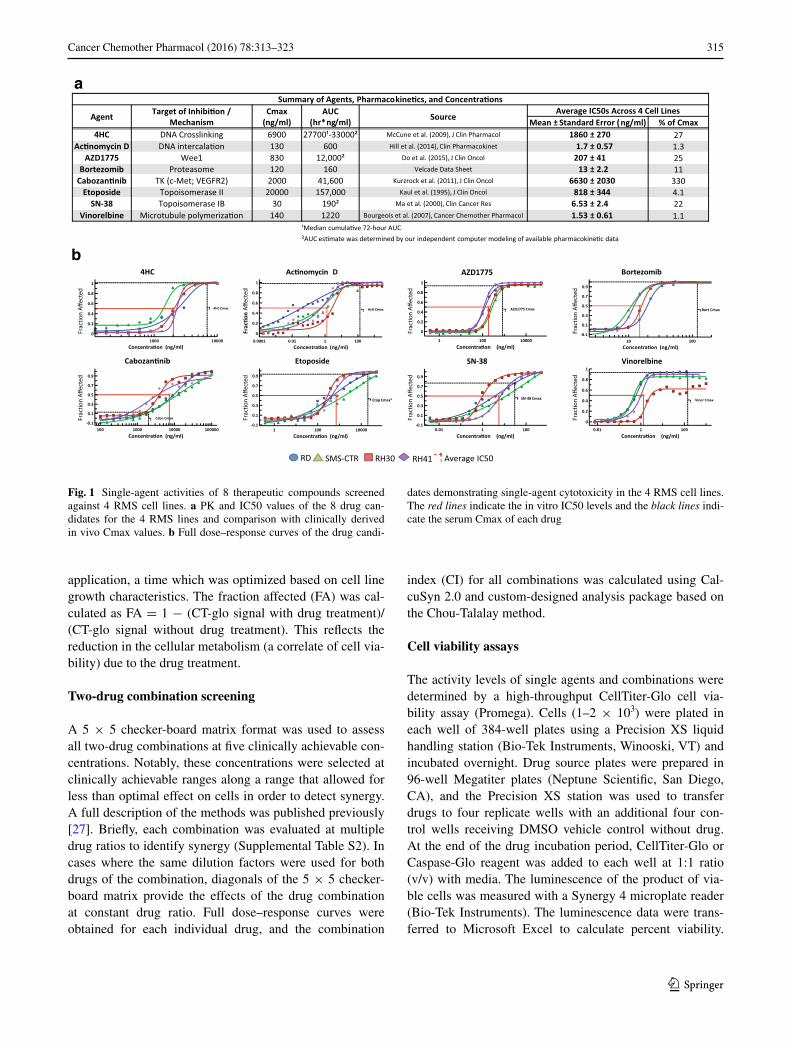
Fig. 1 Single-agent activities of 8 therapeutic compounds screened against 4 RMS cell lines. a PK and IC50 values of the 8 drug can-didates for the 4 RMS lines and comparison with clinically derived in vivo Cmax values. b Full dose–response curves of the drug candi-
dates demonstrating single-agent cytotoxicity in the 4 RMS cell lines. The red lines indicate the in vitro IC50 levels and the black lines indi-cate the serum Cmax of each drug
316 Cancer Chemother Pharmacol (2016) 78:313–323
1 3
IC50 values were determined using a sigmoidal equilib-rium model regression and XLfit version 5.2 (ID Business Solutions). The IC50 values obtained from single-drug cell viability assays were used to design subsequent drug com-bination experiments. High-throughput two-agent com-bination screening experiments were performed using a 5 × 5 matrix format in 384-well plates to interrogate 25 individual concentration ratios per combination.
Analysis of additive and synergistic effects in combination screening data
For drug combination experiments, the CellTiter-Glo assay was used to measure cell viability, with results analyzed for synergistic, additive, or antagonistic effects using primarily the combination index (CI) method of Chou-Talalay [30] with additional supporting analysis from fold of potentia-tion (FOP). For the CI method, the dose–effect curve for each drug was determined based on experimental observa-tions using the median-effect principle and was compared to the effect achieved with the two-drug combination to derive a CI value. This method involves plotting dose–effect curves for each single agent using the median-effect equation: fa/fu = (D/Dm)m, where D = dose of the drug, Dm = dose required for 50 % effect, fa and fu = affected and unaffected fractions, respectively (fa = 1 − fu), and m = exponent signifying the sigmoidicity of the dose–effect curve. XLfit computer software was used to cal-culate Dm and m. CIs used for the analysis of the drug combinations were determined by the isobologram equa-tion for mutually nonexclusive drugs that have different modes of action: CI = (D)1/(Dx)1 + (D)2/(Dx)2 + (D)1(D)2/(Dx)1(Dx)2, where (Dx)1 and (Dx)2 in the denominators are the doses (or concentrations) for D1 (Drug1) and D2 (Drug2) alone that gives x % inhibition, whereas (D)1 and (D)2 in the numerators are the doses of Drug1 and Drug2 in combination that also inhibited x % (i.e., isoeffective). CI calculations were done in custom Microsoft Excel tem-plates and verified with CalcuSyn 2.0 (Biosoft, Cambridge, UK). CI < 1, CI = 1, and CI > 1 indicate synergism, addi-tive effects, and antagonism, respectively.
Fold-of-potentiation (FOP) analysis was used for com-bination screening data with non-constant molar ratios to demonstrate the enhancement of one drug’s effect by another by measuring shift in IC50 [31, 32]. Curve fitting for FOP was performed using Prism v6.05 (GraphPad Soft-ware, La Jolla, CA, www.graphpad.com). Dose–response plots for single agents and drug combinations were fitted using a four-parameter nonlinear least-squares regression model. Curves were extrapolated to relevant maximum and minimum response levels.
Cluster analysis
Prior to clustering, the FA and CI data were normalized using the Kahen-Yu method: Data are log-transformed and converted to a common scale by multiplying the log-transformed 1-FA by a coefficient of 1/3. Both variables were then multiplied by −10. This Kahen-Yu transfor-mation results in FA and CI values that are suitable for concurrent input into the subsequent cluster analysis. Cluster analysis was accomplished with the use of Cluster 3.0 (Stanford University Labs, Stanford, CA). Complete-linkage unsupervised hierarchical clustering of FA and CI values together was performed using uncentered abso-lute correlation similarity metrics. Java TreeView 1.1.6r4 (Stanford University Labs) was employed to visualize clustered data.
Results
Single‑agent activity against ERMS and ARMS cell lines
We first characterized the single-agent activity of a panel of 8 therapeutic candidates (Fig. 1a) using 2 ERMS cell lines (RD and SMS-CTR) and 2 ARMS cell lines (RH30 and RH41). Of the 8 drugs in the panel, 5 agents (vinorel-bine, SN-38, 4HC, etoposide, and actinomycin) were included for their known therapeutic activity in RMS treatment and 3 agents (cabozantinib, bortezomib, and AZD1775) were chosen for evidence of either a rational therapeutic target or preclinical activity in sarcomas. We generated the dose–response curves for each drug on each cell line to assess the sensitivity of the RMS cells to the compounds (Fig. 1c, Supplemental Fig. 1). CellTi-ter-Glo luminescence assay was used to assess the anti-tumor activities by measuring the ATP levels, an indica-tor of cellular metabolism, at 72 h post-drug application. We calculated the IC50s from the dose–response curves and compared them to previously reported serum Cmax levels in clinical studies as a preliminary indicator of the feasibility of these drugs for RMS in the clinical setting (Fig. 1a). Of the 8 drugs we tested, with the exception of cabozantinib, all had IC50s well below the reported serum Cmax, demonstrating efficacy against RMS cells at clinically achievable levels (Fig. 1b). Despite the dif-ferences in the genetic translocations and clinical pres-entations that characterize ERMS and ARMS, we did not see a significant difference in the sensitivity of the two types of RMS cells to the majority of the drugs in our panel (Fig. 1b).
317Cancer Chemother Pharmacol (2016) 78:313–323
1 3
Evaluation for active and synergistic combinations
Following characterization of the single-agent anti-tumor activities, we used a 5 x 5 checker-board matrix format to assess two-drug combinations of the 8 chemotherapy agents at 5 clinically achievable concentrations and 9–25 different drug ratios to evaluate anti-tumor activity and identify synergy (Supplemental Table S2). The frac-tion of cell population sensitive to each drug combina-tion (FA) was assessed using CellTiter-Glo luminescence assay, and the combination index (CI) values for the 28 two-drug combinations were calculated using CalcuSyn 2.0 and custom-designed analysis package based on the Chou-Talalay method (additional details of the method were published in Yu et al. 2015). We performed clus-tering analysis on our screening data using the FA and CI attributes to highlight drug combinations that could potentially be promising for the treatment of pediatric
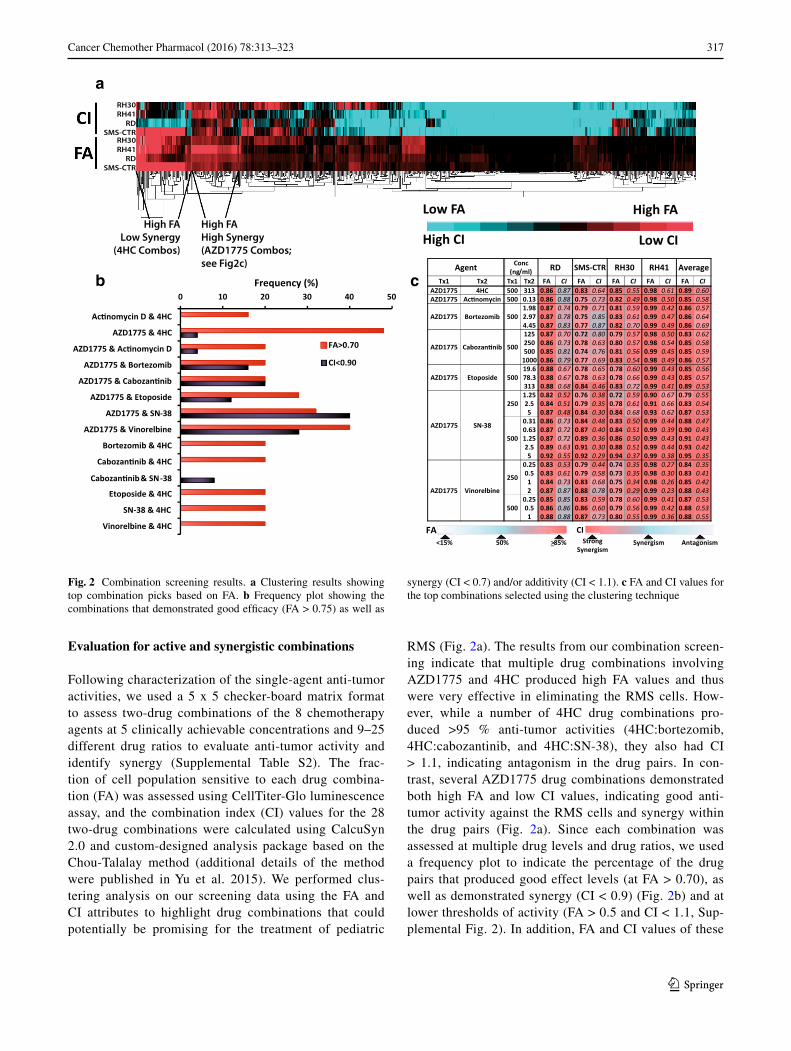
RMS (Fig. 2a). The results from our combination screen-ing indicate that multiple drug combinations involving AZD1775 and 4HC produced high FA values and thus were very effective in eliminating the RMS cells. How-ever, while a number of 4HC drug combinations pro-duced >95 % anti-tumor activities (4HC:bortezomib, 4HC:cabozantinib, and 4HC:SN-38), they also had CI > 1.1, indicating antagonism in the drug pairs. In con-trast, several AZD1775 drug combinations demonstrated both high FA and low CI values, indicating good anti-tumor activity against the RMS cells and synergy within the drug pairs (Fig. 2a). Since each combination was assessed at multiple drug levels and drug ratios, we used a frequency plot to indicate the percentage of the drug pairs that produced good effect levels (at FA > 0.70), as well as demonstrated synergy (CI < 0.9) (Fig. 2b) and at lower thresholds of activity (FA > 0.5 and CI < 1.1, Sup-plemental Fig. 2). In addition, FA and CI values of these
High FALow FA
Low CI High CI
Agent Conc (ng/ml) RD SMS-CTR RH30 RH41 Average
Tx1 Tx2 Tx1 Tx2 FA CI FA CI FA CI FA CI FA CIAZD1775 4HC 500 313 0.86 0.87 0.83 0.64 0.85 0.55 0.98 0.61 0.89 0.60 AZD1775 Ac�nomycin 500 0.13 0.86 0.88 0.75 0.73 0.82 0.49 0.98 0.50 0.85 0.58
AZD1775 Bortezomib 500 1.98 0.87 0.74 0.79 0.71 0.81 0.59 0.99 0.42 0.86 0.57 2.97 0.87 0.78 0.75 0.85 0.83 0.61 0.99 0.47 0.86 0.64 4.45 0.87 0.83 0.77 0.87 0.82 0.70 0.99 0.49 0.86 0.69
AZD1775 Cabozan�nib 500
125 0.87 0.70 0.72 0.80 0.79 0.57 0.98 0.50 0.83 0.62250 0.86 0.73 0.78 0.63 0.80 0.57 0.98 0.54 0.85 0.58 500 0.85 0.81 0.74 0.76 0.81 0.56 0.99 0.45 0.85 0.59
1000 0.86 0.79 0.77 0.69 0.83 0.54 0.98 0.49 0.86 0.57
AZD1775 Etoposide 50019.6 0.88 0.67 0.78 0.65 0.78 0.60 0.99 0.43 0.85 0.56 78.3 0.88 0.67 0.78 0.63 0.78 0.66 0.99 0.43 0.85 0.57313 0.88 0.68 0.84 0.46 0.83 0.72 0.99 0.41 0.89 0.53
AZD1775 SN-38
250 1.25 0.82 0.52 0.76 0.38 0.72 0.59 0.90 0.67 0.79 0.55 2.5 0.84 0.51 0.79 0.35 0.78 0.61 0.91 0.66 0.83 0.54 5 0.87 0.48 0.84 0.30 0.84 0.68 0.93 0.62 0.87 0.53
500
0.31 0.86 0.73 0.84 0.48 0.83 0.50 0.99 0.44 0.88 0.47 0.63 0.87 0.72 0.87 0.40 0.84 0.51 0.99 0.39 0.90 0.43 1.25 0.87 0.72 0.89 0.36 0.86 0.50 0.99 0.43 0.91 0.43 2.5 0.89 0.63 0.91 0.30 0.88 0.51 0.99 0.44 0.93 0.42 5 0.92 0.55 0.92 0.29 0.94 0.37 0.99 0.38 0.95 0.35
AZD1775 Vinorelbine
250
0.25 0.83 0.53 0.79 0.44 0.74 0.35 0.98 0.27 0.84 0.35 0.5 0.83 0.61 0.79 0.58 0.73 0.35 0.98 0.30 0.83 0.41 1 0.84 0.73 0.83 0.68 0.75 0.34 0.98 0.26 0.85 0.42 2 0.87 0.87 0.88 0.78 0.79 0.29 0.99 0.23 0.88 0.43
500 0.25 0.85 0.85 0.83 0.59 0.78 0.60 0.99 0.41 0.87 0.53 0.5 0.86 0.86 0.86 0.60 0.79 0.56 0.99 0.42 0.88 0.53 1 0.88 0.88 0.87 0.73 0.80 0.55 0.99 0.36 0.88 0.55
FA CI Strong
Synergism Synergism Antagonism >85% 50% <15%
c 0 10 20 30 40 50
Ac�nomycin D & 4HC
AZD1775 & 4HC
AZD1775 & Ac�nomycin D
AZD1775 & Bortezomib
AZD1775 & Cabozan�nib
AZD1775 & Etoposide
AZD1775 & Vinorelbine
Bortezomib & 4HC
Cabozan�nib & 4HC
Etoposide & 4HC
SN-38 & 4HC
Vinorelbine & 4HC
Frequency (%)
FA>0.70
CI<0.90
Cabozan�nib & SN-38
AZD1775 & SN-38
a
b
High FAHigh Synergy(AZD1775 Combos;see Fig2c)
High FALow Synergy
(4HC Combos)
RH30RH41
RDSMS-CTR
RH30RH41
RDSMS-CTR
Fig. 2 Combination screening results. a Clustering results showing top combination picks based on FA. b Frequency plot showing the combinations that demonstrated good efficacy (FA > 0.75) as well as
synergy (CI < 0.7) and/or additivity (CI < 1.1). c FA and CI values for the top combinations selected using the clustering technique
318 Cancer Chemother Pharmacol (2016) 78:313–323
1 3
combinations in all 4 RMS cell lines are summarized in Fig. 2c (complete screening results are provided in Sup-plemental Table S1).
Combination of AZD1775 with alkylating agent, 4HC
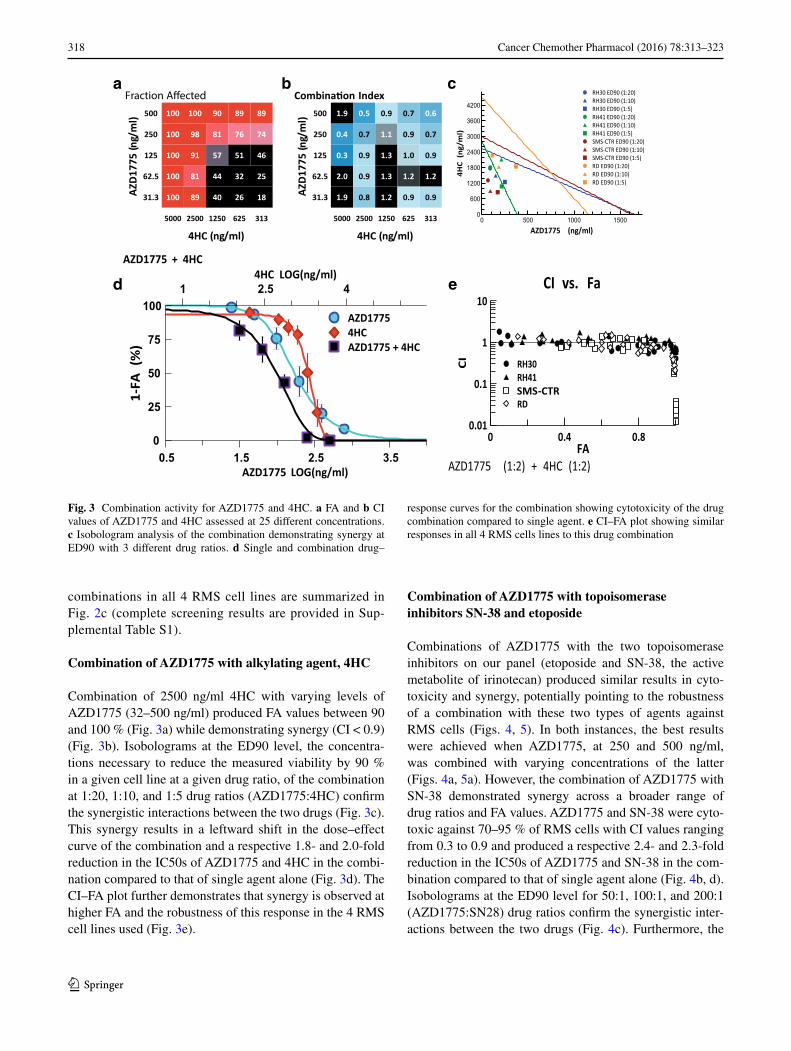
Combination of 2500 ng/ml 4HC with varying levels of AZD1775 (32–500 ng/ml) produced FA values between 90 and 100 % (Fig. 3a) while demonstrating synergy (CI < 0.9) (Fig. 3b). Isobolograms at the ED90 level, the concentra-tions necessary to reduce the measured viability by 90 % in a given cell line at a given drug ratio, of the combination at 1:20, 1:10, and 1:5 drug ratios (AZD1775:4HC) confirm the synergistic interactions between the two drugs (Fig. 3c). This synergy results in a leftward shift in the dose–effect curve of the combination and a respective 1.8- and 2.0-fold reduction in the IC50s of AZD1775 and 4HC in the combi-nation compared to that of single agent alone (Fig. 3d). The CI–FA plot further demonstrates that synergy is observed at higher FA and the robustness of this response in the 4 RMS cell lines used (Fig. 3e).
Combination of AZD1775 with topoisomerase inhibitors SN‑38 and etoposide
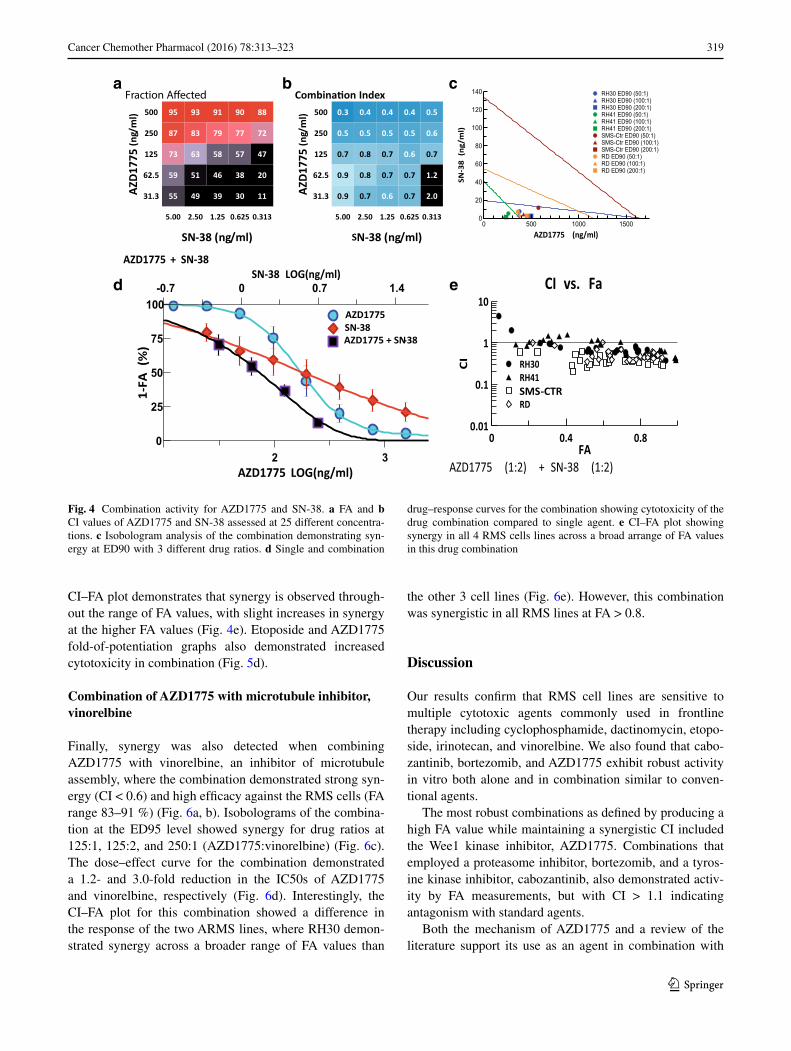
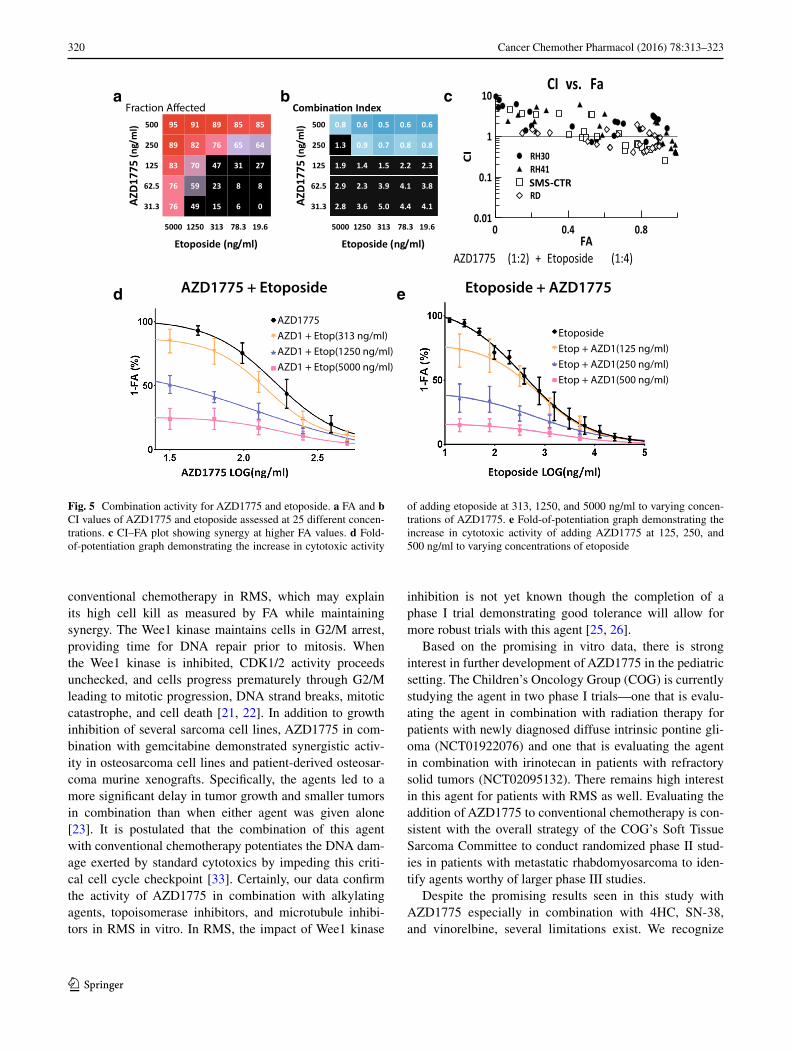
Combinations of AZD1775 with the two topoisomerase inhibitors on our panel (etoposide and SN-38, the active metabolite of irinotecan) produced similar results in cyto-toxicity and synergy, potentially pointing to the robustness of a combination with these two types of agents against RMS cells (Figs. 4, 5). In both instances, the best results were achieved when AZD1775, at 250 and 500 ng/ml, was combined with varying concentrations of the latter (Figs. 4a, 5a). However, the combination of AZD1775 with SN-38 demonstrated synergy across a broader range of drug ratios and FA values. AZD1775 and SN-38 were cyto-toxic against 70–95 % of RMS cells with CI values ranging from 0.3 to 0.9 and produced a respective 2.4- and 2.3-fold reduction in the IC50s of AZD1775 and SN-38 in the com-bination compared to that of single agent alone (Fig. 4b, d). Isobolograms at the ED90 level for 50:1, 100:1, and 200:1 (AZD1775:SN28) drug ratios confirm the synergistic inter-actions between the two drugs (Fig. 4c). Furthermore, the
Combina�on Index
AZD1
775
(ng/
ml)
500 100 100 90 89 89
AZD1
775
(ng/
ml)
500 1.9 0.5 0.9 0.7 0.6
250 100 98 81 76 74 250 0.4 0.7 1.1 0.9 0.7
125 100 91 57 51 46 125 0.3 0.9 1.3 1.0 0.9
62.5 100 81 44 32 25 62.5 2.0 0.9 1.3 1.2 1.2
31.3 100 89 40 26 18 31.3 1.9 0.8 1.2 0.9 0.9
5000 2500 1250 625 313 5000 2500 1250 625 313
4HC (ng/ml) 4HC (ng/ml)
AZD1775 + 4HC
AZD1775 LOG(ng/ml)0.5 1.5 2.5 3.5
4HC LOG(ng/ml)1 2.5 4
1-FA
(%)
0
25
50
75
100AZD17754HCAZD1775 + 4HC
a b c
d
AZD1775 (ng/ml)0 500 1000 1500
4HC
(ng/
ml)
0
600
1200
1800
2400
3000
3600
4200
RH30 ED90 (1:20)RH30 ED90 (1:10)RH30 ED90 (1:5)RH41 ED90 (1:20)RH41 ED90 (1:10)RH41 ED90 (1:5)SMS-CTR ED90 (1:20)SMS-CTR ED90 (1:10)SMS-CTR ED90 (1:5)RD ED90 (1:20)RD ED90 (1:10)RD ED90 (1:5)
CI vs. Fa
AZD1775 (1:2) + 4HC (1:2)FA
0 0.4 0.8
CI
0.01
0.1
1
10
RH30RH41SMS-CtrRD
e
SMS-CTR
Fig. 3 Combination activity for AZD1775 and 4HC. a FA and b CI values of AZD1775 and 4HC assessed at 25 different concentrations. c Isobologram analysis of the combination demonstrating synergy at ED90 with 3 different drug ratios. d Single and combination drug–
response curves for the combination showing cytotoxicity of the drug combination compared to single agent. e CI–FA plot showing similar responses in all 4 RMS cells lines to this drug combination
319Cancer Chemother Pharmacol (2016) 78:313–323
1 3
CI–FA plot demonstrates that synergy is observed through-out the range of FA values, with slight increases in synergy at the higher FA values (Fig. 4e). Etoposide and AZD1775 fold-of-potentiation graphs also demonstrated increased cytotoxicity in combination (Fig. 5d).
Combination of AZD1775 with microtubule inhibitor, vinorelbine
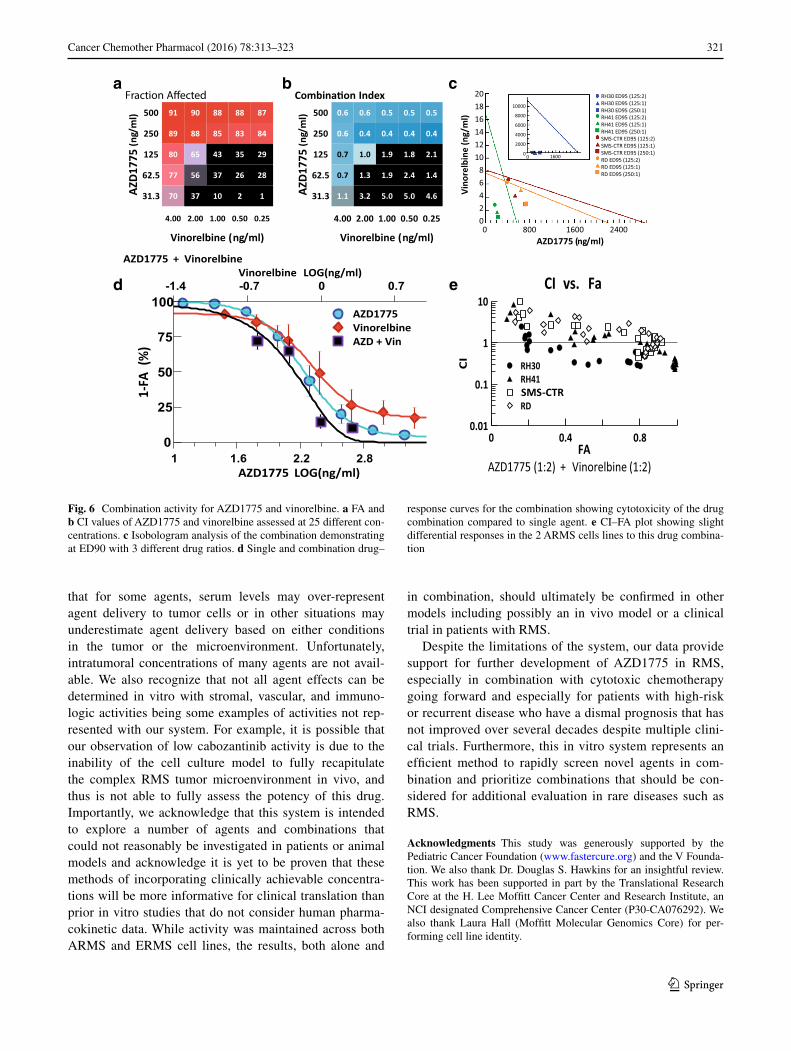
Finally, synergy was also detected when combining AZD1775 with vinorelbine, an inhibitor of microtubule assembly, where the combination demonstrated strong syn-ergy (CI < 0.6) and high efficacy against the RMS cells (FA range 83–91 %) (Fig. 6a, b). Isobolograms of the combina-tion at the ED95 level showed synergy for drug ratios at 125:1, 125:2, and 250:1 (AZD1775:vinorelbine) (Fig. 6c). The dose–effect curve for the combination demonstrated a 1.2- and 3.0-fold reduction in the IC50s of AZD1775 and vinorelbine, respectively (Fig. 6d). Interestingly, the CI–FA plot for this combination showed a difference in the response of the two ARMS lines, where RH30 demon-strated synergy across a broader range of FA values than
the other 3 cell lines (Fig. 6e). However, this combination was synergistic in all RMS lines at FA > 0.8.
Discussion
Our results confirm that RMS cell lines are sensitive to multiple cytotoxic agents commonly used in frontline therapy including cyclophosphamide, dactinomycin, etopo-side, irinotecan, and vinorelbine. We also found that cabo-zantinib, bortezomib, and AZD1775 exhibit robust activity in vitro both alone and in combination similar to conven-tional agents.
The most robust combinations as defined by producing a high FA value while maintaining a synergistic CI included the Wee1 kinase inhibitor, AZD1775. Combinations that employed a proteasome inhibitor, bortezomib, and a tyros-ine kinase inhibitor, cabozantinib, also demonstrated activ-ity by FA measurements, but with CI > 1.1 indicating antagonism with standard agents.
Both the mechanism of AZD1775 and a review of the literature support its use as an agent in combination with
c
d
Combina�on Index
AZD1
775
(ng/
ml)
500 95 93 91 90 88
AZD1
775
(ng/
ml)
500 0.3 0.4 0.4 0.4 0.5
250 87 83 79 77 72 250 0.5 0.5 0.5 0.5 0.6
125 73 63 58 57 47 125 0.7 0.8 0.7 0.6 0.7
62.5 59 51 46 38 20 62.5 0.9 0.8 0.7 0.7 1.2
31.3 55 49 39 30 11 31.3 0.9 0.7 0.6 0.7 2.0
5.00 2.50 1.25 0.625 0.313 5.00 2.50 1.25 0.625 0.313
SN-38 (ng/ml) SN-38 (ng/ml) AZD1775 (ng/ml)0 500 1000 1500
SN-3
8(n
g/m
l)
0
20
40
60
80
100
120
140 RH30 ED90 (50:1)RH30 ED90 (100:1)RH30 ED90 (200:1)RH41 ED90 (50:1)RH41 ED90 (100:1)RH41 ED90 (200:1)SMS-Ctr ED90 (50:1)SMS-Ctr ED90 (100:1)SMS-Ctr ED90 (200:1)RD ED90 (50:1)RD ED90 (100:1)RD ED90 (200:1)
b a
CI vs. Fa
AZD1775 (1:2) + SN-38 (1:2)FA
0 0.4 0.8
CI
0.01
0.1
1
10
RH30RH41SMS-CtrRDSMS-CTR
e
AZD1775 + SN-38
AZD1775 LOG(ng/ml)2 3
SN-38 LOG(ng/ml)0 0.7 1.4-0.7
1-FA
(%)
0
25
50
75
100AZD1775SN38AZD + SN38SN-38 AZD1775 + SN-38
AZD1775
Fig. 4 Combination activity for AZD1775 and SN-38. a FA and b CI values of AZD1775 and SN-38 assessed at 25 different concentra-tions. c Isobologram analysis of the combination demonstrating syn-ergy at ED90 with 3 different drug ratios. d Single and combination
drug–response curves for the combination showing cytotoxicity of the drug combination compared to single agent. e CI–FA plot showing synergy in all 4 RMS cells lines across a broad arrange of FA values in this drug combination
320 Cancer Chemother Pharmacol (2016) 78:313–323
1 3
conventional chemotherapy in RMS, which may explain its high cell kill as measured by FA while maintaining synergy. The Wee1 kinase maintains cells in G2/M arrest, providing time for DNA repair prior to mitosis. When the Wee1 kinase is inhibited, CDK1/2 activity proceeds unchecked, and cells progress prematurely through G2/M leading to mitotic progression, DNA strand breaks, mitotic catastrophe, and cell death [21, 22]. In addition to growth inhibition of several sarcoma cell lines, AZD1775 in com-bination with gemcitabine demonstrated synergistic activ-ity in osteosarcoma cell lines and patient-derived osteosar-coma murine xenografts. Specifically, the agents led to a more significant delay in tumor growth and smaller tumors in combination than when either agent was given alone [23]. It is postulated that the combination of this agent with conventional chemotherapy potentiates the DNA dam-age exerted by standard cytotoxics by impeding this criti-cal cell cycle checkpoint [33]. Certainly, our data confirm the activity of AZD1775 in combination with alkylating agents, topoisomerase inhibitors, and microtubule inhibi-tors in RMS in vitro. In RMS, the impact of Wee1 kinase
inhibition is not yet known though the completion of a phase I trial demonstrating good tolerance will allow for more robust trials with this agent [25, 26].
Based on the promising in vitro data, there is strong interest in further development of AZD1775 in the pediatric setting. The Children’s Oncology Group (COG) is currently studying the agent in two phase I trials—one that is evalu-ating the agent in combination with radiation therapy for patients with newly diagnosed diffuse intrinsic pontine gli-oma (NCT01922076) and one that is evaluating the agent in combination with irinotecan in patients with refractory solid tumors (NCT02095132). There remains high interest in this agent for patients with RMS as well. Evaluating the addition of AZD1775 to conventional chemotherapy is con-sistent with the overall strategy of the COG’s Soft Tissue Sarcoma Committee to conduct randomized phase II stud-ies in patients with metastatic rhabdomyosarcoma to iden-tify agents worthy of larger phase III studies.
Despite the promising results seen in this study with AZD1775 especially in combination with 4HC, SN-38, and vinorelbine, several limitations exist. We recognize
Combina�on Index
AZD1
775
(ng/
ml)
500 95 91 89 85 85
AZD1
775
(ng/
ml)
500 0.8 0.6 0.5 0.6 0.6
250 89 82 76 65 64 250 1.3 0.9 0.7 0.8 0.8
125 83 70 47 31 27 125 1.9 1.4 1.5 2.2 2.3
62.5 76 59 23 8 8 62.5 2.9 2.3 3.9 4.1 3.8
31.3 76 49 15 6 0 31.3 2.8 3.6 5.0 4.4 4.1
5000 1250 313 78.3 19.6 5000 1250 313 78.3 19.6
Etoposide (ng/ml) Etoposide (ng/ml)
CI vs. Fa
AZD1775 (1:2) + Etoposide (1:4)FA
0 0.4 0.8
CI
0.01
0.1
1
10
RH30RH41SMS-CtrRD
a b c
d e
SMS-CTR
Etoposide + AZD1775
EtoposideEtop + AZD1(125 ng/ml)Etop + AZD1(250 ng/ml)Etop + AZD1(500 ng/ml)
AZD1775 + Etoposide
AZD1775AZD1 + Etop(313 ng/ml)AZD1 + Etop(1250 ng/ml)AZD1 + Etop(5000 ng/ml)
Fig. 5 Combination activity for AZD1775 and etoposide. a FA and b CI values of AZD1775 and etoposide assessed at 25 different concen-trations. c CI–FA plot showing synergy at higher FA values. d Fold-of-potentiation graph demonstrating the increase in cytotoxic activity
of adding etoposide at 313, 1250, and 5000 ng/ml to varying concen-trations of AZD1775. e Fold-of-potentiation graph demonstrating the increase in cytotoxic activity of adding AZD1775 at 125, 250, and 500 ng/ml to varying concentrations of etoposide
321Cancer Chemother Pharmacol (2016) 78:313–323
1 3
that for some agents, serum levels may over-represent agent delivery to tumor cells or in other situations may underestimate agent delivery based on either conditions in the tumor or the microenvironment. Unfortunately, intratumoral concentrations of many agents are not avail-able. We also recognize that not all agent effects can be determined in vitro with stromal, vascular, and immuno-logic activities being some examples of activities not rep-resented with our system. For example, it is possible that our observation of low cabozantinib activity is due to the inability of the cell culture model to fully recapitulate the complex RMS tumor microenvironment in vivo, and thus is not able to fully assess the potency of this drug. Importantly, we acknowledge that this system is intended to explore a number of agents and combinations that could not reasonably be investigated in patients or animal models and acknowledge it is yet to be proven that these methods of incorporating clinically achievable concentra-tions will be more informative for clinical translation than prior in vitro studies that do not consider human pharma-cokinetic data. While activity was maintained across both ARMS and ERMS cell lines, the results, both alone and
in combination, should ultimately be confirmed in other models including possibly an in vivo model or a clinical trial in patients with RMS.
Despite the limitations of the system, our data provide support for further development of AZD1775 in RMS, especially in combination with cytotoxic chemotherapy going forward and especially for patients with high-risk or recurrent disease who have a dismal prognosis that has not improved over several decades despite multiple clini-cal trials. Furthermore, this in vitro system represents an efficient method to rapidly screen novel agents in com-bination and prioritize combinations that should be con-sidered for additional evaluation in rare diseases such as RMS.
Acknowledgments This study was generously supported by the Pediatric Cancer Foundation (www.fastercure.org) and the V Founda-tion. We also thank Dr. Douglas S. Hawkins for an insightful review. This work has been supported in part by the Translational Research Core at the H. Lee Moffitt Cancer Center and Research Institute, an NCI designated Comprehensive Cancer Center (P30-CA076292). We also thank Laura Hall (Moffitt Molecular Genomics Core) for per-forming cell line identity.
Combina�on Index
AZD1
775
(ng/
ml)
500 91 90 88 88 87
AZD1
775
(ng/
ml)
500 0.6 0.6 0.5 0.5 0.5
250 89 88 85 83 84 250 0.6 0.4 0.4 0.4 0.4
125 80 65 43 35 29 125 0.7 1.0 1.9 1.8 2.1
62.5 77 56 37 26 28 62.5 0.7 1.3 1.9 2.4 1.4
31.3 70 37 10 2 1 31.3 1.1 3.2 5.0 5.0 4.6
4.00 2.00 1.00 0.50 0.25 4.00 2.00 1.00 0.50 0.25
Vinorelbine (ng/ml) Vinorelbine (ng/ml)
RH30 ED95 (125:2) RH30 ED95 (125:1) RH30 ED95 (250:1) RH41 ED95 (125:2) RH41 ED95 (125:1) RH41 ED95 (250:1) SMS-CTR ED95 (125:2) SMS-CTR ED95 (125:1) SMS-CTR ED95 (250:1) RD ED95 (125:2) RD ED95 (125:1) RD ED95 (250:1)
AZD1775 (ng/ml)
20 18 16 14 12 10
8 6 4 2 0
Vino
relb
ine
(ng/
ml)
0 800 1600 2400
1600
10000
8000
6000
4000
2000
0 0
c
d
b a
CI vs. Fa
AZD1775 (1:2) + Vinorelbine (1:2)FA
0 0.4 0.8
CI
0.01
0.1
1
10
RH30RH41SMS-CtrRD
AZD1775 + Vinorelbine
AZD1775 LOG(ng/ml)1 1.6 2.2 2.8
Vinorelbine LOG(ng/ml)0 0.7-0.7-1.4
1-FA
(%)
0
25
50
75
100AZD1775VinorelbineAZD + Vin
e
SMS-CTR
Fig. 6 Combination activity for AZD1775 and vinorelbine. a FA and b CI values of AZD1775 and vinorelbine assessed at 25 different con-centrations. c Isobologram analysis of the combination demonstrating at ED90 with 3 different drug ratios. d Single and combination drug–
response curves for the combination showing cytotoxicity of the drug combination compared to single agent. e CI–FA plot showing slight differential responses in the 2 ARMS cells lines to this drug combina-tion
322 Cancer Chemother Pharmacol (2016) 78:313–323
1 3
Compliance with ethical standards
Conflict of interest The authors declare no conflicts of interest.
Open Access This article is distributed under the terms of the Crea-tive Commons Attribution 4.0 International License (http://crea-tivecommons.org/licenses/by/4.0/), which permits unrestricted use, distribution, and reproduction in any medium, provided you give appropriate credit to the original author(s) and the source, provide a link to the Creative Commons license, and indicate if changes were made.
References
1. Ries LAG, Smith MA, Gurney JG, Linet M, Tamra T, Young JL, Bunin GR (eds) (1999) Cancer incidence and survival among children and adolescents: United States SEER Program 1975–1995, National Cancer Institute, SEER Program, vol Pub. No. 99-4649. NIH, Bethesda, MD
2. Arndt CA, Stoner JA, Hawkins DS, Rodeberg DA, Hayes-Jordan AA, Paidas CN, Parham DM, Teot LA, Wharam MD, Breneman JC, Donaldson SS, Anderson JR, Meyer WH (2009) Vincristine, actinomycin, and cyclophosphamide compared with vincristine, actinomycin, and cyclophosphamide alternating with vincristine, topotecan, and cyclophosphamide for intermediate-risk rhabdo-myosarcoma: Children’s Oncology Group Study D9803. J Clin Oncol 27(31):5182–5188. doi:10.1200/jco.2009.22.3768
3. Raney RB, Walterhouse DO, Meza JL, Andrassy RJ, Breneman JC, Crist WM, Maurer HM, Meyer WH, Parham DM, Anderson JR (2011) Results of the Intergroup Rhabdomyosarcoma Study Group D9602 protocol, using vincristine and dactinomycin with or without cyclophosphamide and radiation therapy, for newly diagnosed patients with low-risk embryonal rhabdomyosarcoma: a report from the Soft Tissue Sarcoma Committee of the Chil-dren’s Oncology Group. J Clin Oncol Off J Am Soc Clin Oncol 29(10):1312–1318. doi:10.1200/JCO.2010.30.4469
4. Oberlin O, Rey A, Lyden E, Bisogno G, Stevens MC, Meyer WH, Carli M, Anderson JR (2008) Prognostic factors in meta-static rhabdomyosarcomas: results of a pooled analysis from United States and European cooperative groups. J Clin Oncol Off J Am Soc Clin Oncol 26(14):2384–2389. doi:10.1200/JCO.2007.14.7207
5. Breneman JC, Lyden E, Pappo AS, Link MP, Anderson JR, Par-ham DM, Qualman SJ, Wharam MD, Donaldson SS, Maurer HM, Meyer WH, Baker KS, Paidas CN, Crist WM (2003) Prog-nostic factors and clinical outcomes in children and adolescents with metastatic rhabdomyosarcoma—a report from the Inter-group Rhabdomyosarcoma Study IV. J Clin Oncol 21(1):78–84
6. Maurer HM, Beltangady M, Gehan EA, Crist W, Hammond D, Hays DM, Heyn R, Lawrence W, Newton W, Ortega J et al (1988) The Intergroup Rhabdomyosarcoma Study-I. A final report. Cancer 61(2):209–220
7. Weiss A, Gill J, Goldberg J, Lagmay J, Spraker-Perlman H, Venkatramani R, Reed D (2014) Advances in therapy for pediatric sarcomas. Curr Oncol Rep 16(8):395. doi:10.1007/s11912-014-0395-z
8. Amankwah EK, Conley AP, Reed DR (2013) Epidemiology and therapies for metastatic sarcoma. Clin Epidemiol 5:147–162. doi:10.2147/CLEP.S28390
9. Weigel BJ, Lyden E, Anderson JR, Meyer WH, Parham DM, Rodeberg DA, Michalski JM, Hawkins DS, Arndt CA (2016) Intensive multiagent therapy, including dose-compressed cycles of ifosfamide/etoposide and vincristine/doxorubicin/
cyclophosphamide, irinotecan, and radiation, in patients with high-risk rhabdomyosarcoma: a report from the Children’s Oncology Group. J Clin Oncol 34(2):117–122. doi:10.1200/JCO.2015.63.4048
10. Weigel BJ, Lyden E, Anderson JR, Meyer WH, Parham DM, Rodeberg DA, Michalski JM, Hawkins DS, Arndt CA (2015) Intensive multiagent therapy, including dose-compressed cycles of ifosfamide/etoposide and vincristine/doxorubicin/cyclophos-phamide, irinotecan, and radiation, in patients with high-risk rhabdomyosarcoma: a report from the Children’s Oncology Group. J Clin Oncol. doi:10.1200/jco.2015.63.4048
11. Hawkins DS, Spunt SL, Skapek SX (2013) Children’s Oncology Group’s 2013 blueprint for research: soft tissue sarcomas. Pedi-atr Blood Cancer 60(6):1001–1008. doi:10.1002/pbc.24435
12. Peruzzi B, Bottaro DP (2006) Targeting the c-Met signal-ing pathway in cancer. Clin Cancer Res 12(12):3657–3660. doi:10.1158/1078-0432.ccr-06-0818
13. Fleuren ED, Roeffen MH, Leenders WP, Flucke UE, Vlenterie M, Schreuder HW, Boerman OC, van der Graaf WT, Versleijen-Jonkers YM (2013) Expression and clinical relevance of MET and ALK in Ewing sarcomas. Int J Cancer 133(2):427–436. doi:10.1002/ijc.28047
14. Skrzypek K, Kusienicka A, Szewczyk B, Adamus T, Lukasie-wicz E, Miekus K, Majka M (2015) Constitutive activation of MET signaling impairs myogenic differentiation of rhabdomyo-sarcoma and promotes its development and progression. Onco-target 6(31):31378–31398. doi:10.18632/oncotarget.5145
15. Miekus K, Lukasiewicz E, Jarocha D, Sekula M, Drabik G, Majka M (2013) The decreased metastatic potential of rhabdo-myosarcoma cells obtained through MET receptor downregula-tion and the induction of differentiation. Cell Death Dis 4:e459. doi:10.1038/cddis.2012.199
16. Onisto M, Slongo ML, Gregnanin L, Gastaldi T, Carli M, Rosolen A (2005) Expression and activity of vascular endothelial growth factor and metalloproteinases in alveolar and embryonal rhabdomyosarcoma cell lines. Int J Oncol 27(3):791–798
17. Moreau P, Attal M, Facon T (2015) Frontline therapy of mul-tiple myeloma. Blood 125(20):3076–3084. doi:10.1182/blood-2014-09-568915
18. Horton TM, Drachtman RA, Chen L, Cole PD, McCarten K, Voss S, Guillerman RP, Buxton A, Howard SC, Hogan SM, Sheehan AM, Lopez-Terrada D, Mrazek MD, Agrawal N, Wu MF, Liu H, De Alarcon PA, Trippet TM, Schwartz CL (2015) A phase 2 study of bortezomib in combination with ifosfa-mide/vinorelbine in paediatric patients and young adults with refractory/recurrent Hodgkin lymphoma: a Children’s Oncol-ogy Group study. Br J Haematol 170(1):118–122. doi:10.1111/bjh.13388
19. Peron M, Bonvini P, Rosolen A (2012) Effect of inhibition of the ubiquitin-proteasome system and Hsp90 on growth and sur-vival of rhabdomyosarcoma cells in vitro. BMC Cancer 12:233. doi:10.1186/1471-2407-12-233
20. Bersani F, Taulli R, Accornero P, Morotti A, Miretti S, Cre-paldi T, Ponzetto C (2008) Bortezomib-mediated proteasome inhibition as a potential strategy for the treatment of rhab-domyosarcoma. Eur J Cancer 44(6):876–884. doi:10.1016/j.ejca.2008.02.022
21. Do K, Doroshow JH, Kummar S (2013) Wee1 kinase as a target for cancer therapy. Cell Cycle 12(19):3159–3164. doi:10.4161/cc.26062
22. Del Nagro CJ, Choi J, Xiao Y, Rangell L, Mohan S, Pandita A, Zha J, Jackson PK, O’Brien T (2014) Chk1 inhibition in p53-deficient cell lines drives rapid chromosome fragmenta-tion followed by caspase-independent cell death. Cell Cycle 13(2):303–314. doi:10.4161/cc.27055
323Cancer Chemother Pharmacol (2016) 78:313–323
1 3
23. Kreahling JM, Foroutan P, Reed D, Martinez G, Razabdouski T, Bui MM, Raghavan M, Letson D, Gillies RJ, Altiok S (2013) Wee1 inhibition by MK-1775 leads to tumor inhibition and enhances efficacy of gemcitabine in human sarcomas. PLoS One 8(3):e57523. doi:10.1371/journal.pone.0057523
24. Kreahling JM, Gemmer JY, Reed D, Letson D, Bui M, Altiok S (2012) MK1775, a selective Wee1 inhibitor, shows single-agent antitumor activity against sarcoma cells. Mol Cancer Ther 11(1):174–182. doi:10.1158/1535-7163.MCT-11-0529
25. Mueller S, Haas-Kogan DA (2015) Wee1 kinase as a target for cancer therapy. J Clin Oncol 33(30):3485–3487. doi:10.1200/JCO.2015.62.2290
26. Do K, Wilsker D, Ji J, Zlott J, Freshwater T, Kinders RJ, Collins J, Chen AP, Doroshow JH, Kummar S (2015) Phase I study of single-agent AZD1775 (MK-1775), a Wee1 kinase inhibitor, in patients with refractory solid tumors. J Clin Oncol 33(30):3409–3415. doi:10.1200/JCO.2014.60.4009
27. Yu D, Kahen E, Cubitt CL, McGuire J, Kreahling J, Lee J, Altiok S, Lynch CC, Sullivan DM, Reed DR (2015) Identification of synergistic, clinically achievable, combination therapies for oste-osarcoma. Sci Rep 5:16991. doi:10.1038/srep16991
28. Smith MA, Houghton P (2013) A proposal regarding reporting of in vitro testing results. Clin Cancer Res Off J Am Assoc Cancer Res 19(11):2828–2833. doi:10.1158/1078-0432.CCR-13-0043
29. Hinson AR, Jones R, Crose LE, Belyea BC, Barr FG, Linardic CM (2013) Human rhabdomyosarcoma cell lines for rhabdo-myosarcoma research: utility and pitfalls. Front Oncol 3:183. doi:10.3389/fonc.2013.00183
30. Chou TC, Talalay P (1984) Quantitative analysis of dose-effect relationships: the combined effects of multiple drugs or enzyme inhibitors. Adv Enzyme Regul 22:27–55
31. Boik JC (2012) Mixlow: software for assessing drug synergism/antagonism. R package version 1.0.1 edn
32. Cubitt CL, Menth J, Dawson J, Martinez GV, Foroutan P, Morse DL, Bui MM, Letson GD, Sullivan DM, Reed DR (2013) Rapid screening of novel agents for combination therapy in sarcomas. Sarcoma 2013:365723. doi:10.1155/2013/365723
33. De Witt Hamer PC, Mir SE, Noske D, Van Noorden CJ, Wurdinger T (2011) Wee1 kinase targeting combined with DNA-damaging cancer therapy catalyzes mitotic catastrophe. Clin Cancer Res 17(13):4200–4207. doi:10.1158/1078-0432.CCR-10-2537