Embed Size (px)
Citation preview
“fgene-04-00226” — 2013/10/31 — 20:48 — page 1 — #1
ORIGINAL RESEARCH ARTICLEpublished: 05 November 2013
doi: 10.3389/fgene.2013.00226
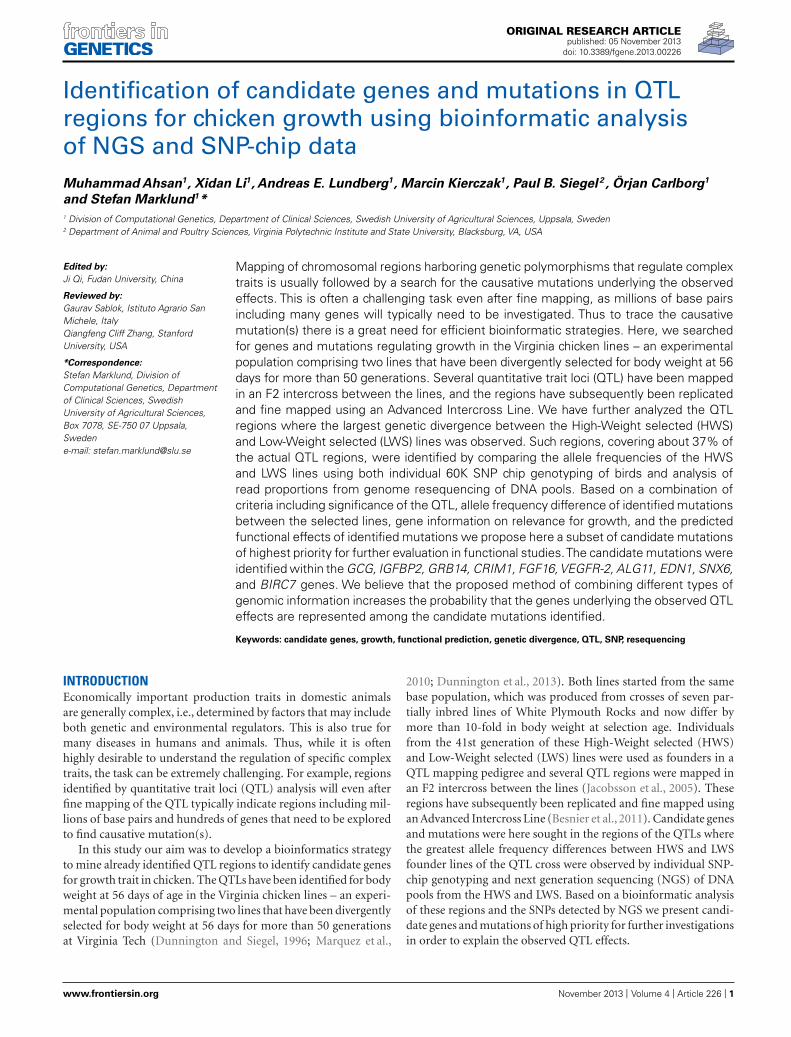
Identification of candidate genes and mutations in QTLregions for chicken growth using bioinformatic analysisof NGS and SNP-chip dataMuhammad Ahsan1, Xidan Li1, Andreas E. Lundberg1, Marcin Kierczak1, Paul B. Siegel 2 , Örjan Carlborg1
and Stefan Marklund1*
1 Division of Computational Genetics, Department of Clinical Sciences, Swedish University of Agricultural Sciences, Uppsala, Sweden2 Department of Animal and Poultry Sciences, Virginia Polytechnic Institute and State University, Blacksburg, VA, USA
Edited by:
Ji Qi, Fudan University, China
Reviewed by:
Gaurav Sablok, Istituto Agrario SanMichele, ItalyQiangfeng Cliff Zhang, StanfordUniversity, USA
*Correspondence:
Stefan Marklund, Division ofComputational Genetics, Departmentof Clinical Sciences, SwedishUniversity of Agricultural Sciences,Box 7078, SE-750 07 Uppsala,Swedene-mail: [email protected]
Mapping of chromosomal regions harboring genetic polymorphisms that regulate complextraits is usually followed by a search for the causative mutations underlying the observedeffects. This is often a challenging task even after fine mapping, as millions of base pairsincluding many genes will typically need to be investigated. Thus to trace the causativemutation(s) there is a great need for efficient bioinformatic strategies. Here, we searchedfor genes and mutations regulating growth in the Virginia chicken lines – an experimentalpopulation comprising two lines that have been divergently selected for body weight at 56days for more than 50 generations. Several quantitative trait loci (QTL) have been mappedin an F2 intercross between the lines, and the regions have subsequently been replicatedand fine mapped using an Advanced Intercross Line. We have further analyzed the QTLregions where the largest genetic divergence between the High-Weight selected (HWS)and Low-Weight selected (LWS) lines was observed. Such regions, covering about 37% ofthe actual QTL regions, were identified by comparing the allele frequencies of the HWSand LWS lines using both individual 60K SNP chip genotyping of birds and analysis ofread proportions from genome resequencing of DNA pools. Based on a combination ofcriteria including significance of the QTL, allele frequency difference of identified mutationsbetween the selected lines, gene information on relevance for growth, and the predictedfunctional effects of identified mutations we propose here a subset of candidate mutationsof highest priority for further evaluation in functional studies.The candidate mutations wereidentified within the GCG, IGFBP2, GRB14, CRIM1, FGF16,VEGFR-2, ALG11, EDN1, SNX6,and BIRC7 genes. We believe that the proposed method of combining different types ofgenomic information increases the probability that the genes underlying the observed QTLeffects are represented among the candidate mutations identified.
Keywords: candidate genes, growth, functional prediction, genetic divergence, QTL, SNP, resequencing
INTRODUCTIONEconomically important production traits in domestic animalsare generally complex, i.e., determined by factors that may includeboth genetic and environmental regulators. This is also true formany diseases in humans and animals. Thus, while it is oftenhighly desirable to understand the regulation of specific complextraits, the task can be extremely challenging. For example, regionsidentified by quantitative trait loci (QTL) analysis will even afterfine mapping of the QTL typically indicate regions including mil-lions of base pairs and hundreds of genes that need to be exploredto find causative mutation(s).
In this study our aim was to develop a bioinformatics strategyto mine already identified QTL regions to identify candidate genesfor growth trait in chicken. The QTLs have been identified for bodyweight at 56 days of age in the Virginia chicken lines – an experi-mental population comprising two lines that have been divergentlyselected for body weight at 56 days for more than 50 generationsat Virginia Tech (Dunnington and Siegel, 1996; Marquez et al.,
2010; Dunnington et al., 2013). Both lines started from the samebase population, which was produced from crosses of seven par-tially inbred lines of White Plymouth Rocks and now differ bymore than 10-fold in body weight at selection age. Individualsfrom the 41st generation of these High-Weight selected (HWS)and Low-Weight selected (LWS) lines were used as founders in aQTL mapping pedigree and several QTL regions were mapped inan F2 intercross between the lines (Jacobsson et al., 2005). Theseregions have subsequently been replicated and fine mapped usingan Advanced Intercross Line (Besnier et al., 2011). Candidate genesand mutations were here sought in the regions of the QTLs wherethe greatest allele frequency differences between HWS and LWSfounder lines of the QTL cross were observed by individual SNP-chip genotyping and next generation sequencing (NGS) of DNApools from the HWS and LWS. Based on a bioinformatic analysisof these regions and the SNPs detected by NGS we present candi-date genes and mutations of high priority for further investigationsin order to explain the observed QTL effects.
www.frontiersin.org November 2013 | Volume 4 | Article 226 | 1
“fgene-04-00226” — 2013/10/31 — 20:48 — page 2 — #2
Ahsan et al. Candidate gene identification in chicken
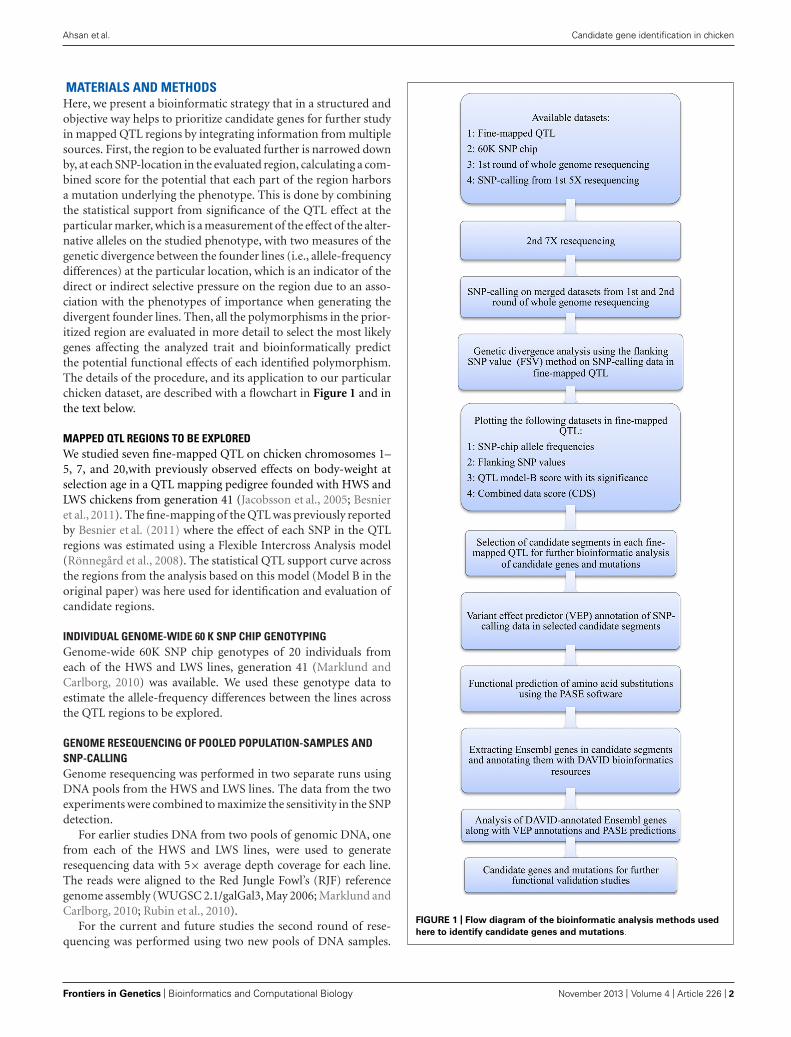
MATERIALS AND METHODSHere, we present a bioinformatic strategy that in a structured andobjective way helps to prioritize candidate genes for further studyin mapped QTL regions by integrating information from multiplesources. First, the region to be evaluated further is narrowed downby, at each SNP-location in the evaluated region, calculating a com-bined score for the potential that each part of the region harborsa mutation underlying the phenotype. This is done by combiningthe statistical support from significance of the QTL effect at theparticular marker, which is a measurement of the effect of the alter-native alleles on the studied phenotype, with two measures of thegenetic divergence between the founder lines (i.e., allele-frequencydifferences) at the particular location, which is an indicator of thedirect or indirect selective pressure on the region due to an asso-ciation with the phenotypes of importance when generating thedivergent founder lines. Then, all the polymorphisms in the prior-itized region are evaluated in more detail to select the most likelygenes affecting the analyzed trait and bioinformatically predictthe potential functional effects of each identified polymorphism.The details of the procedure, and its application to our particularchicken dataset, are described with a flowchart in Figure 1 and inthe text below.
MAPPED QTL REGIONS TO BE EXPLOREDWe studied seven fine-mapped QTL on chicken chromosomes 1–5, 7, and 20,with previously observed effects on body-weight atselection age in a QTL mapping pedigree founded with HWS andLWS chickens from generation 41 (Jacobsson et al., 2005; Besnieret al., 2011). The fine-mapping of the QTL was previously reportedby Besnier et al. (2011) where the effect of each SNP in the QTLregions was estimated using a Flexible Intercross Analysis model(Rönnegård et al., 2008). The statistical QTL support curve acrossthe regions from the analysis based on this model (Model B in theoriginal paper) was here used for identification and evaluation ofcandidate regions.
INDIVIDUAL GENOME-WIDE 60 K SNP CHIP GENOTYPINGGenome-wide 60K SNP chip genotypes of 20 individuals fromeach of the HWS and LWS lines, generation 41 (Marklund andCarlborg, 2010) was available. We used these genotype data toestimate the allele-frequency differences between the lines acrossthe QTL regions to be explored.
GENOME RESEQUENCING OF POOLED POPULATION-SAMPLES ANDSNP-CALLINGGenome resequencing was performed in two separate runs usingDNA pools from the HWS and LWS lines. The data from the twoexperiments were combined to maximize the sensitivity in the SNPdetection.
For earlier studies DNA from two pools of genomic DNA, onefrom each of the HWS and LWS lines, were used to generateresequencing data with 5× average depth coverage for each line.The reads were aligned to the Red Jungle Fowl’s (RJF) referencegenome assembly (WUGSC 2.1/galGal3, May 2006; Marklund andCarlborg, 2010; Rubin et al., 2010).
For the current and future studies the second round of rese-quencing was performed using two new pools of DNA samples.
FIGURE 1 | Flow diagram of the bioinformatic analysis methods used
here to identify candidate genes and mutations.
Frontiers in Genetics | Bioinformatics and Computational Biology November 2013 | Volume 4 | Article 226 | 2
“fgene-04-00226” — 2013/10/31 — 20:48 — page 3 — #3
Ahsan et al. Candidate gene identification in chicken
The individuals selected for each pool were guided by data fromearlier performed 60K SNP-chip genome-wide genotyping. Fromeach line, the eight individuals with the most non-representativegenotype pattern in the QTL regions were selected to increase thepossibilities for detection of variation within lines and therebyallow improved precision in the fine mapping of regions withhigh degree of between-line fixation. The ABI SOLiD resequencingwas carried out by the Uppsala Genome Center using mate-pairlibraries and 50 bases per read with ∼7× depth coverage in eachline. We aligned the reads to the RJF reference genome assembly(WUGSC 2.1/galGal3, May 2006) using the MOSAIK software(Lee et al., 2013) The resequencing datasets from the two roundsof sequencing were combined for SNP calling based on a total of∼12× depth coverage in each line. However in each line SNP alleleswere called at each SNP position as determined using the thresholdof three non-RJF reads that we set for SNP detection including thetotal number of reads from both lines (i.e., ∼24× depth coverage)to increase the sensitivity. The GigaBayes software, a newer versionof PolyBayes (Marth et al., 1999), was used for SNP calling.
GENETIC DIVERGENCE ANALYSIS USING THE FLANKING-SNP-VALUEMETHOD IN RESEQUENCING DATAWe applied the flanking-SNP-value (FSV) method (Marklund andCarlborg, 2010) to the resequencing data from the HWS and LWSlines across the selected QTL regions. The FSV method computesestimated allele frequency differences between the HWS and LWSlines for each evaluated SNP position based on information fromthe SNP itself as well as from data of flanking SNPs in both direc-tions within an interval presumed to show a high degree of linkagedisequilibrium with the SNP. Thus, the input data for FSV com-putation are the AB scores at all these positions, which in each lineindicate the proportion of resequenced reads that are in agreementwith reference sequence of RJF.
A COMBINED SCORE FOR CANDIDATE GENE PRIORITIZATIONThe allele frequency differences based on the individual SNPgenotyping, the genetic divergence estimates (FSV) from thepopulation-pool genome resequencing were plotted across theQTL regions together with the QTL support-curve from the QTLfine-mapping (Besnier et al., 2011). A combined data score (CDS)was also calculated based on these three information sources as:
CDS = {[(FSVscore + SNPchip-allele freq.)/2]+ (Normalized score of QTL_ModelB)}/2
The CDS was plotted to provide an objective statistic to priori-tize regions for further analysis and evaluations of candidate genesand mutations. In most cases the regions were selected above theQTL significance and with high CDS.
IDENTIFICATION OF CANDIDATE GENES AND MUTATIONS INPRIORITIZED REGIONSGenes were identified in the prioritized regions within the QTLusing the Ensembl database (version 67; Flicek et al., 2012).The general functions and gene annotations for each gene wascompiled using information from the Database for Annotation,Visualization and Integrated Discovery (DAVID; Huang et al.,
2009a,b). DAVID integrates annotations for genes from differ-ent omics databases including, for instance, gene ontology (GO),KEGG and PANTHER.
All SNPs detected by resequencing in selected candidate regionswere analyzed with variant effect predictor (VEP) from Ensembl(McLaren et al., 2010). VEP maps the locations of SNPs, insertionsand deletions to different functional parts of Ensembl genes, tran-scripts and regulatory sequences. It differentiates coding SNPsin exons as synonymous or non-synonymous and shows aminoacid substitutions. For some species, however not in chicken, italso predicts the functional consequences of non-synonymousSNPs (nsSNPs) on carrying proteins. We analyzed nsSNPs inprotein coding sequences in the prioritized QTL regions usingan in-house developed tool for prediction of amino acid sub-stitutions based on their physicochemical properties (PASE) andevolutionary conservation (Li et al., 2013).
The DAVID annotated gene list was then filtered to identify themost likely candidate genes for growth in each QTL region. Thiswas done by selecting the genes that had been associated with anyof the following growth-related keywords: growth, development,morphogenesis, formation, proliferation, differentiation, regen-eration, mineralization, elongation, biosynthetic, biogenesis, andorganization. This set of terms was selected arbitrarily from ontol-ogy literature. The whole annotated gene list description was alsoreviewed to ensure no obvious candidates for growth were omitted.
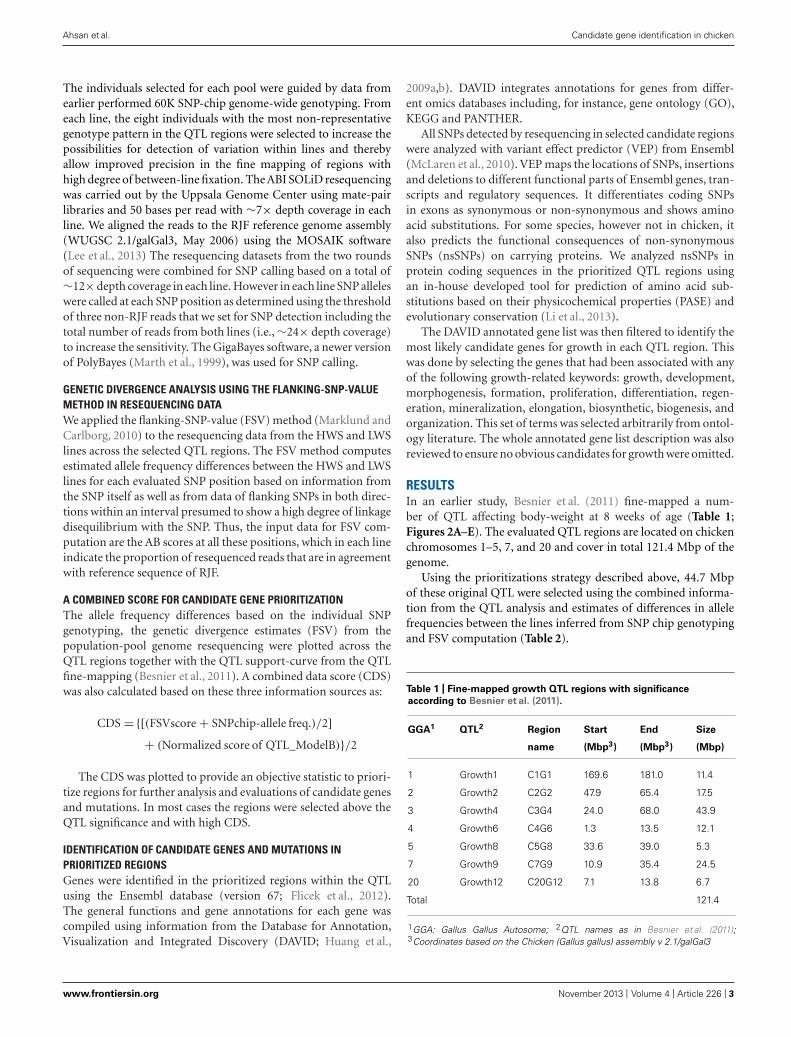
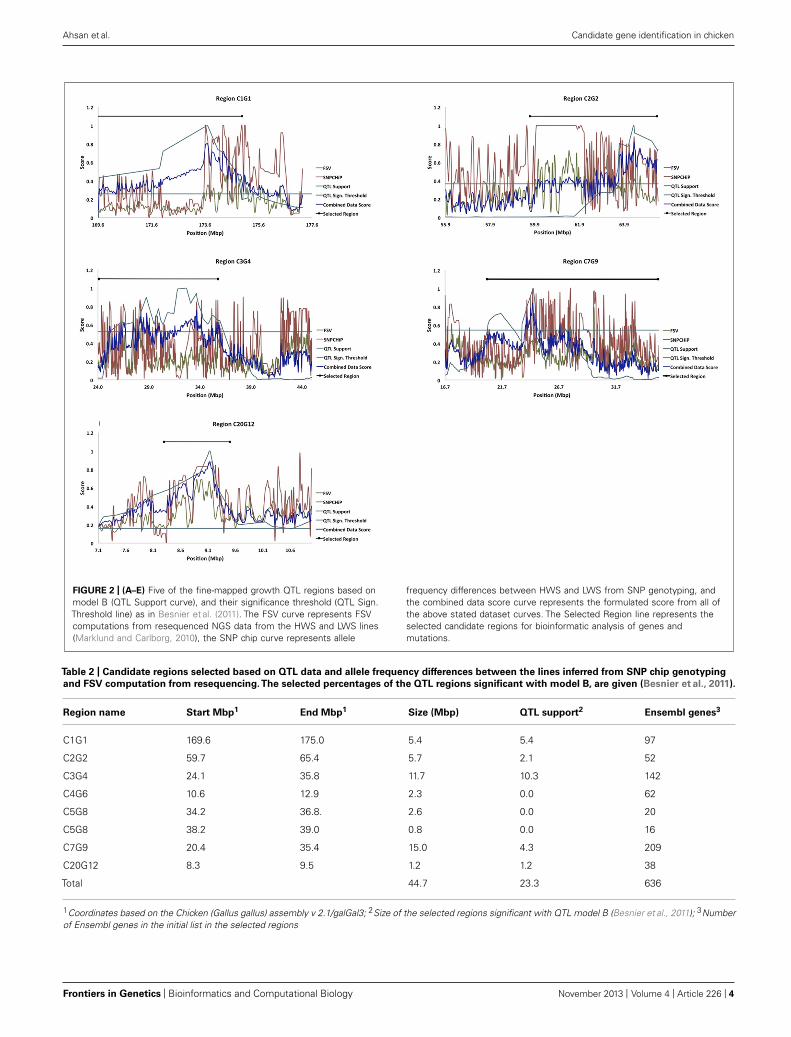
RESULTSIn an earlier study, Besnier et al. (2011) fine-mapped a num-ber of QTL affecting body-weight at 8 weeks of age (Table 1;Figures 2A–E). The evaluated QTL regions are located on chickenchromosomes 1–5, 7, and 20 and cover in total 121.4 Mbp of thegenome.
Using the prioritizations strategy described above, 44.7 Mbpof these original QTL were selected using the combined informa-tion from the QTL analysis and estimates of differences in allelefrequencies between the lines inferred from SNP chip genotypingand FSV computation (Table 2).
Table 1 | Fine-mapped growth QTL regions with significance
according to Besnier et al. (2011).
GGA1 QTL2 Region
name
Start
(Mbp3)
End
(Mbp3)
Size
(Mbp)
1 Growth1 C1G1 169.6 181.0 11.4
2 Growth2 C2G2 47.9 65.4 17.5
3 Growth4 C3G4 24.0 68.0 43.9
4 Growth6 C4G6 1.3 13.5 12.1
5 Growth8 C5G8 33.6 39.0 5.3
7 Growth9 C7G9 10.9 35.4 24.5
20 Growth12 C20G12 7.1 13.8 6.7
Total 121.4
1GGA: Gallus Gallus Autosome; 2QTL names as in Besnier et al. (2011);3Coordinates based on the Chicken (Gallus gallus) assembly v 2.1/galGal3
www.frontiersin.org November 2013 | Volume 4 | Article 226 | 3
“fgene-04-00226” — 2013/10/31 — 20:48 — page 4 — #4
Ahsan et al. Candidate gene identification in chicken
FIGURE 2 | (A–E) Five of the fine-mapped growth QTL regions based onmodel B (QTL Support curve), and their significance threshold (QTL Sign.Threshold line) as in Besnier et al. (2011). The FSV curve represents FSVcomputations from resequenced NGS data from the HWS and LWS lines(Marklund and Carlborg, 2010), the SNP chip curve represents allele
frequency differences between HWS and LWS from SNP genotyping, andthe combined data score curve represents the formulated score from all ofthe above stated dataset curves. The Selected Region line represents theselected candidate regions for bioinformatic analysis of genes andmutations.
Table 2 | Candidate regions selected based on QTL data and allele frequency differences between the lines inferred from SNP chip genotyping
and FSV computation from resequencing.The selected percentages of the QTL regions significant with model B, are given (Besnier et al., 2011).
Region name Start Mbp1 End Mbp1 Size (Mbp) QTL support2 Ensembl genes3
C1G1 169.6 175.0 5.4 5.4 97
C2G2 59.7 65.4 5.7 2.1 52
C3G4 24.1 35.8 11.7 10.3 142
C4G6 10.6 12.9 2.3 0.0 62
C5G8 34.2 36.8. 2.6 0.0 20
C5G8 38.2 39.0 0.8 0.0 16
C7G9 20.4 35.4 15.0 4.3 209
C20G12 8.3 9.5 1.2 1.2 38
Total 44.7 23.3 636
1Coordinates based on the Chicken (Gallus gallus) assembly v 2.1/galGal3; 2Size of the selected regions significant with QTL model B (Besnier et al., 2011); 3Numberof Ensembl genes in the initial list in the selected regions
Frontiers in Genetics | Bioinformatics and Computational Biology November 2013 | Volume 4 | Article 226 | 4
“fgene-04-00226” — 2013/10/31 — 20:48 — page 5 — #5
Ahsan et al. Candidate gene identification in chicken
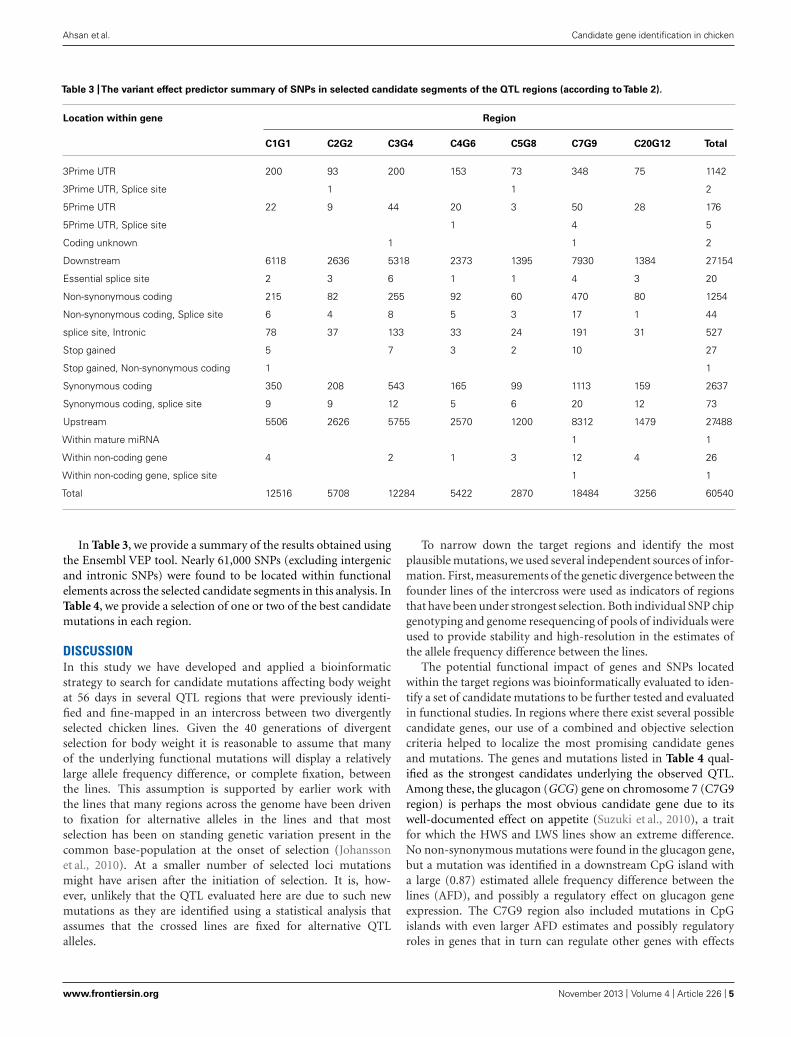
Table 3 |The variant effect predictor summary of SNPs in selected candidate segments of the QTL regions (according toTable 2).
Location within gene Region
C1G1 C2G2 C3G4 C4G6 C5G8 C7G9 C20G12 Total
3Prime UTR 200 93 200 153 73 348 75 1142
3Prime UTR, Splice site 1 1 2
5Prime UTR 22 9 44 20 3 50 28 176
5Prime UTR, Splice site 1 4 5
Coding unknown 1 1 2
Downstream 6118 2636 5318 2373 1395 7930 1384 27154
Essential splice site 2 3 6 1 1 4 3 20
Non-synonymous coding 215 82 255 92 60 470 80 1254
Non-synonymous coding, Splice site 6 4 8 5 3 17 1 44
splice site, Intronic 78 37 133 33 24 191 31 527
Stop gained 5 7 3 2 10 27
Stop gained, Non-synonymous coding 1 1
Synonymous coding 350 208 543 165 99 1113 159 2637
Synonymous coding, splice site 9 9 12 5 6 20 12 73
Upstream 5506 2626 5755 2570 1200 8312 1479 27488
Within mature miRNA 1 1
Within non-coding gene 4 2 1 3 12 4 26
Within non-coding gene, splice site 1 1
Total 12516 5708 12284 5422 2870 18484 3256 60540
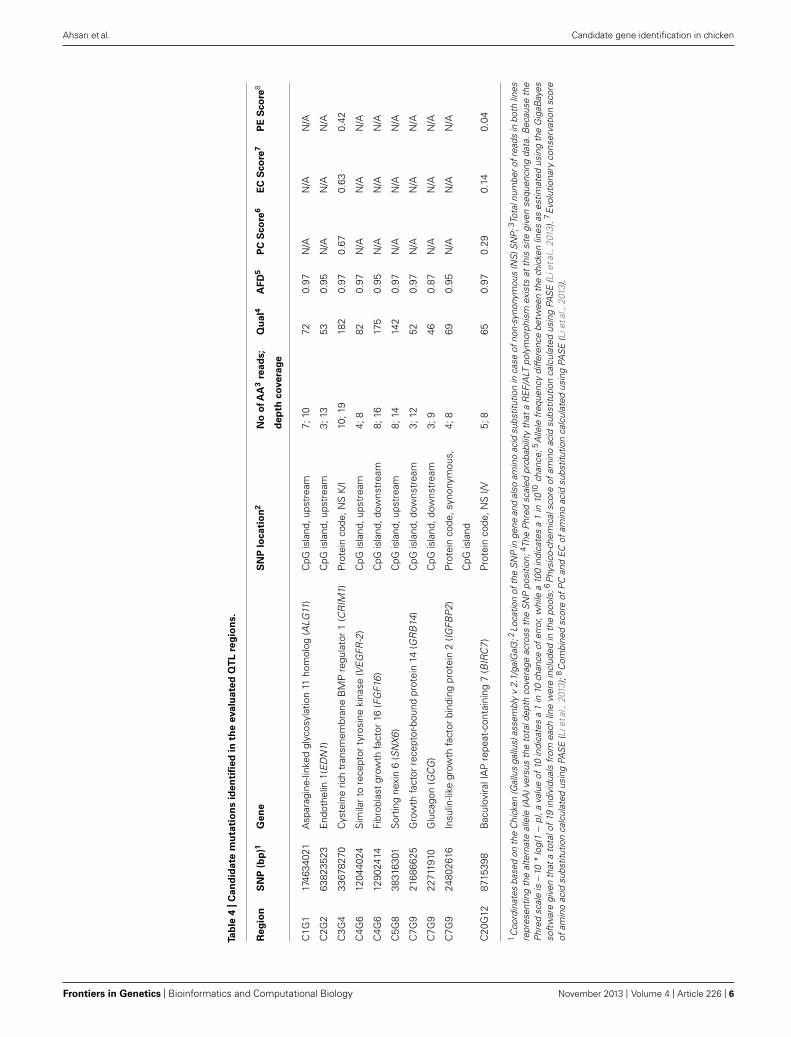
In Table 3, we provide a summary of the results obtained usingthe Ensembl VEP tool. Nearly 61,000 SNPs (excluding intergenicand intronic SNPs) were found to be located within functionalelements across the selected candidate segments in this analysis. InTable 4, we provide a selection of one or two of the best candidatemutations in each region.
DISCUSSIONIn this study we have developed and applied a bioinformaticstrategy to search for candidate mutations affecting body weightat 56 days in several QTL regions that were previously identi-fied and fine-mapped in an intercross between two divergentlyselected chicken lines. Given the 40 generations of divergentselection for body weight it is reasonable to assume that manyof the underlying functional mutations will display a relativelylarge allele frequency difference, or complete fixation, betweenthe lines. This assumption is supported by earlier work withthe lines that many regions across the genome have been drivento fixation for alternative alleles in the lines and that mostselection has been on standing genetic variation present in thecommon base-population at the onset of selection (Johanssonet al., 2010). At a smaller number of selected loci mutationsmight have arisen after the initiation of selection. It is, how-ever, unlikely that the QTL evaluated here are due to such newmutations as they are identified using a statistical analysis thatassumes that the crossed lines are fixed for alternative QTLalleles.
To narrow down the target regions and identify the mostplausible mutations, we used several independent sources of infor-mation. First, measurements of the genetic divergence between thefounder lines of the intercross were used as indicators of regionsthat have been under strongest selection. Both individual SNP chipgenotyping and genome resequencing of pools of individuals wereused to provide stability and high-resolution in the estimates ofthe allele frequency difference between the lines.
The potential functional impact of genes and SNPs locatedwithin the target regions was bioinformatically evaluated to iden-tify a set of candidate mutations to be further tested and evaluatedin functional studies. In regions where there exist several possiblecandidate genes, our use of a combined and objective selectioncriteria helped to localize the most promising candidate genesand mutations. The genes and mutations listed in Table 4 qual-ified as the strongest candidates underlying the observed QTL.Among these, the glucagon (GCG) gene on chromosome 7 (C7G9region) is perhaps the most obvious candidate gene due to itswell-documented effect on appetite (Suzuki et al., 2010), a traitfor which the HWS and LWS lines show an extreme difference.No non-synonymous mutations were found in the glucagon gene,but a mutation was identified in a downstream CpG island witha large (0.87) estimated allele frequency difference between thelines (AFD), and possibly a regulatory effect on glucagon geneexpression. The C7G9 region also included mutations in CpGislands with even larger AFD estimates and possibly regulatoryroles in genes that in turn can regulate other genes with effects
www.frontiersin.org November 2013 | Volume 4 | Article 226 | 5
“fgene-04-00226” — 2013/10/31 — 20:48 — page 6 — #6
Ahsan et al. Candidate gene identification in chicken
Ta
ble
4|
Ca
nd
ida
tem
uta
tio
ns
ide
nti
fie
din
the
eva
lua
ted
QT
Lre
gio
ns.
Re
gio
nS
NP
(bp
)1G
en
eS
NP
loca
tio
n2
No
ofA
A3
rea
ds;
de
pth
co
ve
rag
e
Qu
al4
AF
D5
PC
Sco
re6
EC
Sco
re7
PE
Sco
re8
C1G
117
4634
021
Asp
arag
ine-
linke
dgl
ycos
ylat
ion
11ho
mol
og(A
LG11
)C
pGis
land
,ups
trea
m7;
1072
0.97
N/A
N/A
N/A
C2G
263
8235
23E
ndot
helin
1(E
DN
1)C
pGis
land
,ups
trea
m3;
1353
0.95
N/A
N/A
N/A
C3G
433
6782
70C
yste
ine
rich
tran
smem
bran
eB
MP
regu
lato
r1
(CR
IM1)
Prot
ein
code
,NS
K/I
10;1
918
20.
970.
670.
630.
42
C4G
612
0440
24S
imila
rto
rece
ptor
tyro
sine
kina
se(V
EG
FR-2
)C
pGis
land
,ups
trea
m4;
882
0.97
N/A
N/A
N/A
C4G
612
9024
14Fi
brob
last
grow
thfa
ctor
16(F
GF1
6)
CpG
isla
nd,d
owns
trea
m8;
1617
50.
95N
/AN
/AN
/A
C5G
838
3163
01S
ortin
gne
xin
6(S
NX
6)
CpG
isla
nd,u
pstr
eam
8;14
142
0.97
N/A
N/A
N/A
C7G
921
6866
25G
row
thfa
ctor
rece
ptor
-bou
ndpr
otei
n14
(GR
B14
)C
pGis
land
,dow
nstr
eam
3;12
520.
97N
/AN
/AN
/A
C7G
922
7119
10G
luca
gon
(GC
G)
CpG
isla
nd,d
owns
trea
m3;
946
0.87
N/A
N/A
N/A
C7G
924
8026
16In
sulin
-like
grow
thfa
ctor
bind
ing
prot
ein
2(IG
FBP
2)
Prot
ein
code
,syn
onym
ous,
CpG
isla
nd
4;8
690.
95N
/AN
/AN
/A
C20
G12
8715
398
Bac
ulov
iralI
AP
repe
at-c
onta
inin
g7
(BIR
C7
)Pr
otei
nco
de,N
SI/V
5;8
650.
970.
290.
140.
04
1C
oord
inat
esba
sed
onth
eC
hick
en(G
allu
sga
llus)
asse
mbl
yv
2.1/
galG
al3;
2Lo
catio
nof
the
SN
Pin
gene
and
also
amin
oac
idsu
bstit
utio
nin
case
ofno
n-sy
nony
mou
s(N
S)S
NP
;3To
taln
umbe
rofr
eads
inbo
thlin
esre
pres
entin
gth
eal
tern
ate
alle
le(A
A)v
ersu
sth
eto
tald
epth
cove
rage
acro
ssth
eS
NP
posi
tion;
4 The
Phr
edsc
aled
prob
abili
tyth
ata
RE
F/A
LTpo
lym
orph
ism
exis
tsat
this
site
give
nse
quen
cing
data
.Bec
ause
the
Phr
edsc
ale
is−1
0*
log(
1−
p),a
valu
eof
10in
dica
tes
a1
in10
chan
ceof
erro
r,w
hile
a10
0in
dica
tes
a1
in10
10ch
ance
;5A
llele
freq
uenc
ydi
ffere
nce
betw
een
the
chic
ken
lines
ases
timat
edus
ing
the
Gig
aBay
esso
ftw
are
give
nth
ata
tota
lof
19in
divi
dual
sfr
omea
chlin
ew
ere
incl
uded
inth
epo
ols;
6P
hysi
co-c
hem
ical
scor
eof
amin
oac
idsu
bstit
utio
nca
lcul
ated
usin
gPA
SE
(Lie
tal.,
2013
).7E
volu
tiona
ryco
nser
vatio
nsc
ore
ofam
ino
acid
subs
titut
ion
calc
ulat
edus
ing
PAS
E(L
ieta
l.,20
13);
8C
ombi
ned
scor
eof
PC
and
EC
ofam
ino
acid
subs
titut
ion
calc
ulat
edus
ing
PAS
E(L
ieta
l.,20
13).
Frontiers in Genetics | Bioinformatics and Computational Biology November 2013 | Volume 4 | Article 226 | 6
“fgene-04-00226” — 2013/10/31 — 20:48 — page 7 — #7
Ahsan et al. Candidate gene identification in chicken
on body weight. Such mutations were found in the insulin-likegrowth factor binding protein 2 (IGFBP2) and the growth fac-tor receptor-bound protein 14 (GRB14; e.g., Holt and Siddle,2005) genes. The IGFBP5 gene is also located in this target regionbut at this stage we have not found sufficient support for anystrong candidate mutation in that gene. The IGF binding pro-teins can specify the actions of insulin-like growth factors whichhave key roles in vertebrate growth and development (e.g., Woodet al., 2005). Interestingly, the possibly regulatory IGFBP2 muta-tion reported here is located in a coding sequence that is a part ofa CpG island. Even though it is a synonymous mutation it mayaffect the IGFBP2 expression through mechanisms of codon usage,GC content and/or mRNA stability and folding (reviewed by Sha-balina et al., 2013). Overexpression of IGFBP2 has been shown toreduce postnatal body weight gain in transgenic mice (Hoeflichet al., 1999). The GRB14 gene encodes a cellular adapter proteinthat can bind to receptor tyrosine kinases and intracellular proteinsand thereby be involved in various processes. For example, it canbind and modify the signals from the insulin receptor and insulin-like growth factor 1 and its implication in growth regulation hasbeen shown (reviewed by Holt and Siddle, 2005).
Strong candidate genes and mutations were also found in QTLregions on chromosome 3 (C3G4) and 4 (C4G6). In the C3G4region, the gene encoding the cysteine rich transmembrane BMPregulator 1 (CRIM1),showed a non-synonymous mutations withlarge allele frequency difference between the lines and high PEscores (i.e., combined PC and EC scores; Table 4) with the PASEtool. CRIM1 interactions with growth factors may be importantfor the development of the central nervous system (CNS) andother organs (Kolle et al., 2000). Perhaps most interesting is theimpact the CRIM1 gene possibly has on the CNS because Kaet al. (2009) reported genes that regulate neuronal plasticity tobe differentially expressed between the HWS and LWS lines inthe brainstem and hypothalamus. Moreover, electrolytic hypotha-lamus lesions has been shown to increase appetite in the LWSbut not in the HWS line which further supports that CNS ishighly involved in the differences between these chicken lines(Burkhart et al., 1983).
In the C4G6 region, candidate CpG island mutations wereidentified within the fibroblast growth factor 16 (FGF16) andvascular endothelial growth factor receptor 2 (VEGFR-2) genes.FGF16 is known to be involved in embryonic developmentand cell growth (Antoine et al., 2006) whereas the VEGFR-2gene has been reported to be of importance for angiogenesis(Patterson et al., 1995).
In the chromosome 1 QTL region (C1G1) we also found acandidate mutation, possibly regulatory, in the asparagine-linkedglycosylation 11 homolog (ALG11) gene. ALG11 has been reportedto be involved in biosynthetic processes and required for normalgrowth in yeast (Cipollo et al., 2001).
The chromosome 2 QTL region (C2G2) showed CpG islandmutations at the endothelin 1 (EDN1) gene with the two chickenlines fixed for opposite alleles. EDN1 is known for roles inregulation of blood pressure and development (Kurihara et al.,1994).
In the regions on chromosome 5 (C5G8) and 20 (C20G12) thegenes found in the analysis were less obvious candidates. However,
such genes may still have key roles in processes with complex andindirect effects on growth-related traits. Keeping this in mind,we consider mutations identified in the sorting nexin 6 (SNX6;Caldwell et al., 2005; C5G8 region) and baculoviral IAP repeat-containing 7 (BIRC7 ; Kasof and Gomes, 2001; C20G12 region)genes are of most interest to investigate further.
In conclusion, the described combination of data from QTLmapping, next-generation sequencing, SNP chip genotyping andbioinformatic analysis has provided a list of plausible candidategenes and mutations that will facilitate further verification andexperimental evaluation. The support for this list from differ-ent types of data and analysis enhances the probability that theselected genes and mutations underlying the QTL effects are anunbiased selection of genes and that the contributing gene(s) areincluded in the set. Further studies based on this list may thereforereveal mutations which underlie the observed QTL effects and canincrease our understanding of growth regulation as well as be moreemphasized in animal breeding programs with genomic selection.
AUTHORS CONTRIBUTIONSMuhammad Ahsan and Xidan Li carried out the region-targetedcomputation and analysis using the different sources of dataand took part in the planning of the study. Marcin Kierczakand Andreas E. Lundberg performed the assembly of the SOLIDresequencing datasets. Stefan Marklund initiated and plannedthe study. Paul B. Siegel and Örjan Carlborg contributed withcomments and advice. Muhammad Ahsan and Stefan Marklunddrafted the manuscript and all co-authors contributed to the finalversion.
ACKNOWLEDGMENTSWe would like to thank the USDA Chicken GWMAS Consortium,Cobb Vantress, and Hendrix Genetics for access to the developed60K SNP Illumina iSelect chicken array, DNA landmarks for 60Karray genotyping and the Uppsala Genome Center for ABI SOLIDsequencing.
This work was financially supported by a EURYI award to ÖrjanCarlborg and a Future research leader grant to Örjan Carlborgfrom the Swedish Foundation for Strategic Research. The contri-bution of Muhammad Ahsan was supported by his scholarshipfrom the Higher Education Commission of Pakistan (HEC).
REFERENCESAntoine, M., Wirz, W., Tag, C. G., Gressner, A. M., Wycislo, M., Muller, R., et al.
(2006). Fibroblast growth factor 16 and 18 are expressed in human cardiovasculartissues and induce on endothelial cells migration but not proliferation. Biochem.Biophys. Res. Commun. 346, 224–233. doi: 10.1016/j.bbrc.2006.05.105
Besnier, F., Wahlberg, P., Rönnegård, L., Weronica, E. K., Andersson, L., Siegel, P. B.,et al. (2011). Fine mapping and replication of QTL in outbred chicken advancedintercross lines. Genet. Sel. Evol. 43, 3. doi: 10.1186/1297-9686-43-3
Burkhart, C. A., Cherry J. A., Van Krey H. P., and Siegel, P. B. (1983). Geneticselection for growth rate alters hypothalamic satiety mechanisms in chickens.Behav. Genet. 13, 295–300. doi: 10.1007/BF01071874
Caldwell, R. B., Kierzek, A. M., Arakawa, H., Bezzubov, Y., Zaim, J., Fiedler, P., et al.(2005). Full-length cDNAs from chicken bursal lymphocytes to facilitate genefunction analysis. Genome Biol. 6, R6. doi: 10.1186/gb-2004-6-1-r6
Cipollo, J. F., Trimble, R. B., Chi, J. H., Yan, Q., and Dean, N. (2001).The yeast ALG11 gene specifies addition of the terminal alpha 1,2-Man tothe Man(5)GlcNAc(2)-PP-dolichol N-glycosylation intermediate formed on the
www.frontiersin.org November 2013 | Volume 4 | Article 226 | 7
“fgene-04-00226” — 2013/10/31 — 20:48 — page 8 — #8
Ahsan et al. Candidate gene identification in chicken
cytosolic side of the endoplasmic reticulum. J. Biol. Chem. 276, 21828–21840.doi: 10.1074/jbc.M010896200
Dunnington, E. A., and Siegel, P. B. (1996). Long-term divergent selection for eight-week body weight in White Plymouth Rock chickens. Poult. Sci. 75, 1168–1179.doi: 10.3382/ps.0751168
Dunnington, E. A., Honaker, C. F., McGilliard, M. L., and Siegel, P. B. (2013).Phenotypic responses of chickens to long-term, bidirectional selection for juve-nile body weight – historical perspective. Poult. Sci. 92, 1724–1734. doi:10.3382/ps.2013-03069
Flicek, P., Amode, M. R., Barrell, D., Beal, K., Brent, S., Carvalho-Silva, D., et al.(2012). Ensembl 2012. Nucleic Acids Res. 40, D84–D90. doi: 10.1093/nar/gkr991
Hoeflich, A., Wu, M., Mohan, S., Foll, J., Wanke, R., Froehlich, T., et al. (1999).Overexpression of insulin-like growth factor-binding protein-2 in transgenicmice reduces postnatal body weight gain. Endocrinology 140, 5488–5496. doi:10.1210/en.140.12.5488
Holt, L. J., and Siddle, K. (2005). Grb10 and Grb14: enigmatic regulators of insulinaction - and more? Biochem. J. 388, 393–406. doi: 10.1042/BJ20050216
Huang, D. W., Sherman, B. T., and Lempicki, R. A. (2009a). Bioinformatics enrich-ment tools: paths toward the comprehensive functional analysis of large gene lists.Nucleic Acids Res. 37, 1–13. doi: 10.1093/nar/gkn923
Huang, D. W., Sherman, B. T., and Lempicki, R. A. (2009b). Systematic and integra-tive analysis of large gene lists using DAVID bioinformatics resources. Nat. Protoc.4, 44–57. doi: 10.1038/nprot.2008.211
Jacobsson, L., Park, H. B., Wahlberg, P., Fredriksson, R., Perez-Enciso, M., Siegel,P. B., et al. (2005). Many QTLs with minor additive effects are associated with alarge difference in growth between two selection lines in chickens. Genet. Res. 86,115–125. doi: 10.1017/S0016672305007767
Johansson, A. M., Pettersson, M. E., Siegel, P. B., and Carlborg, Ö. (2010). Genome-Wide Effects of Long-Term Divergent Selection. PLoS Genet. 6:e1001188. doi:10.1371/journal.pgen.1001188
Ka, S., Lindberg, J., Strömstedt, L., Fitzsimmons, C., Lindqvist, N., Lun-deberg, J., et al. (2009). Extremely different behaviours in high and lowbody weight lines of chicken are associated with differential expression ofgenes involved in neuronal plasticity. J. Neuroendocrinol. 21, 208–216. doi:10.1111/j.1365-2826.2009.01819.x
Kasof, G. M., and Gomes, B. C. (2001). Livin, a novel inhibitor of apoptosis pro-tein family member. J. Biol. Chem. 276, 3238–3246. doi: 10.1074/jbc.M003670200
Kolle, G., Georgas, K., Holmes, G. P., Little, M. H., and Yamada, T. (2000). CRIM1, anovel gene encoding a cysteine-rich repeat protein, is developmentally regulatedand implicated in vertebrate CNS development and organogenesis. Mech. Dev.90, 181–193. doi: 10.1016/S0925-4773(99)00248-8
Kurihara, Y., Kurihara, H., Suzuki, H., Kodama, T., Maemura, K., Nagai, R., et al.(1994). Elevated blood pressure and craniofacial abnormalities in mice deficientin endothelin-1. Nature 368,703–710. doi: 10.1038/368703a0
Lee, W. P., Stromberg, M., Ward, A., Stewart, C., Garrison, E., and Marth,G. T. (2013). MOSAIK: a hash-based algorithm for accurate next-generationsequencing read mapping. arXiv preprint arXiv: 1309.1149.
Li, X., Kierczak, M., Shen, X., Ahsan, M., Carlborg, Ö., and Marklund, S. (2013).PASE: a novel method for functional prediction of amino acid substitutions basedon physicochemical properties. Front. Genet. 4:21. doi: 10.3389/fgene.2013.00021
Marklund, S., and Carlborg, Ö. (2010). SNP detection and prediction of variabilitybetween chicken lines using genome resequencing of DNA pools. BMC Genomics11, 655. doi: 10.1186/1471-2164-11-665
Marquez, G. C., Siegel, P. B., and Lewis, R. M. (2010). Genetic diversity and popu-lation structure in lines of chickens divergently selected for high and low 8-weekbody weight. Poult. Sci. 89, 2580–2588. doi: 10.3382/ps.2010-01034
Marth, G. T., Korf, I., Yandell, M. D., Yeh, R. T., Gu, Z. J., Zakeri, H., et al. (1999). Ageneral approach to single-nucleotide polymorphism discovery. Nat. Genet. 23,452–456. doi: 10.1038/70570
McLaren, W., Pritchard, B., Rios, D., Chen, Y. A., Flicek, P., and Cunning-ham, F. (2010). Deriving the consequences of genomic variants with theEnsembl API and SNP effect predictor. Bioinformatics 26, 2069–2070. doi:10.1093/bioinformatics/btq330
Patterson, C., Perrella, M. A., Hsieh, C. M., Yoshizumi, M., Lee, M. E., and Haber,E. (1995). Cloning and functional analysis of the promoter for KDR/flk-1, areceptor for vascular endothelial growth factor. J. Biol. Chem. 270, 23111–23118.doi: 10.1074/jbc.270.39.23111
Rönnegård, L., Besnier, F., and Carlborg, Ö. (2008). An improved method forquantitative trait loci detection and identification of within-line segregation inF-2 intercross designs. Genetics 178, 2315–2326. doi: 10.1534/genetics.107.083162
Rubin, C. J., Zody, M. C., Eriksson, J., Meadows, J. R. S., Sherwood, E., Webster, M.T., et al. (2010). Whole-genome resequencing reveals loci under selection duringchicken domestication. Nature 464, 587–591. doi: 10.1038/nature08832
Shabalina, S. A., Spiridonov, N. A., and Kashina, A. (2013). Sounds of silence:synonymous nucleotides as a key to biological regulation and complexity. NucleicAcids Res. 41, 2073–2094. doi: 10.1093/nar/gks1205
Suzuki, K., Simpson, K. A., Minnion, J. S., Shillito, J. C., and Bloom, S. R. (2010).The role of gut hormones and the hypothalamus in appetite regulation. Endocr.J. 57, 359–372. doi: 10.1507/endocrj.K10E-077
Wood, A. W., Duan, C., and Bern, H. A. (2005). Insulin-like growth factor signalingin fish. Int. Rev. Cytol. 243, 215–285. doi: 10.1016/S0074-7696(05)43004-1
Conflict of Interest Statement: The authors declare that the research was con-ducted in the absence of any commercial or financial relationships that could beconstrued as a potential conflict of interest.
Received: 17 July 2013; paper pending published: 15 August 2013; accepted: 17October 2013; published online: 05 November 2013.Citation: Ahsan M, Li X, Lundberg AE, Kierczak M, Siegel PB, Carlborg Ö andMarklund S (2013) Identification of candidate genes and mutations in QTL regionsfor chicken growth using bioinformatic analysis of NGS and SNP-chip data. Front.Genet. 4:226. doi: 10.3389/fgene.2013.00226This article was submitted to Bioinformatics and Computational Biology, a sectionof the journal Frontiers in Genetics.Copyright © 2013 Ahsan, Li, Lundberg, Kierczak, Siegel, Carlborg and Marklund.This is an open-access article distributed under the terms of the Creative CommonsAttribution License (CC BY). The use, distribution or reproduction in other forumsis permitted, provided the original author(s) or licensor are credited and that theoriginal publication in this journal is cited, in accordance with accepted academicpractice. No use, distribution or reproduction is permitted which does not complywith these terms.
Frontiers in Genetics | Bioinformatics and Computational Biology November 2013 | Volume 4 | Article 226 | 8