Embed Size (px)
Citation preview
“Identification of Appropriate Postharvest Technologies for Improving Market Access and Incomes for Small
Farmers in Sub-Saharan Africa and South Asia”
Sunil Saran
Amity International Centre for Post harvest Technology & Cold Chain Management
Commodity Systems Assessment
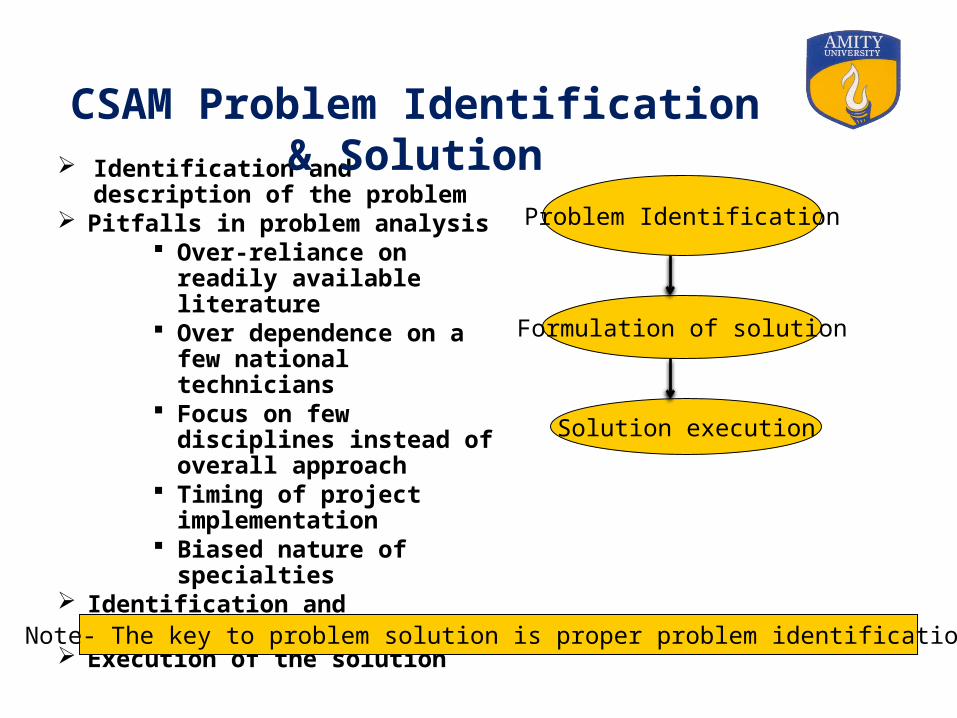
Identification and description of the problem
Pitfalls in problem analysis Over-reliance on readily
available literature Over dependence on a few
national technicians Focus on few disciplines instead
of overall approach Timing of project
implementation Biased nature of specialties
Identification and formulation of the solution
Execution of the solution
Problem Identification
Formulation of solution
Solution execution
CSAM Problem Identification & Solution
Note- The key to problem solution is proper problem identification
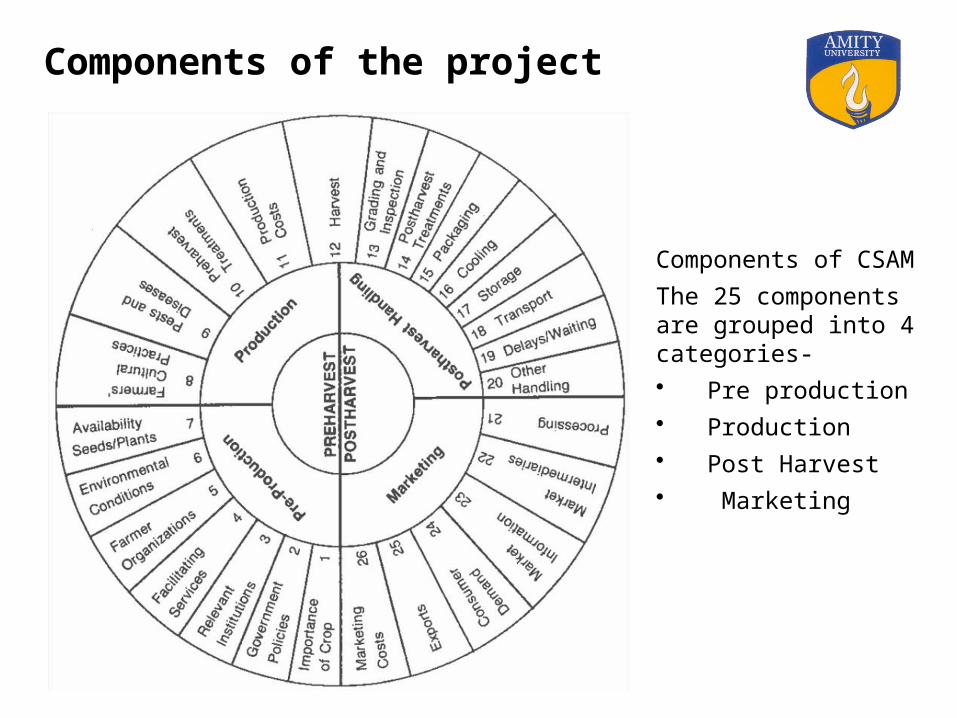
Components of CSAM
The 25 components are grouped into 4 categories-• Pre production• Production• Post Harvest • Marketing
Components of the project
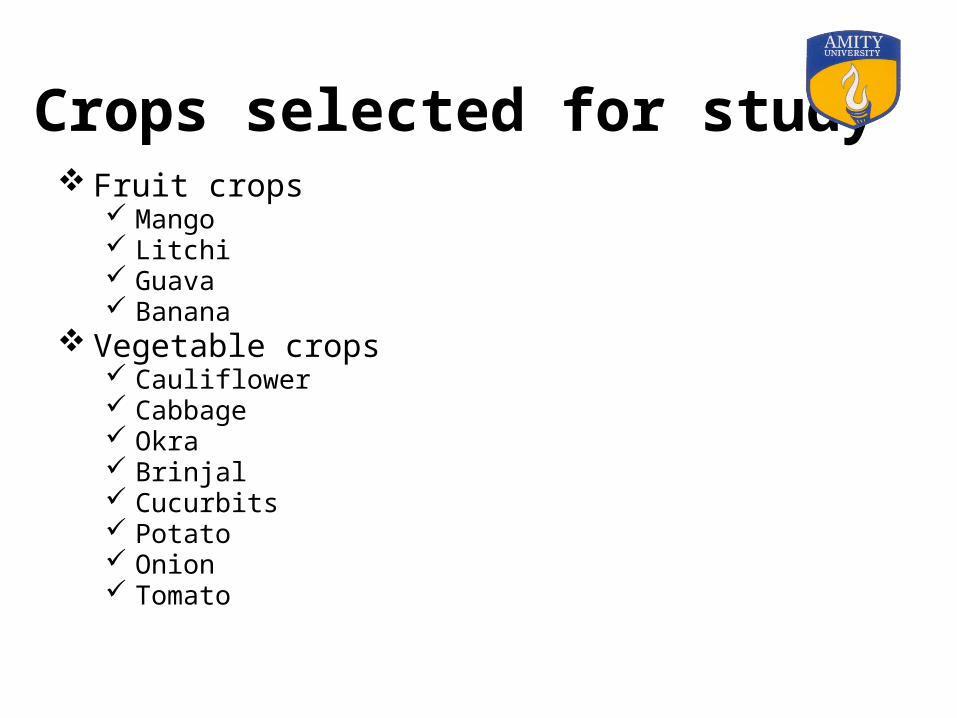
Crops selected for study Fruit crops
Mango Litchi Guava Banana
Vegetable crops Cauliflower Cabbage Okra Brinjal Cucurbits Potato Onion Tomato
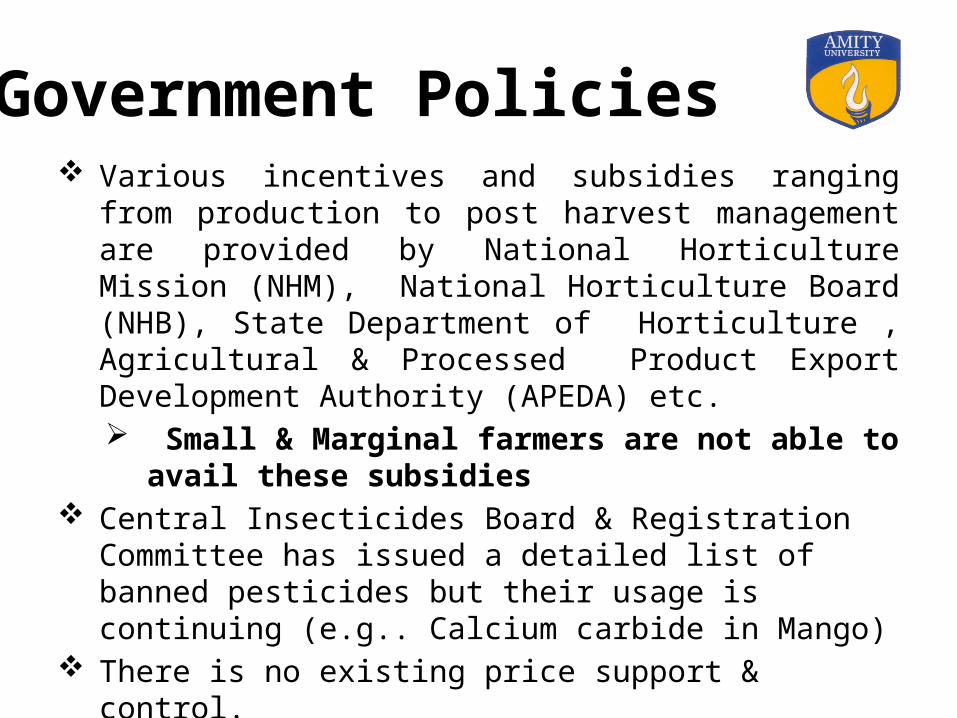
Government Policies Various incentives and subsidies ranging from production to
post harvest management are provided by National Horticulture Mission (NHM), National Horticulture Board (NHB), State Department of Horticulture , Agricultural & Processed Product Export Development Authority (APEDA) etc. Small & Marginal farmers are not able to avail these
subsidies Central Insecticides Board & Registration Committee has issued
a detailed list of banned pesticides but their usage is continuing (e.g.. Calcium carbide in Mango)
There is no existing price support & control.
Facilitating Services
Government Agencies through KVKs , Extension workers, Farmer visits, Farm demonstrations and Fairs provide information on modern technology but nearly 60 % of farmer households in India are not able to access any source of information on modern technology as depicted in the tables:
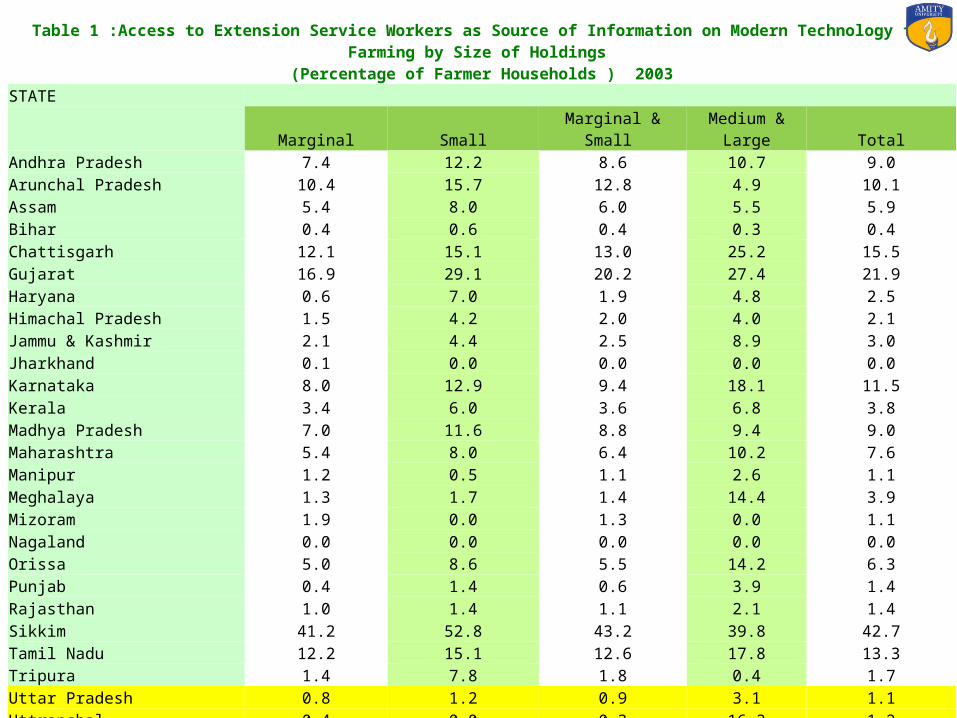
Table 1 :Access to Extension Service Workers as Source of Information on Modern Technology for Farming by Size of Holdings (Percentage of Farmer Households ) 2003
STATE Marginal Small Marginal & Small Medium & Large TotalAndhra Pradesh 7.4 12.2 8.6 10.7 9.0Arunchal Pradesh 10.4 15.7 12.8 4.9 10.1Assam 5.4 8.0 6.0 5.5 5.9Bihar 0.4 0.6 0.4 0.3 0.4Chattisgarh 12.1 15.1 13.0 25.2 15.5Gujarat 16.9 29.1 20.2 27.4 21.9Haryana 0.6 7.0 1.9 4.8 2.5Himachal Pradesh 1.5 4.2 2.0 4.0 2.1Jammu & Kashmir 2.1 4.4 2.5 8.9 3.0Jharkhand 0.1 0.0 0.0 0.0 0.0Karnataka 8.0 12.9 9.4 18.1 11.5Kerala 3.4 6.0 3.6 6.8 3.8Madhya Pradesh 7.0 11.6 8.8 9.4 9.0Maharashtra 5.4 8.0 6.4 10.2 7.6Manipur 1.2 0.5 1.1 2.6 1.1Meghalaya 1.3 1.7 1.4 14.4 3.9Mizoram 1.9 0.0 1.3 0.0 1.1Nagaland 0.0 0.0 0.0 0.0 0.0Orissa 5.0 8.6 5.5 14.2 6.3Punjab 0.4 1.4 0.6 3.9 1.4Rajasthan 1.0 1.4 1.1 2.1 1.4Sikkim 41.2 52.8 43.2 39.8 42.7Tamil Nadu 12.2 15.1 12.6 17.8 13.3Tripura 1.4 7.8 1.8 0.4 1.7Uttar Pradesh 0.8 1.2 0.9 3.1 1.1Uttranchal 0.4 0.0 0.3 16.3 1.2West Bengal 3.6 5.7 3.7 11.7 4.1All India 4.1 8.1 4.9 10.1 5.7Note : All India includes the small states Goa, Delhi, Pondicherry & Uts Source : Computed using NSS unit lelvel data 59th Round on Situatin Assessment Survey of Farmers
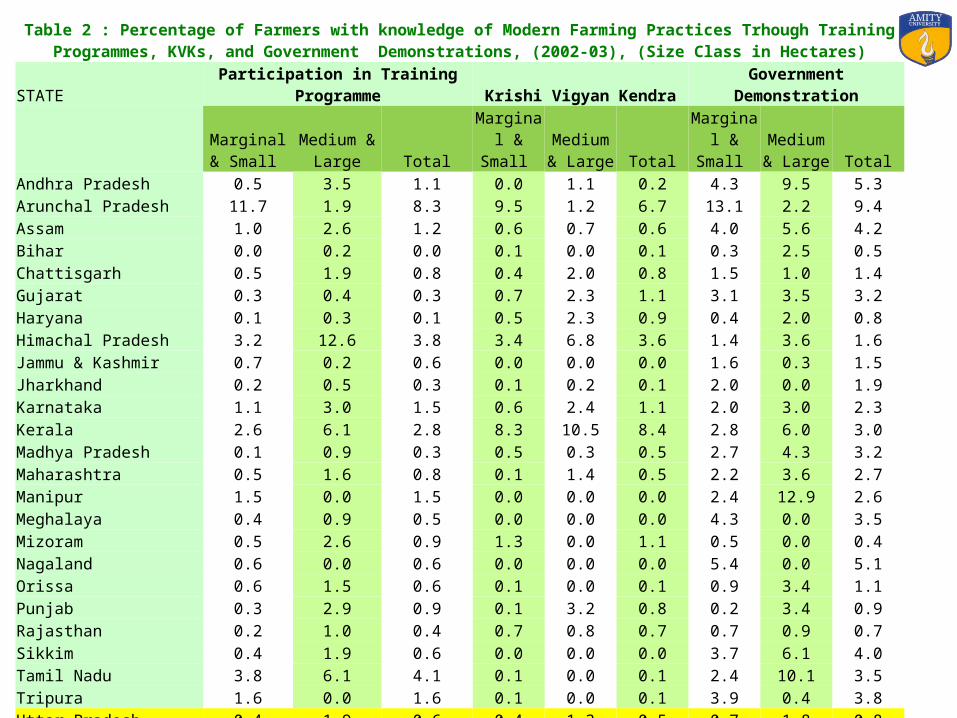
Table 2 : Percentage of Farmers with knowledge of Modern Farming Practices Trhough Training Programmes, KVKs, and Government Demonstrations, (2002-03), (Size Class in Hectares)
STATE Participation in Training Programme Krishi Vigyan Kendra Government Demonstration
Marginal &
Small Medium &
Large TotalMarginal & Small
Medium & Large Total
Marginal & Small
Medium & Large Total
Andhra Pradesh 0.5 3.5 1.1 0.0 1.1 0.2 4.3 9.5 5.3Arunchal Pradesh 11.7 1.9 8.3 9.5 1.2 6.7 13.1 2.2 9.4Assam 1.0 2.6 1.2 0.6 0.7 0.6 4.0 5.6 4.2Bihar 0.0 0.2 0.0 0.1 0.0 0.1 0.3 2.5 0.5Chattisgarh 0.5 1.9 0.8 0.4 2.0 0.8 1.5 1.0 1.4Gujarat 0.3 0.4 0.3 0.7 2.3 1.1 3.1 3.5 3.2Haryana 0.1 0.3 0.1 0.5 2.3 0.9 0.4 2.0 0.8Himachal Pradesh 3.2 12.6 3.8 3.4 6.8 3.6 1.4 3.6 1.6Jammu & Kashmir 0.7 0.2 0.6 0.0 0.0 0.0 1.6 0.3 1.5Jharkhand 0.2 0.5 0.3 0.1 0.2 0.1 2.0 0.0 1.9Karnataka 1.1 3.0 1.5 0.6 2.4 1.1 2.0 3.0 2.3Kerala 2.6 6.1 2.8 8.3 10.5 8.4 2.8 6.0 3.0Madhya Pradesh 0.1 0.9 0.3 0.5 0.3 0.5 2.7 4.3 3.2Maharashtra 0.5 1.6 0.8 0.1 1.4 0.5 2.2 3.6 2.7Manipur 1.5 0.0 1.5 0.0 0.0 0.0 2.4 12.9 2.6Meghalaya 0.4 0.9 0.5 0.0 0.0 0.0 4.3 0.0 3.5Mizoram 0.5 2.6 0.9 1.3 0.0 1.1 0.5 0.0 0.4Nagaland 0.6 0.0 0.6 0.0 0.0 0.0 5.4 0.0 5.1Orissa 0.6 1.5 0.6 0.1 0.0 0.1 0.9 3.4 1.1Punjab 0.3 2.9 0.9 0.1 3.2 0.8 0.2 3.4 0.9Rajasthan 0.2 1.0 0.4 0.7 0.8 0.7 0.7 0.9 0.7Sikkim 0.4 1.9 0.6 0.0 0.0 0.0 3.7 6.1 4.0Tamil Nadu 3.8 6.1 4.1 0.1 0.0 0.1 2.4 10.1 3.5Tripura 1.6 0.0 1.6 0.1 0.0 0.1 3.9 0.4 3.8Uttar Pradesh 0.4 1.9 0.6 0.4 1.3 0.5 0.7 1.8 0.8Uttranchal 1.5 18.1 2.4 0.0 0.0 0.0 0.5 16.3 1.3West Bengal 1.0 2.0 1.0 0.3 0.1 0.3 1.9 0.8 1.9All India 35.3 74.6 37.6 27.9 36.6 28.3 68.9 103.2 70.6

Table 3 :Access to any Government agency as a source of Information on Modern Technology by Size of Holdings (Percentage of Farmer Households ) 2003
STATE Marginal Small Marginal & Small Medium & Large TotalAndhra Pradesh 10.7 10.9 10.8 14.0 11.4Arunchal Pradesh 14.0 16.3 15.0 4.0 11.3Assam 4.3 6.0 4.7 9.6 5.3Bihar 1.2 2.6 1.4 4.1 1.5Chattisgarh 4.9 8.1 5.9 9.7 6.7Gujarat 12.3 15.8 13.2 17.1 14.2Haryana 5.5 7.9 6.0 15.1 8.0Himachal Pradesh 10.9 29.1 13.9 29.2 14.8Jammu & Kashmir 2.5 0.9 2.3 1.6 2.2Jharkhand 2.6 4.8 2.9 2.4 2.9Karnataka 11.6 13.2 12.1 16.1 13.1Kerala 16.6 32.7 17.9 27.2 18.3Madhya Pradesh 7.6 10.1 8.6 16.3 11.1Maharashtra 6.0 7.4 6.5 14.4 9.0Manipur 3.7 5.3 3.9 12.9 4.1Meghalaya 4.4 9.7 5.6 3.5 5.2Mizoram 2.8 1.1 2.3 2.6 2.3Nagaland 5.1 6.2 5.4 0.0 5.1Orissa 3.9 3.1 3.8 6.2 4.0Punjab 4.6 11.2 5.9 17.0 8.4Rajasthan 2.4 5.6 3.3 4.5 3.7Sikkim 5.4 12.7 6.6 8.0 6.8Tamil Nadu 11.4 15.3 12.0 26.8 14.0Tripura 7.1 19.0 7.6 2.5 7.5Uttar Pradesh 2.5 7.5 3.3 8.1 3.8Uttranchal 0.9 9.3 1.5 19.6 2.5West Bengal 4.4 6.5 4.6 8.0 4.7All India 5.4 8.9 6.1 12.5 7.2Note : All India includes the small states Goa, Delhi, Pondicherry & Uts Source : Computed using NSS unit lelvel data 59th Round on Situatin Assessment Survey of Farmers
Availability of Planting Material
Although good quality seeds are available from various sources, their use is limited.
If improved seeds/planting material are provided to all the farmers it would greatly augment production.
The table shows the percentage of farmer households using improved seeds
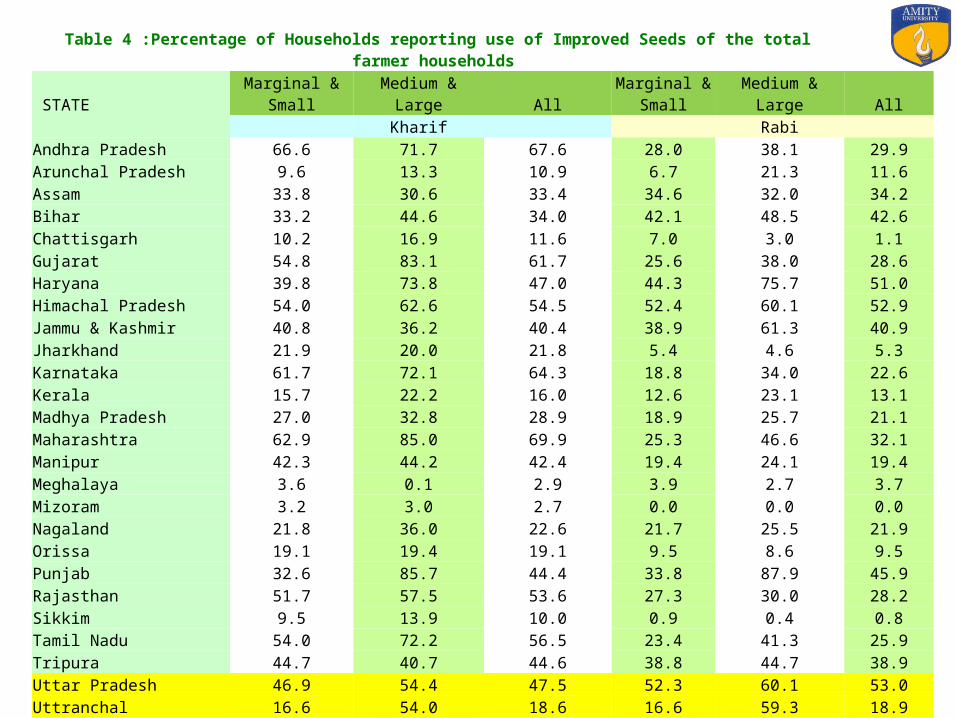
Table 4 :Percentage of Households reporting use of Improved Seeds of the total farmer households
STATE Marginal & Small Medium & Large AllMarginal &
Small Medium & Large AllKharif Rabi
Andhra Pradesh 66.6 71.7 67.6 28.0 38.1 29.9Arunchal Pradesh 9.6 13.3 10.9 6.7 21.3 11.6Assam 33.8 30.6 33.4 34.6 32.0 34.2Bihar 33.2 44.6 34.0 42.1 48.5 42.6Chattisgarh 10.2 16.9 11.6 7.0 3.0 1.1Gujarat 54.8 83.1 61.7 25.6 38.0 28.6Haryana 39.8 73.8 47.0 44.3 75.7 51.0Himachal Pradesh 54.0 62.6 54.5 52.4 60.1 52.9Jammu & Kashmir 40.8 36.2 40.4 38.9 61.3 40.9Jharkhand 21.9 20.0 21.8 5.4 4.6 5.3Karnataka 61.7 72.1 64.3 18.8 34.0 22.6Kerala 15.7 22.2 16.0 12.6 23.1 13.1Madhya Pradesh 27.0 32.8 28.9 18.9 25.7 21.1Maharashtra 62.9 85.0 69.9 25.3 46.6 32.1Manipur 42.3 44.2 42.4 19.4 24.1 19.4Meghalaya 3.6 0.1 2.9 3.9 2.7 3.7Mizoram 3.2 3.0 2.7 0.0 0.0 0.0Nagaland 21.8 36.0 22.6 21.7 25.5 21.9Orissa 19.1 19.4 19.1 9.5 8.6 9.5Punjab 32.6 85.7 44.4 33.8 87.9 45.9Rajasthan 51.7 57.5 53.6 27.3 30.0 28.2Sikkim 9.5 13.9 10.0 0.9 0.4 0.8Tamil Nadu 54.0 72.2 56.5 23.4 41.3 25.9Tripura 44.7 40.7 44.6 38.8 44.7 38.9Uttar Pradesh 46.9 54.4 47.5 52.3 60.1 53.0Uttranchal 16.6 54.0 18.6 16.6 59.3 18.9West Bengal 62.5 69.5 62.8 58.2 61.5 58.3All India 43.9 58.7 46.3 33.4 39.4 34.3Note : All India includes the small states Goa, Delhi, Pondicherry & UTs
Source : Computed using NSS unit level data 59th Round on Situation Assessment Survey of Farmers
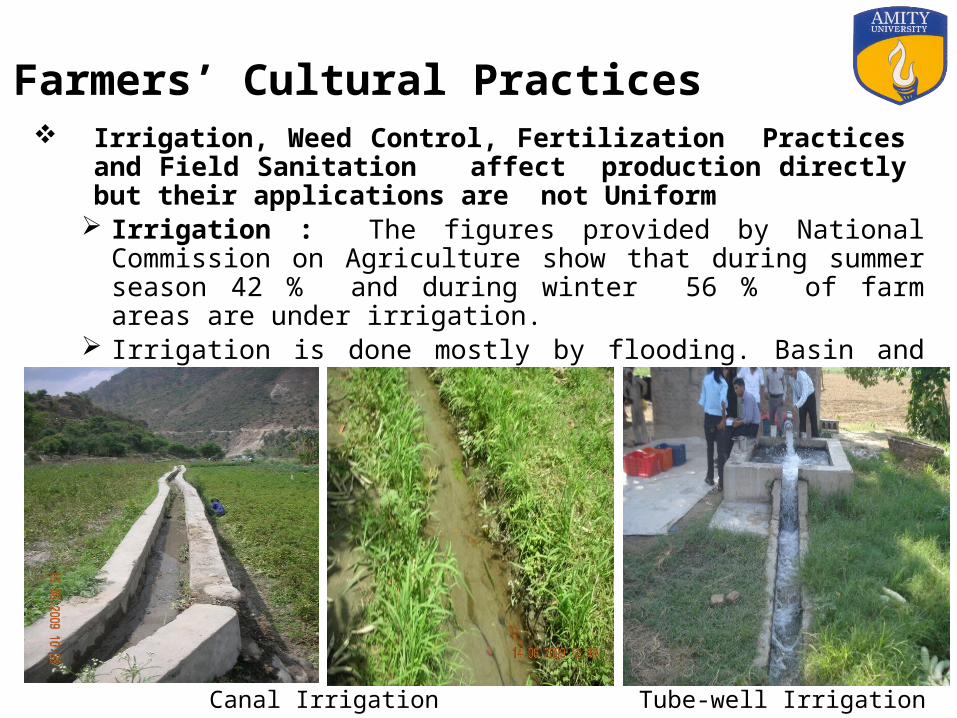
Irrigation, Weed Control, Fertilization Practices and Field Sanitation affect production directly but their applications are not Uniform
Irrigation : The figures provided by National Commission on Agriculture show that during summer season 42 % and during winter 56 % of farm areas are under irrigation.
Irrigation is done mostly by flooding. Basin and drip methods are uncommon.
Farmers’ Cultural Practices
Canal Irrigation Tube-well Irrigation
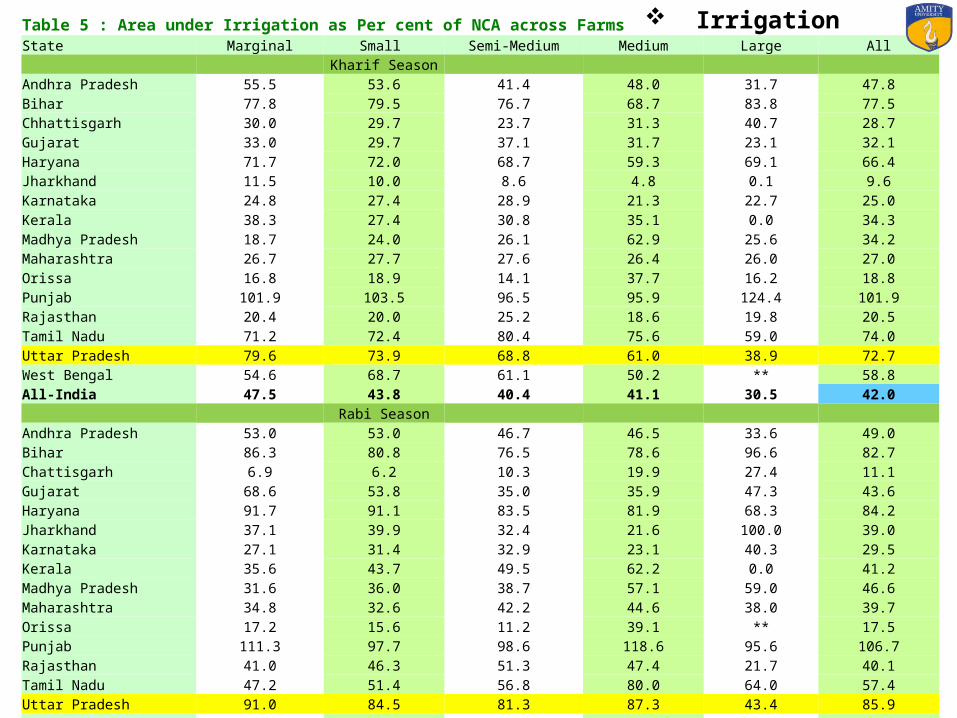
Table 5 : Area under Irrigation as Per cent of NCA across FarmsState Marginal Small Semi-Medium Medium Large All Kharif Season Andhra Pradesh 55.5 53.6 41.4 48.0 31.7 47.8Bihar 77.8 79.5 76.7 68.7 83.8 77.5Chhattisgarh 30.0 29.7 23.7 31.3 40.7 28.7Gujarat 33.0 29.7 37.1 31.7 23.1 32.1Haryana 71.7 72.0 68.7 59.3 69.1 66.4Jharkhand 11.5 10.0 8.6 4.8 0.1 9.6Karnataka 24.8 27.4 28.9 21.3 22.7 25.0Kerala 38.3 27.4 30.8 35.1 0.0 34.3Madhya Pradesh 18.7 24.0 26.1 62.9 25.6 34.2Maharashtra 26.7 27.7 27.6 26.4 26.0 27.0Orissa 16.8 18.9 14.1 37.7 16.2 18.8Punjab 101.9 103.5 96.5 95.9 124.4 101.9Rajasthan 20.4 20.0 25.2 18.6 19.8 20.5Tamil Nadu 71.2 72.4 80.4 75.6 59.0 74.0Uttar Pradesh 79.6 73.9 68.8 61.0 38.9 72.7West Bengal 54.6 68.7 61.1 50.2 ** 58.8All-India 47.5 43.8 40.4 41.1 30.5 42.0 Rabi Season Andhra Pradesh 53.0 53.0 46.7 46.5 33.6 49.0Bihar 86.3 80.8 76.5 78.6 96.6 82.7Chattisgarh 6.9 6.2 10.3 19.9 27.4 11.1Gujarat 68.6 53.8 35.0 35.9 47.3 43.6Haryana 91.7 91.1 83.5 81.9 68.3 84.2Jharkhand 37.1 39.9 32.4 21.6 100.0 39.0Karnataka 27.1 31.4 32.9 23.1 40.3 29.5Kerala 35.6 43.7 49.5 62.2 0.0 41.2Madhya Pradesh 31.6 36.0 38.7 57.1 59.0 46.6Maharashtra 34.8 32.6 42.2 44.6 38.0 39.7Orissa 17.2 15.6 11.2 39.1 ** 17.5Punjab 111.3 97.7 98.6 118.6 95.6 106.7Rajasthan 41.0 46.3 51.3 47.4 21.7 40.1Tamil Nadu 47.2 51.4 56.8 80.0 64.0 57.4Uttar Pradesh 91.0 84.5 81.3 87.3 43.4 85.9West Bengal 78.0 72.5 66.0 86.8 ** 75.5All India 61.4 55.5 52.9 57.3 47.6 56.1Note : All India includes the small states Goa, Delhi, Pondicherry & UTs
Source : Computed using NSS unit level data 59th Round on Situation Assessement Survey of Farmers 2003
Irrigation
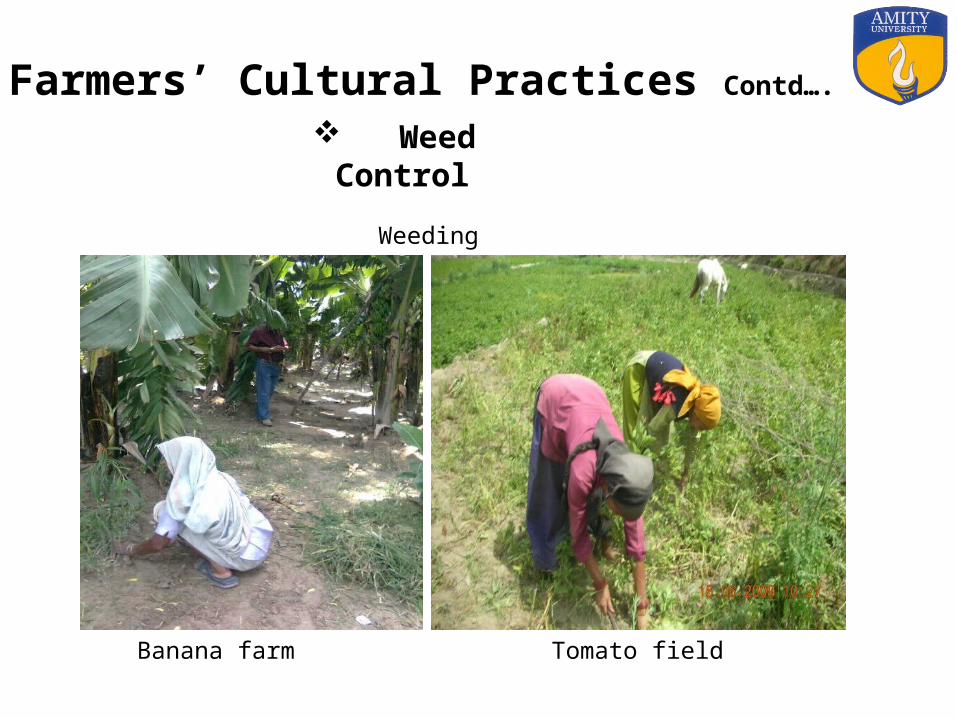
Weed Control
Farmers’ Cultural Practices Contd….
Banana farm Tomato field
Weeding
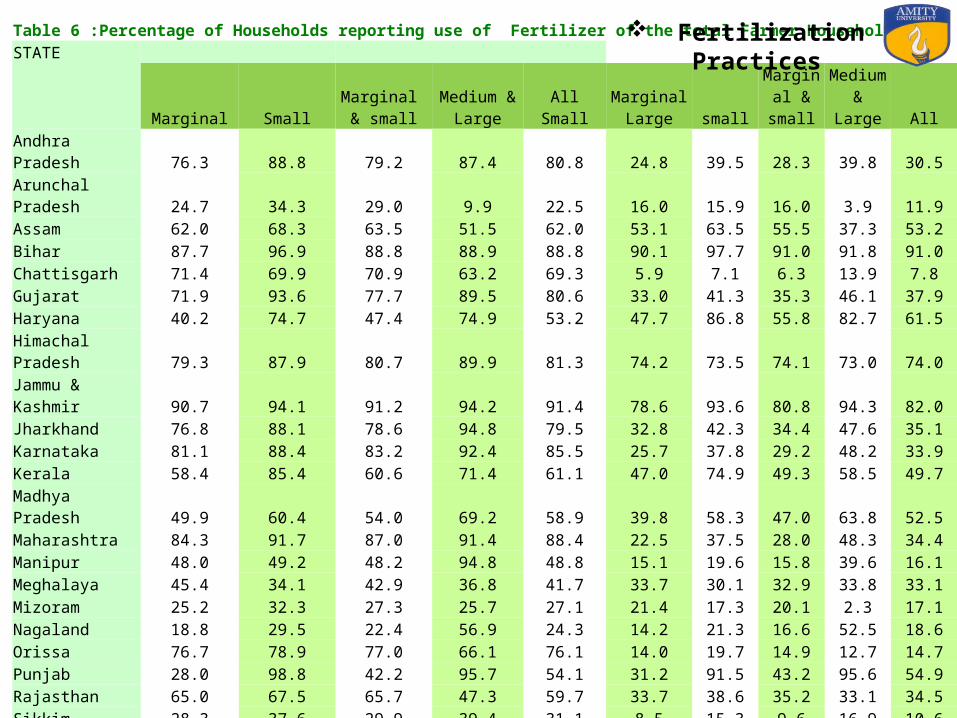
Table 6 :Percentage of Households reporting use of Fertilizer of the total Farmer HouseholdsSTATE
Marginal SmallMarginal &
smallMedium &
Large All SmallMarginal
Large smallMarginal & small
Medium & Large All
Andhra Pradesh 76.3 88.8 79.2 87.4 80.8 24.8 39.5 28.3 39.8 30.5Arunchal Pradesh 24.7 34.3 29.0 9.9 22.5 16.0 15.9 16.0 3.9 11.9Assam 62.0 68.3 63.5 51.5 62.0 53.1 63.5 55.5 37.3 53.2Bihar 87.7 96.9 88.8 88.9 88.8 90.1 97.7 91.0 91.8 91.0Chattisgarh 71.4 69.9 70.9 63.2 69.3 5.9 7.1 6.3 13.9 7.8Gujarat 71.9 93.6 77.7 89.5 80.6 33.0 41.3 35.3 46.1 37.9Haryana 40.2 74.7 47.4 74.9 53.2 47.7 86.8 55.8 82.7 61.5Himachal Pradesh 79.3 87.9 80.7 89.9 81.3 74.2 73.5 74.1 73.0 74.0Jammu & Kashmir 90.7 94.1 91.2 94.2 91.4 78.6 93.6 80.8 94.3 82.0Jharkhand 76.8 88.1 78.6 94.8 79.5 32.8 42.3 34.4 47.6 35.1Karnataka 81.1 88.4 83.2 92.4 85.5 25.7 37.8 29.2 48.2 33.9Kerala 58.4 85.4 60.6 71.4 61.1 47.0 74.9 49.3 58.5 49.7Madhya Pradesh 49.9 60.4 54.0 69.2 58.9 39.8 58.3 47.0 63.8 52.5Maharashtra 84.3 91.7 87.0 91.4 88.4 22.5 37.5 28.0 48.3 34.4Manipur 48.0 49.2 48.2 94.8 48.8 15.1 19.6 15.8 39.6 16.1Meghalaya 45.4 34.1 42.9 36.8 41.7 33.7 30.1 32.9 33.8 33.1Mizoram 25.2 32.3 27.3 25.7 27.1 21.4 17.3 20.1 2.3 17.1Nagaland 18.8 29.5 22.4 56.9 24.3 14.2 21.3 16.6 52.5 18.6Orissa 76.7 78.9 77.0 66.1 76.1 14.0 19.7 14.9 12.7 14.7Punjab 28.0 98.8 42.2 95.7 54.1 31.2 91.5 43.2 95.6 54.9Rajasthan 65.0 67.5 65.7 47.3 59.7 33.7 38.6 35.2 33.1 34.5Sikkim 28.3 37.6 29.9 39.4 31.1 8.5 15.3 9.6 16.9 10.6Tamil Nadu 67.8 82.5 70.1 82.0 71.7 26.5 37.2 28.2 42.5 30.1Tripura 79.3 97.3 80.2 55.4 79.7 58.2 59.2 58.2 72.9 58.5Uttar Pradesh 76.6 84.0 77.8 80.4 78.0 85.9 94.1 87.2 95.5 88.0Uttranchal 50.4 67.0 51.5 88.5 53.5 49.1 63.7 50.2 73.7 51.4West Bengal 88.0 96.7 88.8 91.3 88.9 69.9 85.4 71.3 78.9 71.6All India 73.9 81.7 75.4 77.4 75.7 53.4 56.8 54.1 54.9 54.2Note : All India includes the small states Goa, Delhi, Pondicherry & UTSSource : Computed using NSS unit level data 59th Round on Situation Assessment Survey of Farmers
Fertilization Practices
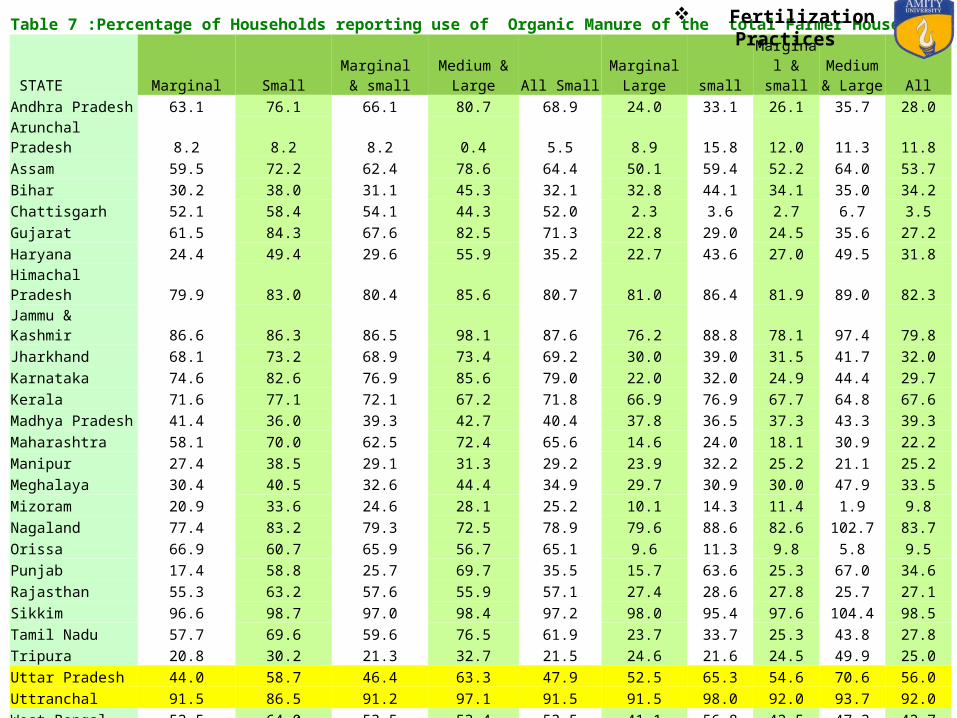
Table 7 :Percentage of Households reporting use of Organic Manure of the total Farmer Households
STATE Marginal SmallMarginal &
smallMedium &
Large All SmallMarginal
Large smallMarginal & small
Medium & Large All
Andhra Pradesh 63.1 76.1 66.1 80.7 68.9 24.0 33.1 26.1 35.7 28.0Arunchal Pradesh 8.2 8.2 8.2 0.4 5.5 8.9 15.8 12.0 11.3 11.8Assam 59.5 72.2 62.4 78.6 64.4 50.1 59.4 52.2 64.0 53.7Bihar 30.2 38.0 31.1 45.3 32.1 32.8 44.1 34.1 35.0 34.2Chattisgarh 52.1 58.4 54.1 44.3 52.0 2.3 3.6 2.7 6.7 3.5Gujarat 61.5 84.3 67.6 82.5 71.3 22.8 29.0 24.5 35.6 27.2Haryana 24.4 49.4 29.6 55.9 35.2 22.7 43.6 27.0 49.5 31.8Himachal Pradesh 79.9 83.0 80.4 85.6 80.7 81.0 86.4 81.9 89.0 82.3Jammu & Kashmir 86.6 86.3 86.5 98.1 87.6 76.2 88.8 78.1 97.4 79.8Jharkhand 68.1 73.2 68.9 73.4 69.2 30.0 39.0 31.5 41.7 32.0Karnataka 74.6 82.6 76.9 85.6 79.0 22.0 32.0 24.9 44.4 29.7Kerala 71.6 77.1 72.1 67.2 71.8 66.9 76.9 67.7 64.8 67.6Madhya Pradesh 41.4 36.0 39.3 42.7 40.4 37.8 36.5 37.3 43.3 39.3Maharashtra 58.1 70.0 62.5 72.4 65.6 14.6 24.0 18.1 30.9 22.2Manipur 27.4 38.5 29.1 31.3 29.2 23.9 32.2 25.2 21.1 25.2Meghalaya 30.4 40.5 32.6 44.4 34.9 29.7 30.9 30.0 47.9 33.5Mizoram 20.9 33.6 24.6 28.1 25.2 10.1 14.3 11.4 1.9 9.8Nagaland 77.4 83.2 79.3 72.5 78.9 79.6 88.6 82.6 102.7 83.7Orissa 66.9 60.7 65.9 56.7 65.1 9.6 11.3 9.8 5.8 9.5Punjab 17.4 58.8 25.7 69.7 35.5 15.7 63.6 25.3 67.0 34.6Rajasthan 55.3 63.2 57.6 55.9 57.1 27.4 28.6 27.8 25.7 27.1Sikkim 96.6 98.7 97.0 98.4 97.2 98.0 95.4 97.6 104.4 98.5Tamil Nadu 57.7 69.6 59.6 76.5 61.9 23.7 33.7 25.3 43.8 27.8Tripura 20.8 30.2 21.3 32.7 21.5 24.6 21.6 24.5 49.9 25.0Uttar Pradesh 44.0 58.7 46.4 63.3 47.9 52.5 65.3 54.6 70.6 56.0Uttranchal 91.5 86.5 91.2 97.1 91.5 91.5 98.0 92.0 93.7 92.0West Bengal 52.5 64.0 53.5 53.4 53.5 41.1 56.8 42.5 47.3 42.7All India 52.3 62.6 54.4 64.3 56.0 36.1 40.2 36.9 40.7 37.5Note : All India includes the small states Goa, Delhi, Pondicherry & UTSSource : Computed using NSS unit lelvel data 59th Round on Situation Assessment Survey of Farmers
Fertilization Practices
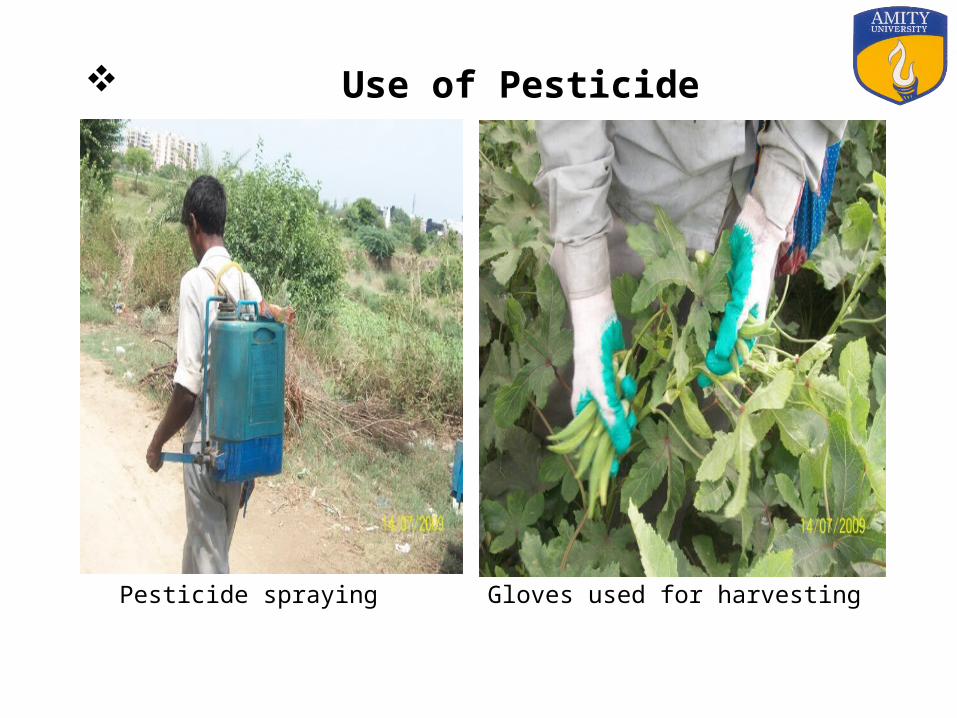
Use of Pesticide
Pesticide spraying Gloves used for harvesting
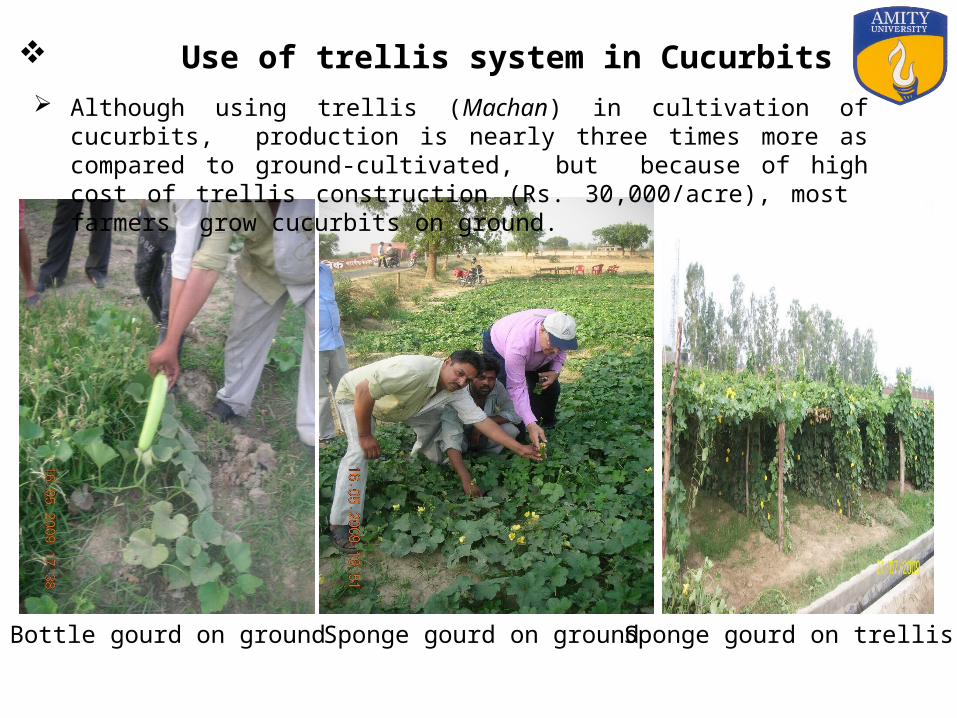
Use of trellis system in Cucurbits Although using trellis (Machan) in cultivation of cucurbits, production is nearly
three times more as compared to ground-cultivated, but because of high cost of trellis construction (Rs. 30,000/acre), most farmers grow cucurbits on ground.
Bottle gourd on ground Sponge gourd on ground Sponge gourd on trellis
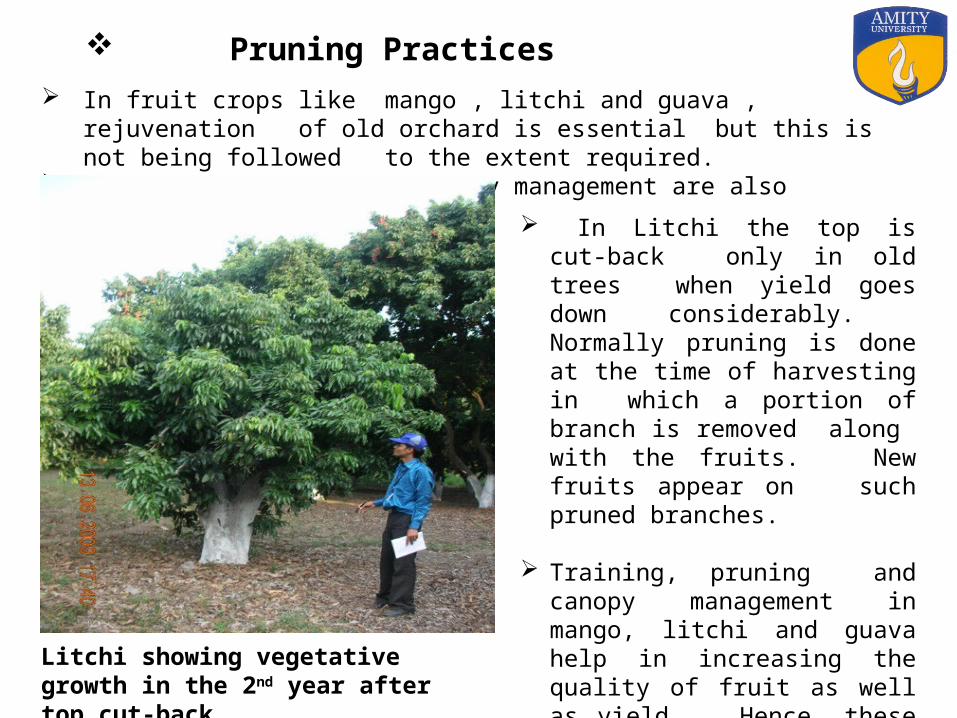
Pruning Practices In fruit crops like mango , litchi and guava , rejuvenation of old orchard is
essential but this is not being followed to the extent required. Pruning , thinning and canopy management are also neglected
In Litchi the top is cut-back only in old trees when yield goes down considerably. Normally pruning is done at the time of harvesting in which a portion of branch is removed along with the fruits. New fruits appear on such pruned branches.
Training, pruning and canopy management in mango, litchi and guava help in increasing the quality of fruit as well as yield . Hence, these are essentially required in orchard management.
Litchi showing vegetative growth in the 2nd year after top cut-back
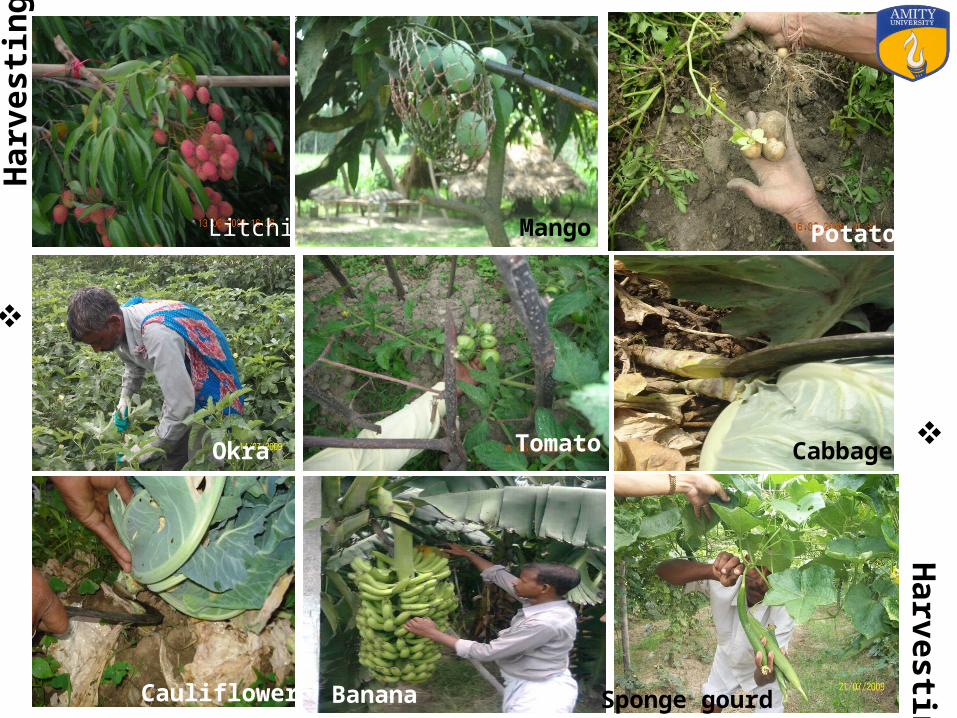
H
arvesting
Har
vesti
ng
Litchi Mango Potato
Okra Tomato Cabbage
Cauliflower Banana Sponge gourd

So
rting
and
Gra
ding
Sorting and Grading
Peas
GuavaOkraBrinjal
MangoPotatoTomato
LitchiOnion
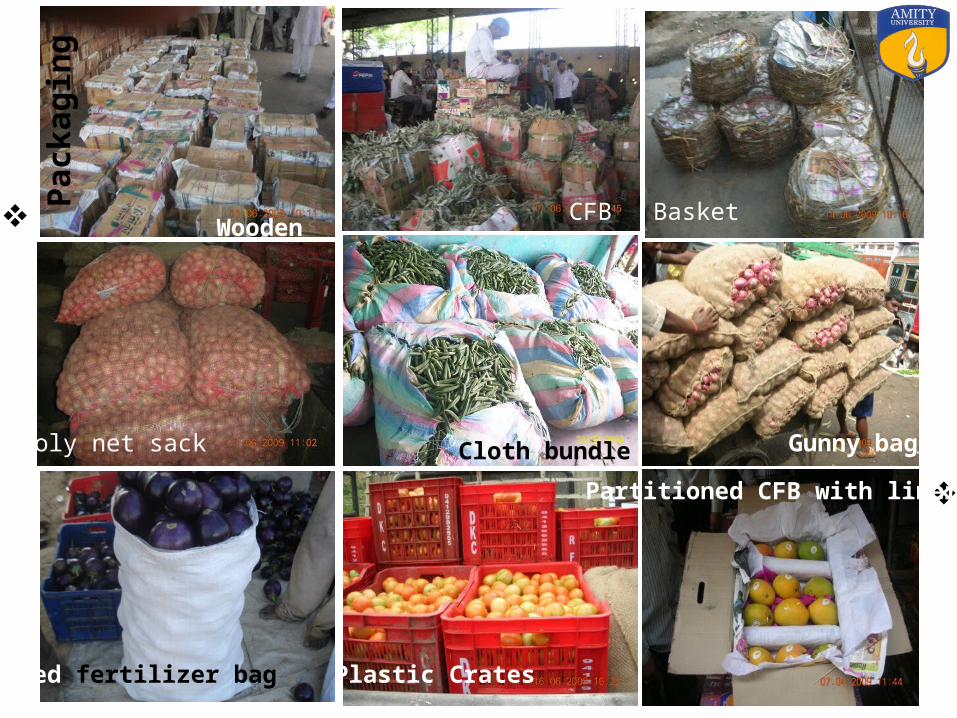
Packaging
Pa
ckag
ing
WoodenCFB Basket
Cloth bundle Gunny bag
Used fertilizer bag Plastic Crates
Partitioned CFB with liner
Poly net sack
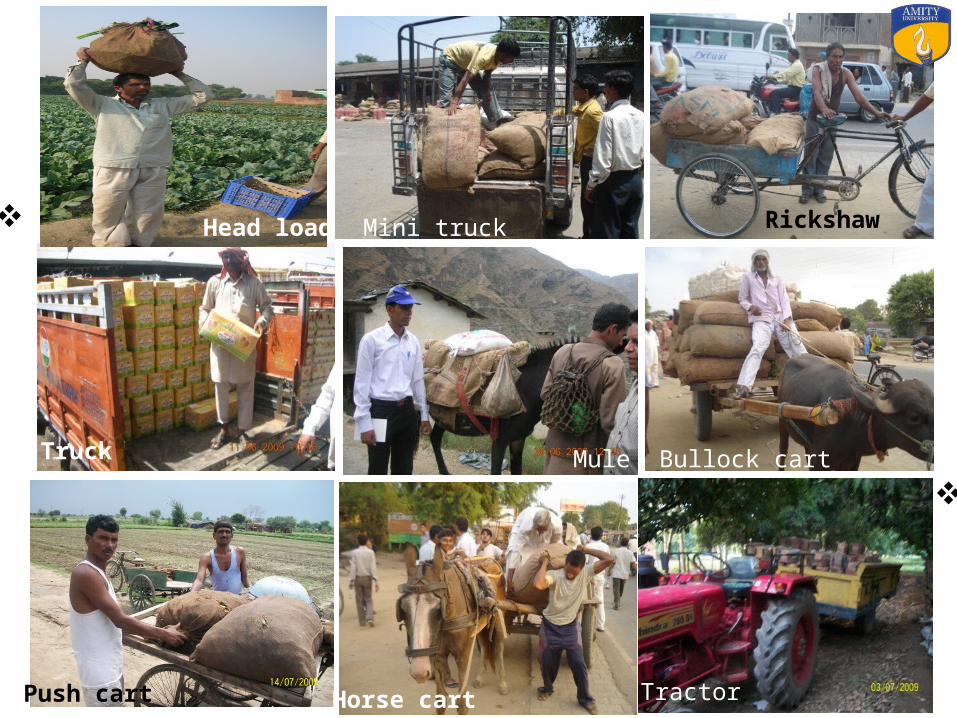
Transport
Tr
ansp
ort
Head load Mini truck Rickshaw
Truck Mule Bullock cart
Push cart Horse cart Tractor
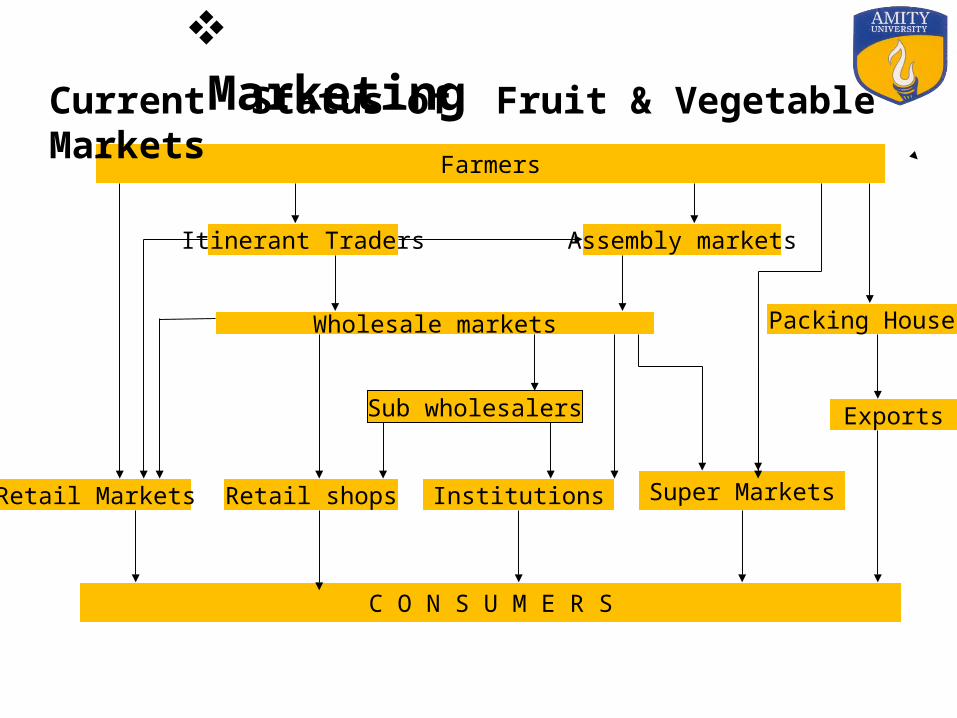
Packing House
Exports
Retail Markets
Farmers
Itinerant Traders Assembly markets
Wholesale markets
Sub wholesalers
Retail shops Institutions Super Markets
C O N S U M E R S
Current Status of Fruit & Vegetable Markets
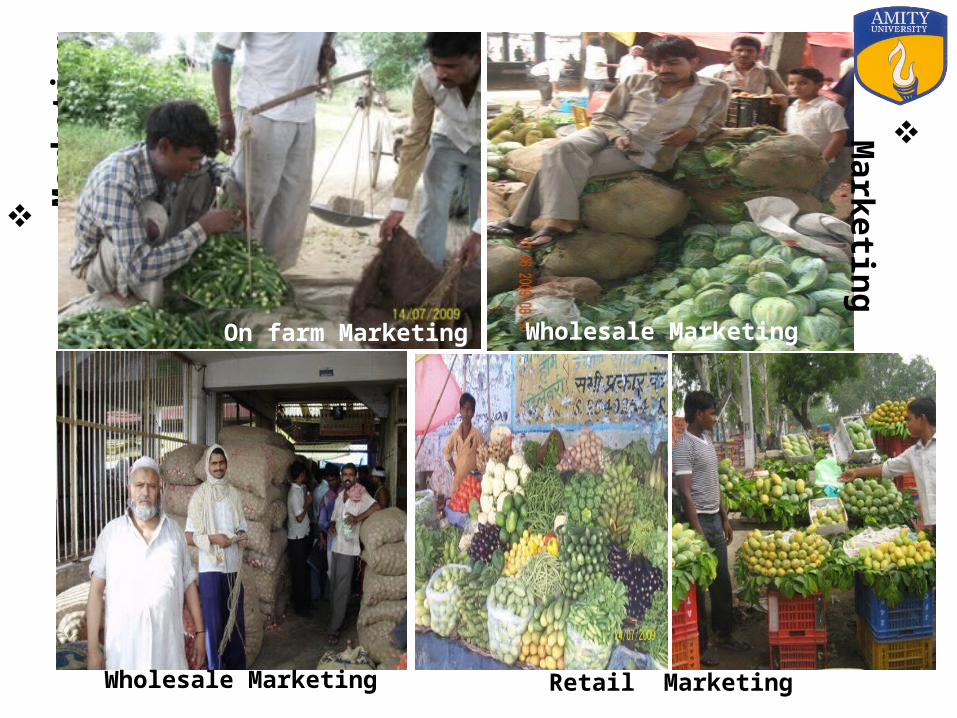
Marketing
M
arke
ting
M
arketing
On farm Marketing Wholesale Marketing
Wholesale Marketing Retail Marketing
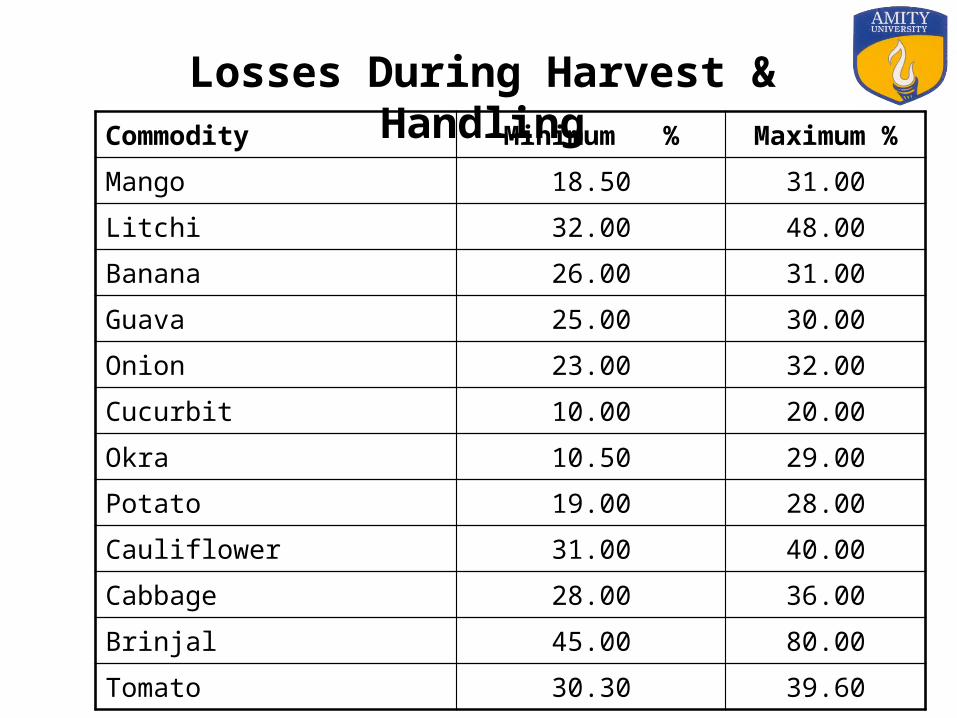
Commodity Minimum % Maximum %
Mango 18.50 31.00
Litchi 32.00 48.00
Banana 26.00 31.00
Guava 25.00 30.00
Onion 23.00 32.00
Cucurbit 10.00 20.00
Okra 10.50 29.00
Potato 19.00 28.00
Cauliflower 31.00 40.00
Cabbage 28.00 36.00
Brinjal 45.00 80.00
Tomato 30.30 39.60
Losses During Harvest & Handling
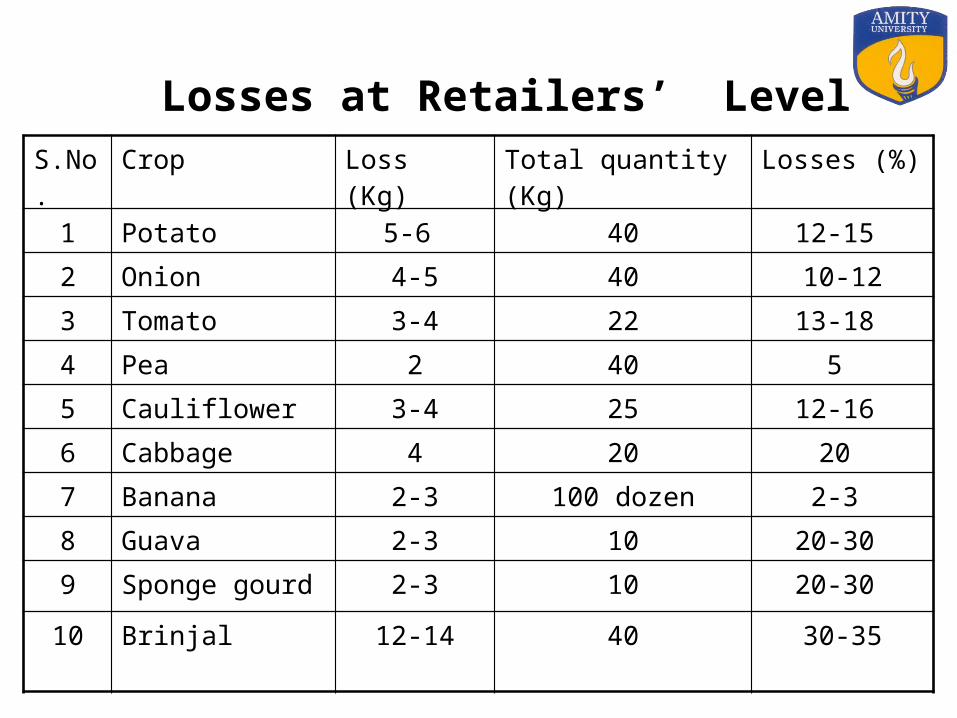
Losses at Retailers’ LevelS.No. Crop Loss (Kg) Total quantity (Kg) Losses (%)
1 Potato 5-6 40 12-15
2 Onion 4-5 40 10-12
3 Tomato 3-4 22 13-18
4 Pea 2 40 5
5 Cauliflower 3-4 25 12-16
6 Cabbage 4 20 20
7 Banana 2-3 100 dozen 2-3
8 Guava 2-3 10 20-30
9 Sponge gourd 2-3 10 20-30
10 Brinjal 12-14 40 30-35
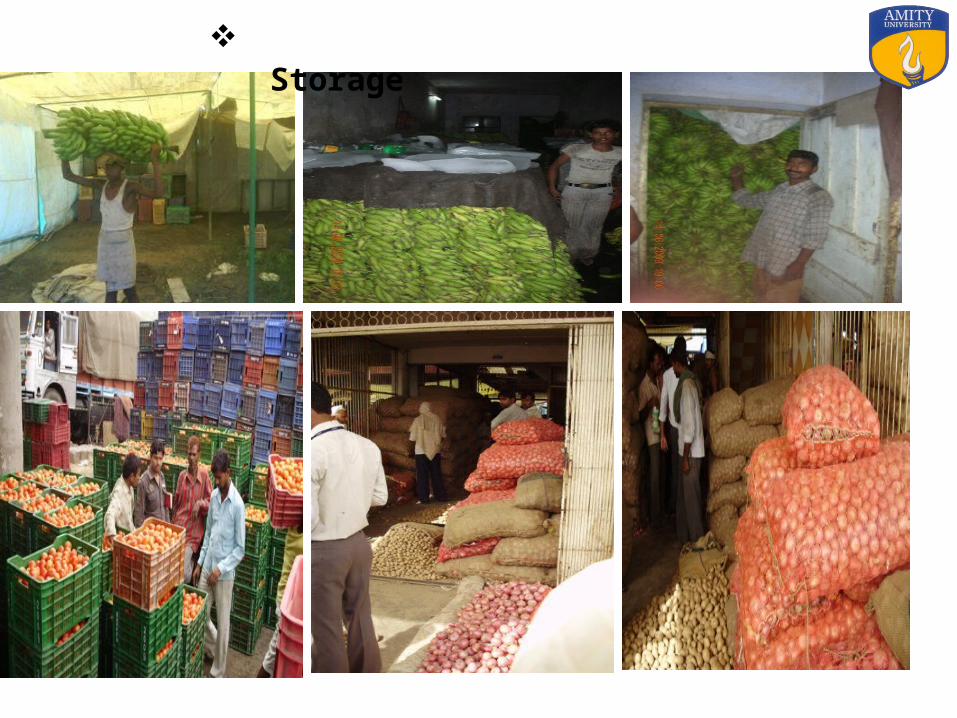
Stored banana kept cool by ice slabs
Storage
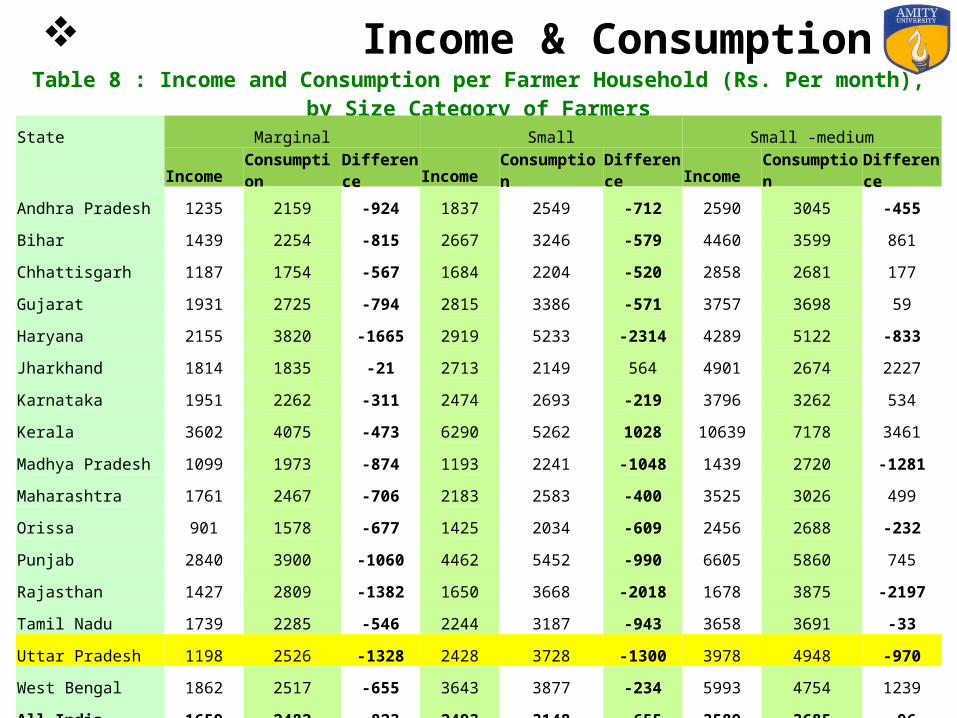
Income & ConsumptionTable 8 : Income and Consumption per Farmer Household (Rs. Per month), by Size Category of Farmers
State Marginal Small Small -medium Income Consumption Difference Income Consumption Difference Income Consumption Difference
Andhra Pradesh 1235 2159 -924 1837 2549 -712 2590 3045 -455
Bihar 1439 2254 -815 2667 3246 -579 4460 3599 861
Chhattisgarh 1187 1754 -567 1684 2204 -520 2858 2681 177
Gujarat 1931 2725 -794 2815 3386 -571 3757 3698 59
Haryana 2155 3820 -1665 2919 5233 -2314 4289 5122 -833
Jharkhand 1814 1835 -21 2713 2149 564 4901 2674 2227
Karnataka 1951 2262 -311 2474 2693 -219 3796 3262 534
Kerala 3602 4075 -473 6290 5262 1028 10639 7178 3461
Madhya Pradesh 1099 1973 -874 1193 2241 -1048 1439 2720 -1281
Maharashtra 1761 2467 -706 2183 2583 -400 3525 3026 499
Orissa 901 1578 -677 1425 2034 -609 2456 2688 -232
Punjab 2840 3900 -1060 4462 5452 -990 6605 5860 745
Rajasthan 1427 2809 -1382 1650 3668 -2018 1678 3875 -2197
Tamil Nadu 1739 2285 -546 2244 3187 -943 3658 3691 -33
Uttar Pradesh 1198 2526 -1328 2428 3728 -1300 3978 4948 -970
West Bengal 1862 2517 -655 3643 3877 -234 5993 4754 1239
All India 1659 2482 -823 2493 3148 -655 3589 3685 -96
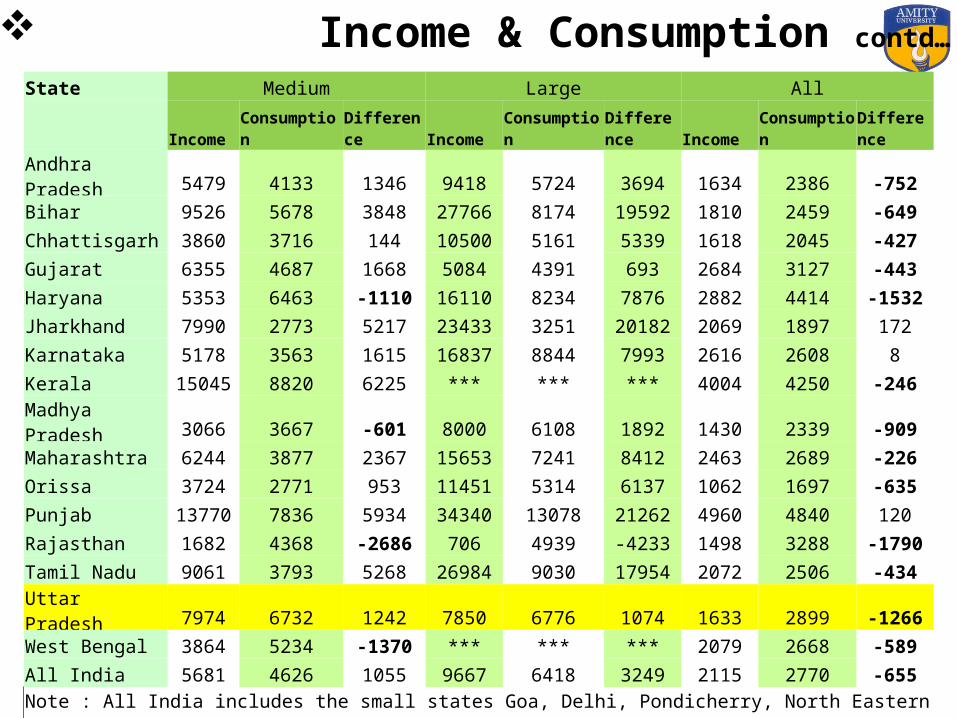
Income & Consumption contd…
State Medium Large All
Income Consumption Difference Income Consumption Difference Income Consumption Difference
Andhra Pradesh 5479 4133 1346 9418 5724 3694 1634 2386 -752
Bihar 9526 5678 3848 27766 8174 19592 1810 2459 -649
Chhattisgarh 3860 3716 144 10500 5161 5339 1618 2045 -427
Gujarat 6355 4687 1668 5084 4391 693 2684 3127 -443
Haryana 5353 6463 -1110 16110 8234 7876 2882 4414 -1532
Jharkhand 7990 2773 5217 23433 3251 20182 2069 1897 172
Karnataka 5178 3563 1615 16837 8844 7993 2616 2608 8
Kerala 15045 8820 6225 *** *** *** 4004 4250 -246
Madhya Pradesh 3066 3667 -601 8000 6108 1892 1430 2339 -909
Maharashtra 6244 3877 2367 15653 7241 8412 2463 2689 -226
Orissa 3724 2771 953 11451 5314 6137 1062 1697 -635
Punjab 13770 7836 5934 34340 13078 21262 4960 4840 120
Rajasthan 1682 4368 -2686 706 4939 -4233 1498 3288 -1790
Tamil Nadu 9061 3793 5268 26984 9030 17954 2072 2506 -434
Uttar Pradesh 7974 6732 1242 7850 6776 1074 1633 2899 -1266
West Bengal 3864 5234 -1370 *** *** *** 2079 2668 -589
All India 5681 4626 1055 9667 6418 3249 2115 2770 -655
Note : All India includes the small states Goa, Delhi, Pondicherry, North Eastern States & UTs
Source : Computed using NSS unit level data 59th Round on Situation Assessment Survey of Farmers 2003
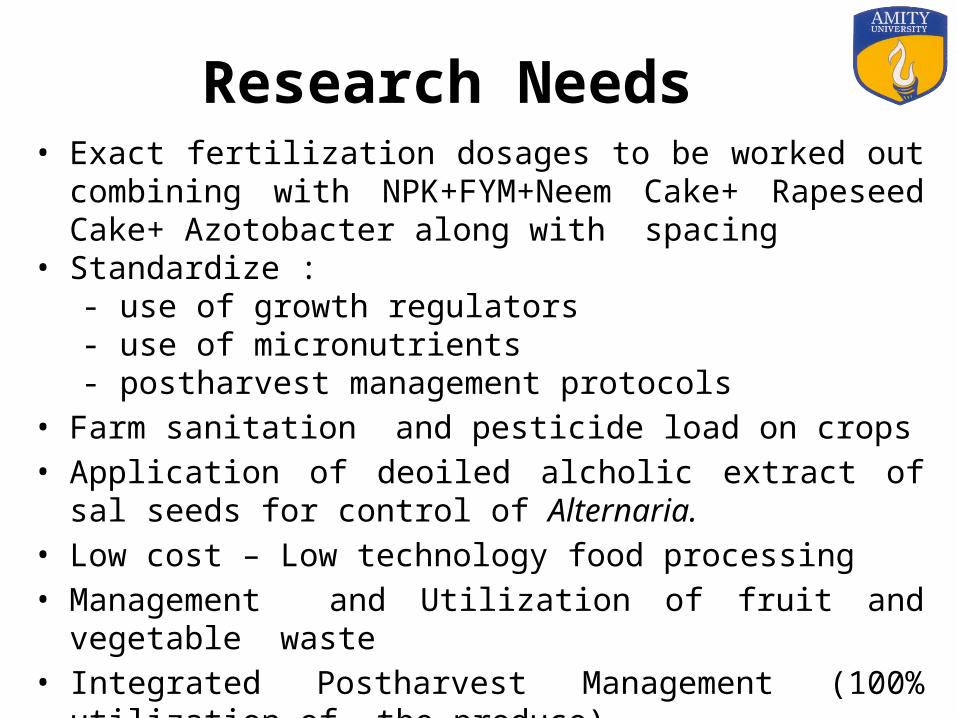
• Exact fertilization dosages to be worked out combining with NPK+FYM+Neem Cake+ Rapeseed Cake+ Azotobacter along with spacing
• Standardize :- use of growth regulators - use of micronutrients- postharvest management protocols
• Farm sanitation and pesticide load on crops• Application of deoiled alcholic extract of sal seeds for control of
Alternaria.• Low cost – Low technology food processing• Management and Utilization of fruit and vegetable waste• Integrated Postharvest Management (100% utilization of the
produce)
Research Needs
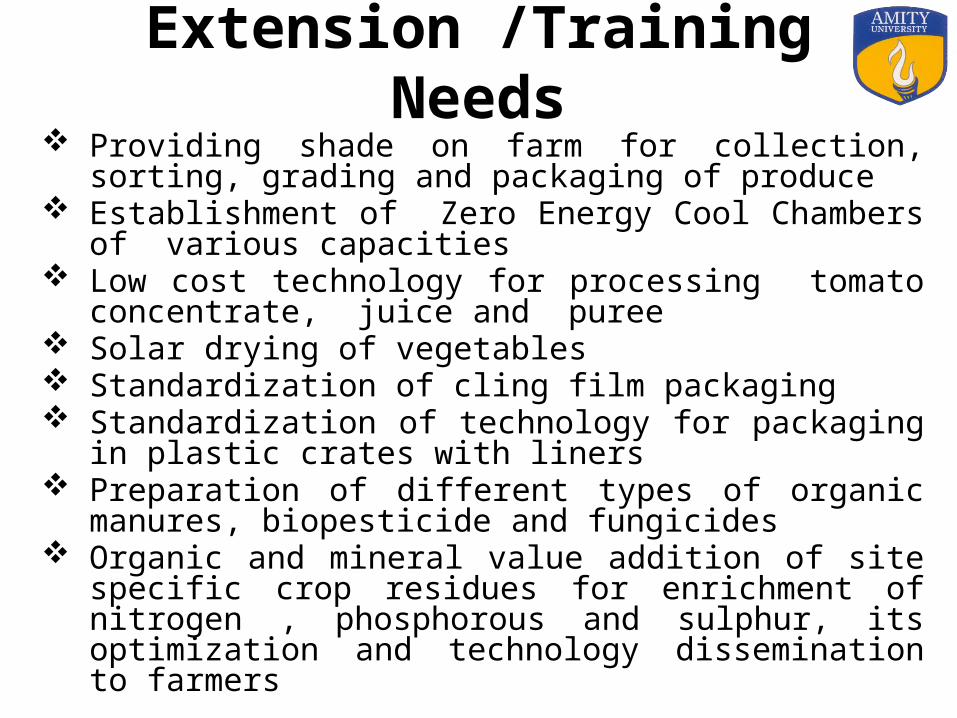
Extension /Training Needs Providing shade on farm for collection, sorting, grading and
packaging of produce Establishment of Zero Energy Cool Chambers of various
capacities Low cost technology for processing tomato concentrate, juice
and puree Solar drying of vegetables Standardization of cling film packaging Standardization of technology for packaging in plastic crates
with liners Preparation of different types of organic manures, biopesticide
and fungicides Organic and mineral value addition of site specific crop residues
for enrichment of nitrogen , phosphorous and sulphur, its optimization and technology dissemination to farmers
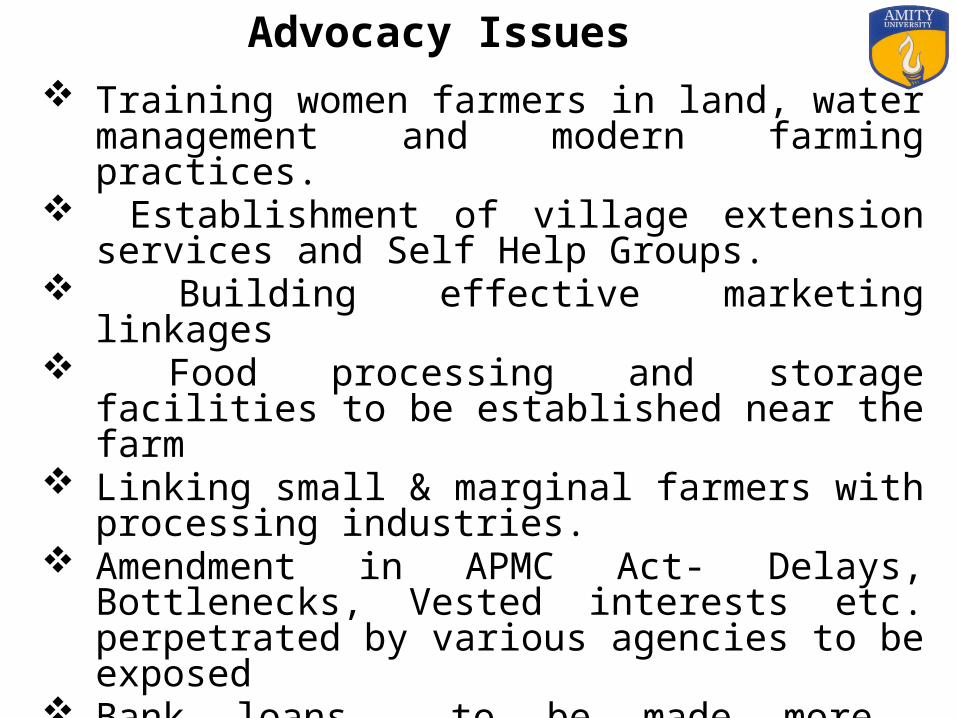
Training women farmers in land, water management and modern farming practices.
Establishment of village extension services and Self Help Groups.
Building effective marketing linkages Food processing and storage facilities to be
established near the farm Linking small & marginal farmers with processing
industries. Amendment in APMC Act- Delays, Bottlenecks, Vested
interests etc. perpetrated by various agencies to be exposed
Bank loans to be made more accessible to marginal and small farmers
Use of GIS and remote sensing to forewarn farmers on impending weather disasters.
Advocacy Issues