Embed Size (px)
Citation preview
Identification of a metabolic bottleneck for cold acclimation inArabidopsis thaliana
Thomas Nagele†, Simon Stutz†,*, Imke I. Hormiller and Arnd G. Heyer
Institute of Biology, Department of Plant Biotechnology, University of Stuttgart, D-70569 Stuttgart, Germany
Received 9 January 2012; revised 11 May 2012; accepted 23 May 2012.
*For correspondence (e-mail [email protected]).†These authors contributed equally to this work.
SUMMARY
Central carbohydrate metabolism of Arabidopsis thaliana is known to play a crucial role during cold
acclimation and the acquisition of freezing tolerance. During cold exposure, many carbohydrates accumulate
and a new metabolic homeostasis evolves. In the present study, we analyse the diurnal dynamics of
carbohydrate homeostasis before and after cold exposure in three natural accessions showing distinct cold
acclimation capacity. Diurnal dynamics of soluble carbohydrates were found to be significantly different in
cold-sensitive and cold-tolerant accessions. Although experimentally determined maximum turnover rates for
sucrose phosphate synthase in cold-acclimated leaves were higher for cold-tolerant accessions, model
simulations of diurnal carbohydrate dynamics revealed similar fluxes. This implied a significantly higher
capacity for sucrose synthesis in cold-tolerant than cold-sensitive accessions. Based on this implication
resulting from mathematical model simulation, a critical temperature for sucrose synthesis was calculated
using the Arrhenius equation and experimentally validated in the cold-sensitive accession C24. At the critical
temperature suggested by model simulation, an imbalance in photosynthetic carbon fixation ultimately
resulting in oxidative stress was observed. It is therefore concluded that metabolic capacities at least in part
determine the ability of accessions of Arabidopsis thaliana to cope with changes in environmental conditions.
Keywords: Arabidopsis thaliana, carbohydrate metabolism, cold acclimation, mathematical modeling,
sucrose synthesis.
INTRODUCTION
As sessile organisms, plants have to adapt to environmental
changes that affect their performance, growth and distribu-
tion. Low temperature plays a key role in this context, and
thus has a great impact on crop productivity (Janska et al.,
2010).
Upon exposure to low non-freezing temperatures, Arabi-
dopsis thaliana, like many other plants, is able to increase its
freezing tolerance during a complex process termed cold
acclimation. Low temperature influences enzyme-catalysed
reactions via thermodynamic effects, slows down transport
processes across membranes through reduction of mem-
brane fluidity, and influences various other cellular events.
As a consequence, cold acclimation incorporates numerous
physiological and biochemical changes (Xin and Browse,
2000; Stitt and Hurry, 2002), and the reorganization of
cellular metabolism affects gene expression, protein com-
position and membrane structure as well as the metabolite
profile (Gilmour et al., 2000; Kaplan et al., 2007).
In several studies, it has been shown that acquisition of
freezing tolerance is closely linked to changes in the
regulation of primary carbohydrate metabolism (Guy et al.,
1992; Sasaki et al., 2001; Klotke et al., 2004). During devel-
opment of A. thaliana leaves in the cold, re-direction of
newly fixed carbon towards sucrose synthesis rather than
starch accumulation was observed (Strand et al., 1997,
1999), and the resulting higher content of sucrose in cold-
acclimated leaves has also been found in various other
plants. Sucrose may play a direct role as a cryoprotectant of
membranes or more indirectly as a substrate for other
cryoprotectants such as raffinose, which was shown to
protect the photosynthetic machinery from freezing damage
(Knaupp et al., 2011). Because of the complex nature of cold
acclimation, a simple correlation between development of
freezing tolerance and changes in metabolism cannot be
expected (Hannah et al., 2006). Multigenic traits such as cold
acclimation thus cannot be explained intuitively based on
ª 2012 The Authors 1The Plant Journal ª 2012 Blackwell Publishing Ltd
The Plant Journal (2012) doi: 10.1111/j.1365-313X.2012.05064.x
changes in concentrations of a single or only a few
metabolites.
In this context, systems biology offers the possibility of
investigating interactions among components of complex
biological networks, and helps in elucidating the underlying
regulatory mechanisms (Yuan et al., 2008). To study meta-
bolic pathways, representation of enzyme-catalysed reac-
tions by ordinary differential equations has proved to be a
versatile tool. In a system of equations representing a
metabolic pathway, incorporation of experimentally deter-
mined concentrations of metabolites and enzyme para-
meters can be used not only to validate the model but also to
predict the effects that modifications of enzymatic parame-
ters would have on metabolism (Nagele et al., 2010).
In the present study, the behaviour of three accessions of
A. thaliana during exposure to low temperatures was
examined. Low temperatures have direct thermodynamic
effects on metabolism on the one hand, but on the other
hand they also trigger cold acclimation. The acclimation
capacity of European accessions of Arabidopsis was dem-
onstrated to correlate with minimum habitat temperatures
(Hannah et al., 2006). Therefore, we used accessions varying
in acclimation capacity in order to allow separation of
thermodynamic from acclimation effects. To analyse tem-
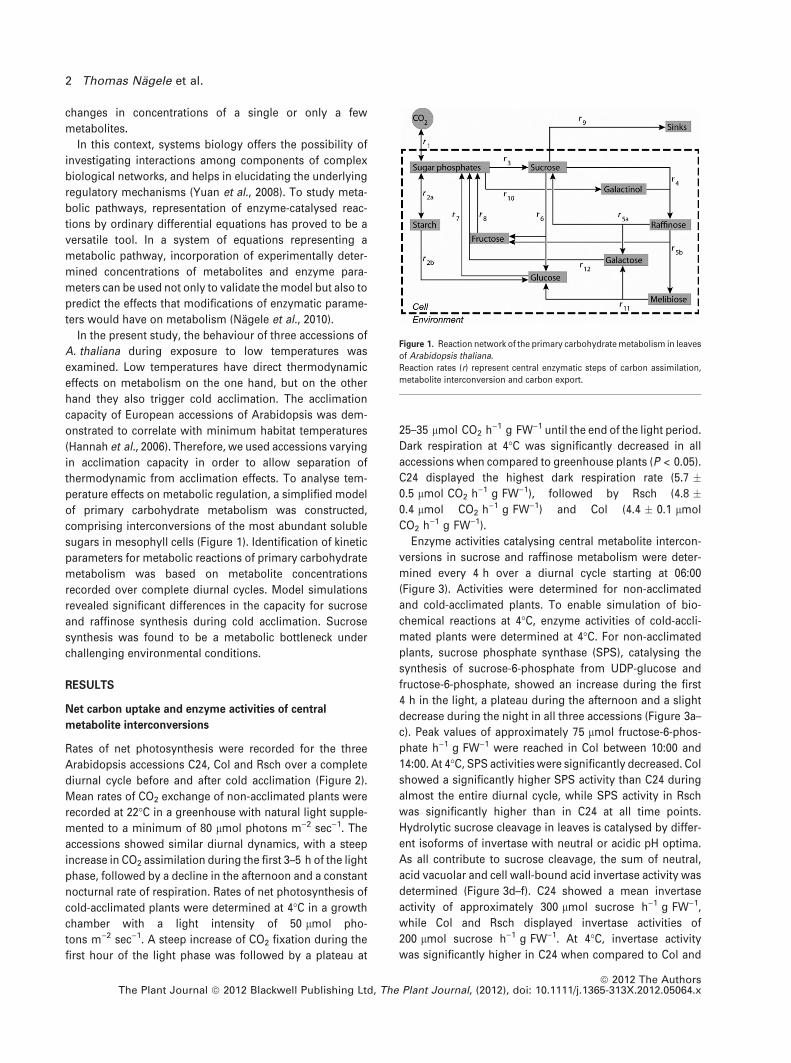
perature effects on metabolic regulation, a simplified model
of primary carbohydrate metabolism was constructed,
comprising interconversions of the most abundant soluble
sugars in mesophyll cells (Figure 1). Identification of kinetic
parameters for metabolic reactions of primary carbohydrate
metabolism was based on metabolite concentrations
recorded over complete diurnal cycles. Model simulations
revealed significant differences in the capacity for sucrose
and raffinose synthesis during cold acclimation. Sucrose
synthesis was found to be a metabolic bottleneck under
challenging environmental conditions.
RESULTS
Net carbon uptake and enzyme activities of central
metabolite interconversions
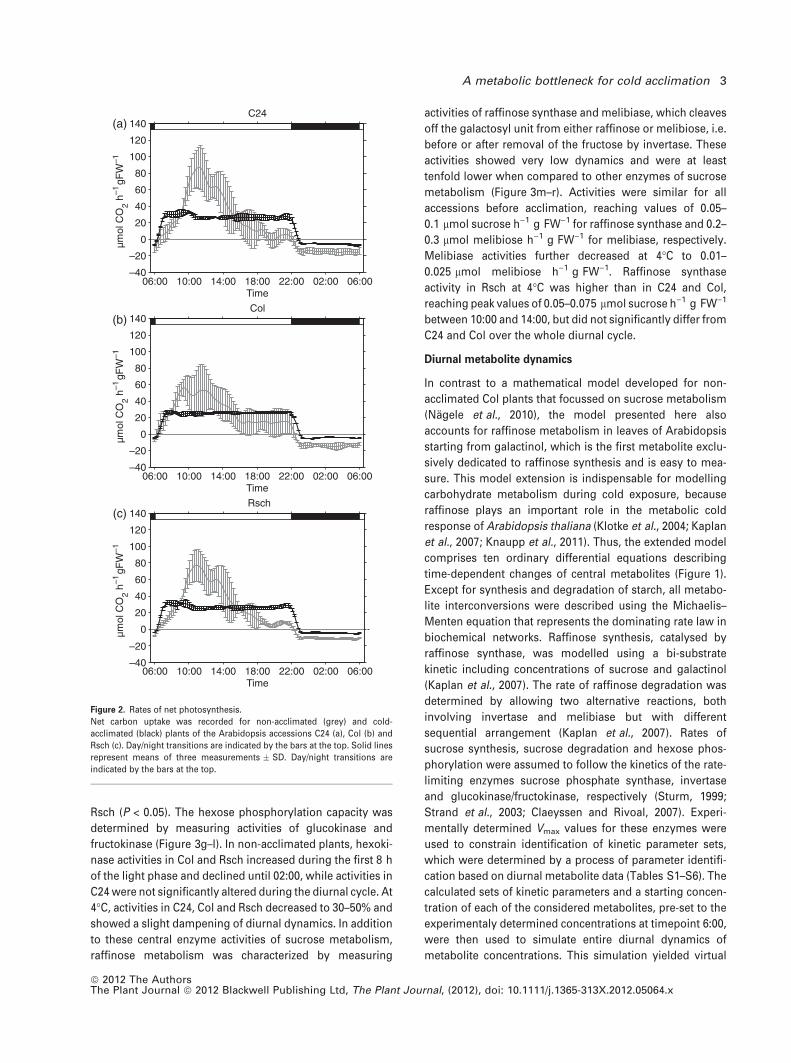
Rates of net photosynthesis were recorded for the three
Arabidopsis accessions C24, Col and Rsch over a complete
diurnal cycle before and after cold acclimation (Figure 2).
Mean rates of CO2 exchange of non-acclimated plants were
recorded at 22�C in a greenhouse with natural light supple-
mented to a minimum of 80 lmol photons m)2 sec)1. The
accessions showed similar diurnal dynamics, with a steep
increase in CO2 assimilation during the first 3–5 h of the light
phase, followed by a decline in the afternoon and a constant
nocturnal rate of respiration. Rates of net photosynthesis of
cold-acclimated plants were determined at 4�C in a growth
chamber with a light intensity of 50 lmol pho-
tons m)2 sec)1. A steep increase of CO2 fixation during the
first hour of the light phase was followed by a plateau at
25–35 lmol CO2 h)1 g FW)1 until the end of the light period.
Dark respiration at 4�C was significantly decreased in all
accessions when compared to greenhouse plants (P < 0.05).
C24 displayed the highest dark respiration rate (5.7 �0.5 lmol CO2 h)1 g FW)1), followed by Rsch (4.8 �0.4 lmol CO2 h)1 g FW)1) and Col (4.4 � 0.1 lmol
CO2 h)1 g FW)1).
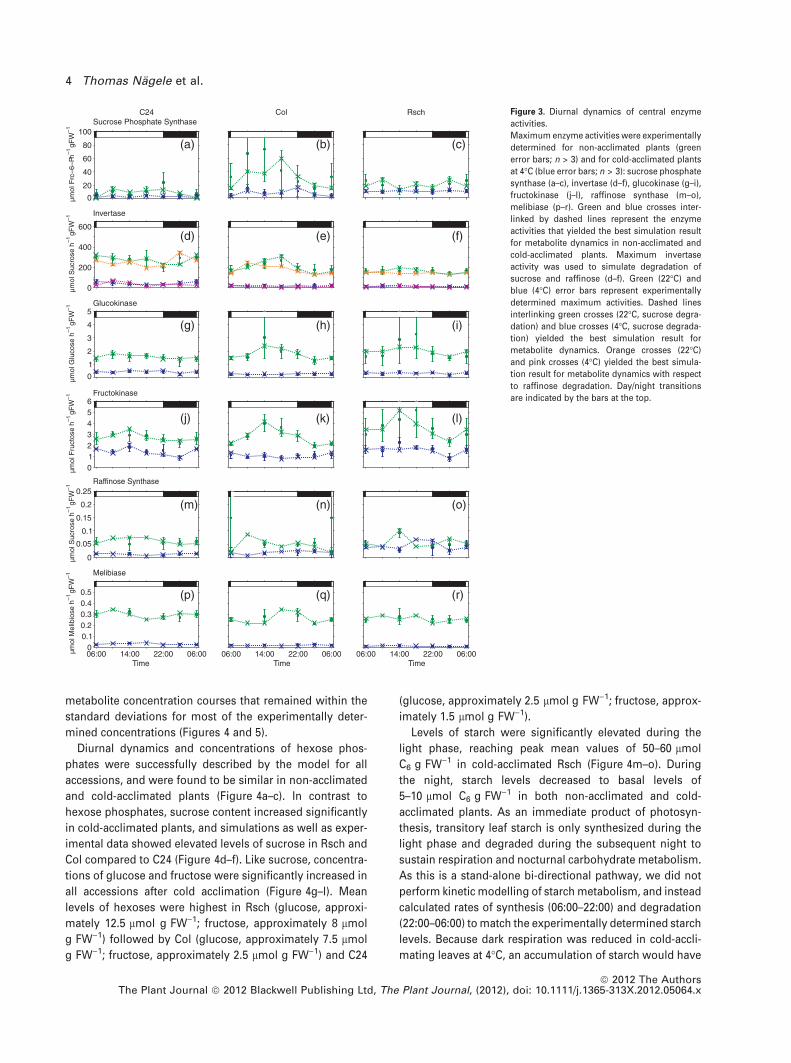
Enzyme activities catalysing central metabolite intercon-
versions in sucrose and raffinose metabolism were deter-
mined every 4 h over a diurnal cycle starting at 06:00
(Figure 3). Activities were determined for non-acclimated
and cold-acclimated plants. To enable simulation of bio-
chemical reactions at 4�C, enzyme activities of cold-accli-
mated plants were determined at 4�C. For non-acclimated
plants, sucrose phosphate synthase (SPS), catalysing the
synthesis of sucrose-6-phosphate from UDP-glucose and
fructose-6-phosphate, showed an increase during the first
4 h in the light, a plateau during the afternoon and a slight
decrease during the night in all three accessions (Figure 3a–
c). Peak values of approximately 75 lmol fructose-6-phos-
phate h)1 g FW)1 were reached in Col between 10:00 and
14:00. At 4�C, SPS activities were significantly decreased. Col
showed a significantly higher SPS activity than C24 during
almost the entire diurnal cycle, while SPS activity in Rsch
was significantly higher than in C24 at all time points.
Hydrolytic sucrose cleavage in leaves is catalysed by differ-
ent isoforms of invertase with neutral or acidic pH optima.
As all contribute to sucrose cleavage, the sum of neutral,
acid vacuolar and cell wall-bound acid invertase activity was
determined (Figure 3d–f). C24 showed a mean invertase
activity of approximately 300 lmol sucrose h)1 g FW)1,
while Col and Rsch displayed invertase activities of
200 lmol sucrose h)1 g FW)1. At 4�C, invertase activity
was significantly higher in C24 when compared to Col and
Figure 1. Reaction network of the primary carbohydrate metabolism in leaves
of Arabidopsis thaliana.
Reaction rates (r) represent central enzymatic steps of carbon assimilation,
metabolite interconversion and carbon export.
2 Thomas Nagele et al.
ª 2012 The AuthorsThe Plant Journal ª 2012 Blackwell Publishing Ltd, The Plant Journal, (2012), doi: 10.1111/j.1365-313X.2012.05064.x
Rsch (P < 0.05). The hexose phosphorylation capacity was
determined by measuring activities of glucokinase and
fructokinase (Figure 3g–l). In non-acclimated plants, hexoki-
nase activities in Col and Rsch increased during the first 8 h
of the light phase and declined until 02:00, while activities in
C24 were not significantly altered during the diurnal cycle. At
4�C, activities in C24, Col and Rsch decreased to 30–50% and
showed a slight dampening of diurnal dynamics. In addition
to these central enzyme activities of sucrose metabolism,
raffinose metabolism was characterized by measuring
activities of raffinose synthase and melibiase, which cleaves
off the galactosyl unit from either raffinose or melibiose, i.e.
before or after removal of the fructose by invertase. These
activities showed very low dynamics and were at least
tenfold lower when compared to other enzymes of sucrose
metabolism (Figure 3m–r). Activities were similar for all
accessions before acclimation, reaching values of 0.05–
0.1 lmol sucrose h)1 g FW)1 for raffinose synthase and 0.2–
0.3 lmol melibiose h)1 g FW)1 for melibiase, respectively.
Melibiase activities further decreased at 4�C to 0.01–
0.025 lmol melibiose h)1 g FW)1. Raffinose synthase
activity in Rsch at 4�C was higher than in C24 and Col,
reaching peak values of 0.05–0.075 lmol sucrose h)1 g FW)1
between 10:00 and 14:00, but did not significantly differ from
C24 and Col over the whole diurnal cycle.
Diurnal metabolite dynamics
In contrast to a mathematical model developed for non-
acclimated Col plants that focussed on sucrose metabolism
(Nagele et al., 2010), the model presented here also
accounts for raffinose metabolism in leaves of Arabidopsis
starting from galactinol, which is the first metabolite exclu-
sively dedicated to raffinose synthesis and is easy to mea-
sure. This model extension is indispensable for modelling
carbohydrate metabolism during cold exposure, because
raffinose plays an important role in the metabolic cold
response of Arabidopsis thaliana (Klotke et al., 2004; Kaplan
et al., 2007; Knaupp et al., 2011). Thus, the extended model
comprises ten ordinary differential equations describing
time-dependent changes of central metabolites (Figure 1).
Except for synthesis and degradation of starch, all metabo-
lite interconversions were described using the Michaelis–
Menten equation that represents the dominating rate law in
biochemical networks. Raffinose synthesis, catalysed by
raffinose synthase, was modelled using a bi-substrate
kinetic including concentrations of sucrose and galactinol
(Kaplan et al., 2007). The rate of raffinose degradation was
determined by allowing two alternative reactions, both
involving invertase and melibiase but with different
sequential arrangement (Kaplan et al., 2007). Rates of
sucrose synthesis, sucrose degradation and hexose phos-
phorylation were assumed to follow the kinetics of the rate-
limiting enzymes sucrose phosphate synthase, invertase
and glucokinase/fructokinase, respectively (Sturm, 1999;
Strand et al., 2003; Claeyssen and Rivoal, 2007). Experi-
mentally determined Vmax values for these enzymes were
used to constrain identification of kinetic parameter sets,
which were determined by a process of parameter identifi-
cation based on diurnal metabolite data (Tables S1–S6). The
calculated sets of kinetic parameters and a starting concen-
tration of each of the considered metabolites, pre-set to the
experimentaly determined concentrations at timepoint 6:00,
were then used to simulate entire diurnal dynamics of
metabolite concentrations. This simulation yielded virtual
µmol
CO
2h–1
gFW
–1µm
olC
O2
h–1gF
W–1
µmol
CO
2h–1
gFW
–1
Time
C24(a)
(b)
(c)
06:00 10:00 14:00 18:00 22:00 02:00 06:00–40
–20
0
20
40
60
80
100
120
140
Time
Col
06:00 10:00 14:00 18:00 22:00 02:00 06:00–40
–20
–40
–20
0
20
40
60
80
100
120
140
Time
Rsch
06:00 10:00 14:00 18:00 22:00 02:00 06:00
0
20
40
60
80
100
120
140
Figure 2. Rates of net photosynthesis.
Net carbon uptake was recorded for non-acclimated (grey) and cold-
acclimated (black) plants of the Arabidopsis accessions C24 (a), Col (b) and
Rsch (c). Day/night transitions are indicated by the bars at the top. Solid lines
represent means of three measurements � SD. Day/night transitions are
indicated by the bars at the top.
A metabolic bottleneck for cold acclimation 3
ª 2012 The AuthorsThe Plant Journal ª 2012 Blackwell Publishing Ltd, The Plant Journal, (2012), doi: 10.1111/j.1365-313X.2012.05064.x
metabolite concentration courses that remained within the
standard deviations for most of the experimentally deter-
mined concentrations (Figures 4 and 5).
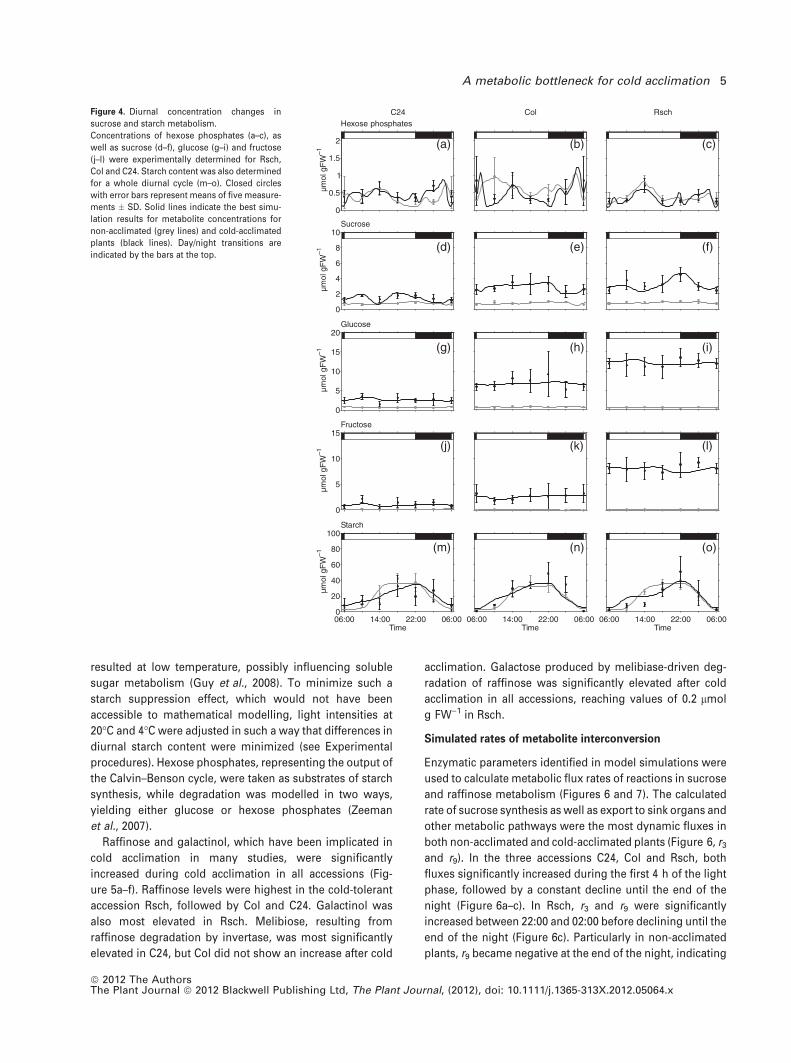
Diurnal dynamics and concentrations of hexose phos-
phates were successfully described by the model for all
accessions, and were found to be similar in non-acclimated
and cold-acclimated plants (Figure 4a–c). In contrast to
hexose phosphates, sucrose content increased significantly
in cold-acclimated plants, and simulations as well as exper-
imental data showed elevated levels of sucrose in Rsch and
Col compared to C24 (Figure 4d–f). Like sucrose, concentra-
tions of glucose and fructose were significantly increased in
all accessions after cold acclimation (Figure 4g–l). Mean
levels of hexoses were highest in Rsch (glucose, approxi-
mately 12.5 lmol g FW)1; fructose, approximately 8 lmol
g FW)1) followed by Col (glucose, approximately 7.5 lmol
g FW)1; fructose, approximately 2.5 lmol g FW)1) and C24
(glucose, approximately 2.5 lmol g FW)1; fructose, approx-
imately 1.5 lmol g FW)1).
Levels of starch were significantly elevated during the
light phase, reaching peak mean values of 50–60 lmol
C6 g FW)1 in cold-acclimated Rsch (Figure 4m–o). During
the night, starch levels decreased to basal levels of
5–10 lmol C6 g FW)1 in both non-acclimated and cold-
acclimated plants. As an immediate product of photosyn-
thesis, transitory leaf starch is only synthesized during the
light phase and degraded during the subsequent night to
sustain respiration and nocturnal carbohydrate metabolism.
As this is a stand-alone bi-directional pathway, we did not
perform kinetic modelling of starch metabolism, and instead
calculated rates of synthesis (06:00–22:00) and degradation
(22:00–06:00) to match the experimentally determined starch
levels. Because dark respiration was reduced in cold-accli-
mating leaves at 4�C, an accumulation of starch would have
µmol
Frc
–6–P
hgF
W–1
–1µm
olS
ucro
seh
gFW
–1–1
µmol
Glu
cose
hgF
W–1
–1µm
olF
ruct
ose
hgF
W–1
–1µm
olS
ucro
seh
gFW
–1–1
µmol
Mel
ibio
seh
gFW
–1–1
Sucrose Phosphate Synthase
Invertase
Glucokinase
Fructokinase
Raffinose Synthase
Melibiase
C24 Col Rsch
0
20
40
60
80
100
(a)
0
2
4
5
1
3
(g)
0
2
4
65
3
1
(j)
0
0.05
0.1
0.15
0.2
0.25
(m)
(h)
(k)
(e)
(q)
(n)
(b)
0
200
400
600(d) (f)
(i)
(l)
(r)
(o)
(c)
00.10.20.30.40.5 (p)
06:00 14:00 22:00 06:00Time
06:00 14:00 22:00 06:00Time
06:00 14:00 22:00 06:00Time
Figure 3. Diurnal dynamics of central enzyme
activities.
Maximum enzyme activities were experimentally
determined for non-acclimated plants (green
error bars; n > 3) and for cold-acclimated plants
at 4�C (blue error bars; n > 3): sucrose phosphate
synthase (a–c), invertase (d–f), glucokinase (g–i),
fructokinase (j–l), raffinose synthase (m–o),
melibiase (p–r). Green and blue crosses inter-
linked by dashed lines represent the enzyme
activities that yielded the best simulation result
for metabolite dynamics in non-acclimated and
cold-acclimated plants. Maximum invertase
activity was used to simulate degradation of
sucrose and raffinose (d–f). Green (22�C) and
blue (4�C) error bars represent experimentally
determined maximum activities. Dashed lines
interlinking green crosses (22�C, sucrose degra-
dation) and blue crosses (4�C, sucrose degrada-
tion) yielded the best simulation result for
metabolite dynamics. Orange crosses (22�C)
and pink crosses (4�C) yielded the best simula-
tion result for metabolite dynamics with respect
to raffinose degradation. Day/night transitions
are indicated by the bars at the top.
4 Thomas Nagele et al.
ª 2012 The AuthorsThe Plant Journal ª 2012 Blackwell Publishing Ltd, The Plant Journal, (2012), doi: 10.1111/j.1365-313X.2012.05064.x
resulted at low temperature, possibly influencing soluble
sugar metabolism (Guy et al., 2008). To minimize such a
starch suppression effect, which would not have been
accessible to mathematical modelling, light intensities at
20�C and 4�C were adjusted in such a way that differences in
diurnal starch content were minimized (see Experimental
procedures). Hexose phosphates, representing the output of
the Calvin–Benson cycle, were taken as substrates of starch
synthesis, while degradation was modelled in two ways,
yielding either glucose or hexose phosphates (Zeeman
et al., 2007).
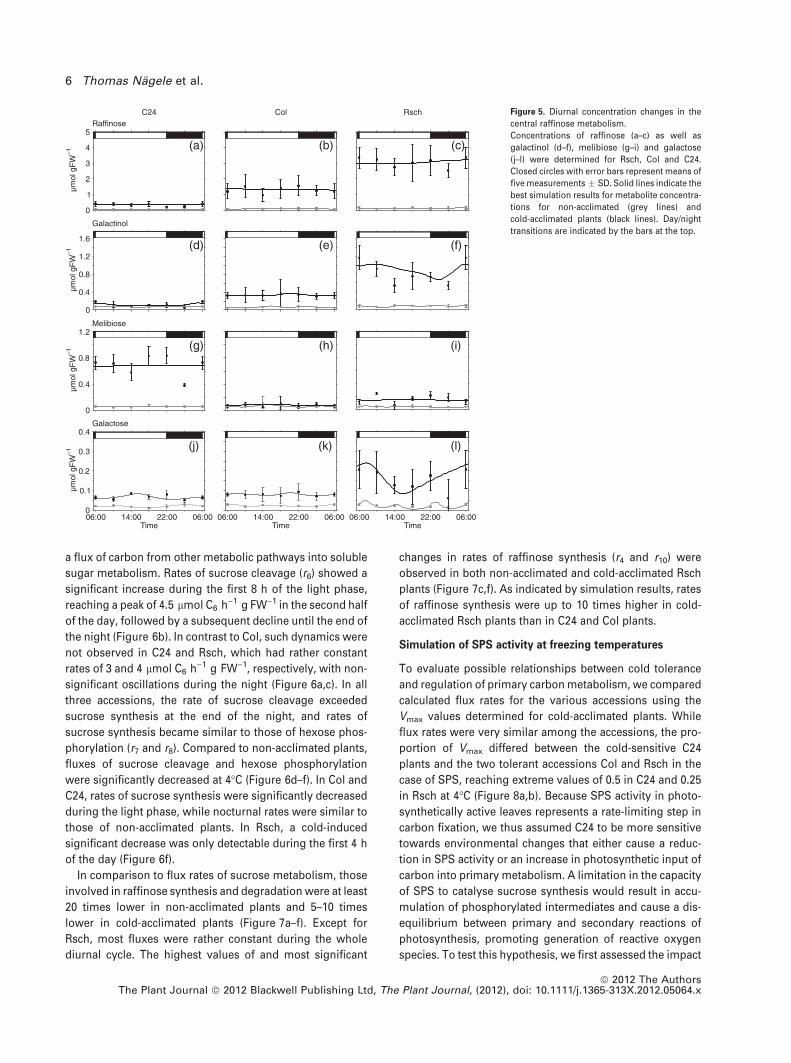
Raffinose and galactinol, which have been implicated in
cold acclimation in many studies, were significantly
increased during cold acclimation in all accessions (Fig-
ure 5a–f). Raffinose levels were highest in the cold-tolerant
accession Rsch, followed by Col and C24. Galactinol was
also most elevated in Rsch. Melibiose, resulting from
raffinose degradation by invertase, was most significantly
elevated in C24, but Col did not show an increase after cold
acclimation. Galactose produced by melibiase-driven deg-
radation of raffinose was significantly elevated after cold
acclimation in all accessions, reaching values of 0.2 lmol
g FW)1 in Rsch.
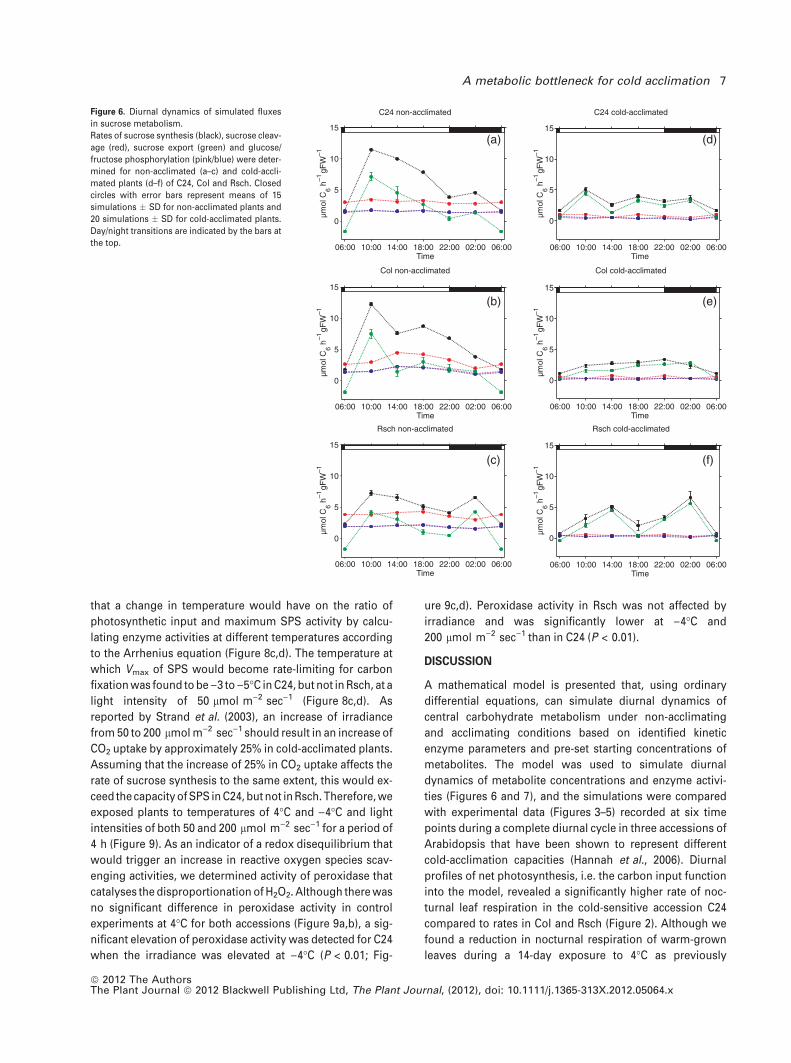
Simulated rates of metabolite interconversion
Enzymatic parameters identified in model simulations were
used to calculate metabolic flux rates of reactions in sucrose
and raffinose metabolism (Figures 6 and 7). The calculated
rate of sucrose synthesis as well as export to sink organs and
other metabolic pathways were the most dynamic fluxes in
both non-acclimated and cold-acclimated plants (Figure 6, r3
and r9). In the three accessions C24, Col and Rsch, both
fluxes significantly increased during the first 4 h of the light
phase, followed by a constant decline until the end of the
night (Figure 6a–c). In Rsch, r3 and r9 were significantly
increased between 22:00 and 02:00 before declining until the
end of the night (Figure 6c). Particularly in non-acclimated
plants, r9 became negative at the end of the night, indicating
0
5
10
15Fructose
µmol
gFW
–1
06:00 14:00 22:00 06:00Time
06:0006:00 14:00 22:00Time
Starch
06:00 14:00 22:00 06:000
20
40
60
80
100
Time
µmol
gFW
–1
0
5
10
15
20Glucose
µmol
gFW
–10
2
4
6
8
10Sucrose
µmol
gFW
–1
C24 Col
(b)
Rsch
(c)
0
0.5
1
1.5
2 (a)
(e) (f)(d)
(h) (i)(g)
(k) (l)(j)
(n) (o)(m)
Hexose phosphates
µmol
gFW
–1
Figure 4. Diurnal concentration changes in
sucrose and starch metabolism.
Concentrations of hexose phosphates (a–c), as
well as sucrose (d–f), glucose (g–i) and fructose
(j–l) were experimentally determined for Rsch,
Col and C24. Starch content was also determined
for a whole diurnal cycle (m–o). Closed circles
with error bars represent means of five measure-
ments � SD. Solid lines indicate the best simu-
lation results for metabolite concentrations for
non-acclimated (grey lines) and cold-acclimated
plants (black lines). Day/night transitions are
indicated by the bars at the top.
A metabolic bottleneck for cold acclimation 5
ª 2012 The AuthorsThe Plant Journal ª 2012 Blackwell Publishing Ltd, The Plant Journal, (2012), doi: 10.1111/j.1365-313X.2012.05064.x
a flux of carbon from other metabolic pathways into soluble
sugar metabolism. Rates of sucrose cleavage (r6) showed a
significant increase during the first 8 h of the light phase,
reaching a peak of 4.5 lmol C6 h)1 g FW)1 in the second half
of the day, followed by a subsequent decline until the end of
the night (Figure 6b). In contrast to Col, such dynamics were
not observed in C24 and Rsch, which had rather constant
rates of 3 and 4 lmol C6 h)1 g FW)1, respectively, with non-
significant oscillations during the night (Figure 6a,c). In all
three accessions, the rate of sucrose cleavage exceeded
sucrose synthesis at the end of the night, and rates of
sucrose synthesis became similar to those of hexose phos-
phorylation (r7 and r8). Compared to non-acclimated plants,
fluxes of sucrose cleavage and hexose phosphorylation
were significantly decreased at 4�C (Figure 6d–f). In Col and
C24, rates of sucrose synthesis were significantly decreased
during the light phase, while nocturnal rates were similar to
those of non-acclimated plants. In Rsch, a cold-induced
significant decrease was only detectable during the first 4 h
of the day (Figure 6f).
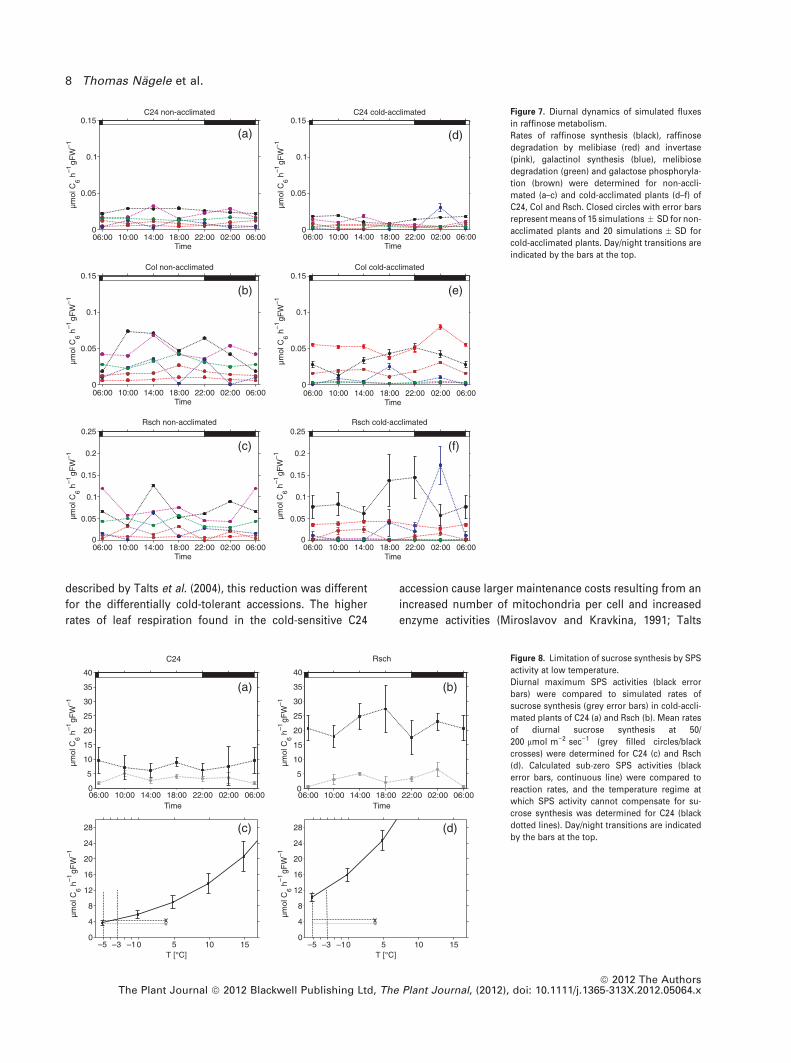
In comparison to flux rates of sucrose metabolism, those
involved in raffinose synthesis and degradation were at least
20 times lower in non-acclimated plants and 5–10 times
lower in cold-acclimated plants (Figure 7a–f). Except for
Rsch, most fluxes were rather constant during the whole
diurnal cycle. The highest values of and most significant
changes in rates of raffinose synthesis (r4 and r10) were
observed in both non-acclimated and cold-acclimated Rsch
plants (Figure 7c,f). As indicated by simulation results, rates
of raffinose synthesis were up to 10 times higher in cold-
acclimated Rsch plants than in C24 and Col plants.
Simulation of SPS activity at freezing temperatures
To evaluate possible relationships between cold tolerance
and regulation of primary carbon metabolism, we compared
calculated flux rates for the various accessions using the
Vmax values determined for cold-acclimated plants. While
flux rates were very similar among the accessions, the pro-
portion of Vmax differed between the cold-sensitive C24
plants and the two tolerant accessions Col and Rsch in the
case of SPS, reaching extreme values of 0.5 in C24 and 0.25
in Rsch at 4�C (Figure 8a,b). Because SPS activity in photo-
synthetically active leaves represents a rate-limiting step in
carbon fixation, we thus assumed C24 to be more sensitive
towards environmental changes that either cause a reduc-
tion in SPS activity or an increase in photosynthetic input of
carbon into primary metabolism. A limitation in the capacity
of SPS to catalyse sucrose synthesis would result in accu-
mulation of phosphorylated intermediates and cause a dis-
equilibrium between primary and secondary reactions of
photosynthesis, promoting generation of reactive oxygen
species. To test this hypothesis, we first assessed the impact
C24 Col Rsch
Melibiose
0
0.4
0.8
1.2
µmol
gFW
–1
Galactinol
0
0.4
0.8
1.2
1.6
µmol
gFW
–1
06:00 14:00 22:00 06:00Time
06:0006:00 14:00 22:00Time
Galactose
µmol
gFW
–1
06:00 14:00 22:00 06:00Time
0
0.1
0.2
0.3
0.4
Raffinose
µmol
gFW
–1
0
2
4
5
3
(a) (b) (c)
(d) (e) (f)
(g) (h) (i)
(j) (k) (l)
1
Figure 5. Diurnal concentration changes in the
central raffinose metabolism.
Concentrations of raffinose (a–c) as well as
galactinol (d–f), melibiose (g–i) and galactose
(j–l) were determined for Rsch, Col and C24.
Closed circles with error bars represent means of
five measurements � SD. Solid lines indicate the
best simulation results for metabolite concentra-
tions for non-acclimated (grey lines) and
cold-acclimated plants (black lines). Day/night
transitions are indicated by the bars at the top.
6 Thomas Nagele et al.
ª 2012 The AuthorsThe Plant Journal ª 2012 Blackwell Publishing Ltd, The Plant Journal, (2012), doi: 10.1111/j.1365-313X.2012.05064.x
that a change in temperature would have on the ratio of
photosynthetic input and maximum SPS activity by calcu-
lating enzyme activities at different temperatures according
to the Arrhenius equation (Figure 8c,d). The temperature at
which Vmax of SPS would become rate-limiting for carbon
fixation was found to be )3 to )5�C in C24, but not in Rsch, at a
light intensity of 50 lmol m)2 sec)1 (Figure 8c,d). As
reported by Strand et al. (2003), an increase of irradiance
from 50 to 200 lmol m)2 sec)1 should result in an increase of
CO2 uptake by approximately 25% in cold-acclimated plants.
Assuming that the increase of 25% in CO2 uptake affects the
rate of sucrose synthesis to the same extent, this would ex-
ceed the capacity of SPS in C24, but not in Rsch. Therefore, we
exposed plants to temperatures of 4�C and )4�C and light
intensities of both 50 and 200 lmol m)2 sec)1 for a period of
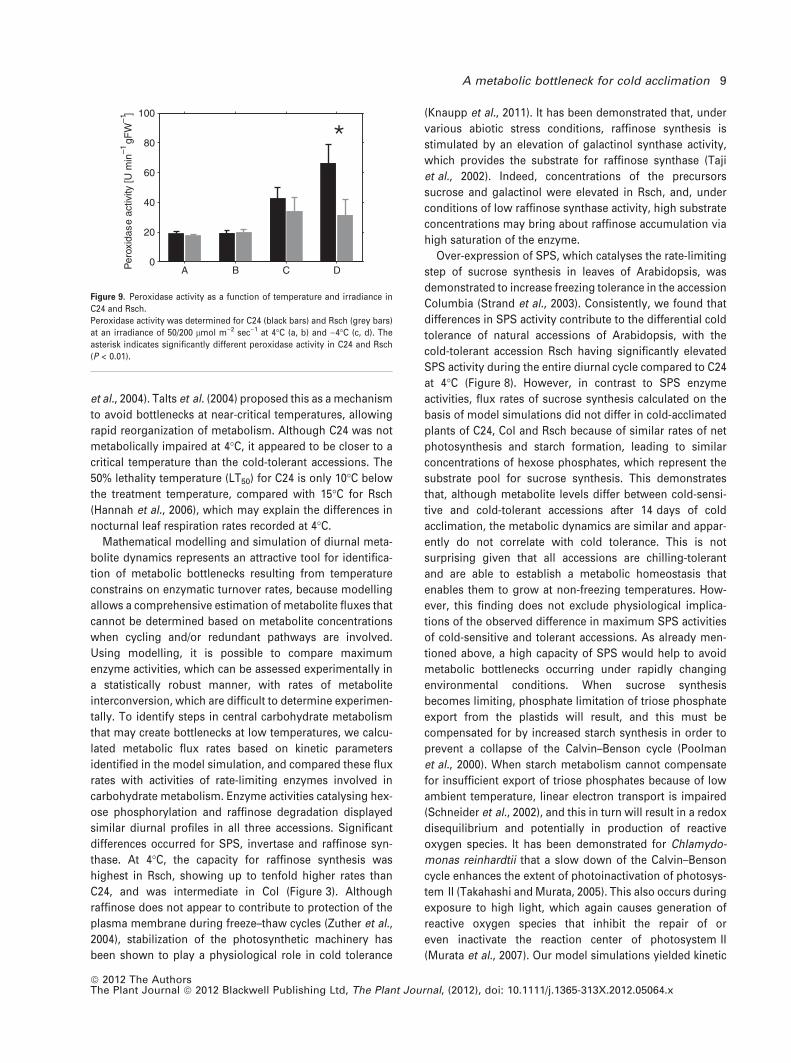
4 h (Figure 9). As an indicator of a redox disequilibrium that
would trigger an increase in reactive oxygen species scav-
enging activities, we determined activity of peroxidase that
catalyses the disproportionation of H2O2. Although there was
no significant difference in peroxidase activity in control
experiments at 4�C for both accessions (Figure 9a,b), a sig-
nificant elevation of peroxidase activity was detected for C24
when the irradiance was elevated at )4�C (P < 0.01; Fig-
ure 9c,d). Peroxidase activity in Rsch was not affected by
irradiance and was significantly lower at )4�C and
200 lmol m)2 sec)1 than in C24 (P < 0.01).
DISCUSSION
A mathematical model is presented that, using ordinary
differential equations, can simulate diurnal dynamics of
central carbohydrate metabolism under non-acclimating
and acclimating conditions based on identified kinetic
enzyme parameters and pre-set starting concentrations of
metabolites. The model was used to simulate diurnal
dynamics of metabolite concentrations and enzyme activi-
ties (Figures 6 and 7), and the simulations were compared
with experimental data (Figures 3–5) recorded at six time
points during a complete diurnal cycle in three accessions of
Arabidopsis that have been shown to represent different
cold-acclimation capacities (Hannah et al., 2006). Diurnal
profiles of net photosynthesis, i.e. the carbon input function
into the model, revealed a significantly higher rate of noc-
turnal leaf respiration in the cold-sensitive accession C24
compared to rates in Col and Rsch (Figure 2). Although we
found a reduction in nocturnal respiration of warm-grown
leaves during a 14-day exposure to 4�C as previously
C24 non-acclimated
06:00 10:00 14:00 18:00 22:00 02:00 06:00
0
5
10
15
Time
µmol
Ch
gFW
6–1
–1
Col non-acclimated
06:00 10:00 14:00 18:00 22:00 02:00 06:00
0
5
10
15
Time
µmol
Ch
gFW
6–1
–1
Rsch non-acclimated
06:00 10:00 14:00 18:00 22:00 02:00 06:00
0
5
10
15
Time
µmol
Ch
gFW
6–1
–1
(a)
(b)
(c)
(d)
(e)
(f)
Rsch cold-acclimated
06:00 10:00 14:00 18:00 22:00 02:00 06:00Time
µmol
Ch
gFW
6–1
–10
5
10
15
Col cold-acclimated
06:00 10:00 14:00 18:00 22:00 02:00 06:00Time
µmol
Ch
gFW
6–1
–1
0
5
10
15
C24 cold-acclimated
06:00 10:00 14:00 18:00 22:00 02:00 06:00Time
µmol
Ch
gFW
6–1
–1
0
5
10
15
Figure 6. Diurnal dynamics of simulated fluxes
in sucrose metabolism.
Rates of sucrose synthesis (black), sucrose cleav-
age (red), sucrose export (green) and glucose/
fructose phosphorylation (pink/blue) were deter-
mined for non-acclimated (a–c) and cold-accli-
mated plants (d–f) of C24, Col and Rsch. Closed
circles with error bars represent means of 15
simulations � SD for non-acclimated plants and
20 simulations � SD for cold-acclimated plants.
Day/night transitions are indicated by the bars at
the top.
A metabolic bottleneck for cold acclimation 7
ª 2012 The AuthorsThe Plant Journal ª 2012 Blackwell Publishing Ltd, The Plant Journal, (2012), doi: 10.1111/j.1365-313X.2012.05064.x
described by Talts et al. (2004), this reduction was different
for the differentially cold-tolerant accessions. The higher
rates of leaf respiration found in the cold-sensitive C24
accession cause larger maintenance costs resulting from an
increased number of mitochondria per cell and increased
enzyme activities (Miroslavov and Kravkina, 1991; Talts
C24 non-acclimated
µmol
Ch
gFW
6–1
–1
06:00 10:00 14:00 18:00 22:00 02:00 06:000
0.05
0.1
0.15
Time
(a)
C24 cold-acclimated
06:00 10:00 14:00 18:00 22:00 02:00 06:00Time
µmol
Ch
gFW
6–1
–1
Time
Col non-acclimated
06:00 10:00 14:00 18:00 22:00 02:00 06:000
0.05
0.1
0.15
(b)
µmol
Ch
gFW
6–1
–1
Col cold-acclimated
06:00 10:00 14:00 18:00 22:00 02:00 06:00Time
(e)µm
olC
hgF
W6
–1–1
Rsch non-acclimated
06:00 10:00 14:00 18:00 22:00 02:00 06:00Time
(c)
µmol
Ch
gFW
6–1
–1
Rsch cold-acclimated
06:00 10:00 14:00 18:00 22:00 02:00 06:000
0.05
0.1
0.15
0.2
0.25
Time
(f)
µmol
Ch
gFW
6–1
–1
0
0.05
0.1
0.15
0.2
0.25
0
0.05
0.1
0.15
(d)
0
0.05
0.1
0.15
Figure 7. Diurnal dynamics of simulated fluxes
in raffinose metabolism.
Rates of raffinose synthesis (black), raffinose
degradation by melibiase (red) and invertase
(pink), galactinol synthesis (blue), melibiose
degradation (green) and galactose phosphoryla-
tion (brown) were determined for non-accli-
mated (a–c) and cold-acclimated plants (d–f) of
C24, Col and Rsch. Closed circles with error bars
represent means of 15 simulations � SD for non-
acclimated plants and 20 simulations � SD for
cold-acclimated plants. Day/night transitions are
indicated by the bars at the top.
µmol
Ch
gFW
6–1
–1
C24
Time
(a) (b)
(c) (d)
06:00 10:00 14:00 18:00 22:00 02:00 06:000
5
10
15
20
25
30
35
40
Time
Rsch
06:00 10:00 14:00 18:00 22:00 02:00 06:000
5
10
15
20
25
30
35
40
µmol
Ch
gFW
6–1
–1
T [°C] T [°C]–5 –3 –10 5 10 15
0
4
8
12
16
20
24
28
µmol
Ch
gFW
6–1
–1
–5 –3 –10 5 10 150
4
8
12
16
20
24
28
µmol
Ch
gFW
6–1
–1
Figure 8. Limitation of sucrose synthesis by SPS
activity at low temperature.
Diurnal maximum SPS activities (black error
bars) were compared to simulated rates of
sucrose synthesis (grey error bars) in cold-accli-
mated plants of C24 (a) and Rsch (b). Mean rates
of diurnal sucrose synthesis at 50/
200 lmol m)2 sec)1 (grey filled circles/black
crosses) were determined for C24 (c) and Rsch
(d). Calculated sub-zero SPS activities (black
error bars, continuous line) were compared to
reaction rates, and the temperature regime at
which SPS activity cannot compensate for su-
crose synthesis was determined for C24 (black
dotted lines). Day/night transitions are indicated
by the bars at the top.
8 Thomas Nagele et al.
ª 2012 The AuthorsThe Plant Journal ª 2012 Blackwell Publishing Ltd, The Plant Journal, (2012), doi: 10.1111/j.1365-313X.2012.05064.x
et al., 2004). Talts et al. (2004) proposed this as a mechanism
to avoid bottlenecks at near-critical temperatures, allowing
rapid reorganization of metabolism. Although C24 was not
metabolically impaired at 4�C, it appeared to be closer to a
critical temperature than the cold-tolerant accessions. The
50% lethality temperature (LT50) for C24 is only 10�C below
the treatment temperature, compared with 15�C for Rsch
(Hannah et al., 2006), which may explain the differences in
nocturnal leaf respiration rates recorded at 4�C.
Mathematical modelling and simulation of diurnal meta-
bolite dynamics represents an attractive tool for identifica-
tion of metabolic bottlenecks resulting from temperature
constrains on enzymatic turnover rates, because modelling
allows a comprehensive estimation of metabolite fluxes that
cannot be determined based on metabolite concentrations
when cycling and/or redundant pathways are involved.
Using modelling, it is possible to compare maximum
enzyme activities, which can be assessed experimentally in
a statistically robust manner, with rates of metabolite
interconversion, which are difficult to determine experimen-
tally. To identify steps in central carbohydrate metabolism
that may create bottlenecks at low temperatures, we calcu-
lated metabolic flux rates based on kinetic parameters
identified in the model simulation, and compared these flux
rates with activities of rate-limiting enzymes involved in
carbohydrate metabolism. Enzyme activities catalysing hex-
ose phosphorylation and raffinose degradation displayed
similar diurnal profiles in all three accessions. Significant
differences occurred for SPS, invertase and raffinose syn-
thase. At 4�C, the capacity for raffinose synthesis was
highest in Rsch, showing up to tenfold higher rates than
C24, and was intermediate in Col (Figure 3). Although
raffinose does not appear to contribute to protection of the
plasma membrane during freeze–thaw cycles (Zuther et al.,
2004), stabilization of the photosynthetic machinery has
been shown to play a physiological role in cold tolerance
(Knaupp et al., 2011). It has been demonstrated that, under
various abiotic stress conditions, raffinose synthesis is
stimulated by an elevation of galactinol synthase activity,
which provides the substrate for raffinose synthase (Taji
et al., 2002). Indeed, concentrations of the precursors
sucrose and galactinol were elevated in Rsch, and, under
conditions of low raffinose synthase activity, high substrate
concentrations may bring about raffinose accumulation via
high saturation of the enzyme.
Over-expression of SPS, which catalyses the rate-limiting
step of sucrose synthesis in leaves of Arabidopsis, was
demonstrated to increase freezing tolerance in the accession
Columbia (Strand et al., 2003). Consistently, we found that
differences in SPS activity contribute to the differential cold
tolerance of natural accessions of Arabidopsis, with the
cold-tolerant accession Rsch having significantly elevated
SPS activity during the entire diurnal cycle compared to C24
at 4�C (Figure 8). However, in contrast to SPS enzyme
activities, flux rates of sucrose synthesis calculated on the
basis of model simulations did not differ in cold-acclimated
plants of C24, Col and Rsch because of similar rates of net
photosynthesis and starch formation, leading to similar
concentrations of hexose phosphates, which represent the
substrate pool for sucrose synthesis. This demonstrates
that, although metabolite levels differ between cold-sensi-
tive and cold-tolerant accessions after 14 days of cold
acclimation, the metabolic dynamics are similar and appar-
ently do not correlate with cold tolerance. This is not
surprising given that all accessions are chilling-tolerant
and are able to establish a metabolic homeostasis that
enables them to grow at non-freezing temperatures. How-
ever, this finding does not exclude physiological implica-
tions of the observed difference in maximum SPS activities
of cold-sensitive and tolerant accessions. As already men-
tioned above, a high capacity of SPS would help to avoid
metabolic bottlenecks occurring under rapidly changing
environmental conditions. When sucrose synthesis
becomes limiting, phosphate limitation of triose phosphate
export from the plastids will result, and this must be
compensated for by increased starch synthesis in order to
prevent a collapse of the Calvin–Benson cycle (Poolman
et al., 2000). When starch metabolism cannot compensate
for insufficient export of triose phosphates because of low
ambient temperature, linear electron transport is impaired
(Schneider et al., 2002), and this in turn will result in a redox
disequilibrium and potentially in production of reactive
oxygen species. It has been demonstrated for Chlamydo-
monas reinhardtii that a slow down of the Calvin–Benson
cycle enhances the extent of photoinactivation of photosys-
tem II (Takahashi and Murata, 2005). This also occurs during
exposure to high light, which again causes generation of
reactive oxygen species that inhibit the repair of or
even inactivate the reaction center of photosystem II
(Murata et al., 2007). Our model simulations yielded kinetic
Per
oxid
ase
activ
ity[U
min
gFW
]–1
–1
A B C D0
20
40
60
80
100
Figure 9. Peroxidase activity as a function of temperature and irradiance in
C24 and Rsch.
Peroxidase activity was determined for C24 (black bars) and Rsch (grey bars)
at an irradiance of 50/200 lmol m)2 sec)1 at 4�C (a, b) and )4�C (c, d). The
asterisk indicates significantly different peroxidase activity in C24 and Rsch
(P < 0.01).
A metabolic bottleneck for cold acclimation 9
ª 2012 The AuthorsThe Plant Journal ª 2012 Blackwell Publishing Ltd, The Plant Journal, (2012), doi: 10.1111/j.1365-313X.2012.05064.x
parameters for sucrose synthesis in C24 and Rsch that
predicted a possible enzymatic constraint at )4�C for C24 but
not Rsch. To analyse whether the predicted higher suscep-
tibility of cold-acclimated C24 plants to an overload of
photosynthetic input at low temperature could be verified
experimentally, cold-acclimated C24 and Rsch plants, which
represented the extremes of cold tolerance in this study,
were exposed to a temperature that, according to thermo-
dynamic properties, should override the capacity for sucrose
synthesis in C24, thus imposing a redox imbalance. We did
indeed determine a redox disequilibrium based on induction
of peroxidase activity in C24 at a temperature of )4�C and a
light intensity of 200 lmol m)2 sec)1, thus verifying model
predictions. It is interesting to note that a critical tempera-
ture of )4�C was also calculated for C24 based on an
independent method, i.e. fluorescence analysis of photo-
system II function (Mishra et al., 2011). In that study it was
demonstrated that, at )4�C, fluorescence transients of C24
and the tolerant accession Tenela vary significantly, again
indicating a disequilibrium of primary and secondary reac-
tions of photosynthesis in C24 at this temperature. However,
the critical temperature calculated for Rsch ()15�C) could not
be tested, because photosynthetic light reactions are com-
pletely abolished at that temperature and absorbed quanta
are disipated by fluorescence (Mishra et al., 2011). This
implies that, because of the higher enzymatic capacity, Rsch
would not encounter a metabolic limitation imposed by
sucrose synthesis.
Based on experimental results and model simulations, we
therefore conclude that a central feature of cold-tolerant
accessions of Arabidopsis is their ability to avoid bottlenecks
in central carbohydrate metabolism caused by rapid
changes of environmental conditions.
EXPERIMENTAL PROCEDURES
Plant material
Arabidopsis thaliana plants of the accessions used in this study weregrown in a 1:1 mixture of GS90 soil and vermiculite (Gebr. PatzerGmbH, www.einheitserde.de). Three plants each were raised in10 cm pots in a growth chamber under 8 h light (50 lmol m)2 sec)1;22�C)/16 h dark (16�C) for 4 weeks, and then transferred to a green-house with a temperature of 22�C during the day (16 h) and 16�Cduring the night (8 h). In the greenhouse, natural light was supple-mented to an intensity of at least 80 lmol m)2 sec)1. The relativehumidity was 70%. Plants were watered daily and fertilized every2 weeks with standard nitrogen/phosphorus/potassium fertilizer.After 42 days, a set of plants was harvested. Leaf samples consistingof one or two rosette leaves (corresponding to approximately100 mg fresh weight) were randomly taken from nine individualplants grown in three different pots every 4 h during a full day.
Another set of greenhouse-grown plants was shifted after42 days to a growth chamber with a 16 h/8 h light/dark phase at4�C, and a light intensity of 50 lmol m)2 sec)1 for 14 days prior toharvesting. Leaf samples were then taken as described above.
At harvesting, the aerial part of the plant was exclusivelycomposed of rosette leaves, allowing direct comparison ofmetabolite with CO2 exchange data. Leaf samples were weighed,
immediately frozen in liquid nitrogen and stored at )80�C untilfurther processing.
Gas exchange measurement
Exchange rates of CO2 were measured using an infra-red gas anal-ysis system (Uras 3 G, Hartmann & Braun AG, Hartmann & BraunAG, www.abb.com). A whole-rosette cuvette design was used asdescribed by Nagele et al. (2010). Gas exchange was measured inthe respective growth chambers shortly before plant harvest.Means of raw data for gas exchange were converted to flux rates perg FW (obtained at the end of the exposure by weighing completerosettes). Experiments were repeated three times for each accessionand condition.
Analysis of metabolite concentrations
Frozen leaf samples were homogenized using an MM20 ball mill(Retsch, Retsch GmbH, www.retsch.de). The homogenate wasextracted twice in 400 ll of 80% ethanol at 80�C. Extracts were thendried and dissolved in 500 ll water. Contents of glucose, fructose,sucrose and raffinose, as well as galactose, galactinol and meli-biose, were analysed via high-performance anion exchange chro-matography (HPAEC). A CarboPac PA1 column (glucose, fructose,sucrose, raffinose) or CarboPac MA1 column (galactose, galactinol,melibiose) on a DX-500 gradient chromatography system (Dionex,Sunnyvale, CA, USA, www.dionex.com) coupled with pulsedamperometric detection by a gold electrode was applied.
For starch extraction, pellets from the ethanol extraction weresolubilized by incubation in 0.5 M NaOH at 95�C for 30 min. Afteracidification with 1 M CH3COOH, the suspension was digested withamyloglucosidase for 2 h at 55�C. The glucose content of thesupernatant that was subsequently used to assess the starchcontent of the sample was determined as described below.
Glucose-6-phosphate and fructose-6-phosphate were measuredas described previously (Jelitto et al., 1992; Gibon et al., 2002).
Measurement of enzyme activities
Enzyme activities were determined in crude extracts of leaf samples.For determination of the activities of soluble acid invertase and
neutral invertase as well as cell wall-bound invertase, frozen leaftissue was homogenized in 50 mM HEPES/KOH (pH 7.4), 5 mM
MgCl2, 1 mM EDTA, 1 mM EGTA, 1 mM phenylmethanesulfonylfluoride, 0.1% Triton X-100 and 10% glycerol. Suspensions werecentrifuged for 25 min at 17 000 g and 4�C. The supernatants wereused to determine acid and neutral invertase activities as previouslydescribed (Nagele et al., 2010).
Activity of sucrose phosphate synthase (SPS) was determined inhomogenates of frozen leaf tissue in 50 mM HEPES/KOH (pH 7.5),15 mM MgCl2, 1 mM EDTA, 2.5 mM dithiothreitol, 1 mM phen-ylmethanesulfonyl fluoride and 0.1% Triton X-100. Suspensions werecentrifuged at 17 000 g and 4�C for 5 min. SPS activity was assayed insupernatants as described previously (Nagele et al., 2010).
Activity of glucokinase and fructokinase was measured asdescribed previously (Wiese et al., 1999) at ambient temperature(22�C) and 4�C.
Activity of raffinose synthase and melibiase was determined inhomogenates of frozen leaf tissue in 50 mM HEPES/KOH (pH 7.5),5 mM MgCl2, 1 mM EDTA, 0.1% Triton X-100, 1 mM phen-ylmethanesulfonyl fluoride and 0.5 mM dithiothreitol. Suspensionswere centrifuged at 17 000 g and 4�C for 5 min. Four volumes of50 mM HEPES/KOH (pH 7.5), 5 mM MgCl2, 25 mM sucrose, 25 mM
galactinol and 0.5 mM dithiothreitol (raffinose synthase), or 50 mM
citrate phosphate buffer (pH 5.0), 5 mM MgCl2, 25 mM melibioseand 0.5 mM dithiothreitol (melibiase), were added to samples. After
10 Thomas Nagele et al.
ª 2012 The AuthorsThe Plant Journal ª 2012 Blackwell Publishing Ltd, The Plant Journal, (2012), doi: 10.1111/j.1365-313X.2012.05064.x
incubation for 20 h at 30�C or 48 h at 4�C, the reaction was stoppedby adding 500 ll 100% ethanol. Controls were stopped directly afteraddition of the extract. The samples were dried and dissolved in500 ll water. The changes in myo-inositol (in the case of raffinosesynthase) and galactose (melibiase) contents were analysed viaHPAEC on a DX-500 gradient chromatography system using aCarboPac MA1 column as described above.
Activity of peroxidase was determined in homogenates of frozenleaf tissue in phosphate buffer (pH 7). Homogenates were centri-fuged at 1500 g and 4�C for 10 min and 500 ll of the supernatantwas incubated with 250 ll of 1% v/v guaiacol. The reaction wasstarted by addition of 125 ll of 0.066% v/v H2O2, and the change inabsorption was determined photometrically at 470 nm for 10 min.
Mathematical modelling, parameter identification and
simulation
A mathematical model was developed, representing the centralsucrose and raffinose metabolism in leaves of Arabidopsis thaliana.The model was based on the following system of ordinary differ-ential equations describing time-dependent alterations in carbohy-drate pools and the rate of carbohydrate export to sink organs andother metabolic pathways:
d
dtðHPÞ ¼ 1
6
� �r1 � r2a � 2r3 þ r7 þ r8 � r10 þ r12 � br2b ð1Þ
d
dtðSucÞ ¼ r3 � r4 � r6 �
1
2r9 þ r5a ð2Þ
d
dtðRafÞ ¼ r4 � r5a � r5b ð3Þ
d
dtðGlcÞ ¼ r6 � r7 þ r11 � ar2b ð4Þ
d
dtðFrcÞ ¼ r6 � r8 þ r5b ð5Þ
d
dtðGalÞ ¼ r11 þ r5a � r12 ð6Þ
d
dtðGolÞ ¼ r10 � r4 ð7Þ
d
dtðMelÞ ¼ r5b � r11 ð8Þ
d
dtðStarchÞ ¼ r2a þ r2b ð9Þ
d
dtðSinksÞ ¼ r9: ð10Þ
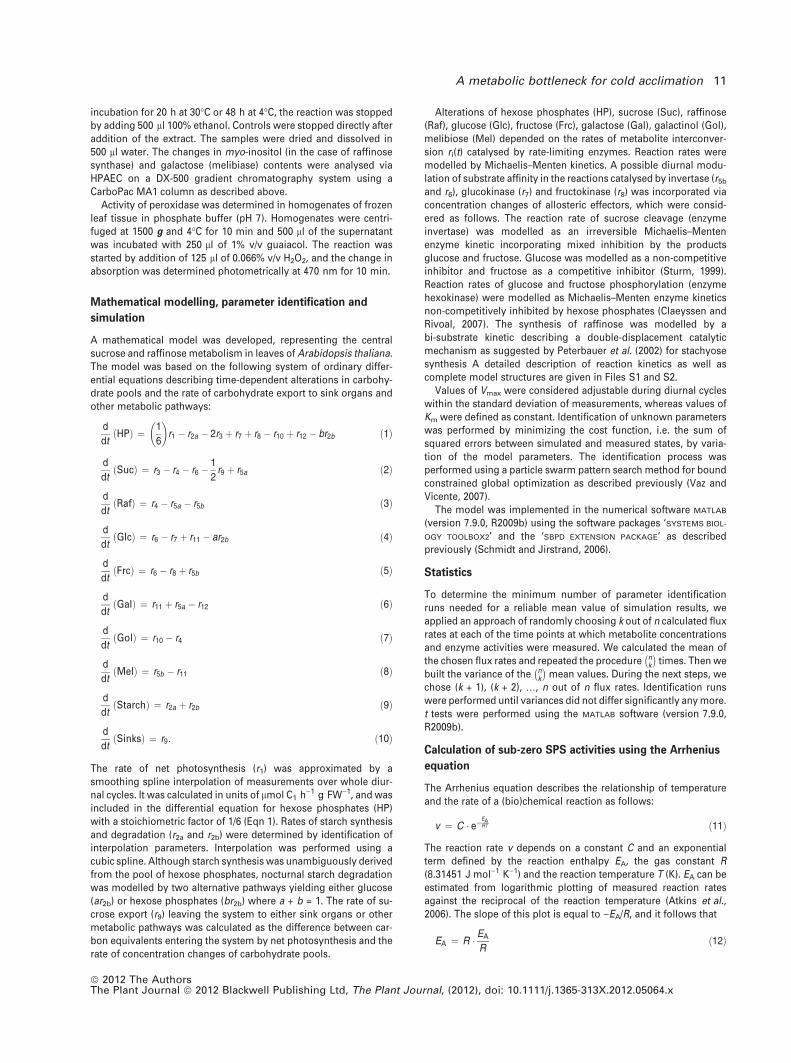
The rate of net photosynthesis (r1) was approximated by asmoothing spline interpolation of measurements over whole diur-nal cycles. It was calculated in units of lmol C1 h)1 g FW)1, and wasincluded in the differential equation for hexose phosphates (HP)with a stoichiometric factor of 1/6 (Eqn 1). Rates of starch synthesisand degradation (r2a and r2b) were determined by identification ofinterpolation parameters. Interpolation was performed using acubic spline. Although starch synthesis was unambiguously derivedfrom the pool of hexose phosphates, nocturnal starch degradationwas modelled by two alternative pathways yielding either glucose(ar2b) or hexose phosphates (br2b) where a + b = 1. The rate of su-crose export (r9) leaving the system to either sink organs or othermetabolic pathways was calculated as the difference between car-bon equivalents entering the system by net photosynthesis and therate of concentration changes of carbohydrate pools.
Alterations of hexose phosphates (HP), sucrose (Suc), raffinose(Raf), glucose (Glc), fructose (Frc), galactose (Gal), galactinol (Gol),melibiose (Mel) depended on the rates of metabolite interconver-sion ri(t) catalysed by rate-limiting enzymes. Reaction rates weremodelled by Michaelis–Menten kinetics. A possible diurnal modu-lation of substrate affinity in the reactions catalysed by invertase (r5b
and r6), glucokinase (r7) and fructokinase (r8) was incorporated viaconcentration changes of allosteric effectors, which were consid-ered as follows. The reaction rate of sucrose cleavage (enzymeinvertase) was modelled as an irreversible Michaelis–Mentenenzyme kinetic incorporating mixed inhibition by the productsglucose and fructose. Glucose was modelled as a non-competitiveinhibitor and fructose as a competitive inhibitor (Sturm, 1999).Reaction rates of glucose and fructose phosphorylation (enzymehexokinase) were modelled as Michaelis–Menten enzyme kineticsnon-competitively inhibited by hexose phosphates (Claeyssen andRivoal, 2007). The synthesis of raffinose was modelled by abi-substrate kinetic describing a double-displacement catalyticmechanism as suggested by Peterbauer et al. (2002) for stachyosesynthesis A detailed description of reaction kinetics as well ascomplete model structures are given in Files S1 and S2.
Values of Vmax were considered adjustable during diurnal cycleswithin the standard deviation of measurements, whereas values ofKm were defined as constant. Identification of unknown parameterswas performed by minimizing the cost function, i.e. the sum ofsquared errors between simulated and measured states, by varia-tion of the model parameters. The identification process wasperformed using a particle swarm pattern search method for boundconstrained global optimization as described previously (Vaz andVicente, 2007).
The model was implemented in the numerical software MATLAB
(version 7.9.0, R2009b) using the software packages ‘SYSTEMS BIOL-
OGY TOOLBOX2’ and the ‘SBPD EXTENSION PACKAGE’ as describedpreviously (Schmidt and Jirstrand, 2006).
Statistics
To determine the minimum number of parameter identificationruns needed for a reliable mean value of simulation results, weapplied an approach of randomly choosing k out of n calculated fluxrates at each of the time points at which metabolite concentrationsand enzyme activities were measured. We calculated the mean ofthe chosen flux rates and repeated the procedure n
k
� �times. Then we
built the variance of the nk
� �mean values. During the next steps, we
chose (k + 1), (k + 2), …, n out of n flux rates. Identification runswere performed until variances did not differ significantly any more.t tests were performed using the MATLAB software (version 7.9.0,R2009b).
Calculation of sub-zero SPS activities using the Arrhenius
equation
The Arrhenius equation describes the relationship of temperatureand the rate of a (bio)chemical reaction as follows:
v ¼ C � e�EART ð11Þ
The reaction rate v depends on a constant C and an exponentialterm defined by the reaction enthalpy EA, the gas constant R(8.31451 J mol)1 K)1) and the reaction temperature T (K). EA can beestimated from logarithmic plotting of measured reaction ratesagainst the reciprocal of the reaction temperature (Atkins et al.,2006). The slope of this plot is equal to )EA/R, and it follows that
EA ¼ R � EA
Rð12Þ
A metabolic bottleneck for cold acclimation 11
ª 2012 The AuthorsThe Plant Journal ª 2012 Blackwell Publishing Ltd, The Plant Journal, (2012), doi: 10.1111/j.1365-313X.2012.05064.x
Using the results of enzyme activity measurements of cold-accli-mated plants at 25�C and 4�C (298.15 and 277.15 K), we calculated amean activation enthalpy of 55.25 kJ mol)1 for SPS. The reactionconstant C was then calculated for the experimentally determinedmean value of Vmax at 25�C as follows:
C ¼ Vmax
.e�
EART ð13Þ
Using these values of C and EA, we calculated SPS activities bysolving Eqn 11 for a temperature regime of 25�C (298.15 K) to )5�C(268.15 K).
ACKNOWLEDGEMENTS
We would like to thank Annika Allinger for excellent plant cultiva-tion.
SUPPORTING INFORMATION
Additional Supporting Information may be found in the onlineversion of this article:Table S1. Diurnal dynamics of identified kinetic parameters in themodel of C24, non-acclimated.Table S2. Diurnal dynamics of identified kinetic parameters in themodel of Col, non-acclimated.Table S3. Diurnal dynamics of identified kinetic parameters in themodel of Rsch, non-acclimated.Table S4. Diurnal dynamics of identified kinetic parameters in themodel of C24, cold-acclimated.Table S5. Diurnal dynamics of identified kinetic parameters in themodel of Col, cold-acclimated.Table S6. Diurnal dynamics of identified kinetic parameters in themodel of Rsch, cold-acclimated.File S1. Detailed description of the reaction kinetics.File S2. Model structure for simulation of diurnal carbohydratemetabolism in A. thaliana.Please note: As a service to our authors and readers, this journalprovides supporting information supplied by the authors. Suchmaterials are peer-reviewed and may be re-organized for onlinedelivery, but are not copy-edited or typeset. Technical supportissues arising from supporting information (other than missingfiles) should be addressed to the authors.
REFERENCES
Atkins, P.W., Trapp, C.A. and Zillgitt, M. (2006) Physikalische Chemie, 4th edn.
Weinheim, Gemany: VCH.
Claeyssen, E. and Rivoal, J. (2007) Isozymes of plant hexokinase: occurrence,
properties and functions. Phytochemistry, 68, 709–731.
Gibon, Y., Vigeolas, H., Tiessen, A., Geigenberger, P. and Stitt, M. (2002)
Sensitive and high throughput metabolite assays for inorganic pyrophos-
phate, ADPGlc, nucleotide phosphates, and glycolytic intermediates based
on a novel enzymic cycling system. Plant J. 30, 221–235.
Gilmour, S.J., Sebolt, A.M., Salazar, M.P., Everard, J.D. and Thomashow, M.F.
(2000) Overexpression of the Arabidopsis CBF3 transcriptional activator
mimics multiple biochemical changes associated with cold acclimation.
Plant Physiol. 124, 1854–1865.
Guy, C.L., Huber, J.L.A. and Huber, S.C. (1992) Sucrose phosphate synthase
and sucrose accumulation at low temperature. Plant Physiol. 100, 502–508.
Guy, C., Kaplan, F., Kopka, J., Selbig, J. and Hincha, D.K. (2008) Metabolomics
of temperature stress. Physiol. Plant. 132, 220–235.
Hannah, M.A., Wiese, D., Freund, S., Fiehn, O., Heyer, A.G. and Hincha, D.K.
(2006) Natural genetic variation of freezing tolerance in Arabidopsis. Plant
Physiol. 142, 98–112.
Janska, A., Marsık, P., Zelenkova, S. and Ovesna, J. (2010) Cold stress and
acclimation – what is important for metabolic adjustment? Plant Biol. 12,
395–405.
Jelitto, T., Sonnewald, U., Willmitzer, L., Hajirezeai, M. and Stitt, M. (1992)
Inorganic pyrophosphate content and metabolites in potato and tobacco
plants expressing E. coli pyrophosphatase in their cytosol. Planta, 188,
238–244.
Kaplan, F., Kopka, J., Sung, D.Y., Zhao, W., Popp, M., Porat, R. and Guy, C.L.
(2007) Transcript and metabolite profiling during cold acclimation of Ara-
bidopsis reveals an intricate relationship of cold-regulated gene expression
with modifications in metabolite content. Plant J. 50, 967–981.
Klotke, J., Kopka, J., Gatzke, N. and Heyer, A.G. (2004) Impact of soluble sugar
concentrations on the acquisition of freezing tolerance in accessions of
Arabidopsis thaliana with contrasting cold adaptation – evidence for a role
of raffinose in cold acclimation. Plant, Cell Environ. 27, 1395–1404.
Knaupp, M., Mishra, K.B., Nedbal, L. and Heyer, A.G. (2011) Evidence for a role
of raffinose in stabilizing photosystem II during freeze–thaw cycles. Planta,
234, 477–486.
Miroslavov, E. and Kravkina, I. (1991) Comparative analysis of chloroplasts
and mitochondria in leaf chlorenchyma from mountain plants grown at
different altitudes. Ann. Bot. 68, 195–200.
Mishra, A., Mishra, K.B., Hormiller, I.I., Heyer, A.G. and Nedbal, L. (2011)
Chlorophyll fluorescence emission as a reporter on cold tolerance in Ara-
bidopsis thaliana accessions. Plant Signal Behav. 6, 301–310.
Murata, N., Takahashi, S., Nishiyama, Y. and Allakhverdiev, S.I. (2007) Pho-
toinhibition of photosystem II under environmental stress. Biochim. Bio-
phys. Acta, 1767, 414–421.
Nagele, T., Henkel, S., Hormiller, I., Sauter, T., Sawodny, O., Ederer, M. and
Heyer, A.G. (2010) Mathematical modelling of the central carbohydrate
metabolism in Arabidopsis thaliana reveals a substantial regulatory influ-
ence of vacuolar invertase on whole plant carbon metabolism. Plant
Physiol. 153, 260–272.
Peterbauer, T., Mucha, J., Mach, L. and Richter, A. (2002) Chain elongation of
raffinose in pea seeds. Isolation, characterization, and molecular cloning of
multifunctional enzyme catalyzing the synthesis of stachyose and verbas-
cose. J. Biol. Chem. 277, 194–200.
Poolman, M.G., Fell, D.A. and Thomas, S. (2000) Modelling photosynthesis
and its control. J. Exp. Bot. 51, 319–328.
Sasaki, H., Ichimura, K., Imada, S. and Yamaki, S. (2001) Sucrose synthase and
sucrose phosphate synthase, but not acid invertase, are regulated by cold
acclimation and deacclimation in cabbage seedlings. J. Plant Physiol. 158,
847–852.
Schmidt, H. and Jirstrand, M. (2006) Systems biology toolbox for MATLAB: a
computational platform for research in systems biology. Bioinformatics,
22, 514–515.
Schneider, A., Hausler, R.E., Kolukisaoglu, U., Kunze, R., van der Graaff, E.,
Schwacke, R., Catoni, E., Desimone, M. and Flugge, U. (2002) An
Arabidopsis thaliana knock-out mutant of the chloroplast triose phosphate/
phosphate translocator is severely compromised only when starch syn-
thesis, but not starch mobilisation is abolished. Plant J. 32, 685–699.
Stitt, M. and Hurry, V. (2002) A plant for all seasons: alterations in photo-
synthetic carbon metabolism during cold acclimation in Arabidopsis. Curr.
Opin. Plant Biol. 5, 199–206.
Strand, A., Hurry, V., Gustafsson, P. and Gardestrom, P. (1997) Development
of Arabidopsis thaliana leaves at low temperatures releases the suppres-
sion of photosynthesis and photosynthetic gene expression despite the
accumulation of soluble carbohydrates. Plant J. 12, 605–614.
Strand, A., Hurry, V., Henkes, S., Huner, N., Gustafsson, P., Gardestrom, P.
and Stitt, M. (1999) Acclimation of Arabidopsis leaves developing at low
temperatures. Increasing cytoplasmic volume accompanies increased
activities of enzymes in the Calvin cycle and in the sucrose-biosynthesis
pathway. Plant Physiol. 119, 1387–1397.
Strand, A., Foyer, C.H., Gustafsson, P., Gardestrom, P. and Hurry, V. (2003)
Altering flux through the sucrose biosynthesis pathway in transgenic
Arabidopsis thaliana modifies photosynthetic acclimation at low temper-
atures and the development of freezing tolerance. Plant, Cell Environ. 26,
523–535.
Sturm, A. (1999) Invertases. Primary structures, functions, and roles in plant
development and sucrose partitioning. Plant Physiol. 121, 1–8.
Taji, T., Ohsumi, C., Iuchi, S., Seki, M., Kasuga, M., Kobayashi, M., Yamaguchi-
Shinozaki, K. and Shinozaki, K. (2002) Important roles of drought- and cold-
inducible genes for galactinol synthase in stress tolerance in Arabidopsis
thaliana. Plant J. 29, 417–426.
Takahashi, S. and Murata, N. (2005) Interruption of the Calvin cycle inhibits
the repair of photosystem II from photodamage. Biochim. Biophys. Acta
1708, 352–361.
12 Thomas Nagele et al.
ª 2012 The AuthorsThe Plant Journal ª 2012 Blackwell Publishing Ltd, The Plant Journal, (2012), doi: 10.1111/j.1365-313X.2012.05064.x
Talts, P., Parnik, T., Gardestrom, P. and Keerberg, O. (2004) Respiratory
acclimation in Arabidopsis thaliana leaves at low temperature. J. Plant
Physiol. 161, 573–579.
Vaz, A.I.F. and Vicente, L.N. (2007) A particle swarm pattern search
method for bound constrained global optimization. J. Global Optim. 39,
197–219.
Wiese, A., Groner, F., Sonnewald, U., Deppner, H., Lerchl, J., Hebbeker, U.,
Flugge, U. and Weber, A. (1999) Spinach hexokinase I is located in the
outer envelope membrane of plastids. FEBS Lett. 461, 13–18.
Xin, Z. and Browse, J. (2000) Cold comfort farm: the acclimation of plants to
freezing temperatures. Plant, Cell Environ. 23, 893–902.
Yuan, J.S., Galbraith, D.W., Dai, S.Y., Griffin, P. and Stewart, C.N. (2008) Plant
systems biology comes of age. Trends Plant Sci. 13, 165–171.
Zeeman, S.C., Smith, S.M. and Smith, A.M. (2007) The diurnal metabolism of
leaf starch. Biochem. J. 401, 13–28.
Zuther, E., Buchel, K., Hundertmark, M., Stitt, M., Hincha, D.K. and Heyer, A.G.
(2004) The role of raffinose in the cold acclimation response of Arabidopsis
thaliana. FEBS Lett. 576, 169–173.
A metabolic bottleneck for cold acclimation 13
ª 2012 The AuthorsThe Plant Journal ª 2012 Blackwell Publishing Ltd, The Plant Journal, (2012), doi: 10.1111/j.1365-313X.2012.05064.x