Embed Size (px)
Citation preview
ORIGINAL RESEARCHpublished: 19 July 2016
doi: 10.3389/fpls.2016.01044
Frontiers in Plant Science | www.frontiersin.org 1 July 2016 | Volume 7 | Article 1044
Edited by:
Shabir Hussain Wani,
Sher-e-Kashmir University of
Agricultural Sciences and Technology
of Kashmir, India
Reviewed by:
Biswapriya Biswavas Misra,
University of Florida, USA
Taras P. Pasternak,
Institute of Biology II, Germany
*Correspondence:
Henry T. Nguyen
†These authors have contributed
equally to this work.
Specialty section:
This article was submitted to
Plant Biotechnology,
a section of the journal
Frontiers in Plant Science
Received: 11 May 2016
Accepted: 04 July 2016
Published: 19 July 2016
Citation:
Chen W, Yao Q, Patil GB, Agarwal G,
Deshmukh RK, Lin L, Wang B,
Wang Y, Prince SJ, Song L, Xu D,
An YC, Valliyodan B, Varshney RK and
Nguyen HT (2016) Identification and
Comparative Analysis of Differential
Gene Expression in Soybean Leaf
Tissue under Drought and Flooding
Stress Revealed by RNA-Seq.
Front. Plant Sci. 7:1044.
doi: 10.3389/fpls.2016.01044
Identification and ComparativeAnalysis of Differential GeneExpression in Soybean Leaf Tissueunder Drought and Flooding StressRevealed by RNA-SeqWei Chen 1 †, Qiuming Yao 2†, Gunvant B. Patil 1†, Gaurav Agarwal 1, 3 †,
Rupesh K. Deshmukh 1, Li Lin 1, Biao Wang 1, 4, Yongqin Wang 1, Silvas J. Prince 1, Li Song 1,
Dong Xu 2, Yongqiang C. An 5, Babu Valliyodan 1, Rajeev K. Varshney 3 and
Henry T. Nguyen 1*
1Division of Plant Sciences, University of Missouri, Columbia, MO, USA, 2Department of Computer Science and Christopher
S. Bond Life Sciences Center, University of Missouri, Columbia, MO, USA, 3Center of Excellence in Genomics, International
Crops Research Institute for the Semi-Arid Tropics, Hyderabad, India, 4 Legume Biotechnology Laboratory, School of
Agriculture and Biology, Shanghai Jiao Tong University, Shanghai, China, 5 Plant Genetics Research Unit, Donald Danforth
Plant Science Center, US Department of Agriculture, Agricultural Research Service, Midwest Area, St. Louis, MO, USA
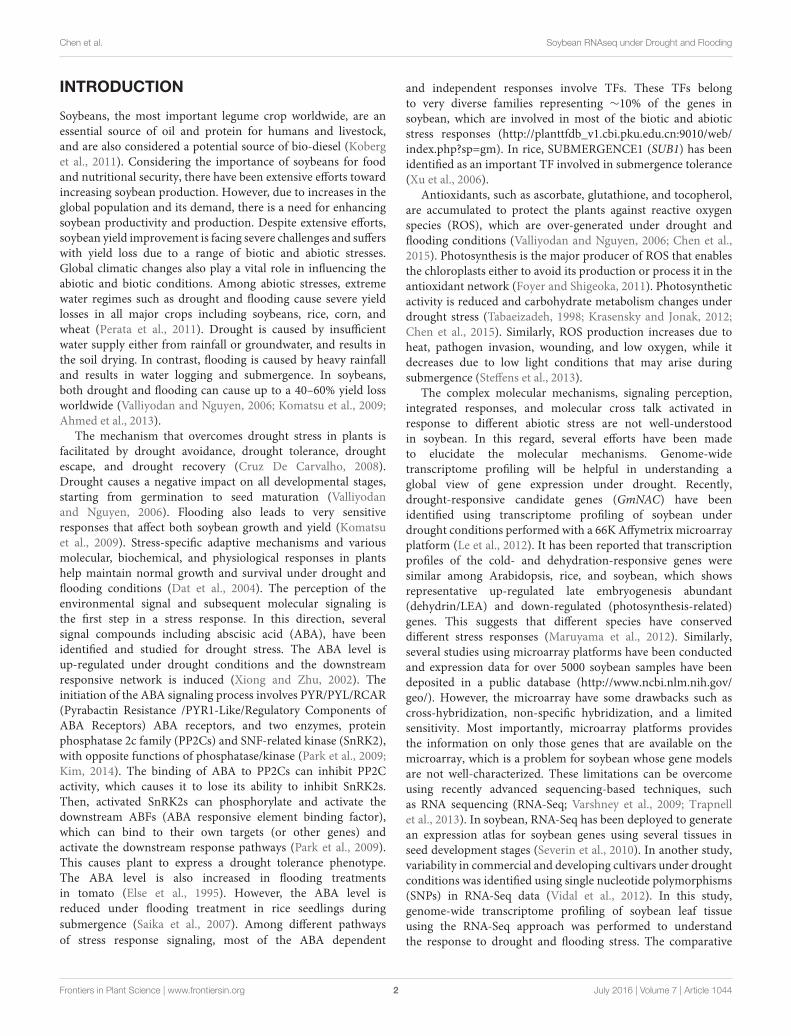
Drought and flooding are two major causes of severe yield loss in soybean worldwide. A
lack of knowledge of the molecular mechanisms involved in drought and flood stress has
been a limiting factor for the effective management of soybeans; therefore, it is imperative
to assess the expression of genes involved in response to flood and drought stress. In
this study, differentially expressed genes (DEGs) under drought and flooding conditions
were investigated using Illumina RNA-Seq transcriptome profiling. A total of 2724 and
3498 DEGs were identified under drought and flooding treatments, respectively. These
genes comprise 289 Transcription Factors (TFs) representing Basic Helix-loop Helix
(bHLH), Ethylene Response Factors (ERFs), myeloblastosis (MYB), No apical meristem
(NAC), and WRKY amino acid motif (WRKY) type major families known to be involved
in the mechanism of stress tolerance. The expression of photosynthesis and chlorophyll
synthesis related genes were significantly reduced under both types of stresses, which
limit the metabolic processes and thus help prolong survival under extreme conditions.
However, cell wall synthesis related genes were up-regulated under drought stress
and down-regulated under flooding stress. Transcript profiles involved in the starch
and sugar metabolism pathways were also affected under both stress conditions. The
changes in expression of genes involved in regulating the flux of cell wall precursors
and starch/sugar content can serve as an adaptive mechanism for soybean survival
under stress conditions. This study has revealed the involvement of TFs, transporters,
and photosynthetic genes, and has also given a glimpse of hormonal cross talk under
the extreme water regimes, which will aid as an important resource for soybean crop
improvement.
Keywords: RNA-Seq, soybean, drought, flooding, stress, gene expression
Chen et al. Soybean RNAseq under Drought and Flooding
INTRODUCTION
Soybeans, the most important legume crop worldwide, are anessential source of oil and protein for humans and livestock,and are also considered a potential source of bio-diesel (Koberget al., 2011). Considering the importance of soybeans for foodand nutritional security, there have been extensive efforts towardincreasing soybean production. However, due to increases in theglobal population and its demand, there is a need for enhancingsoybean productivity and production. Despite extensive efforts,soybean yield improvement is facing severe challenges and sufferswith yield loss due to a range of biotic and abiotic stresses.Global climatic changes also play a vital role in influencing theabiotic and biotic conditions. Among abiotic stresses, extremewater regimes such as drought and flooding cause severe yieldlosses in all major crops including soybeans, rice, corn, andwheat (Perata et al., 2011). Drought is caused by insufficientwater supply either from rainfall or groundwater, and results inthe soil drying. In contrast, flooding is caused by heavy rainfalland results in water logging and submergence. In soybeans,both drought and flooding can cause up to a 40–60% yield lossworldwide (Valliyodan and Nguyen, 2006; Komatsu et al., 2009;Ahmed et al., 2013).
The mechanism that overcomes drought stress in plants isfacilitated by drought avoidance, drought tolerance, droughtescape, and drought recovery (Cruz De Carvalho, 2008).Drought causes a negative impact on all developmental stages,starting from germination to seed maturation (Valliyodanand Nguyen, 2006). Flooding also leads to very sensitiveresponses that affect both soybean growth and yield (Komatsuet al., 2009). Stress-specific adaptive mechanisms and variousmolecular, biochemical, and physiological responses in plantshelp maintain normal growth and survival under drought andflooding conditions (Dat et al., 2004). The perception of theenvironmental signal and subsequent molecular signaling isthe first step in a stress response. In this direction, severalsignal compounds including abscisic acid (ABA), have beenidentified and studied for drought stress. The ABA level isup-regulated under drought conditions and the downstreamresponsive network is induced (Xiong and Zhu, 2002). Theinitiation of the ABA signaling process involves PYR/PYL/RCAR(Pyrabactin Resistance /PYR1-Like/Regulatory Components ofABA Receptors) ABA receptors, and two enzymes, proteinphosphatase 2c family (PP2Cs) and SNF-related kinase (SnRK2),with opposite functions of phosphatase/kinase (Park et al., 2009;Kim, 2014). The binding of ABA to PP2Cs can inhibit PP2Cactivity, which causes it to lose its ability to inhibit SnRK2s.Then, activated SnRK2s can phosphorylate and activate thedownstream ABFs (ABA responsive element binding factor),which can bind to their own targets (or other genes) andactivate the downstream response pathways (Park et al., 2009).This causes plant to express a drought tolerance phenotype.The ABA level is also increased in flooding treatmentsin tomato (Else et al., 1995). However, the ABA level isreduced under flooding treatment in rice seedlings during
submergence (Saika et al., 2007). Among different pathways
of stress response signaling, most of the ABA dependent
and independent responses involve TFs. These TFs belongto very diverse families representing ∼10% of the genes insoybean, which are involved in most of the biotic and abioticstress responses (http://planttfdb_v1.cbi.pku.edu.cn:9010/web/index.php?sp=gm). In rice, SUBMERGENCE1 (SUB1) has beenidentified as an important TF involved in submergence tolerance(Xu et al., 2006).
Antioxidants, such as ascorbate, glutathione, and tocopherol,are accumulated to protect the plants against reactive oxygenspecies (ROS), which are over-generated under drought andflooding conditions (Valliyodan and Nguyen, 2006; Chen et al.,2015). Photosynthesis is the major producer of ROS that enablesthe chloroplasts either to avoid its production or process it in theantioxidant network (Foyer and Shigeoka, 2011). Photosyntheticactivity is reduced and carbohydrate metabolism changes underdrought stress (Tabaeizadeh, 1998; Krasensky and Jonak, 2012;Chen et al., 2015). Similarly, ROS production increases due toheat, pathogen invasion, wounding, and low oxygen, while itdecreases due to low light conditions that may arise duringsubmergence (Steffens et al., 2013).
The complex molecular mechanisms, signaling perception,integrated responses, and molecular cross talk activated inresponse to different abiotic stress are not well-understoodin soybean. In this regard, several efforts have been madeto elucidate the molecular mechanisms. Genome-widetranscriptome profiling will be helpful in understanding aglobal view of gene expression under drought. Recently,drought-responsive candidate genes (GmNAC) have beenidentified using transcriptome profiling of soybean underdrought conditions performed with a 66K Affymetrix microarrayplatform (Le et al., 2012). It has been reported that transcriptionprofiles of the cold- and dehydration-responsive genes weresimilar among Arabidopsis, rice, and soybean, which showsrepresentative up-regulated late embryogenesis abundant(dehydrin/LEA) and down-regulated (photosynthesis-related)genes. This suggests that different species have conserveddifferent stress responses (Maruyama et al., 2012). Similarly,several studies using microarray platforms have been conductedand expression data for over 5000 soybean samples have beendeposited in a public database (http://www.ncbi.nlm.nih.gov/geo/). However, the microarray have some drawbacks such ascross-hybridization, non-specific hybridization, and a limitedsensitivity. Most importantly, microarray platforms providesthe information on only those genes that are available on themicroarray, which is a problem for soybean whose gene modelsare not well-characterized. These limitations can be overcomeusing recently advanced sequencing-based techniques, suchas RNA sequencing (RNA-Seq; Varshney et al., 2009; Trapnellet al., 2013). In soybean, RNA-Seq has been deployed to generatean expression atlas for soybean genes using several tissues inseed development stages (Severin et al., 2010). In another study,variability in commercial and developing cultivars under droughtconditions was identified using single nucleotide polymorphisms(SNPs) in RNA-Seq data (Vidal et al., 2012). In this study,genome-wide transcriptome profiling of soybean leaf tissueusing the RNA-Seq approach was performed to understandthe response to drought and flooding stress. The comparative
Frontiers in Plant Science | www.frontiersin.org 2 July 2016 | Volume 7 | Article 1044
Chen et al. Soybean RNAseq under Drought and Flooding
analysis has enabled us to understand molecular responsesagainst the extreme water availability conditions.
MATERIALS AND METHODS
Plant Material and Stress ConditionsSoybean (William 82 genotype) plants were grown in 26.5 Lpots with a dimension of 30 × 27 × 37 cm (top diameter ×
bottom diameter × height), filled with a mixture of turfaceand sand (2:1). Osmocote (Scotts Co., Marysville, OH) witha nutrient content of N:P2O5:K2O = 14:14:14 was added asa nutrient source at a rate of 20 g per pot. The plants weregrown in a well-watered conditions [up to vegetative (V4) stage]under a 16 h photoperiod (∼10,200 lux) at 28◦C. Droughtstress was imposed by withdrawing water for 7 days, whileflooding stress was imposed by placing the pots into a biggerpot with a trashcan liner filled up to a water level of 4 cmabove the soil surface for 7 days. After 7 days of treatment,all the leaves (irrespective of their response to stress) weresampled from the drought and flood treatments and controlplants for RNA sequencing and real-time PCR analysis. Thesoil moisture was measured after the stress imposition inthe drought experiment using a PR2 moisture probe (DeltaT, UK).
RNA Isolation and Library PreparationThe total RNA was extracted using RNeasy Plant MiniKit (Qiagen, Valencia, CA) and on-column DNase digestionwas performed according to manufacturer’s protocol. Theconcentration and quality of RNA were checked by a Nanodrop1000 (Grand Island, NY) and by running the product onan agarose gel. The RNA-Seq libraries were prepared using aTruSeq Stranded mRNA LT Sample Prep Kit—Set A (Catalog#: RS-122-2101, Illumina, USA) according to the manufacturer’sinstructions. Three biological replicates were used for RNA-Seqand real-time PCR analysis.
Quality Filtering and Mapping of RNA-SeqReadsThe single end RNA-Seq reads were generated on the IlluminaGenome Analyzer (San Diego, CA) platform. The processingof the initial reads was performed using the Illumina analysispipeline (in the Fastq format) using custom and defaultparameters. Additional filtering was performed by removingadaptor sequences and low quality bases. To facilitate the readmapping, the Glycine max reference genome (Gmax1.1version)was indexed by Bowtie (http://www.phytozome.net; Langmeadand Salzberg, 2012). The read mapping was performed usingthe Tophat software package (Trapnell et al., 2009; Kimet al., 2013). The reads were first mapped directly to thegenome using indexing and then some of the unmappedreads were resolved by identifying novel splicing events. Twomismatched base pairs were allowed and the multiple positionmatching was reported up to 40 alignments using the Tophatmapping procedure. The transcriptome raw sequencing datafrom this study have been submitted on the NCBI (http://
www.ncbi.nlm.nih.gov/) database as individual BioProjects:PRJNA324522.
Sequence Assembly and DifferentialCountingThe binary read alignment files were used as input to Cufflinks(Trapnell et al., 2009), which assembled the reads into transfrags(transcripts). The estimated gene abundance was then measuredin terms of the fragments per kilobase of transcript permillion mapped reads (FPKM). The differentially expressedgenes (DEGs) between the two sets of samples were identifiedusing cuffdiff. The significant up-regulated and down-regulatedgene lists were obtained for the drought and flood samples,respectively. Only the genes with a log2 fold change ≥ +2 and≤ −2, but without infinite values and a FDR adjusted p ≤ 0.05after Benjamini-Hochberg correction for multiple-testing withsignificance level “yes,” were considered as significantly DEGs.
Functional Annotation and Gene Ontology(GO) EnrichmentThe DEGs were annotated for gene ontology (GO) terms(Ashburner et al., 2000) and categorized into Molecular Function(MF), Cellular Component (CC), and Biological Process (BP)categories. A gene enrichment test was then performed on eachof the gene lists to obtain the significant terms. Fisher’s exact test,which is based on the hypergeometric distribution, was used tocalculate the p-value. The TreeView (http://jtreeview.sourceforge.net/docs/overview.html) program was used to draw the heatmapof the significant DEGs in response to drought and flood stress.
Pathways and TF Identification andAnalysisThe drought and flood responsive pathways were identified andplotted using MapMan (Usadel et al., 2009). Multiple biologicalor metabolic pathways were plotted together with the mappedgene intensity of the fold change (≥ +2 and ≤ −2) bya blue and red schema. The TFs and transcription relatedgenes were also mapped and plotted by MapMan. A moredetailed TF family annotation was obtained from plantTFDB(Jin et al., 2014).
Analysis of Cis-Motif PatternUsing the collection of the motif sequences from the “Database ofPlant Cis-acting Regulatory DNA Elements” (Higo et al., 1999),the 3 kb upstream of the 5′ translation start base was searchedfor all of the annotated soybean genes (phytozome v9.1). Thenumber of genes was counted for each matched motif (genecount) and the total number of matches to all of the genes by eachmotif (hit count). Furthermore, counts from the subset of genesin each of the gene sets with all the genes were compared usingFisher’s test. Any of the comparisons with a p ≤ 0.05 is presentedin Supplementary Tables 3A,B.
cDNA Synthesis and qPCRTotal RNA was extracted from each sample using the QiagenRNeasy mini kit (Qiagen, CA, USA).
Frontiers in Plant Science | www.frontiersin.org 3 July 2016 | Volume 7 | Article 1044
Chen et al. Soybean RNAseq under Drought and Flooding
The first strand cDNA from 1µg of total RNA wassynthesized using the EcoDry premix (Clontech, CA, USA),following the manufacturer’s instructions. QuantitativePCR (qPCR) was performed using 10-fold diluted cDNAproduct in a 10µL reaction volume using the Maxima SYBRGreen/ROX qPCR Master Mix (Thermo, Waltham, MA, USA)on ABI7900HT detection system (Foster City, CA, USA).Three biological replicates and two technical replicates wereused for analysis. The PCR was performed using two-stepcycling protocol as follows: 50◦C for 2min; 95◦C for 10min,followed by 40 cycles of 95◦C for 15 s, and 60◦C for 1min(https://www.thermofisher.com/order/catalog/product/K0221).To normalize the gene expression, Actin (Glyma18g52780) wasselected as a housekeeping gene. All the primers were designedusing QuantPrime software (http://www.quantprime.de)(Supplementary Table 5).
RESULTS
Drought and Flood TreatmentThree biological replications were subjected to well-watered,drought, and flooding conditions at the V4 growth stage. Soilmoisture, the major limiting factor used to impose droughtstress on growing plants (Else et al., 1995), and was measuredbefore and after the drought treatment. The soil moisture ofthe well-watered plant was 19% and was reduced to 10% after7 days of drought treatment; the plants showed symptoms ofleaf wilting. The degree of drought and flooding was determinedby monitoring the canopy temperature. The canopy temperature(◦F) increased from 76.8 ± 1.03 in normal conditions to 85.7 ±
4.42 and 79.4± 1.06 under the drought and flooding conditions,respectively.
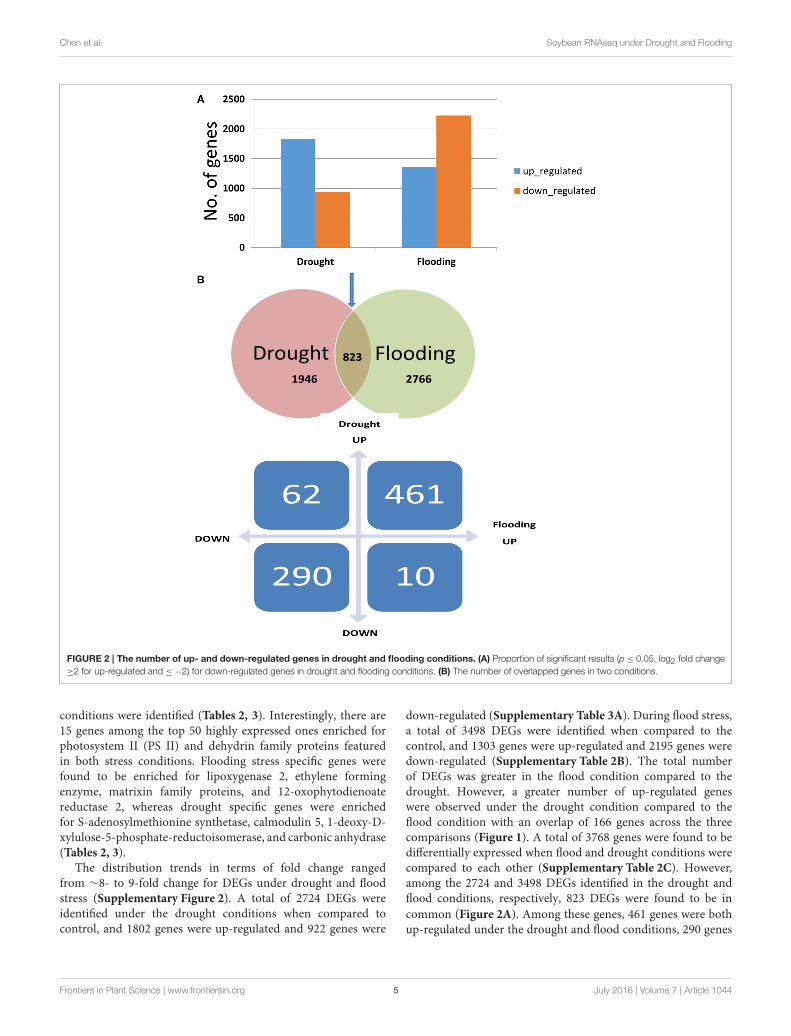
Mapping and Differential Gene ExpressionAnalysis under Drought and FloodingStressesThe RNA samples from the soybean leaves under thecontrol/drought/flooding conditions were used for sequencingby the Illumina Genome Analyzer. Approximately 28 millionreads were generated from each sample (Table 1). The RNA-Seq
analysis workflow is shown in Supplementary Figure 1 and wasutilized for the data analysis. Approximately 72% of the readswere mapped to the soybean reference genome and ∼2.5 to 4million reads were mapped to multiple regions (Table 1).
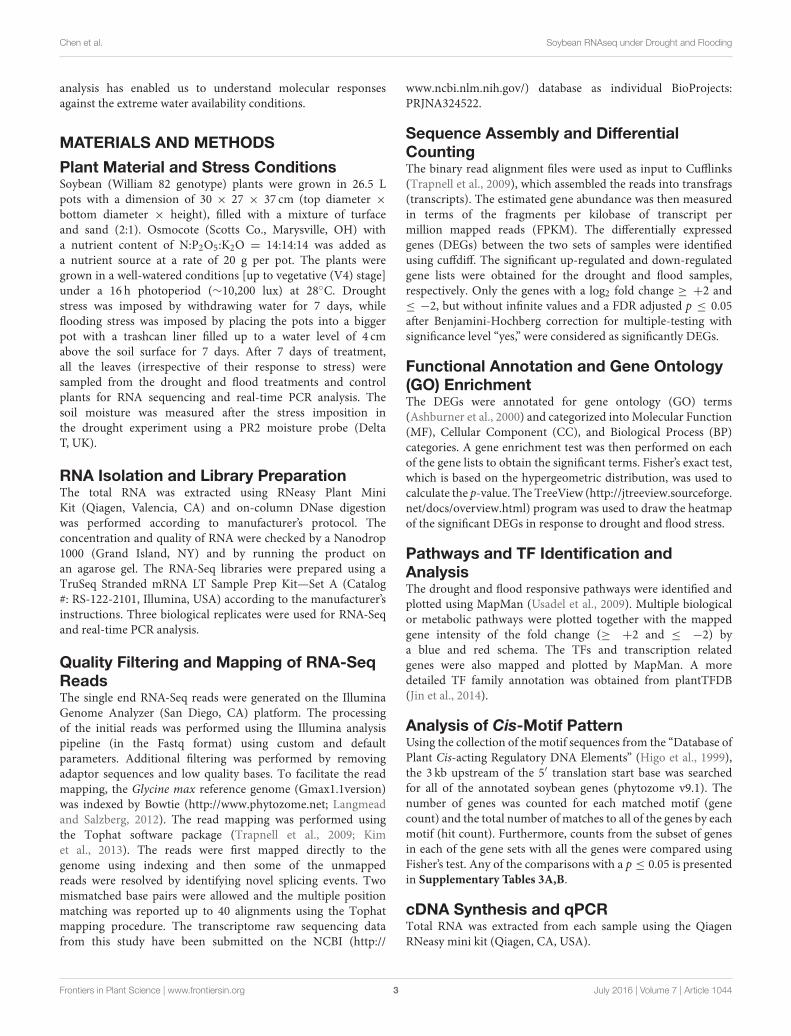
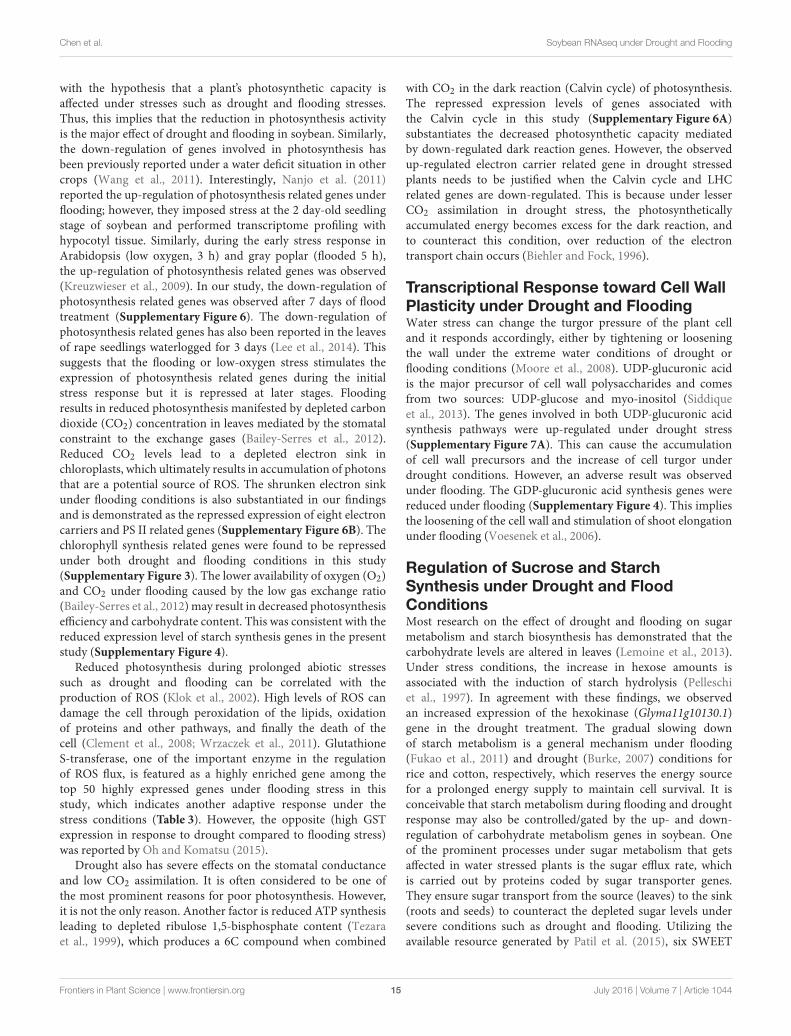
To quantify and identify the genes, a core set of DEGs underdrought and flood stress in soybean were examined. High-throughput RNA-sequencing analysis using Cufflinks pipeline(Trapnell et al., 2012) was performed in the following threecombinations: (i) control vs. drought, (ii) control vs. flood,and (iii) drought vs. flood. The DEGs specific to and commonbetween the stresses were also identified (Figures 1,2). A totalof 36,968 and 37,434 genes with confident expression in droughtand flood conditions, respectively, when compared to the control(Supplementary Tables 1A,B). Out of these genes, 36,239 werefound to be common between the two conditions. The top 50genes with >500 FPKM featured in the drought and flooding
FIGURE 1 | Venn diagram representing the specific and common DEGs
across the control vs. drought, control vs. flooding, and drought vs.
flooding conditions.
TABLE 1 | Summary of RNA-Seq performed for soybean leaf tissue under drought and flooding stress.
Sample Total Reads Quality filtered reads Uniquely mapped reads Reads mapped to multiple locations Mapping Percent
Control_1 27,470,734 22,533,545 18,217,703 4,315,842 82
Control_2 29,705,720 21,254,999 17,447,699 3,807,300 72
Control_3 32,696,775 22,237,043 18,229,771 4,007,272 68
Drought_1 29,776,776 20,561,721 17,183,917 3,377,804 69
Drought_2 27,160,782 19,116,753 15,740,184 3,376,569 70
Drought_3 28,346,623 19,109,060 15,816,488 3,292,572 67
Flooding_1 25,775,222 18,061,225 15,149,722 2,911,503 70
Flooding_2 22,153,965 16,464,017 13,815,533 2,648,484 74
Flooding_3 28,307,353 20,646,668 17,299,235 3,347,433 73
Average 27,932,661 19,998,337 16,544,472 3,453,864 72
Frontiers in Plant Science | www.frontiersin.org 4 July 2016 | Volume 7 | Article 1044
Chen et al. Soybean RNAseq under Drought and Flooding
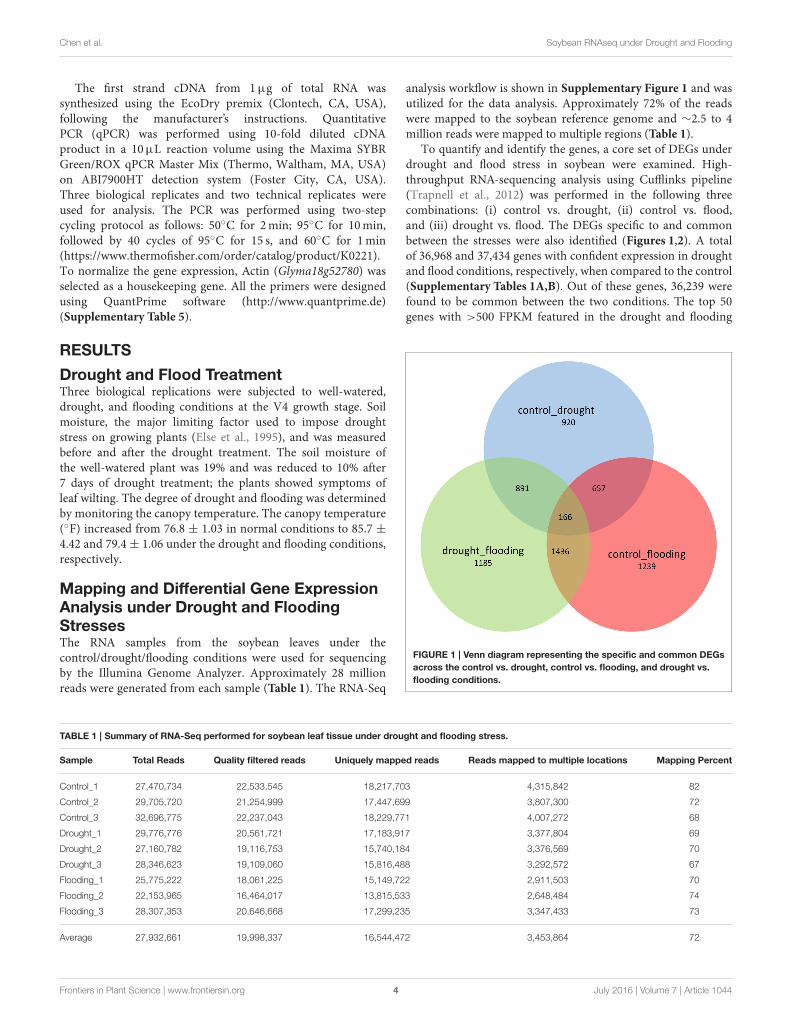
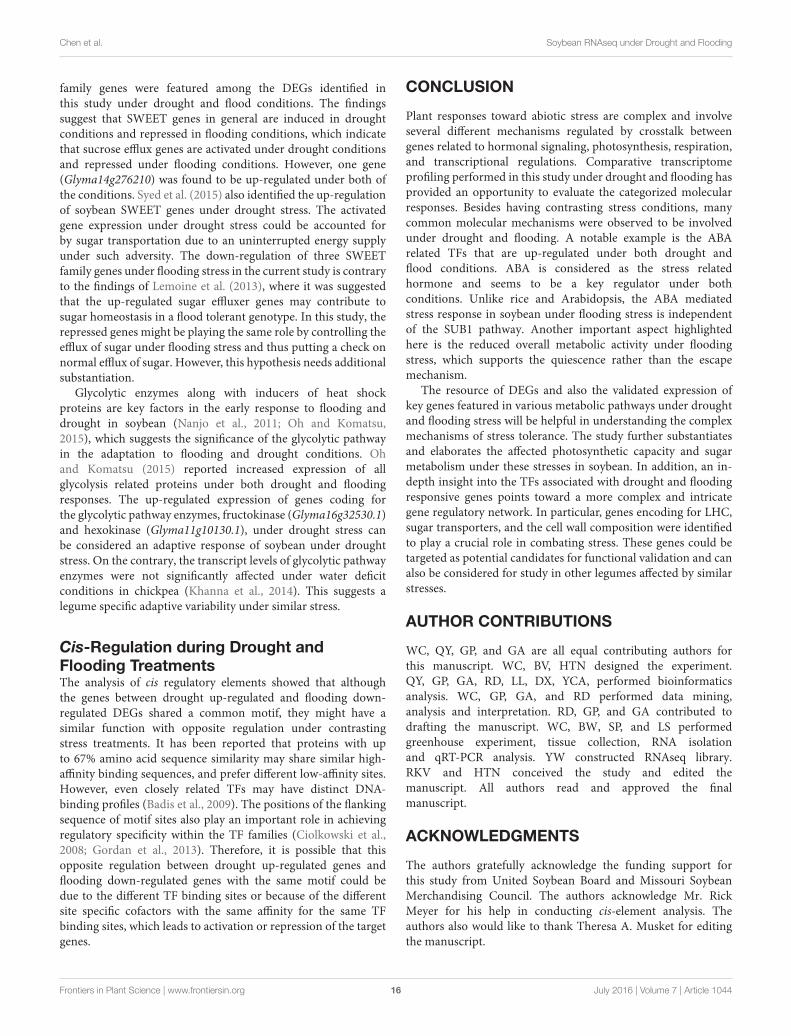
FIGURE 2 | The number of up- and down-regulated genes in drought and flooding conditions. (A) Proportion of significant results (p ≤ 0.05, log2 fold change
≥2 for up-regulated and ≤ −2) for down-regulated genes in drought and flooding conditions. (B) The number of overlapped genes in two conditions.
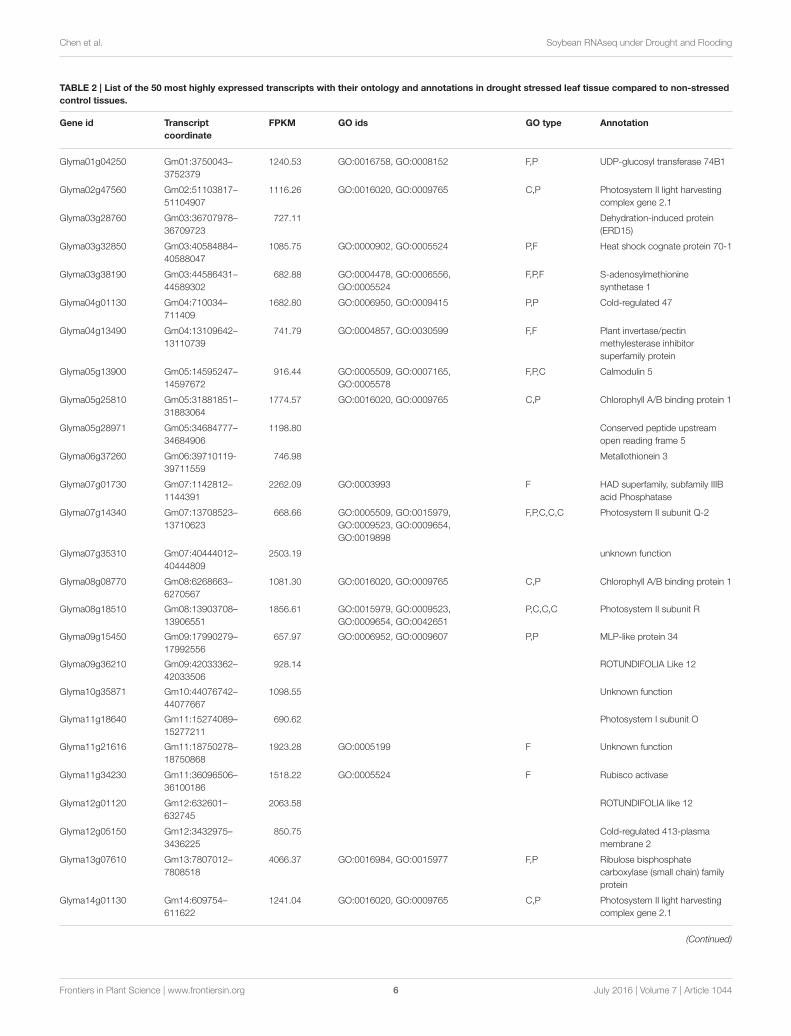
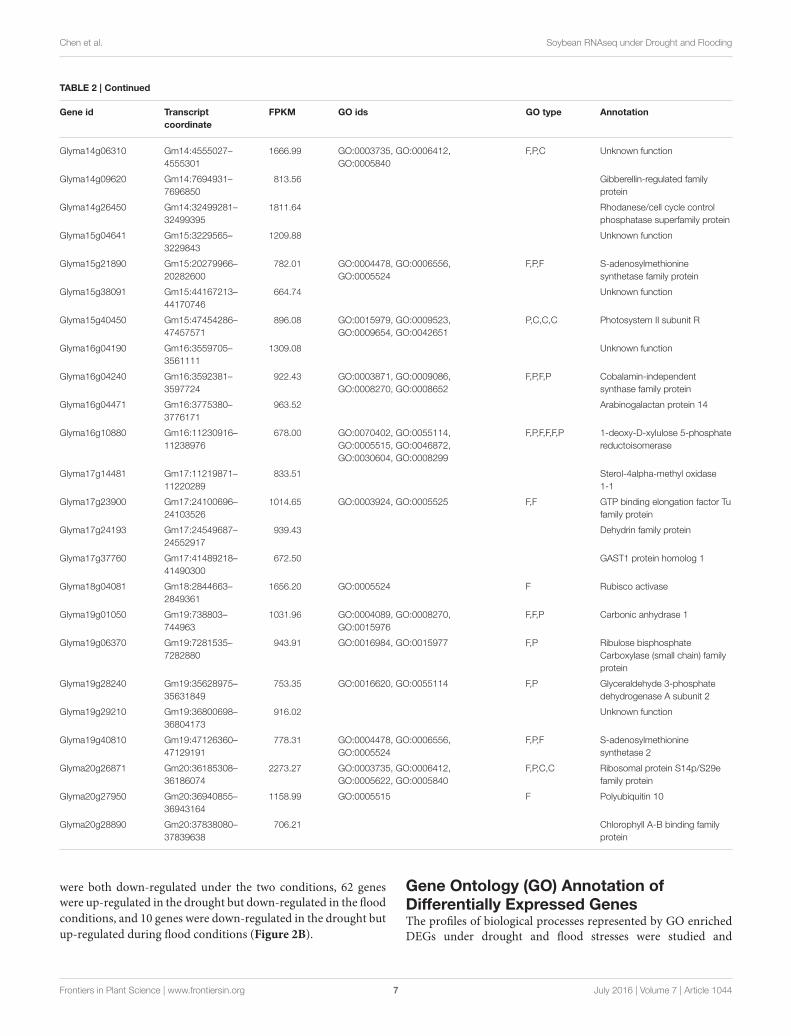
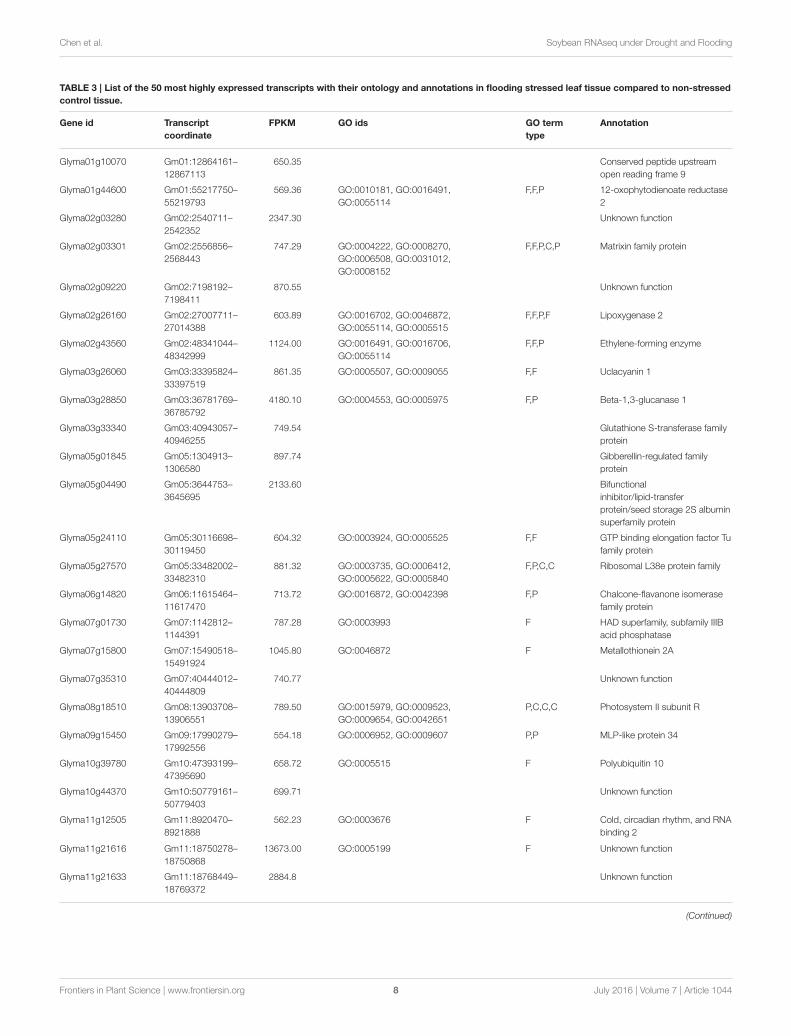
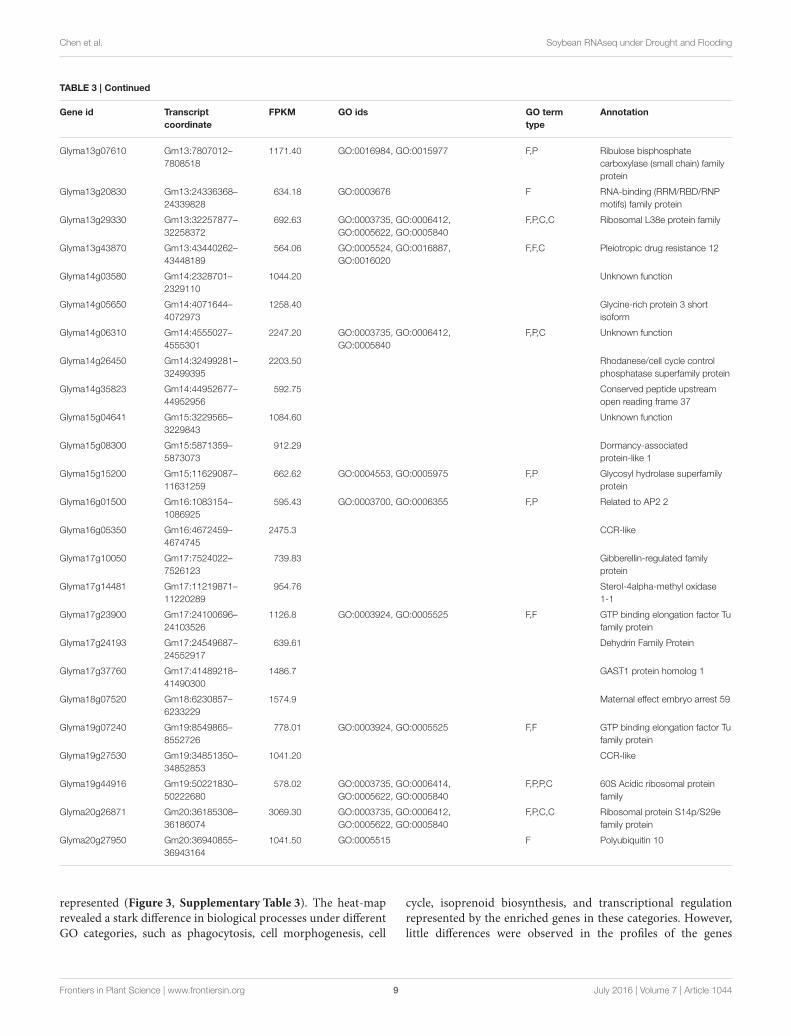
conditions were identified (Tables 2, 3). Interestingly, there are15 genes among the top 50 highly expressed ones enriched forphotosystem II (PS II) and dehydrin family proteins featuredin both stress conditions. Flooding stress specific genes werefound to be enriched for lipoxygenase 2, ethylene formingenzyme, matrixin family proteins, and 12-oxophytodienoatereductase 2, whereas drought specific genes were enrichedfor S-adenosylmethionine synthetase, calmodulin 5, 1-deoxy-D-xylulose-5-phosphate-reductoisomerase, and carbonic anhydrase(Tables 2, 3).
The distribution trends in terms of fold change rangedfrom ∼8- to 9-fold change for DEGs under drought and floodstress (Supplementary Figure 2). A total of 2724 DEGs wereidentified under the drought conditions when compared tocontrol, and 1802 genes were up-regulated and 922 genes were
down-regulated (Supplementary Table 3A). During flood stress,a total of 3498 DEGs were identified when compared to thecontrol, and 1303 genes were up-regulated and 2195 genes weredown-regulated (Supplementary Table 2B). The total numberof DEGs was greater in the flood condition compared to thedrought. However, a greater number of up-regulated geneswere observed under the drought condition compared to theflood condition with an overlap of 166 genes across the threecomparisons (Figure 1). A total of 3768 genes were found to bedifferentially expressed when flood and drought conditions werecompared to each other (Supplementary Table 2C). However,among the 2724 and 3498 DEGs identified in the drought andflood conditions, respectively, 823 DEGs were found to be in
common (Figure 2A). Among these genes, 461 genes were bothup-regulated under the drought and flood conditions, 290 genes
Frontiers in Plant Science | www.frontiersin.org 5 July 2016 | Volume 7 | Article 1044
Chen et al. Soybean RNAseq under Drought and Flooding
TABLE 2 | List of the 50 most highly expressed transcripts with their ontology and annotations in drought stressed leaf tissue compared to non-stressed
control tissues.
Gene id Transcript
coordinate
FPKM GO ids GO type Annotation
Glyma01g04250 Gm01:3750043–
3752379
1240.53 GO:0016758, GO:0008152 F,P UDP-glucosyl transferase 74B1
Glyma02g47560 Gm02:51103817–
51104907
1116.26 GO:0016020, GO:0009765 C,P Photosystem II light harvesting
complex gene 2.1
Glyma03g28760 Gm03:36707978–
36709723
727.11 Dehydration-induced protein
(ERD15)
Glyma03g32850 Gm03:40584884–
40588047
1085.75 GO:0000902, GO:0005524 P,F Heat shock cognate protein 70-1
Glyma03g38190 Gm03:44586431–
44589302
682.88 GO:0004478, GO:0006556,
GO:0005524
F,P,F S-adenosylmethionine
synthetase 1
Glyma04g01130 Gm04:710034–
711409
1682.80 GO:0006950, GO:0009415 P,P Cold-regulated 47
Glyma04g13490 Gm04:13109642–
13110739
741.79 GO:0004857, GO:0030599 F,F Plant invertase/pectin
methylesterase inhibitor
superfamily protein
Glyma05g13900 Gm05:14595247–
14597672
916.44 GO:0005509, GO:0007165,
GO:0005578
F,P,C Calmodulin 5
Glyma05g25810 Gm05:31881851–
31883064
1774.57 GO:0016020, GO:0009765 C,P Chlorophyll A/B binding protein 1
Glyma05g28971 Gm05:34684777–
34684906
1198.80 Conserved peptide upstream
open reading frame 5
Glyma06g37260 Gm06:39710119-
39711559
746.98 Metallothionein 3
Glyma07g01730 Gm07:1142812–
1144391
2262.09 GO:0003993 F HAD superfamily, subfamily IIIB
acid Phosphatase
Glyma07g14340 Gm07:13708523–
13710623
668.66 GO:0005509, GO:0015979,
GO:0009523, GO:0009654,
GO:0019898
F,P,C,C,C Photosystem II subunit Q-2
Glyma07g35310 Gm07:40444012–
40444809
2503.19 unknown function
Glyma08g08770 Gm08:6268663–
6270567
1081.30 GO:0016020, GO:0009765 C,P Chlorophyll A/B binding protein 1
Glyma08g18510 Gm08:13903708–
13906551
1856.61 GO:0015979, GO:0009523,
GO:0009654, GO:0042651
P,C,C,C Photosystem II subunit R
Glyma09g15450 Gm09:17990279–
17992556
657.97 GO:0006952, GO:0009607 P,P MLP-like protein 34
Glyma09g36210 Gm09:42033362–
42033506
928.14 ROTUNDIFOLIA Like 12
Glyma10g35871 Gm10:44076742–
44077667
1098.55 Unknown function
Glyma11g18640 Gm11:15274089–
15277211
690.62 Photosystem I subunit O
Glyma11g21616 Gm11:18750278–
18750868
1923.28 GO:0005199 F Unknown function
Glyma11g34230 Gm11:36096506–
36100186
1518.22 GO:0005524 F Rubisco activase
Glyma12g01120 Gm12:632601–
632745
2063.58 ROTUNDIFOLIA like 12
Glyma12g05150 Gm12:3432975–
3436225
850.75 Cold-regulated 413-plasma
membrane 2
Glyma13g07610 Gm13:7807012–
7808518
4066.37 GO:0016984, GO:0015977 F,P Ribulose bisphosphate
carboxylase (small chain) family
protein
Glyma14g01130 Gm14:609754–
611622
1241.04 GO:0016020, GO:0009765 C,P Photosystem II light harvesting
complex gene 2.1
(Continued)
Frontiers in Plant Science | www.frontiersin.org 6 July 2016 | Volume 7 | Article 1044
Chen et al. Soybean RNAseq under Drought and Flooding
TABLE 2 | Continued
Gene id Transcript
coordinate
FPKM GO ids GO type Annotation
Glyma14g06310 Gm14:4555027–
4555301
1666.99 GO:0003735, GO:0006412,
GO:0005840
F,P,C Unknown function
Glyma14g09620 Gm14:7694931–
7696850
813.56 Gibberellin-regulated family
protein
Glyma14g26450 Gm14:32499281–
32499395
1811.64 Rhodanese/cell cycle control
phosphatase superfamily protein
Glyma15g04641 Gm15:3229565–
3229843
1209.88 Unknown function
Glyma15g21890 Gm15:20279966–
20282600
782.01 GO:0004478, GO:0006556,
GO:0005524
F,P,F S-adenosylmethionine
synthetase family protein
Glyma15g38091 Gm15:44167213–
44170746
664.74 Unknown function
Glyma15g40450 Gm15:47454286–
47457571
896.08 GO:0015979, GO:0009523,
GO:0009654, GO:0042651
P,C,C,C Photosystem II subunit R
Glyma16g04190 Gm16:3559705–
3561111
1309.08 Unknown function
Glyma16g04240 Gm16:3592381–
3597724
922.43 GO:0003871, GO:0009086,
GO:0008270, GO:0008652
F,P,F,P Cobalamin-independent
synthase family protein
Glyma16g04471 Gm16:3775380–
3776171
963.52 Arabinogalactan protein 14
Glyma16g10880 Gm16:11230916–
11238976
678.00 GO:0070402, GO:0055114,
GO:0005515, GO:0046872,
GO:0030604, GO:0008299
F,P,F,F,F,P 1-deoxy-D-xylulose 5-phosphate
reductoisomerase
Glyma17g14481 Gm17:11219871–
11220289
833.51 Sterol-4alpha-methyl oxidase
1-1
Glyma17g23900 Gm17:24100696–
24103526
1014.65 GO:0003924, GO:0005525 F,F GTP binding elongation factor Tu
family protein
Glyma17g24193 Gm17:24549687–
24552917
939.43 Dehydrin family protein
Glyma17g37760 Gm17:41489218–
41490300
672.50 GAST1 protein homolog 1
Glyma18g04081 Gm18:2844663–
2849361
1656.20 GO:0005524 F Rubisco activase
Glyma19g01050 Gm19:738803–
744963
1031.96 GO:0004089, GO:0008270,
GO:0015976
F,F,P Carbonic anhydrase 1
Glyma19g06370 Gm19:7281535–
7282880
943.91 GO:0016984, GO:0015977 F,P Ribulose bisphosphate
Carboxylase (small chain) family
protein
Glyma19g28240 Gm19:35628975–
35631849
753.35 GO:0016620, GO:0055114 F,P Glyceraldehyde 3-phosphate
dehydrogenase A subunit 2
Glyma19g29210 Gm19:36800698–
36804173
916.02 Unknown function
Glyma19g40810 Gm19:47126360–
47129191
778.31 GO:0004478, GO:0006556,
GO:0005524
F,P,F S-adenosylmethionine
synthetase 2
Glyma20g26871 Gm20:36185308–
36186074
2273.27 GO:0003735, GO:0006412,
GO:0005622, GO:0005840
F,P,C,C Ribosomal protein S14p/S29e
family protein
Glyma20g27950 Gm20:36940855–
36943164
1158.99 GO:0005515 F Polyubiquitin 10
Glyma20g28890 Gm20:37838080–
37839638
706.21 Chlorophyll A-B binding family
protein
were both down-regulated under the two conditions, 62 geneswere up-regulated in the drought but down-regulated in the flood
conditions, and 10 genes were down-regulated in the drought but
up-regulated during flood conditions (Figure 2B).
Gene Ontology (GO) Annotation ofDifferentially Expressed GenesThe profiles of biological processes represented by GO enrichedDEGs under drought and flood stresses were studied and
Frontiers in Plant Science | www.frontiersin.org 7 July 2016 | Volume 7 | Article 1044
Chen et al. Soybean RNAseq under Drought and Flooding
TABLE 3 | List of the 50 most highly expressed transcripts with their ontology and annotations in flooding stressed leaf tissue compared to non-stressed
control tissue.
Gene id Transcript
coordinate
FPKM GO ids GO term
type
Annotation
Glyma01g10070 Gm01:12864161–
12867113
650.35 Conserved peptide upstream
open reading frame 9
Glyma01g44600 Gm01:55217750–
55219793
569.36 GO:0010181, GO:0016491,
GO:0055114
F,F,P 12-oxophytodienoate reductase
2
Glyma02g03280 Gm02:2540711–
2542352
2347.30 Unknown function
Glyma02g03301 Gm02:2556856–
2568443
747.29 GO:0004222, GO:0008270,
GO:0006508, GO:0031012,
GO:0008152
F,F,P,C,P Matrixin family protein
Glyma02g09220 Gm02:7198192–
7198411
870.55 Unknown function
Glyma02g26160 Gm02:27007711–
27014388
603.89 GO:0016702, GO:0046872,
GO:0055114, GO:0005515
F,F,P,F Lipoxygenase 2
Glyma02g43560 Gm02:48341044–
48342999
1124.00 GO:0016491, GO:0016706,
GO:0055114
F,F,P Ethylene-forming enzyme
Glyma03g26060 Gm03:33395824–
33397519
861.35 GO:0005507, GO:0009055 F,F Uclacyanin 1
Glyma03g28850 Gm03:36781769–
36785792
4180.10 GO:0004553, GO:0005975 F,P Beta-1,3-glucanase 1
Glyma03g33340 Gm03:40943057–
40946255
749.54 Glutathione S-transferase family
protein
Glyma05g01845 Gm05:1304913–
1306580
897.74 Gibberellin-regulated family
protein
Glyma05g04490 Gm05:3644753–
3645695
2133.60 Bifunctional
inhibitor/lipid-transfer
protein/seed storage 2S albumin
superfamily protein
Glyma05g24110 Gm05:30116698–
30119450
604.32 GO:0003924, GO:0005525 F,F GTP binding elongation factor Tu
family protein
Glyma05g27570 Gm05:33482002–
33482310
881.32 GO:0003735, GO:0006412,
GO:0005622, GO:0005840
F,P,C,C Ribosomal L38e protein family
Glyma06g14820 Gm06:11615464–
11617470
713.72 GO:0016872, GO:0042398 F,P Chalcone-flavanone isomerase
family protein
Glyma07g01730 Gm07:1142812–
1144391
787.28 GO:0003993 F HAD superfamily, subfamily IIIB
acid phosphatase
Glyma07g15800 Gm07:15490518–
15491924
1045.80 GO:0046872 F Metallothionein 2A
Glyma07g35310 Gm07:40444012–
40444809
740.77 Unknown function
Glyma08g18510 Gm08:13903708–
13906551
789.50 GO:0015979, GO:0009523,
GO:0009654, GO:0042651
P,C,C,C Photosystem II subunit R
Glyma09g15450 Gm09:17990279–
17992556
554.18 GO:0006952, GO:0009607 P,P MLP-like protein 34
Glyma10g39780 Gm10:47393199–
47395690
658.72 GO:0005515 F Polyubiquitin 10
Glyma10g44370 Gm10:50779161–
50779403
699.71 Unknown function
Glyma11g12505 Gm11:8920470–
8921888
562.23 GO:0003676 F Cold, circadian rhythm, and RNA
binding 2
Glyma11g21616 Gm11:18750278–
18750868
13673.00 GO:0005199 F Unknown function
Glyma11g21633 Gm11:18768449–
18769372
2884.8 Unknown function
(Continued)
Frontiers in Plant Science | www.frontiersin.org 8 July 2016 | Volume 7 | Article 1044
Chen et al. Soybean RNAseq under Drought and Flooding
TABLE 3 | Continued
Gene id Transcript
coordinate
FPKM GO ids GO term
type
Annotation
Glyma13g07610 Gm13:7807012–
7808518
1171.40 GO:0016984, GO:0015977 F,P Ribulose bisphosphate
carboxylase (small chain) family
protein
Glyma13g20830 Gm13:24336368–
24339828
634.18 GO:0003676 F RNA-binding (RRM/RBD/RNP
motifs) family protein
Glyma13g29330 Gm13:32257877–
32258372
692.63 GO:0003735, GO:0006412,
GO:0005622, GO:0005840
F,P,C,C Ribosomal L38e protein family
Glyma13g43870 Gm13:43440262–
43448189
564.06 GO:0005524, GO:0016887,
GO:0016020
F,F,C Pleiotropic drug resistance 12
Glyma14g03580 Gm14:2328701–
2329110
1044.20 Unknown function
Glyma14g05650 Gm14:4071644–
4072973
1258.40 Glycine-rich protein 3 short
isoform
Glyma14g06310 Gm14:4555027–
4555301
2247.20 GO:0003735, GO:0006412,
GO:0005840
F,P,C Unknown function
Glyma14g26450 Gm14:32499281–
32499395
2203.50 Rhodanese/cell cycle control
phosphatase superfamily protein
Glyma14g35823 Gm14:44952677–
44952956
592.75 Conserved peptide upstream
open reading frame 37
Glyma15g04641 Gm15:3229565–
3229843
1084.60 Unknown function
Glyma15g08300 Gm15:5871359–
5873073
912.29 Dormancy-associated
protein-like 1
Glyma15g15200 Gm15:11629087–
11631259
662.62 GO:0004553, GO:0005975 F,P Glycosyl hydrolase superfamily
protein
Glyma16g01500 Gm16:1083154–
1086925
595.43 GO:0003700, GO:0006355 F,P Related to AP2 2
Glyma16g05350 Gm16:4672459–
4674745
2475.3 CCR-like
Glyma17g10050 Gm17:7524022–
7526123
739.83 Gibberellin-regulated family
protein
Glyma17g14481 Gm17:11219871–
11220289
954.76 Sterol-4alpha-methyl oxidase
1-1
Glyma17g23900 Gm17:24100696–
24103526
1126.8 GO:0003924, GO:0005525 F,F GTP binding elongation factor Tu
family protein
Glyma17g24193 Gm17:24549687–
24552917
639.61 Dehydrin Family Protein
Glyma17g37760 Gm17:41489218–
41490300
1486.7 GAST1 protein homolog 1
Glyma18g07520 Gm18:6230857–
6233229
1574.9 Maternal effect embryo arrest 59
Glyma19g07240 Gm19:8549865–
8552726
778.01 GO:0003924, GO:0005525 F,F GTP binding elongation factor Tu
family protein
Glyma19g27530 Gm19:34851350–
34852853
1041.20 CCR-like
Glyma19g44916 Gm19:50221830–
50222680
578.02 GO:0003735, GO:0006414,
GO:0005622, GO:0005840
F,P,P,C 60S Acidic ribosomal protein
family
Glyma20g26871 Gm20:36185308–
36186074
3069.30 GO:0003735, GO:0006412,
GO:0005622, GO:0005840
F,P,C,C Ribosomal protein S14p/S29e
family protein
Glyma20g27950 Gm20:36940855–
36943164
1041.50 GO:0005515 F Polyubiquitin 10
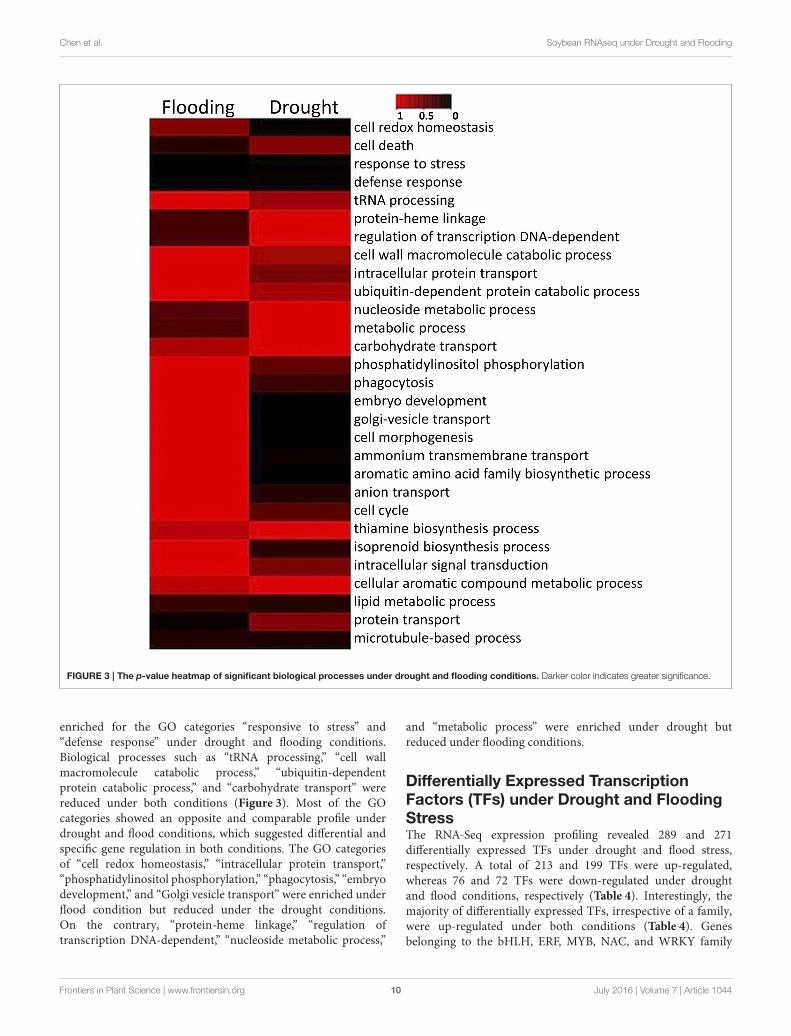
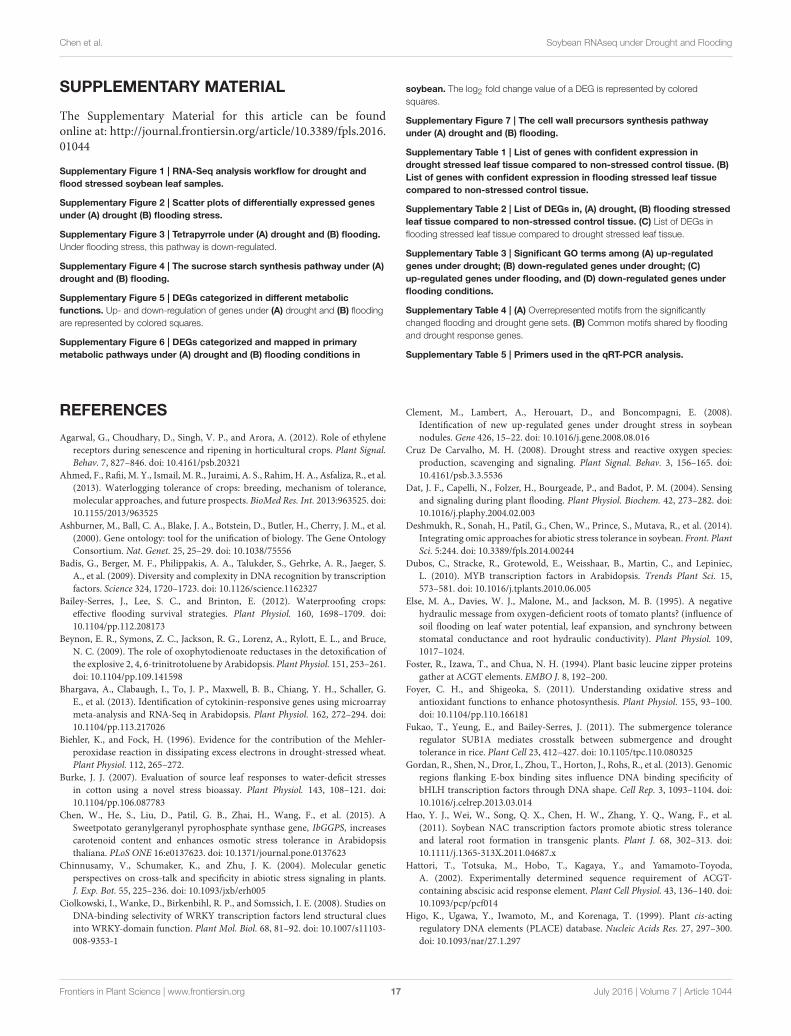
represented (Figure 3, Supplementary Table 3). The heat-maprevealed a stark difference in biological processes under differentGO categories, such as phagocytosis, cell morphogenesis, cell
cycle, isoprenoid biosynthesis, and transcriptional regulationrepresented by the enriched genes in these categories. However,little differences were observed in the profiles of the genes
Frontiers in Plant Science | www.frontiersin.org 9 July 2016 | Volume 7 | Article 1044
Chen et al. Soybean RNAseq under Drought and Flooding
FIGURE 3 | The p-value heatmap of significant biological processes under drought and flooding conditions. Darker color indicates greater significance.
enriched for the GO categories “responsive to stress” and“defense response” under drought and flooding conditions.Biological processes such as “tRNA processing,” “cell wallmacromolecule catabolic process,” “ubiquitin-dependentprotein catabolic process,” and “carbohydrate transport” werereduced under both conditions (Figure 3). Most of the GOcategories showed an opposite and comparable profile underdrought and flood conditions, which suggested differential andspecific gene regulation in both conditions. The GO categoriesof “cell redox homeostasis,” “intracellular protein transport,”“phosphatidylinositol phosphorylation,” “phagocytosis,” “embryodevelopment,” and “Golgi vesicle transport” were enriched underflood condition but reduced under the drought conditions.On the contrary, “protein-heme linkage,” “regulation oftranscription DNA-dependent,” “nucleoside metabolic process,”
and “metabolic process” were enriched under drought butreduced under flooding conditions.
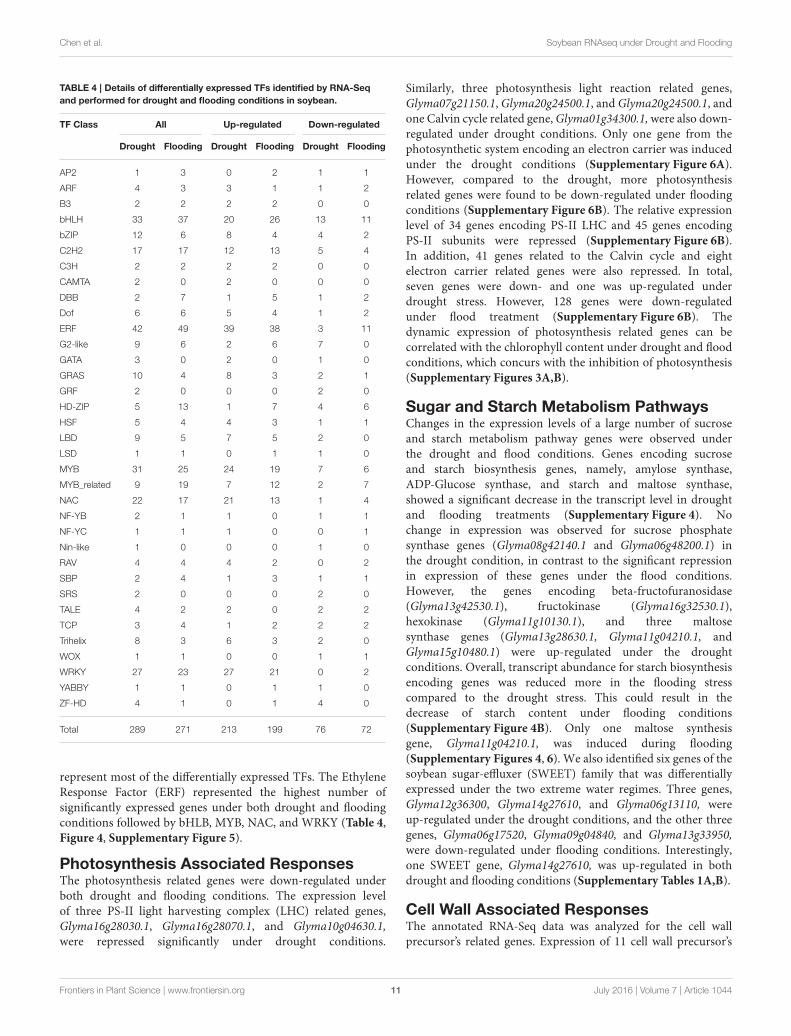
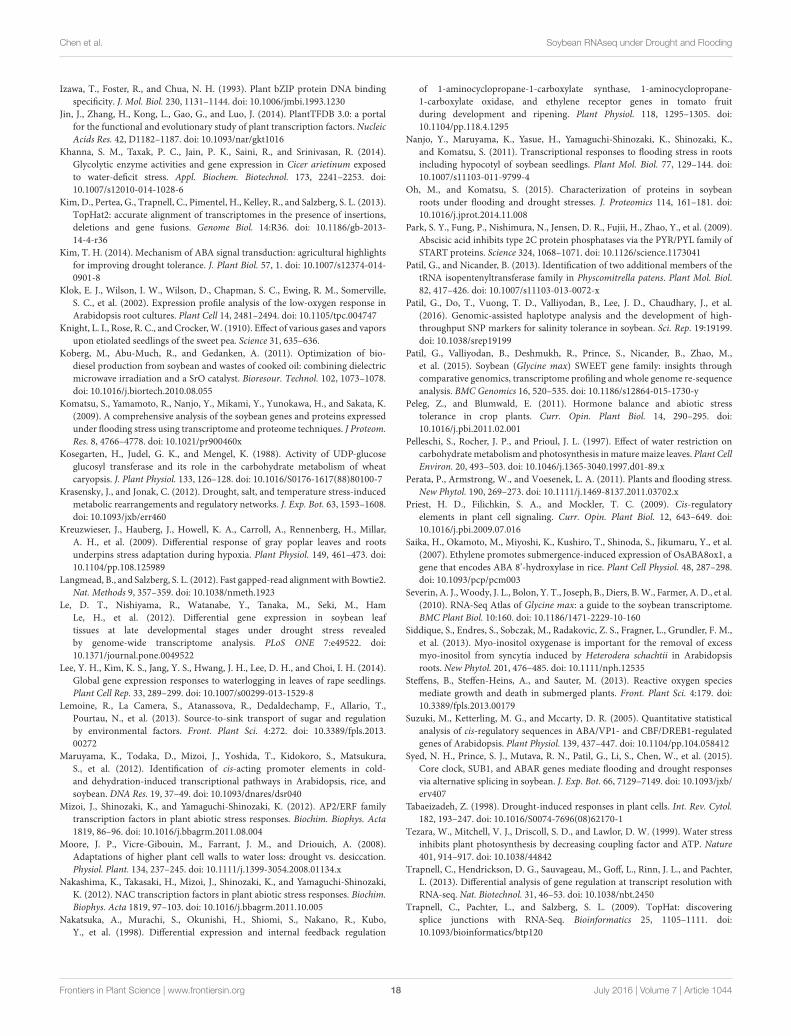
Differentially Expressed TranscriptionFactors (TFs) under Drought and FloodingStressThe RNA-Seq expression profiling revealed 289 and 271differentially expressed TFs under drought and flood stress,respectively. A total of 213 and 199 TFs were up-regulated,whereas 76 and 72 TFs were down-regulated under droughtand flood conditions, respectively (Table 4). Interestingly, themajority of differentially expressed TFs, irrespective of a family,were up-regulated under both conditions (Table 4). Genesbelonging to the bHLH, ERF, MYB, NAC, and WRKY family
Frontiers in Plant Science | www.frontiersin.org 10 July 2016 | Volume 7 | Article 1044
Chen et al. Soybean RNAseq under Drought and Flooding
TABLE 4 | Details of differentially expressed TFs identified by RNA-Seq
and performed for drought and flooding conditions in soybean.
TF Class All Up-regulated Down-regulated
Drought Flooding Drought Flooding Drought Flooding
AP2 1 3 0 2 1 1
ARF 4 3 3 1 1 2
B3 2 2 2 2 0 0
bHLH 33 37 20 26 13 11
bZIP 12 6 8 4 4 2
C2H2 17 17 12 13 5 4
C3H 2 2 2 2 0 0
CAMTA 2 0 2 0 0 0
DBB 2 7 1 5 1 2
Dof 6 6 5 4 1 2
ERF 42 49 39 38 3 11
G2-like 9 6 2 6 7 0
GATA 3 0 2 0 1 0
GRAS 10 4 8 3 2 1
GRF 2 0 0 0 2 0
HD-ZIP 5 13 1 7 4 6
HSF 5 4 4 3 1 1
LBD 9 5 7 5 2 0
LSD 1 1 0 1 1 0
MYB 31 25 24 19 7 6
MYB_related 9 19 7 12 2 7
NAC 22 17 21 13 1 4
NF-YB 2 1 1 0 1 1
NF-YC 1 1 1 0 0 1
Nin-like 1 0 0 0 1 0
RAV 4 4 4 2 0 2
SBP 2 4 1 3 1 1
SRS 2 0 0 0 2 0
TALE 4 2 2 0 2 2
TCP 3 4 1 2 2 2
Trihelix 8 3 6 3 2 0
WOX 1 1 0 0 1 1
WRKY 27 23 27 21 0 2
YABBY 1 1 0 1 1 0
ZF-HD 4 1 0 1 4 0
Total 289 271 213 199 76 72
represent most of the differentially expressed TFs. The EthyleneResponse Factor (ERF) represented the highest number ofsignificantly expressed genes under both drought and floodingconditions followed by bHLB, MYB, NAC, and WRKY (Table 4,Figure 4, Supplementary Figure 5).
Photosynthesis Associated ResponsesThe photosynthesis related genes were down-regulated underboth drought and flooding conditions. The expression levelof three PS-II light harvesting complex (LHC) related genes,Glyma16g28030.1, Glyma16g28070.1, and Glyma10g04630.1,were repressed significantly under drought conditions.
Similarly, three photosynthesis light reaction related genes,Glyma07g21150.1, Glyma20g24500.1, and Glyma20g24500.1, andone Calvin cycle related gene,Glyma01g34300.1,were also down-regulated under drought conditions. Only one gene from thephotosynthetic system encoding an electron carrier was inducedunder the drought conditions (Supplementary Figure 6A).However, compared to the drought, more photosynthesisrelated genes were found to be down-regulated under floodingconditions (Supplementary Figure 6B). The relative expressionlevel of 34 genes encoding PS-II LHC and 45 genes encodingPS-II subunits were repressed (Supplementary Figure 6B).In addition, 41 genes related to the Calvin cycle and eightelectron carrier related genes were also repressed. In total,seven genes were down- and one was up-regulated underdrought stress. However, 128 genes were down-regulatedunder flood treatment (Supplementary Figure 6B). Thedynamic expression of photosynthesis related genes can becorrelated with the chlorophyll content under drought and floodconditions, which concurs with the inhibition of photosynthesis(Supplementary Figures 3A,B).
Sugar and Starch Metabolism PathwaysChanges in the expression levels of a large number of sucroseand starch metabolism pathway genes were observed underthe drought and flood conditions. Genes encoding sucroseand starch biosynthesis genes, namely, amylose synthase,ADP-Glucose synthase, and starch and maltose synthase,showed a significant decrease in the transcript level in droughtand flooding treatments (Supplementary Figure 4). Nochange in expression was observed for sucrose phosphatesynthase genes (Glyma08g42140.1 and Glyma06g48200.1) inthe drought condition, in contrast to the significant repressionin expression of these genes under the flood conditions.However, the genes encoding beta-fructofuranosidase(Glyma13g42530.1), fructokinase (Glyma16g32530.1),hexokinase (Glyma11g10130.1), and three maltosesynthase genes (Glyma13g28630.1, Glyma11g04210.1, andGlyma15g10480.1) were up-regulated under the droughtconditions. Overall, transcript abundance for starch biosynthesisencoding genes was reduced more in the flooding stresscompared to the drought stress. This could result in thedecrease of starch content under flooding conditions(Supplementary Figure 4B). Only one maltose synthesisgene, Glyma11g04210.1, was induced during flooding(Supplementary Figures 4, 6). We also identified six genes of thesoybean sugar-effluxer (SWEET) family that was differentiallyexpressed under the two extreme water regimes. Three genes,Glyma12g36300, Glyma14g27610, and Glyma06g13110, wereup-regulated under the drought conditions, and the other threegenes, Glyma06g17520, Glyma09g04840, and Glyma13g33950,were down-regulated under flooding conditions. Interestingly,one SWEET gene, Glyma14g27610, was up-regulated in bothdrought and flooding conditions (Supplementary Tables 1A,B).
Cell Wall Associated ResponsesThe annotated RNA-Seq data was analyzed for the cell wallprecursor’s related genes. Expression of 11 cell wall precursor’s
Frontiers in Plant Science | www.frontiersin.org 11 July 2016 | Volume 7 | Article 1044
Chen et al. Soybean RNAseq under Drought and Flooding
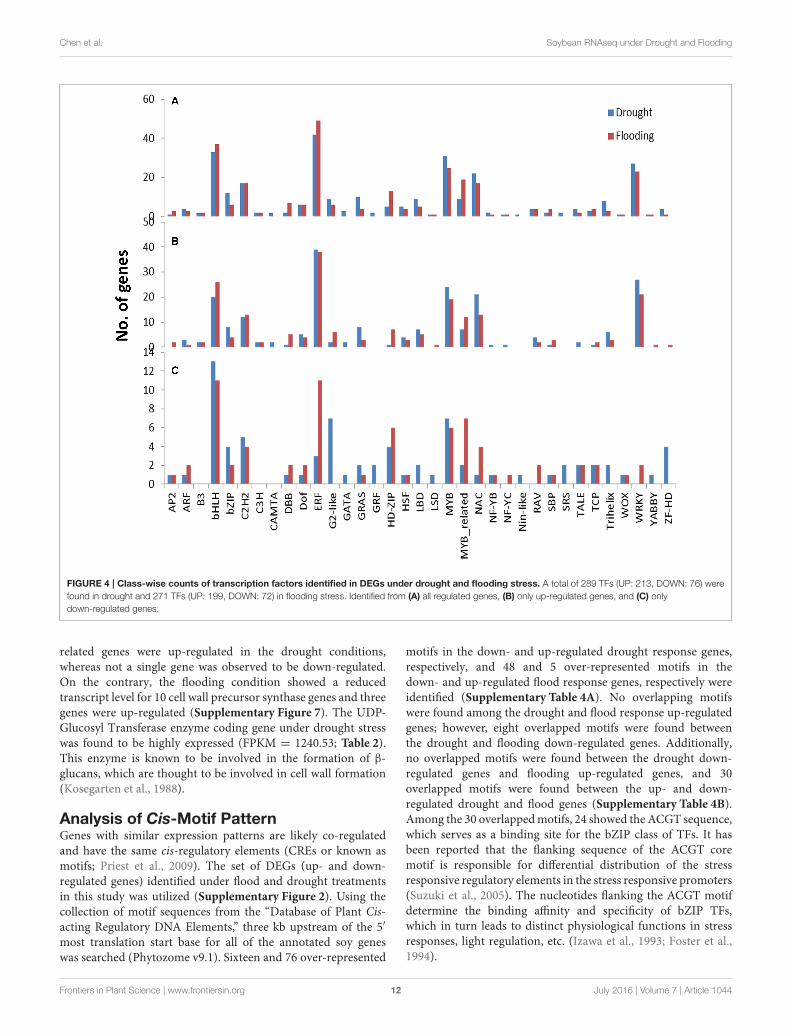
FIGURE 4 | Class-wise counts of transcription factors identified in DEGs under drought and flooding stress. A total of 289 TFs (UP: 213, DOWN: 76) were
found in drought and 271 TFs (UP: 199, DOWN: 72) in flooding stress. Identified from (A) all regulated genes, (B) only up-regulated genes, and (C) only
down-regulated genes.
related genes were up-regulated in the drought conditions,whereas not a single gene was observed to be down-regulated.On the contrary, the flooding condition showed a reducedtranscript level for 10 cell wall precursor synthase genes and threegenes were up-regulated (Supplementary Figure 7). The UDP-Glucosyl Transferase enzyme coding gene under drought stresswas found to be highly expressed (FPKM = 1240.53; Table 2).This enzyme is known to be involved in the formation of β-glucans, which are thought to be involved in cell wall formation(Kosegarten et al., 1988).
Analysis of Cis-Motif PatternGenes with similar expression patterns are likely co-regulatedand have the same cis-regulatory elements (CREs or known asmotifs; Priest et al., 2009). The set of DEGs (up- and down-regulated genes) identified under flood and drought treatmentsin this study was utilized (Supplementary Figure 2). Using thecollection of motif sequences from the “Database of Plant Cis-acting Regulatory DNA Elements,” three kb upstream of the 5′
most translation start base for all of the annotated soy geneswas searched (Phytozome v9.1). Sixteen and 76 over-represented
motifs in the down- and up-regulated drought response genes,respectively, and 48 and 5 over-represented motifs in thedown- and up-regulated flood response genes, respectively wereidentified (Supplementary Table 4A). No overlapping motifswere found among the drought and flood response up-regulatedgenes; however, eight overlapped motifs were found betweenthe drought and flooding down-regulated genes. Additionally,no overlapped motifs were found between the drought down-regulated genes and flooding up-regulated genes, and 30overlapped motifs were found between the up- and down-regulated drought and flood genes (Supplementary Table 4B).Among the 30 overlappedmotifs, 24 showed the ACGT sequence,which serves as a binding site for the bZIP class of TFs. It hasbeen reported that the flanking sequence of the ACGT coremotif is responsible for differential distribution of the stressresponsive regulatory elements in the stress responsive promoters(Suzuki et al., 2005). The nucleotides flanking the ACGT motifdetermine the binding affinity and specificity of bZIP TFs,which in turn leads to distinct physiological functions in stressresponses, light regulation, etc. (Izawa et al., 1993; Foster et al.,1994).
Frontiers in Plant Science | www.frontiersin.org 12 July 2016 | Volume 7 | Article 1044
Chen et al. Soybean RNAseq under Drought and Flooding
Although drought stress up-regulated genes shared severalcis-regulatory elements with down-regulated flood stress genes,few genes were found to be common between droughtup-regulated and flooding down-regulated genes. For example,there are 324 up-regulated drought responsive genes and 457down-regulated flood response genes with only one shared motif,ACGTABREMOTIFA2OSEM. Importantly, this motif acts at thecore of ACGT of motif A in the rice ABRE gene (Hattori et al.,2002). However, there were only 16 common genes representing5% of the drought up-regulated genes and 4% of the flooddown-regulated genes.
Drought and flood down-regulated genes had ∼15%of their genes in common (Supplementary Table 3D).Interestingly, flood down-regulated genes shared most theirover-represented motifs (30/48) with drought up-regulatedgenes. However, they did not share many genes betweenthe down-regulated flooding response and the up-regulateddrought responsive genes (Supplementary Tables 3C,D). Themolecular function categories were also examined using theGO enrichment analysis for both of the datasets represented bythe ACGTABREMOTIFA2OSEM motif. Interestingly, the topthree molecular functions for both of the datasets were “catalyticactivity,” “sequence-specific DNA binding TF activity,” and“DNA binding.”
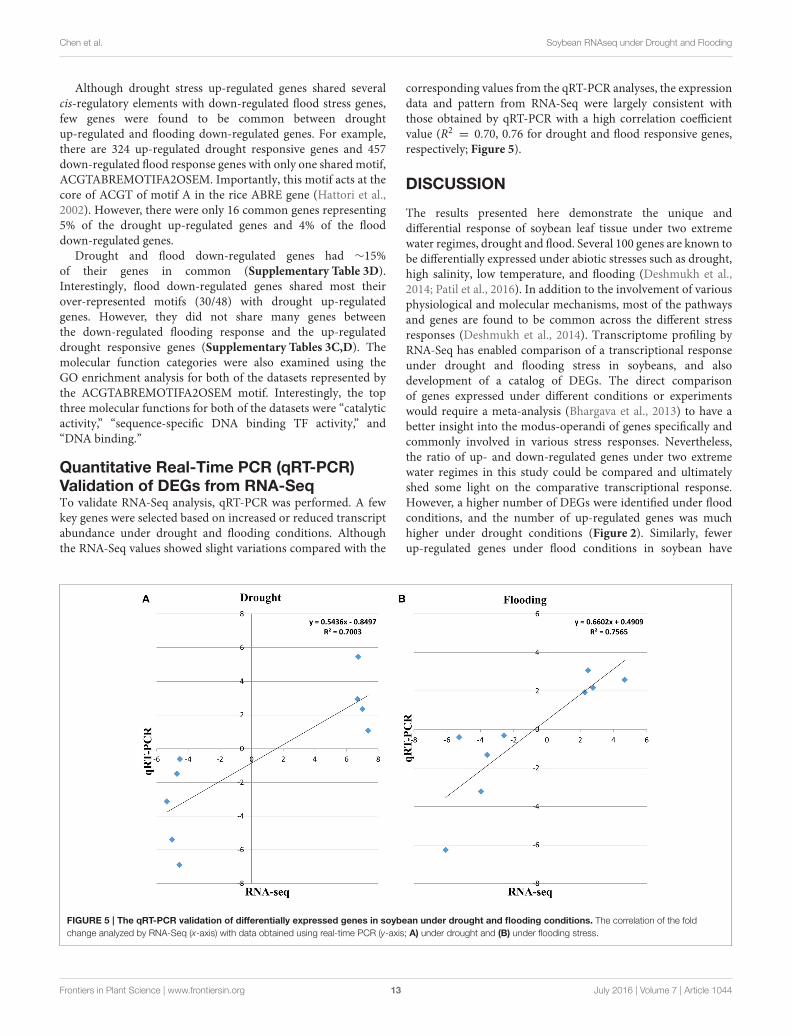
Quantitative Real-Time PCR (qRT-PCR)Validation of DEGs from RNA-SeqTo validate RNA-Seq analysis, qRT-PCR was performed. A fewkey genes were selected based on increased or reduced transcriptabundance under drought and flooding conditions. Althoughthe RNA-Seq values showed slight variations compared with the
corresponding values from the qRT-PCR analyses, the expressiondata and pattern from RNA-Seq were largely consistent withthose obtained by qRT-PCR with a high correlation coefficientvalue (R2 = 0.70, 0.76 for drought and flood responsive genes,respectively; Figure 5).
DISCUSSION
The results presented here demonstrate the unique anddifferential response of soybean leaf tissue under two extremewater regimes, drought and flood. Several 100 genes are known tobe differentially expressed under abiotic stresses such as drought,high salinity, low temperature, and flooding (Deshmukh et al.,2014; Patil et al., 2016). In addition to the involvement of variousphysiological and molecular mechanisms, most of the pathwaysand genes are found to be common across the different stressresponses (Deshmukh et al., 2014). Transcriptome profiling byRNA-Seq has enabled comparison of a transcriptional responseunder drought and flooding stress in soybeans, and alsodevelopment of a catalog of DEGs. The direct comparisonof genes expressed under different conditions or experimentswould require a meta-analysis (Bhargava et al., 2013) to have abetter insight into the modus-operandi of genes specifically andcommonly involved in various stress responses. Nevertheless,the ratio of up- and down-regulated genes under two extremewater regimes in this study could be compared and ultimatelyshed some light on the comparative transcriptional response.However, a higher number of DEGs were identified under floodconditions, and the number of up-regulated genes was muchhigher under drought conditions (Figure 2). Similarly, fewerup-regulated genes under flood conditions in soybean have
FIGURE 5 | The qRT-PCR validation of differentially expressed genes in soybean under drought and flooding conditions. The correlation of the fold
change analyzed by RNA-Seq (x-axis) with data obtained using real-time PCR (y-axis; A) under drought and (B) under flooding stress.
Frontiers in Plant Science | www.frontiersin.org 13 July 2016 | Volume 7 | Article 1044
Chen et al. Soybean RNAseq under Drought and Flooding
been reported by Nanjo et al. (2011). In agreement with Nanjoet al. (2011), we observed the lowered metabolic activity underflooding as compared to the drought, which was evident from theglobal gene expression profiling under the two stresses.
Transcription Factors Regulation underDrought and Flooding Stress in SoybeanThe involvement of TFs was examined in the drought andflood stress responses through both the ABA dependent andindependent pathways. The ABA and other upstream signalscan trigger the downstream regulation pathway through the TFregulatory network in both drought and flood conditions. In thisresearch, ABA related TFs: AP2, bZIP, MYB, and NAC were up-regulated under both drought and flood conditions (Figure 4).These TF families have been extensively studied in many plantsunder several different stress conditions (Dubos et al., 2010; Haoet al., 2011; Mizoi et al., 2012; Nakashima et al., 2012,). In severalabiotic stress regulation studies, the TFs identified are initiallyinvolved in tolerance against a specific stress and later observedto be important for other stresses. For instance, the SUB1A TFwas initially identified as a key regulator for the flood responsivepathways in rice, and later transcriptional and functional studiesconfirmed its important role in drought tolerance (Xu et al., 2006;Fukao et al., 2011). However, the flood response in soybean seemsto be independent of the SUB1 pathway since no SUB1A homologwas found to be differentially expressed in our study. On the otherhand, recent studies have shown the involvement of SUB1 andcore-clock related genes mediated through alternatively splicedforms (Syed et al., 2015).
Hormonal Signaling and TranscriptionalRegulations under the Extreme WaterRegimeGenes including TFs involved in the ABA dependentstress response were found to be differentially expressedunder both drought and flood stress conditions (Table 4,Supplementary Table 2). Although ABA is the most specificallystudied hormone for its regulatory role in different stressconditions, other hormones such as cytokinins, brassinosteroids,auxins, and ethylene also played an important functional andregulatory role (Peleg and Blumwald, 2011; Patil and Nicander,2013). The highest number of TFs belonging to the ERF familycoincided with the higher number of ethylene related genesobserved under drought and flooding conditions (Table 4).This suggests the role of ethylene in both drought and floodresponsive pathways. Ethylene biosynthesis has been foundto be affected by auxin, particularly with the auxin dependentroles of several members of the 1-aminocyclopropane-1-carboxylate synthase (ACS) family genes (Nakatsuka et al., 1998).S-Adenosylmethionine synthetase (SAM synthetase) codinggenes were found to be highly enriched and featured amongthe top 50 highly expressed genes under drought stress. SAMacts as a precursor for polyamines and ethylene biosynthesis,which indicates a high efflux of ethylene hormone under stressto counteract the adverse conditions. Higher ethylene levelsare known to induce the ethylene signaling cascade, which in
turn involves the ERF TF activation. That is also found to behighly expressed under the stresses imposed in the currentstudy. Higher ethylene levels are manifested as the ethylenetriple response (Knight et al., 1910) to prevent root and shootelongation, radial swelling of the root and shoot, and horizontalgrowth of the embryonic leaves and meristem instead of verticalgrowth (a consequence of auxin imbalance across the stem axis).This triple response prevents the plants from damage. It wouldalso be interesting to see the receptor response against elevatedethylene levels as reviewed by Agarwal et al. (2012) becausedifferent plants perceive ethylene in their own unique way andthe receptors have a very important role in signal perception andthe downstream cascade.
The 1-Deoxy-D-xylulose-5-phosphate reductoisomerase(DXR) is an important enzyme involved in the 2-C-methyl-D-erythritol-4-phosphate (MEP) pathway for isoprenoidbiosynthesis and was identified among the highly expresseddrought responsive genes (Table 2). Xing et al. (2010) reportedthat dxr mutants with a dwarf phenotype significantly reducedthe number of trichomes and abnormal stomatal closure,which was rescued with exogenous application of ABA andgibberellic acids (GAs). Thus, the high expression of DXR underdrought stress implies a plant’s response to withstand stressand compensate for compromised photosynthetic capacity andabnormal stomatal conductance. Auxin, ethylene, and ABA werepreviously identified to be involved in the drought responsivepathway in soybean (Le et al., 2012). Additionally, ethylene, ABA,and GA are known to be involved in a regulatory network underflooding stress (Bailey-Serres et al., 2012). Hormonal cross-talkat different levels of the stress response and the resultantsynergetic or antagonist interactions have been found to beimportant for stress tolerance (Chinnusamy et al., 2004; Pelegand Blumwald, 2011). The biosynthesis of jasmonic acid (JA)through the octadecanoic pathway (Vick and Zimmerman, 1984)with α-linolenic acid (LA) as a precursor, is mediated by 12-oxophytodienoic acid reductase 2 (OPDAR2) (Glyma01g44600),which is found to be up-regulated under both drought andflooding stress (Supplementary Tables 1B, 2A) but highlyexpressed under flooding stress (Table 3). The high expressionof OPDRA2 is correlated with higher JA synthesis and othersystemic responses. The enzyme has also been shown to detoxify2,4,6-trinitro toluene (TNT) in polluted water contaminated byexplosives as a result of manufacturing and munitions (Beynonet al., 2009). The upsurge of OPDAR2 under flooding stresssuggests plants’ adaptive response against stress and this couldalso help in detoxification of contaminants such as TNT if anyare present in the water. DEGs involved in different hormonalpathways identified here under drought and flooding stress couldbe good candidates to manipulate hormonal cross-talk for theeffective regulation of stress tolerance in plants.
Transcriptional Response Related toPhotosynthesis Efficiency and ChlorophyllThe genes involved in photosynthesis were found to bepreferentially down-regulated under both drought and floodconditions in this study (Supplementary Figure 6). This agrees
Frontiers in Plant Science | www.frontiersin.org 14 July 2016 | Volume 7 | Article 1044
Chen et al. Soybean RNAseq under Drought and Flooding
with the hypothesis that a plant’s photosynthetic capacity isaffected under stresses such as drought and flooding stresses.Thus, this implies that the reduction in photosynthesis activityis the major effect of drought and flooding in soybean. Similarly,the down-regulation of genes involved in photosynthesis hasbeen previously reported under a water deficit situation in othercrops (Wang et al., 2011). Interestingly, Nanjo et al. (2011)reported the up-regulation of photosynthesis related genes underflooding; however, they imposed stress at the 2 day-old seedlingstage of soybean and performed transcriptome profiling withhypocotyl tissue. Similarly, during the early stress response inArabidopsis (low oxygen, 3 h) and gray poplar (flooded 5 h),the up-regulation of photosynthesis related genes was observed(Kreuzwieser et al., 2009). In our study, the down-regulation ofphotosynthesis related genes was observed after 7 days of floodtreatment (Supplementary Figure 6). The down-regulation ofphotosynthesis related genes has also been reported in the leavesof rape seedlings waterlogged for 3 days (Lee et al., 2014). Thissuggests that the flooding or low-oxygen stress stimulates theexpression of photosynthesis related genes during the initialstress response but it is repressed at later stages. Floodingresults in reduced photosynthesis manifested by depleted carbondioxide (CO2) concentration in leaves mediated by the stomatalconstraint to the exchange gases (Bailey-Serres et al., 2012).Reduced CO2 levels lead to a depleted electron sink inchloroplasts, which ultimately results in accumulation of photonsthat are a potential source of ROS. The shrunken electron sinkunder flooding conditions is also substantiated in our findingsand is demonstrated as the repressed expression of eight electroncarriers and PS II related genes (Supplementary Figure 6B). Thechlorophyll synthesis related genes were found to be repressedunder both drought and flooding conditions in this study(Supplementary Figure 3). The lower availability of oxygen (O2)and CO2 under flooding caused by the low gas exchange ratio(Bailey-Serres et al., 2012)may result in decreased photosynthesisefficiency and carbohydrate content. This was consistent with thereduced expression level of starch synthesis genes in the presentstudy (Supplementary Figure 4).
Reduced photosynthesis during prolonged abiotic stressessuch as drought and flooding can be correlated with theproduction of ROS (Klok et al., 2002). High levels of ROS candamage the cell through peroxidation of the lipids, oxidationof proteins and other pathways, and finally the death of thecell (Clement et al., 2008; Wrzaczek et al., 2011). GlutathioneS-transferase, one of the important enzyme in the regulationof ROS flux, is featured as a highly enriched gene among thetop 50 highly expressed genes under flooding stress in thisstudy, which indicates another adaptive response under thestress conditions (Table 3). However, the opposite (high GSTexpression in response to drought compared to flooding stress)was reported by Oh and Komatsu (2015).
Drought also has severe effects on the stomatal conductanceand low CO2 assimilation. It is often considered to be one ofthe most prominent reasons for poor photosynthesis. However,it is not the only reason. Another factor is reduced ATP synthesisleading to depleted ribulose 1,5-bisphosphate content (Tezaraet al., 1999), which produces a 6C compound when combined
with CO2 in the dark reaction (Calvin cycle) of photosynthesis.The repressed expression levels of genes associated withthe Calvin cycle in this study (Supplementary Figure 6A)substantiates the decreased photosynthetic capacity mediatedby down-regulated dark reaction genes. However, the observedup-regulated electron carrier related gene in drought stressedplants needs to be justified when the Calvin cycle and LHCrelated genes are down-regulated. This is because under lesserCO2 assimilation in drought stress, the photosyntheticallyaccumulated energy becomes excess for the dark reaction, andto counteract this condition, over reduction of the electrontransport chain occurs (Biehler and Fock, 1996).
Transcriptional Response toward Cell WallPlasticity under Drought and FloodingWater stress can change the turgor pressure of the plant celland it responds accordingly, either by tightening or looseningthe wall under the extreme water conditions of drought orflooding conditions (Moore et al., 2008). UDP-glucuronic acidis the major precursor of cell wall polysaccharides and comesfrom two sources: UDP-glucose and myo-inositol (Siddiqueet al., 2013). The genes involved in both UDP-glucuronic acidsynthesis pathways were up-regulated under drought stress(Supplementary Figure 7A). This can cause the accumulationof cell wall precursors and the increase of cell turgor underdrought conditions. However, an adverse result was observedunder flooding. The GDP-glucuronic acid synthesis genes werereduced under flooding (Supplementary Figure 4). This impliesthe loosening of the cell wall and stimulation of shoot elongationunder flooding (Voesenek et al., 2006).
Regulation of Sucrose and StarchSynthesis under Drought and FloodConditionsMost research on the effect of drought and flooding on sugarmetabolism and starch biosynthesis has demonstrated that thecarbohydrate levels are altered in leaves (Lemoine et al., 2013).Under stress conditions, the increase in hexose amounts isassociated with the induction of starch hydrolysis (Pelleschiet al., 1997). In agreement with these findings, we observedan increased expression of the hexokinase (Glyma11g10130.1)gene in the drought treatment. The gradual slowing downof starch metabolism is a general mechanism under flooding(Fukao et al., 2011) and drought (Burke, 2007) conditions forrice and cotton, respectively, which reserves the energy sourcefor a prolonged energy supply to maintain cell survival. It isconceivable that starch metabolism during flooding and droughtresponse may also be controlled/gated by the up- and down-regulation of carbohydrate metabolism genes in soybean. Oneof the prominent processes under sugar metabolism that getsaffected in water stressed plants is the sugar efflux rate, whichis carried out by proteins coded by sugar transporter genes.They ensure sugar transport from the source (leaves) to the sink(roots and seeds) to counteract the depleted sugar levels undersevere conditions such as drought and flooding. Utilizing theavailable resource generated by Patil et al. (2015), six SWEET
Frontiers in Plant Science | www.frontiersin.org 15 July 2016 | Volume 7 | Article 1044
Chen et al. Soybean RNAseq under Drought and Flooding
family genes were featured among the DEGs identified inthis study under drought and flood conditions. The findingssuggest that SWEET genes in general are induced in droughtconditions and repressed in flooding conditions, which indicatethat sucrose efflux genes are activated under drought conditionsand repressed under flooding conditions. However, one gene(Glyma14g276210) was found to be up-regulated under both ofthe conditions. Syed et al. (2015) also identified the up-regulationof soybean SWEET genes under drought stress. The activatedgene expression under drought stress could be accounted forby sugar transportation due to an uninterrupted energy supplyunder such adversity. The down-regulation of three SWEETfamily genes under flooding stress in the current study is contraryto the findings of Lemoine et al. (2013), where it was suggestedthat the up-regulated sugar effluxer genes may contribute tosugar homeostasis in a flood tolerant genotype. In this study, therepressed genes might be playing the same role by controlling theefflux of sugar under flooding stress and thus putting a check onnormal efflux of sugar. However, this hypothesis needs additionalsubstantiation.
Glycolytic enzymes along with inducers of heat shockproteins are key factors in the early response to flooding anddrought in soybean (Nanjo et al., 2011; Oh and Komatsu,2015), which suggests the significance of the glycolytic pathwayin the adaptation to flooding and drought conditions. Ohand Komatsu (2015) reported increased expression of allglycolysis related proteins under both drought and floodingresponses. The up-regulated expression of genes coding forthe glycolytic pathway enzymes, fructokinase (Glyma16g32530.1)and hexokinase (Glyma11g10130.1), under drought stress canbe considered an adaptive response of soybean under droughtstress. On the contrary, the transcript levels of glycolytic pathwayenzymes were not significantly affected under water deficitconditions in chickpea (Khanna et al., 2014). This suggests alegume specific adaptive variability under similar stress.
Cis-Regulation during Drought andFlooding TreatmentsThe analysis of cis regulatory elements showed that althoughthe genes between drought up-regulated and flooding down-regulated DEGs shared a common motif, they might have asimilar function with opposite regulation under contrastingstress treatments. It has been reported that proteins with upto 67% amino acid sequence similarity may share similar high-affinity binding sequences, and prefer different low-affinity sites.However, even closely related TFs may have distinct DNA-binding profiles (Badis et al., 2009). The positions of the flankingsequence of motif sites also play an important role in achievingregulatory specificity within the TF families (Ciolkowski et al.,2008; Gordan et al., 2013). Therefore, it is possible that thisopposite regulation between drought up-regulated genes andflooding down-regulated genes with the same motif could bedue to the different TF binding sites or because of the differentsite specific cofactors with the same affinity for the same TFbinding sites, which leads to activation or repression of the targetgenes.
CONCLUSION
Plant responses toward abiotic stress are complex and involveseveral different mechanisms regulated by crosstalk betweengenes related to hormonal signaling, photosynthesis, respiration,and transcriptional regulations. Comparative transcriptomeprofiling performed in this study under drought and flooding hasprovided an opportunity to evaluate the categorized molecularresponses. Besides having contrasting stress conditions, manycommon molecular mechanisms were observed to be involvedunder drought and flooding. A notable example is the ABArelated TFs that are up-regulated under both drought andflood conditions. ABA is considered as the stress relatedhormone and seems to be a key regulator under bothconditions. Unlike rice and Arabidopsis, the ABA mediatedstress response in soybean under flooding stress is independentof the SUB1 pathway. Another important aspect highlightedhere is the reduced overall metabolic activity under floodingstress, which supports the quiescence rather than the escapemechanism.
The resource of DEGs and also the validated expression ofkey genes featured in various metabolic pathways under droughtand flooding stress will be helpful in understanding the complexmechanisms of stress tolerance. The study further substantiatesand elaborates the affected photosynthetic capacity and sugarmetabolism under these stresses in soybean. In addition, an in-depth insight into the TFs associated with drought and floodingresponsive genes points toward a more complex and intricategene regulatory network. In particular, genes encoding for LHC,sugar transporters, and the cell wall composition were identifiedto play a crucial role in combating stress. These genes could betargeted as potential candidates for functional validation and canalso be considered for study in other legumes affected by similarstresses.
AUTHOR CONTRIBUTIONS
WC, QY, GP, and GA are all equal contributing authors forthis manuscript. WC, BV, HTN designed the experiment.QY, GP, GA, RD, LL, DX, YCA, performed bioinformaticsanalysis. WC, GP, GA, and RD performed data mining,analysis and interpretation. RD, GP, and GA contributed todrafting the manuscript. WC, BW, SP, and LS performedgreenhouse experiment, tissue collection, RNA isolationand qRT-PCR analysis. YW constructed RNAseq library.RKV and HTN conceived the study and edited themanuscript. All authors read and approved the finalmanuscript.
ACKNOWLEDGMENTS
The authors gratefully acknowledge the funding support forthis study from United Soybean Board and Missouri SoybeanMerchandising Council. The authors acknowledge Mr. RickMeyer for his help in conducting cis-element analysis. Theauthors also would like to thank Theresa A. Musket for editingthe manuscript.
Frontiers in Plant Science | www.frontiersin.org 16 July 2016 | Volume 7 | Article 1044
Chen et al. Soybean RNAseq under Drought and Flooding
SUPPLEMENTARY MATERIAL
The Supplementary Material for this article can be foundonline at: http://journal.frontiersin.org/article/10.3389/fpls.2016.01044
Supplementary Figure 1 | RNA-Seq analysis workflow for drought and
flood stressed soybean leaf samples.
Supplementary Figure 2 | Scatter plots of differentially expressed genes
under (A) drought (B) flooding stress.
Supplementary Figure 3 | Tetrapyrrole under (A) drought and (B) flooding.
Under flooding stress, this pathway is down-regulated.
Supplementary Figure 4 | The sucrose starch synthesis pathway under (A)
drought and (B) flooding.
Supplementary Figure 5 | DEGs categorized in different metabolic
functions. Up- and down-regulation of genes under (A) drought and (B) flooding
are represented by colored squares.
Supplementary Figure 6 | DEGs categorized and mapped in primary
metabolic pathways under (A) drought and (B) flooding conditions in
soybean. The log2 fold change value of a DEG is represented by colored
squares.
Supplementary Figure 7 | The cell wall precursors synthesis pathway
under (A) drought and (B) flooding.
Supplementary Table 1 | List of genes with confident expression in
drought stressed leaf tissue compared to non-stressed control tissue. (B)
List of genes with confident expression in flooding stressed leaf tissue
compared to non-stressed control tissue.
Supplementary Table 2 | List of DEGs in, (A) drought, (B) flooding stressed
leaf tissue compared to non-stressed control tissue. (C) List of DEGs in
flooding stressed leaf tissue compared to drought stressed leaf tissue.
Supplementary Table 3 | Significant GO terms among (A) up-regulated
genes under drought; (B) down-regulated genes under drought; (C)
up-regulated genes under flooding, and (D) down-regulated genes under
flooding conditions.
Supplementary Table 4 | (A) Overrepresented motifs from the significantly
changed flooding and drought gene sets. (B) Common motifs shared by flooding
and drought response genes.
Supplementary Table 5 | Primers used in the qRT-PCR analysis.
REFERENCES
Agarwal, G., Choudhary, D., Singh, V. P., and Arora, A. (2012). Role of ethylene
receptors during senescence and ripening in horticultural crops. Plant Signal.
Behav. 7, 827–846. doi: 10.4161/psb.20321
Ahmed, F., Rafii, M. Y., Ismail, M. R., Juraimi, A. S., Rahim, H. A., Asfaliza, R., et al.
(2013). Waterlogging tolerance of crops: breeding, mechanism of tolerance,
molecular approaches, and future prospects. BioMed Res. Int. 2013:963525. doi:
10.1155/2013/963525
Ashburner, M., Ball, C. A., Blake, J. A., Botstein, D., Butler, H., Cherry, J. M., et al.
(2000). Gene ontology: tool for the unification of biology. The Gene Ontology
Consortium. Nat. Genet. 25, 25–29. doi: 10.1038/75556
Badis, G., Berger, M. F., Philippakis, A. A., Talukder, S., Gehrke, A. R., Jaeger, S.
A., et al. (2009). Diversity and complexity in DNA recognition by transcription
factors. Science 324, 1720–1723. doi: 10.1126/science.1162327
Bailey-Serres, J., Lee, S. C., and Brinton, E. (2012). Waterproofing crops:
effective flooding survival strategies. Plant Physiol. 160, 1698–1709. doi:
10.1104/pp.112.208173
Beynon, E. R., Symons, Z. C., Jackson, R. G., Lorenz, A., Rylott, E. L., and Bruce,
N. C. (2009). The role of oxophytodienoate reductases in the detoxification of
the explosive 2, 4, 6-trinitrotoluene by Arabidopsis. Plant Physiol. 151, 253–261.
doi: 10.1104/pp.109.141598
Bhargava, A., Clabaugh, I., To, J. P., Maxwell, B. B., Chiang, Y. H., Schaller, G.
E., et al. (2013). Identification of cytokinin-responsive genes using microarray
meta-analysis and RNA-Seq in Arabidopsis. Plant Physiol. 162, 272–294. doi:
10.1104/pp.113.217026
Biehler, K., and Fock, H. (1996). Evidence for the contribution of the Mehler-
peroxidase reaction in dissipating excess electrons in drought-stressed wheat.
Plant Physiol. 112, 265–272.
Burke, J. J. (2007). Evaluation of source leaf responses to water-deficit stresses
in cotton using a novel stress bioassay. Plant Physiol. 143, 108–121. doi:
10.1104/pp.106.087783
Chen, W., He, S., Liu, D., Patil, G. B., Zhai, H., Wang, F., et al. (2015). A
Sweetpotato geranylgeranyl pyrophosphate synthase gene, IbGGPS, increases
carotenoid content and enhances osmotic stress tolerance in Arabidopsis
thaliana. PLoS ONE 16:e0137623. doi: 10.1371/journal.pone.0137623
Chinnusamy, V., Schumaker, K., and Zhu, J. K. (2004). Molecular genetic
perspectives on cross-talk and specificity in abiotic stress signaling in plants.
J. Exp. Bot. 55, 225–236. doi: 10.1093/jxb/erh005
Ciolkowski, I., Wanke, D., Birkenbihl, R. P., and Somssich, I. E. (2008). Studies on
DNA-binding selectivity of WRKY transcription factors lend structural clues
into WRKY-domain function. Plant Mol. Biol. 68, 81–92. doi: 10.1007/s11103-
008-9353-1
Clement, M., Lambert, A., Herouart, D., and Boncompagni, E. (2008).
Identification of new up-regulated genes under drought stress in soybean
nodules. Gene 426, 15–22. doi: 10.1016/j.gene.2008.08.016
Cruz De Carvalho, M. H. (2008). Drought stress and reactive oxygen species:
production, scavenging and signaling. Plant Signal. Behav. 3, 156–165. doi:
10.4161/psb.3.3.5536
Dat, J. F., Capelli, N., Folzer, H., Bourgeade, P., and Badot, P. M. (2004). Sensing
and signaling during plant flooding. Plant Physiol. Biochem. 42, 273–282. doi:
10.1016/j.plaphy.2004.02.003
Deshmukh, R., Sonah, H., Patil, G., Chen, W., Prince, S., Mutava, R., et al. (2014).
Integrating omic approaches for abiotic stress tolerance in soybean. Front. Plant
Sci. 5:244. doi: 10.3389/fpls.2014.00244
Dubos, C., Stracke, R., Grotewold, E., Weisshaar, B., Martin, C., and Lepiniec,
L. (2010). MYB transcription factors in Arabidopsis. Trends Plant Sci. 15,
573–581. doi: 10.1016/j.tplants.2010.06.005
Else, M. A., Davies, W. J., Malone, M., and Jackson, M. B. (1995). A negative
hydraulic message from oxygen-deficient roots of tomato plants? (influence of
soil flooding on leaf water potential, leaf expansion, and synchrony between
stomatal conductance and root hydraulic conductivity). Plant Physiol. 109,
1017–1024.
Foster, R., Izawa, T., and Chua, N. H. (1994). Plant basic leucine zipper proteins
gather at ACGT elements. EMBO J. 8, 192–200.
Foyer, C. H., and Shigeoka, S. (2011). Understanding oxidative stress and
antioxidant functions to enhance photosynthesis. Plant Physiol. 155, 93–100.
doi: 10.1104/pp.110.166181
Fukao, T., Yeung, E., and Bailey-Serres, J. (2011). The submergence tolerance
regulator SUB1A mediates crosstalk between submergence and drought
tolerance in rice. Plant Cell 23, 412–427. doi: 10.1105/tpc.110.080325
Gordan, R., Shen, N., Dror, I., Zhou, T., Horton, J., Rohs, R., et al. (2013). Genomic
regions flanking E-box binding sites influence DNA binding specificity of
bHLH transcription factors through DNA shape. Cell Rep. 3, 1093–1104. doi:
10.1016/j.celrep.2013.03.014
Hao, Y. J., Wei, W., Song, Q. X., Chen, H. W., Zhang, Y. Q., Wang, F., et al.
(2011). Soybean NAC transcription factors promote abiotic stress tolerance
and lateral root formation in transgenic plants. Plant J. 68, 302–313. doi:
10.1111/j.1365-313X.2011.04687.x
Hattori, T., Totsuka, M., Hobo, T., Kagaya, Y., and Yamamoto-Toyoda,
A. (2002). Experimentally determined sequence requirement of ACGT-
containing abscisic acid response element. Plant Cell Physiol. 43, 136–140. doi:
10.1093/pcp/pcf014
Higo, K., Ugawa, Y., Iwamoto, M., and Korenaga, T. (1999). Plant cis-acting
regulatory DNA elements (PLACE) database. Nucleic Acids Res. 27, 297–300.
doi: 10.1093/nar/27.1.297
Frontiers in Plant Science | www.frontiersin.org 17 July 2016 | Volume 7 | Article 1044
Chen et al. Soybean RNAseq under Drought and Flooding
Izawa, T., Foster, R., and Chua, N. H. (1993). Plant bZIP protein DNA binding
specificity. J. Mol. Biol. 230, 1131–1144. doi: 10.1006/jmbi.1993.1230
Jin, J., Zhang, H., Kong, L., Gao, G., and Luo, J. (2014). PlantTFDB 3.0: a portal
for the functional and evolutionary study of plant transcription factors. Nucleic
Acids Res. 42, D1182–1187. doi: 10.1093/nar/gkt1016
Khanna, S. M., Taxak, P. C., Jain, P. K., Saini, R., and Srinivasan, R. (2014).
Glycolytic enzyme activities and gene expression in Cicer arietinum exposed
to water-deficit stress. Appl. Biochem. Biotechnol. 173, 2241–2253. doi:
10.1007/s12010-014-1028-6
Kim, D., Pertea, G., Trapnell, C., Pimentel, H., Kelley, R., and Salzberg, S. L. (2013).
TopHat2: accurate alignment of transcriptomes in the presence of insertions,
deletions and gene fusions. Genome Biol. 14:R36. doi: 10.1186/gb-2013-
14-4-r36
Kim, T. H. (2014). Mechanism of ABA signal transduction: agricultural highlights
for improving drought tolerance. J. Plant Biol. 57, 1. doi: 10.1007/s12374-014-
0901-8
Klok, E. J., Wilson, I. W., Wilson, D., Chapman, S. C., Ewing, R. M., Somerville,
S. C., et al. (2002). Expression profile analysis of the low-oxygen response in
Arabidopsis root cultures. Plant Cell 14, 2481–2494. doi: 10.1105/tpc.004747
Knight, L. I., Rose, R. C., and Crocker,W. (1910). Effect of various gases and vapors
upon etiolated seedlings of the sweet pea. Science 31, 635–636.
Koberg, M., Abu-Much, R., and Gedanken, A. (2011). Optimization of bio-
diesel production from soybean and wastes of cooked oil: combining dielectric
microwave irradiation and a SrO catalyst. Bioresour. Technol. 102, 1073–1078.
doi: 10.1016/j.biortech.2010.08.055
Komatsu, S., Yamamoto, R., Nanjo, Y., Mikami, Y., Yunokawa, H., and Sakata, K.
(2009). A comprehensive analysis of the soybean genes and proteins expressed
under flooding stress using transcriptome and proteome techniques. J Proteom.
Res. 8, 4766–4778. doi: 10.1021/pr900460x
Kosegarten, H., Judel, G. K., and Mengel, K. (1988). Activity of UDP-glucose
glucosyl transferase and its role in the carbohydrate metabolism of wheat
caryopsis. J. Plant Physiol. 133, 126–128. doi: 10.1016/S0176-1617(88)80100-7
Krasensky, J., and Jonak, C. (2012). Drought, salt, and temperature stress-induced
metabolic rearrangements and regulatory networks. J. Exp. Bot. 63, 1593–1608.
doi: 10.1093/jxb/err460
Kreuzwieser, J., Hauberg, J., Howell, K. A., Carroll, A., Rennenberg, H., Millar,
A. H., et al. (2009). Differential response of gray poplar leaves and roots
underpins stress adaptation during hypoxia. Plant Physiol. 149, 461–473. doi:
10.1104/pp.108.125989
Langmead, B., and Salzberg, S. L. (2012). Fast gapped-read alignment with Bowtie2.
Nat. Methods 9, 357–359. doi: 10.1038/nmeth.1923
Le, D. T., Nishiyama, R., Watanabe, Y., Tanaka, M., Seki, M., Ham
Le, H., et al. (2012). Differential gene expression in soybean leaf
tissues at late developmental stages under drought stress revealed
by genome-wide transcriptome analysis. PLoS ONE 7:e49522. doi:
10.1371/journal.pone.0049522
Lee, Y. H., Kim, K. S., Jang, Y. S., Hwang, J. H., Lee, D. H., and Choi, I. H. (2014).
Global gene expression responses to waterlogging in leaves of rape seedlings.
Plant Cell Rep. 33, 289–299. doi: 10.1007/s00299-013-1529-8
Lemoine, R., La Camera, S., Atanassova, R., Dedaldechamp, F., Allario, T.,
Pourtau, N., et al. (2013). Source-to-sink transport of sugar and regulation
by environmental factors. Front. Plant Sci. 4:272. doi: 10.3389/fpls.2013.
00272
Maruyama, K., Todaka, D., Mizoi, J., Yoshida, T., Kidokoro, S., Matsukura,
S., et al. (2012). Identification of cis-acting promoter elements in cold-
and dehydration-induced transcriptional pathways in Arabidopsis, rice, and
soybean. DNA Res. 19, 37–49. doi: 10.1093/dnares/dsr040
Mizoi, J., Shinozaki, K., and Yamaguchi-Shinozaki, K. (2012). AP2/ERF family
transcription factors in plant abiotic stress responses. Biochim. Biophys. Acta
1819, 86–96. doi: 10.1016/j.bbagrm.2011.08.004
Moore, J. P., Vicre-Gibouin, M., Farrant, J. M., and Driouich, A. (2008).
Adaptations of higher plant cell walls to water loss: drought vs. desiccation.
Physiol. Plant. 134, 237–245. doi: 10.1111/j.1399-3054.2008.01134.x
Nakashima, K., Takasaki, H., Mizoi, J., Shinozaki, K., and Yamaguchi-Shinozaki,
K. (2012). NAC transcription factors in plant abiotic stress responses. Biochim.
Biophys. Acta 1819, 97–103. doi: 10.1016/j.bbagrm.2011.10.005
Nakatsuka, A., Murachi, S., Okunishi, H., Shiomi, S., Nakano, R., Kubo,
Y., et al. (1998). Differential expression and internal feedback regulation
of 1-aminocyclopropane-1-carboxylate synthase, 1-aminocyclopropane-
1-carboxylate oxidase, and ethylene receptor genes in tomato fruit
during development and ripening. Plant Physiol. 118, 1295–1305. doi:
10.1104/pp.118.4.1295
Nanjo, Y., Maruyama, K., Yasue, H., Yamaguchi-Shinozaki, K., Shinozaki, K.,
and Komatsu, S. (2011). Transcriptional responses to flooding stress in roots
including hypocotyl of soybean seedlings. Plant Mol. Biol. 77, 129–144. doi:
10.1007/s11103-011-9799-4
Oh, M., and Komatsu, S. (2015). Characterization of proteins in soybean
roots under flooding and drought stresses. J. Proteomics 114, 161–181. doi:
10.1016/j.jprot.2014.11.008
Park, S. Y., Fung, P., Nishimura, N., Jensen, D. R., Fujii, H., Zhao, Y., et al. (2009).
Abscisic acid inhibits type 2C protein phosphatases via the PYR/PYL family of
START proteins. Science 324, 1068–1071. doi: 10.1126/science.1173041
Patil, G., and Nicander, B. (2013). Identification of two additional members of the
tRNA isopentenyltransferase family in Physcomitrella patens. Plant Mol. Biol.
82, 417–426. doi: 10.1007/s11103-013-0072-x
Patil, G., Do, T., Vuong, T. D., Valliyodan, B., Lee, J. D., Chaudhary, J., et al.
(2016). Genomic-assisted haplotype analysis and the development of high-
throughput SNP markers for salinity tolerance in soybean. Sci. Rep. 19:19199.
doi: 10.1038/srep19199
Patil, G., Valliyodan, B., Deshmukh, R., Prince, S., Nicander, B., Zhao, M.,
et al. (2015). Soybean (Glycine max) SWEET gene family: insights through
comparative genomics, transcriptome profiling and whole genome re-sequence
analysis. BMC Genomics 16, 520–535. doi: 10.1186/s12864-015-1730-y
Peleg, Z., and Blumwald, E. (2011). Hormone balance and abiotic stress
tolerance in crop plants. Curr. Opin. Plant Biol. 14, 290–295. doi:
10.1016/j.pbi.2011.02.001
Pelleschi, S., Rocher, J. P., and Prioul, J. L. (1997). Effect of water restriction on
carbohydratemetabolism and photosynthesis inmaturemaize leaves. Plant Cell
Environ. 20, 493–503. doi: 10.1046/j.1365-3040.1997.d01-89.x
Perata, P., Armstrong, W., and Voesenek, L. A. (2011). Plants and flooding stress.
New Phytol. 190, 269–273. doi: 10.1111/j.1469-8137.2011.03702.x
Priest, H. D., Filichkin, S. A., and Mockler, T. C. (2009). Cis-regulatory
elements in plant cell signaling. Curr. Opin. Plant Biol. 12, 643–649. doi:
10.1016/j.pbi.2009.07.016
Saika, H., Okamoto, M., Miyoshi, K., Kushiro, T., Shinoda, S., Jikumaru, Y., et al.
(2007). Ethylene promotes submergence-induced expression of OsABA8ox1, a
gene that encodes ABA 8’-hydroxylase in rice. Plant Cell Physiol. 48, 287–298.
doi: 10.1093/pcp/pcm003
Severin, A. J.,Woody, J. L., Bolon, Y. T., Joseph, B., Diers, B.W., Farmer, A. D., et al.
(2010). RNA-Seq Atlas of Glycine max: a guide to the soybean transcriptome.
BMC Plant Biol. 10:160. doi: 10.1186/1471-2229-10-160
Siddique, S., Endres, S., Sobczak, M., Radakovic, Z. S., Fragner, L., Grundler, F. M.,
et al. (2013). Myo-inositol oxygenase is important for the removal of excess
myo-inositol from syncytia induced by Heterodera schachtii in Arabidopsis
roots. New Phytol. 201, 476–485. doi: 10.1111/nph.12535
Steffens, B., Steffen-Heins, A., and Sauter, M. (2013). Reactive oxygen species
mediate growth and death in submerged plants. Front. Plant Sci. 4:179. doi:
10.3389/fpls.2013.00179
Suzuki, M., Ketterling, M. G., and Mccarty, D. R. (2005). Quantitative statistical
analysis of cis-regulatory sequences in ABA/VP1- and CBF/DREB1-regulated
genes of Arabidopsis. Plant Physiol. 139, 437–447. doi: 10.1104/pp.104.058412
Syed, N. H., Prince, S. J., Mutava, R. N., Patil, G., Li, S., Chen, W., et al. (2015).
Core clock, SUB1, and ABAR genes mediate flooding and drought responses
via alternative splicing in soybean. J. Exp. Bot. 66, 7129–7149. doi: 10.1093/jxb/
erv407
Tabaeizadeh, Z. (1998). Drought-induced responses in plant cells. Int. Rev. Cytol.
182, 193–247. doi: 10.1016/S0074-7696(08)62170-1
Tezara, W., Mitchell, V. J., Driscoll, S. D., and Lawlor, D. W. (1999). Water stress
inhibits plant photosynthesis by decreasing coupling factor and ATP. Nature
401, 914–917. doi: 10.1038/44842
Trapnell, C., Hendrickson, D. G., Sauvageau, M., Goff, L., Rinn, J. L., and Pachter,
L. (2013). Differential analysis of gene regulation at transcript resolution with
RNA-seq. Nat. Biotechnol. 31, 46–53. doi: 10.1038/nbt.2450
Trapnell, C., Pachter, L., and Salzberg, S. L. (2009). TopHat: discovering
splice junctions with RNA-Seq. Bioinformatics 25, 1105–1111. doi:
10.1093/bioinformatics/btp120
Frontiers in Plant Science | www.frontiersin.org 18 July 2016 | Volume 7 | Article 1044
Chen et al. Soybean RNAseq under Drought and Flooding
Trapnell, C., Roberts, A., Goff, L., Pertea, G., Kim, D., Kelley, D. R., et al.
(2012). Differential gene and transcript expression analysis of RNA-seq
experiments with TopHat and Cufflinks. Nat. Protoc. 7, 562–578. doi:
10.1038/nprot.2012.016
Usadel, B., Poree, F., Nagel, A., Lohse, M., Czedik-Eysenberg, A., and Stitt, M.
(2009). A guide to using MapMan to visualize and compare Omics data
in plants: a case study in the crop species, Maize. Plant Cell Environ. 32,
1211–1229. doi: 10.1111/j.1365-3040.2009.01978.x
Valliyodan, B., and Nguyen, H. T. (2006). Understanding regulatory networks and
engineering for enhanced drought tolerance in plants. Curr. Opin. Plant Biol. 9,
189–195. doi: 10.1016/j.pbi.2006.01.019
Varshney, R. K., Nayak, S. N., May, G. D., and Jackson, S. A. (2009).
Next-generation sequencing technologies and their implications for
crop genetics and breeding. Trends Biotechnol. 27, 522–530. doi:
10.1016/j.tibtech.2009.05.006
Vick, B. A., and Zimmerman, D. C. (1984). Biosynthesis of jasmonic acid by several
plant species. Plant Physiol. 75, 458–461. doi: 10.1104/pp.75.2.458
Vidal, R. O., Do, L. C., Mondego, J. M., Pereira, G. A., and Carazzolle, M. F.
(2012). Identification of SNPs in RNA-seq data of two cultivars of Glycine max
(soybean) differing in drought resistance. Genet. Mol. Biol. 35, 331–334. doi:
10.1590/S1415-47572012000200014
Voesenek, L. A., Colmer, T. D., Pierik, R., Millenaar, F. F., and Peeters, A. J. (2006).
How plants cope with complete submergence. New Phytol. 170, 213–226. doi:
10.1111/j.1469-8137.2006.01692.x
Wang, D., Pan, Y., Zhao, X., Zhu, L., Fu, B., and Li, Z. (2011). Genome-wide
temporal-spatial gene expression profiling of drought responsiveness in rice.
BMC Genomics 12:149. doi: 10.1186/1471-2164-12-149
Wrzaczek, M., Vainonen, J. P., Gauthier, A., Overmyer, K., and Kangasjärvi, J.
(2011). “Reactive oxygen in abiotic stress perception - from genes to proteins,”
in Abiotic Stress Response in Plants, eds A. Shanker and B. Venkateswarlu
(Rijeka: InTech), 27–55.
Xing, S. F., Miao, J., Li, S. A., Qin, G. J., Tang, S., Li, H. N., et al.
(2010). Disruption of the 1-deoxy-D-xylulose-5-phosphate reductoisomerase
(DXR) gene results in albino, dwarf and defects in trichome initiation
and stomata closure in Arabidopsis. Cell Res. 20, 688–700. doi: 10.1038/cr.
2010.54
Xiong, L., and Zhu, J. K. (2002). Molecular and genetic aspects of plant responses
to osmotic stress. Plant Cell Environ. 25, 131–139. doi: 10.1046/j.1365-
3040.2002.00782.x
Xu, K., Xu, X., Fukao, T., Canlas, P., Maghirang-Rodriguez, R., Heuer, S.,
et al. (2006). Sub1A is an ethylene-response-factor-like gene that confers
submergence tolerance to rice. Nature 442, 705–708. doi: 10.1038/nature04920
Conflict of Interest Statement: The authors declare that the research was
conducted in the absence of any commercial or financial relationships that could
be construed as a potential conflict of interest.
Copyright © 2016 Chen, Yao, Patil, Agarwal, Deshmukh, Lin, Wang, Wang, Prince,
Song, Xu, An, Valliyodan, Varshney and Nguyen. This is an open-access article
distributed under the terms of the Creative Commons Attribution License (CC BY).
The use, distribution or reproduction in other forums is permitted, provided the
original author(s) or licensor are credited and that the original publication in this
journal is cited, in accordance with accepted academic practice. No use, distribution
or reproduction is permitted which does not comply with these terms.
Frontiers in Plant Science | www.frontiersin.org 19 July 2016 | Volume 7 | Article 1044


![A Pair of Allelic WRKY Genes Play Opposite Roles inA Pair of Allelic WRKY Genes Play Opposite Roles in Rice-Bacteria Interactions1[C][W][OA] Zeng Tao, Hongbo Liu, Deyun Qiu, Yan Zhou,](https://img.pdfslide.us/doc/110x75/5ec766bc0581441c0d0314ee/a-pair-of-allelic-wrky-genes-play-opposite-roles-in-a-pair-of-allelic-wrky-genes.jpg)