Embed Size (px)
Citation preview
Identification and characterization of novel keratin
associated proteins using a genetic interaction
screening system
Dissertation
zur
Erlangung des Doktorgrades (Dr. rer. Nat.)
der
Mathematisch-Naturwissenschaftlichen Fakultät
der
Rheinischen Friedrich-Wilhelms-Universität Bonn
vorgelegt von
Prashanth H.C
aus
Shimoga, Indien
-Bonn, Februar 2009-
Angefertigt mit Genehmigung der Mathematisch-Naturwissenschaftlichen
Fakultät der Rheinischen Friedrich-Wilhelms-Universität Bonn
Diese Dissertation ist auf dem Hochschulschriftenserver der ULB Bonn
http://hss.ulb.uni-bonn.de/diss_online elektronisch publiziert
Erscheinungsjahr: 2009
Tag der Promotion: _._.2009
Gutachter
1. Prof. Dr. Thomas Magin
2. Prof. Dr. Michael Hoch

Die vorliegende Arbeit wurde in der Zeit von April 2005 bis Februar 2009 am
Institut für Biochemie und Molekularbiologie der Universität Bonn, Nussallee
11 unter Leitung von Prof. Thomas Magin durchgeführt.

Acknowledgements
I would like to thank Prof. Thomas Magin who gave me an opportunity to work in his
research group, under whose supervision I chose this topic and began the thesis. His broad
knowledge, professional insight was of great importance and his valuable support and
guidance helped immensely to accomplish this work.
I would like to extend my sincere gratitude to Prof. Michael Hoch for being my second
supervisor and for allowing me to use his lab facilities for some of the experiments done in
this thesis.
I would like to thank Prof. Mechthild Hatzfeld and Dr. Andreas Schmid for kindly
providing Venus plasmids for this project.
I am very appreciative for the support provided by Dr. Christof Völker and Dr. Mekky
Abouzied to work with recombinant proteins.
I admire and thank sincerely all my former and present colleagues for their help, advice and
understanding, whose pleasant company has made my stay in Bonn immensely enjoyable.
I would like to thank all my friends and family members for their untiring support and
encouragement.
Index
Contents i
Figures v
List of tables vii
Abbreviations viii
1. Introduction 1
1.1 Keratins 1
1.1.1 Keratin 5 and Keratin 14 2
1.1.2 Keratin organization and expression in the cells 3
1.1.3 Structure and organization of keratins 5
1.1.4 Known keratin interactions and functions 7
Keratins and vesicle transport 7
Role of keratins in wound healing 9
Role of keratins in microtubule localization 9
Role of keratins in epithelial polarization 10
Keratin response in stress conditions 10
1.1.5 Keratin disorders in humans 11
Disorders of K5 and K14 12
1.2 Protein-protein interactions 15
1.2.1 General classification of detection methods 15
1.2.2 Yeast two-hybrid 16
Sos recruitment system (SRS) 17
1.2.3 The Bimolecular Fluorescence Complementation assay 18
2. Aim 20
3. Materials and Methods 21
3.1 Materials 21
3.1.1 Chemicals used 21
3.1.2 Ready-to-use solutions / reagents 21
3.1.3 Kits 22
3.1.4 Solutions for DNA analysis 22
3.1.5. Solutions for bacterial cultures 24
3.1.6 Media and reagents for yeast two hybrid screening 25
3.1.7 Solutions for protein biochemistry 27
3.1.8 Bacterial strain 29
i
Index
3.1.9 Yeast strain 29
3.1.10 Primers 29
3.1.11 Plasmids 31
3.1.12. Antibodies 32
3.1.13 General Lab Materials 32
3.1.14 Equipment and materials used 33
3.2 Methods 34
3.2.1 Molecular biological methods 34
3.2.1.1 Polymerase Chain Reaction 34
3.2.1.2 Ligation of PCR products 35
3.2.1.3 Transformation and culture of E.coli 35
3.2.1.4 Preparation of plasmid DNA 35
3.2.1.4.1 Plasmid DNA isolation (mini preparation) 35
3.2.1.4.2 Preparative Plasmid DNA isolation (midi/maxi preparations) 36
3.2.1.5 DNA restriction digestion 36
3.2.1.6 Agarose gel electrophoresis 36
3.2.1.7 Isolation of DNA fragments from agarose gel 36
3.2.1.8 DNA precipitation in ethanol / isopropanol 36
3.2.1.9 Concentration determination of nucleic acids 37
3.2.1.10 Sequencing of DNA 37
3.2.1.11 Southern blotting 37
3.2.1.12 Isolation of RNA 38
3.2.1.13 Amplification of p86DM by RT-PCR from isolated RNA 39
3.2.2 Cell culture methods 39
3.2.2.1 Passage of mammalian cells 39
3.2.2.2 Freezing and storage of cells 39
3.2.2.3 Thawing of cells 39
3.2.2.4 Cell counting 40
3.2.2.5 Transient transfection of eukaryotic cells 40
3.2.2.6 Immunocytochemistry 40
3.2.3 Screening of keratin associated proteins using Sos recruitment system 40
3.2.3.1 Establishing streaked yeast agar plate 40
3.2.3.2 Preparation of - 80°C yeast glycerol stock 40
3.2.3.3 Verification of yeast host strain marker phenotype 41
ii
Index
3.2.3.3 Preparation of cdc25H yeast competent cells 41
3.2.3.4 Transforming yeast and detecting protein-protein interactions 42
3.2.3.5 Library screening 43
3.2.3.6 Verification of interaction by yeast co transformation 44
3.2.4 Expression, purification and analysis of recombinant p86DM 45
3.2.4.1 Expression His SUMO fused-p86DM protein 45
3.2.4.2 Purification of recombinant His SUMO fused-p86DM protein 45
3.2.4.3 SDS –Polyacrylamide gel electrophoresis (SDS-PAGE) 46
3.2.4.4 Western Blotting 46
4. Results
4.1 Screening of keratin associated proteins by yeast two hybrid system 48
4.1.1 Target cDNA library construction 48
4.1.2 Bait plasmid construction 49
4.1.3 Verification of yeast host strain marker phenotype 49
4.1.4 Confirmation for absence of temperature revertants 50
4.1.5 Control plasmids 50
4.1.6 Verification of bait plasmid suitability for screening assays 51
4.1.6.1 Verification for auto-activation 52
4.1.6.2 Verifying bait insert cloning and expression 54
Expression and cytoplasmic localization of K5 and K14
domains in frame with Sos protein 54
4.1.7 Detection of keratin associated proteins by cotransformation
of K5/ K14 bait plasmids and target cDNA library 55
4.1.7.1 Cotransformation of pSos MAFB – pMyr MAFB
and pSos Col I – pMyr MAFB 57
4.1.8 Identification of positive candidates from screening 59
4.2 Verification of the positive interacting candidates in mammalian
cell culture system 64
4.2.1 Positive control for BiFC studies V1–Flag–p0071 WT
and V2–HA–RhoA WT 65
4.2.2 Confirmation of interaction between keratin14 and AP2β
by BiFC 67
4.2.2.1 Cotransformation of full length cDNA inserted
K14-pVen1flag and AP2β-pVen2 HA plasmids 68
iii
Index
4.2.2.2 Individual transformation of full length cDNA
inserted K14-pVen1flag and AP2β-pVen2 HA plasmids 69
4.2.2.3 Cotransformation of full length cDNA inserted
and empty Venus plasmids 70
4.2.3 Confirmation of interaction between K14 and Rab34 by BiFC 72
4.2.3.1 Cotransformation of full length cDNA inserted
K14-pVen1flag and Rab34-pVen2 HA plasmids 73
4.2.3.2 Individual transformation of full length cDNA inserted
K14-pVen1flag and Rab34-pVen2 HA plasmids 74
4.2.3.3 Cotransformation of full length cDNA inserted and
empty Venus plasmids 75
4.2.4 BiFC analysis for verifying interactions between K14
with 14-3-3τ and p86DM 77
4.2.5 Analysis of p86DM 77
4.2.5.1 Identification of p86DM coding sequence 78
4.2.5.2 Functional Studies 79
4.2.5.3 Interaction of p86DM with actin 80
4.2.5.3.1 Cotransformation of p86DM-pVen1 and Y-C-actin
Plasmids 81
4.2.5.3.2 Individual transformation of full length cDNA
inserted p86DM-Ven1-N and Y-C-actin plasmids 82
4.2.5.3.3 Cotransformation of full length cDNA inserted and
empty Venus plasmids 83
4.2.5.4 Expression of recombinant p86DM 84
5. Discussion 86
Keratins and 14-3-3τ 90
Keratins and Rab34 91
Keratins and AP-2β 93
Analysis of p86DM 95
6. Summary 97
7. References 99
8. Curriculum Vitae 108
iv
Index
Figures
Figure 1.1: Keratin expression in the epidermis 2
Figure 1.2: Keratin organization and expression in the cells 3
Figure 1.3: Organization of keratin filaments in cell 4
Figure 1.4: Structure and organization of keratins 6
Figure 1.5: Schematic representation of keratin protein depicting the structural
domains and common mutation sites 8
Figure 1.6: Schematic representation of SRS 17
Figure 1.7: Principle and dynamics of bimolecular fluorescence complementation 18
Figure 4.1: Size range of inserted cDNA fragments in the target cDNA library 48
Figure 4.2: No growth confirms suitability of the keratin5 bait constructs for two
hybrid screening 52
Figure 4.3: No growth confirms the suitability of keratin14 bait constructs for two
hybrid screening 53
Figure 4.4: Growth of cotransformed yeast colonies confirms the integrity and
expression of Sos-K5 head, rod and tail domains in cdc-25H 55
Figure 4.5: Growth of cotransformed yeast colonies confirms the integrity and
expression of Sos-K14 head, rod and tail domains in cdc-25H 55
Figure 4.6: Positive and negative controls for yeast two hybrid screening 57
Figure 4.7: Negative control for yeast two hybrid screening 58
Figure 4.8: Selection of temperature sensitive cotransformed yeast colonies 59
Figure 4.9: An example of BLAST report 61
Figure 4.10: Transfection of Venus plasmids used as positive control for
BiFC experiments 65
Figure 4.11: Schematic representation of the Venus-YFP constructs 67
Figure 4.12: BiFC analysis of transiently transfected MCF7 cells with AP2β
and K14 Venus constructs 68
Figure 4.13: BiFC analysis of transiently transfected MCF7 cells with AP2β
and K14 Venus constructs 69
Figure 4.14: Negative control for BiFC analysis of transiently transfected MCF7 cells 70
Figure 4.15: BiFC analysis of transiently transfected MCF7 cells with RAB34
and keratin 14 Venus constructs 73
Figure 4.16: Negative control BiFC analysis of transiently transfected MCF7 cells
with RAB 34 and keratin14 Venus constructs 74
v
Index
Figure 4.17: Negative control for BiFC analysis of transiently transfected MCF7 cells 75
Figure 4.18: Sequence analysis of p86DM predicted 5 different transcript variants
in humans with 4 to 10 number of exons 77
Figure 4.19: Size of PCR amplified cDNA products from Caco2 isloated RNA 78
Figure 4.20: Restriction analysis with Ava I to differentiate between the two transcripts 79
Figure 4.21: Schematic representation of p86DM gene, transcript and protein 80
Figure 4.22: BiFC analysis of transiently transfected MCF7 cells with
p86DM-Ven1-N and Y-C-actin Venus constructs 81
Figure 4.23: BiFC analysis of transiently transfected MCF7 cells 82
Figure 4.24: BiFC analysis of transiently transfected MCF7 cells 83
Figure 4.25: BiFC analysis along with staining of transiently transfected MCF7 cells 84
Figure 4.26: Expression profile of p86DM after 210 min of induction
at 37oC and 27oC 85
Figure 4.27: western blot analysis of recombinantly expressed p86DM followed
by SUMO protease treatment to HIS-SUMO tag 85
Figure 5.1: Domain sequence coparison of K5/ K14 with K8/K18 88
vi
Index
List of tables
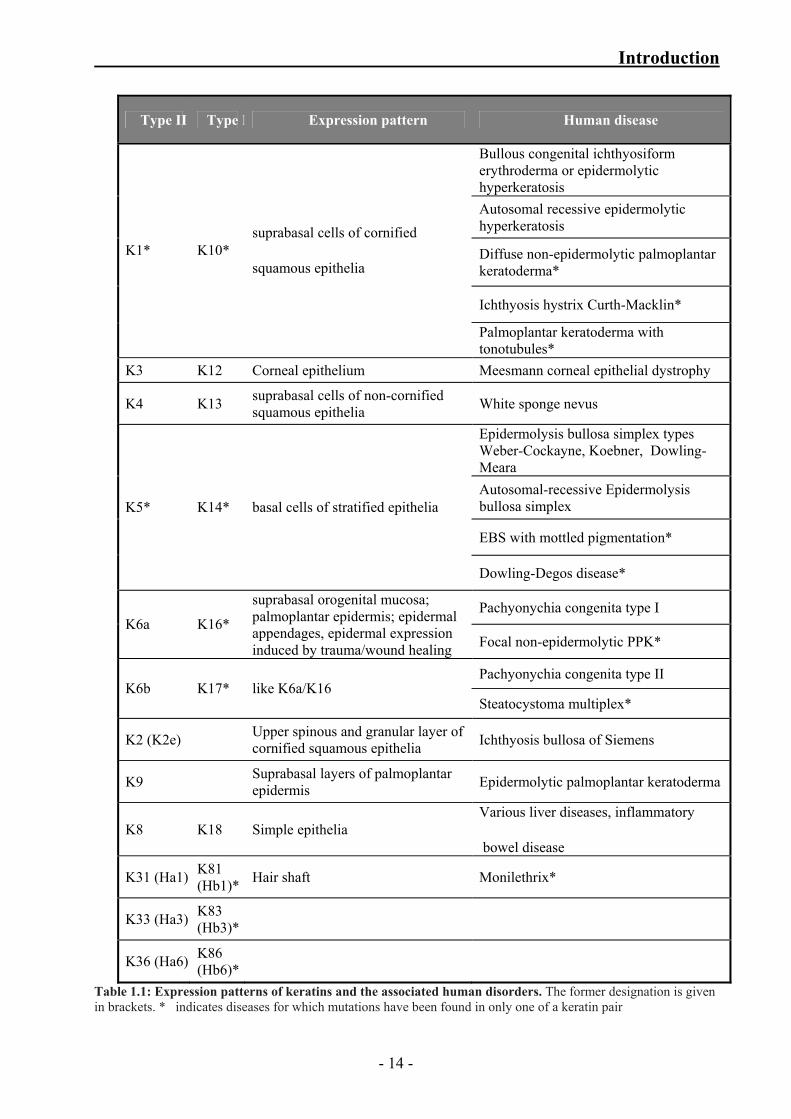
Table 1.1: Expression patterns of keratins and the associated human disorders 14
Table No 3.1.1: Solutions for DNA analysis 22
Table No 3.1.2: Solutions for bacterial cultures 24
Table No 3.1.3: Solutions for yeast cultures 25
Table No 3.1.4: Solutions for protein biochemistry 27
Table No 3.1.5: Bacterial strain genotype 29
Table No 3.1.6: Yeast strain genotype 29
Table No 3.1.7: List of primers used to prepare constructs 29
Table No 3.1.8: List of plasmids 31
Table No 3.1.9: List of antibodies 32
Table No 3.1.10: List of equipments 33
Table 3.2.1: PCR program for optimization of conditions using Taq
polymerase enzyme 34
Table 3.2.2: PCR program for optimization of conditions using proof reading
Taq polymerase enzyme 35
Table 3.2.3: Transforming yeast and detecting protein-protein interactions 43
Table 3.2.4: Composition of SDS polyacrylamide gels 46
Table 4.1: Cloning details of the bait inserts as fusion with hSos gene in pSos
expression vector 49
Table 4.2: Verification of yeast host strain marker phenotype by testing for
growth using dropout media 50
Table 4.3: Growth profile of the cdc25H(α) yeast cells cotransformed with control
Plasmids 51
Table 4.4: Combination of the plasmids cotransformed and the growth profile
of the transformed cdc25H(α) yeast cells 56
Table 4.5: Number of positive interacting candidates isolated using head,
rod and tail domains of K5 / K14 as bait against skin cDNA library by
‘Sos recruitment’ yeast two hybrid genetic screening technique 60
Table 4.6: List of positive interacting candidates with K5 (alphabetical order) 62
Table 4.7: List of positive interacting candidates with K14 (alphabetical order) 63
Table 4.8: Different transfection groups used in experiment to confirm direct
interaction of K14 with AP2β 67
Table 4.9: Different transfection groups used in experiment to confirm direct
vii
Index
interaction of K14 with Rab34 72
Table 4.10: Different transfection groups used in experiment to confirm
direct interaction of p86DM with actin 80
Abbreviations μg Microgram μl Microlitre
°C Grad Celsius
APS Ammonium persulphate
BiFC Bimolecular fluorescence
complementation
bp Base pair
BSA Bovine serum albumin
CO2 Carbon dioxide
DAPI 4,6-Diamidino-2-phenylindole
DMSO Dimethyl sulphoxide
DNA Deoxy ribonucleic acid
dNTP Deoxynucleoside-triphosphate
E. coli Escherichia coli
EDTA Ethylene diamine tetra acetic acid
hr(s) Hour(s)
IF Intermediate filament
IL-1 Interleukin 1
K Keratin protein
kDa Kilodalton
KO Knockout
Krt Keratin gene
L Litre
LB Luria-Bertani
ME Mercaptoethanol
mg Milligram
min Minutes
mRNA Messenger RNA
PAGE Polyacrylamide gel electrophoresis
PBS Phosphate buffered saline
PCR Polymerase chain reaction
PEG Polyethylene glycol
pmol Picomole
RT Room temperature
RT-PCR Reverse transcription – polymerase chain reaction
SDS Sodium dodecyl sulfate
PAGE Polyacrylamide gel electrophoresis
Sec Seconds
TBS Tris buffered saline
TNF Tumor necrosis factor
Ven Venus
viii
1. Introduction
Intermediate filaments (IFs) are important structural components found in most vertebrate cells.
They are expressed in nucleus as well as in cytoplasm providing physical resilience for cells to
withstand the mechanical stresses of the tissue in which they are expressed. Intermediate
filaments are essential for normal tissue structure and function and are encoded in the human
genome by 70 different genes in six subfamilies.
1.1 Keratins Keratins are the structural intermediate filament proteins and account for most of the majority
intermediate filament proteins. They form a dynamic network of 10-12 nm filaments (40–70
kDa) which are prominent structural constituents of the cytoplasm in epithelial cells. Keratins are
encoded by a large multigene family of more than 50 individual members and on the basis of
gene structure and homology (Hesse et al., 2001; Moll et al., 1982; Schweizer et al., 2006), are
classified into two major sequence types, type I (acidic) and type II (basic to neutral). The genes
encoding type I and type II keratins are clustered on chromosomal regions 17q12–q21 and
12q11–q13, respectively. Keratin filaments represent obligatory heterodimers of basic and acidic
partners. The 28 type I include K9–K23 (epithelial), and the hair keratins K31–K40 and 26 type
II include K1–K8, and the hair keratins, K81–K86 which are specifically expressed in and
closely restricted to the various compartments of the hair follicle inner root sheath.
Pairs of type I and type II keratins are expressed in highly specific patterns related to the
epithelial type and stage of cellular differentiation (Kirfel et al., 2003) (figure1.1). Each keratin
pair is characteristic of a particular epithelial differentiation programme, some epithelial cells
express more than one pair. The coexpressed pairs of type I / type II keratins can be divided into
three expression groups: simple keratins of one-layered epithelia (K8/K18, K20), barrier
(keratinocytes) keratins of stratified epithelia (K5/K14, K1/K10, K3/K12, K4/K13, K6a/K16,
K6b/K17, K19) and structural keratins which make up hard appendages like hair, nails, horns
and reptilian scales.
The present study is focused on keratin pair K5, K14 and their expression profile is introduced
briefly in the following section.
- 1 -
Introduction
1.1.1 Keratin 5 and Keratin 14
K5 (62 kDa) and K14 (51 kDa) occur as heterodimers with varying levels of expression in basal
keratinocytes of stratified epithelia. They are strongly expressed in the basal cell layer containing
stem cells (Fuchs and Green, 1980), uniformly expressed in stratified follicular outer root sheath,
basal and myoepithelial cells of complex glandular epithelial tissue (Purkis et al., 1990). The
distinctive expression of specific keratin pairs depends largely on the tissue-type, differentiation
status, and the physiological state. For example, as the dividing basal keratinocytes of the skin
epidermis exit the cell cycle and embark on a program of differentiation, expression of K5 and
K14 is downregulated and a new set of keratins, K1 and K10 are expressed in the suprabasal
spinous layer (Byrne et al., 1994) or become activated producing K6 and K16. IL-1 is the
primary signal initiating keratinocyte activation and expression of K6 and K16 (Freedberg et al.,
2001). The restricted expression of K14 in the basal layer of the skin epidermis is primarily
controlled at the level of transcription and regulation of this process has been extensively studied
using various complementary approaches. DNAse I hypersensitive site (Hs) mapping of the
human K14 gene has identified several Hs in the 5' region that are present selectively in
keratinocytes (Sinha et al., 2000; Sinha and Fuchs, 2001).
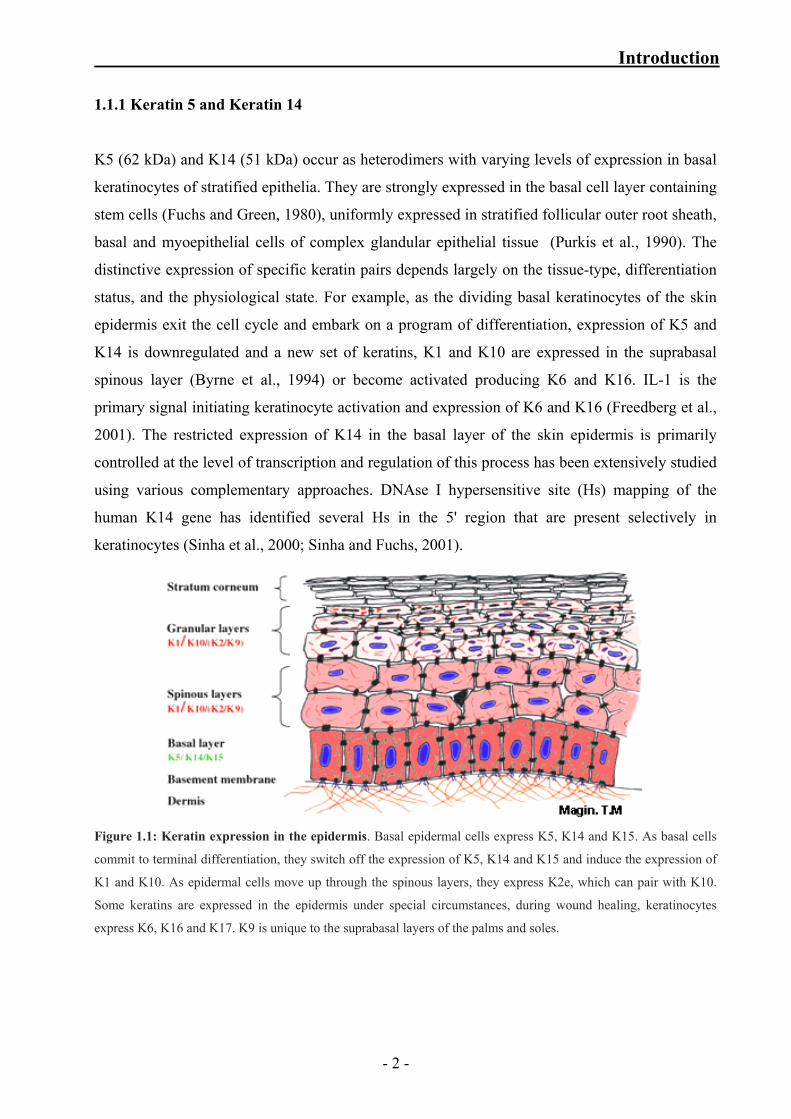
Figure 1.1: Keratin expression in the epidermis. Basal epidermal cells express K5, K14 and K15. As basal cells
commit to terminal differentiation, they switch off the expression of K5, K14 and K15 and induce the expression of
K1 and K10. As epidermal cells move up through the spinous layers, they express K2e, which can pair with K10.
Some keratins are expressed in the epidermis under special circumstances, during wound healing, keratinocytes
express K6, K16 and K17. K9 is unique to the suprabasal layers of the palms and soles.
- 2 -
Introduction
1.1.2 Keratin organization and expression in the cells
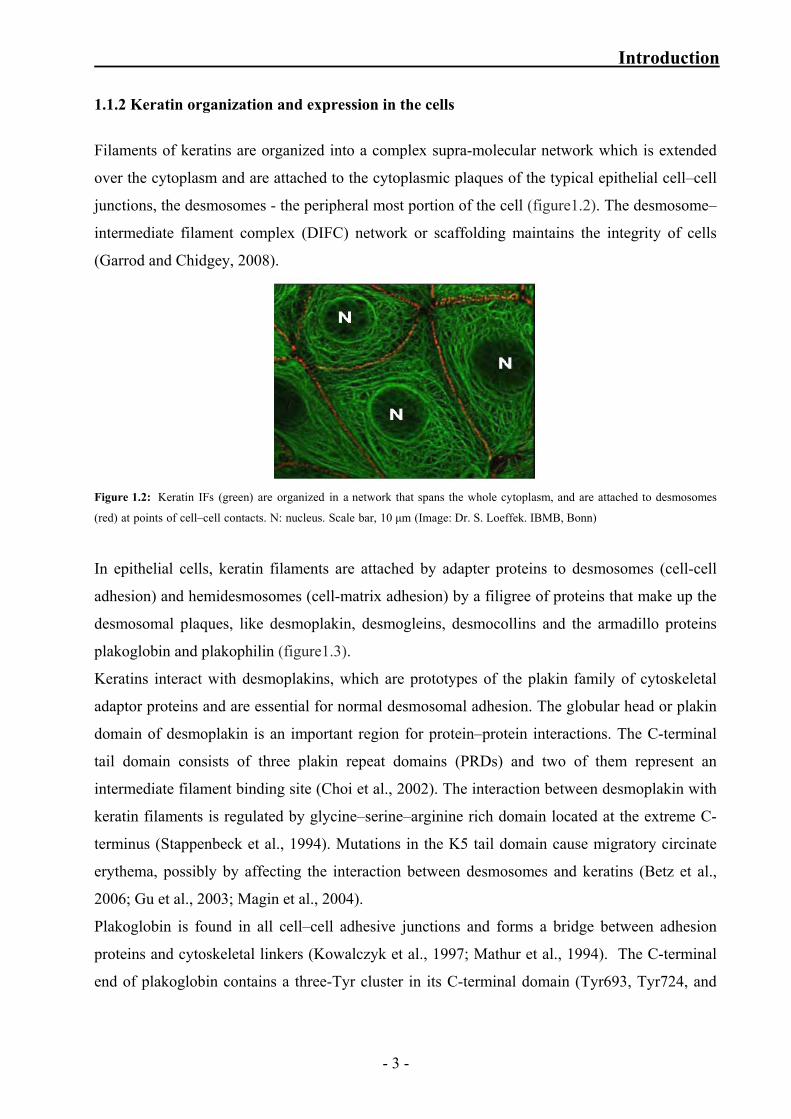
Filaments of keratins are organized into a complex supra-molecular network which is extended
over the cytoplasm and are attached to the cytoplasmic plaques of the typical epithelial cell–cell
junctions, the desmosomes - the peripheral most portion of the cell (figure1.2). The desmosome–
intermediate filament complex (DIFC) network or scaffolding maintains the integrity of cells
(Garrod and Chidgey, 2008).
Figure 1.2: Keratin IFs (green) are organized in a network that spans the whole cytoplasm, and are attached to desmosomes
(red) at points of cell–cell contacts. N: nucleus. Scale bar, 10 μm (Image: Dr. S. Loeffek. IBMB, Bonn)
In epithelial cells, keratin filaments are attached by adapter proteins to desmosomes (cell-cell
adhesion) and hemidesmosomes (cell-matrix adhesion) by a filigree of proteins that make up the
desmosomal plaques, like desmoplakin, desmogleins, desmocollins and the armadillo proteins
plakoglobin and plakophilin (figure1.3).
Keratins interact with desmoplakins, which are prototypes of the plakin family of cytoskeletal
adaptor proteins and are essential for normal desmosomal adhesion. The globular head or plakin
domain of desmoplakin is an important region for protein–protein interactions. The C-terminal
tail domain consists of three plakin repeat domains (PRDs) and two of them represent an
intermediate filament binding site (Choi et al., 2002). The interaction between desmoplakin with
keratin filaments is regulated by glycine–serine–arginine rich domain located at the extreme C-
terminus (Stappenbeck et al., 1994). Mutations in the K5 tail domain cause migratory circinate
erythema, possibly by affecting the interaction between desmosomes and keratins (Betz et al.,
2006; Gu et al., 2003; Magin et al., 2004).
Plakoglobin is found in all cell–cell adhesive junctions and forms a bridge between adhesion
proteins and cytoskeletal linkers (Kowalczyk et al., 1997; Mathur et al., 1994). The C-terminal
end of plakoglobin contains a three-Tyr cluster in its C-terminal domain (Tyr693, Tyr724, and
- 3 -
Introduction
Tyr729) which is binds to the N-terminal domain of desmoplakin. Loss of plakoglobin leads to
decreased number and altered structure of desmosomes in the epidermis of mouse skin
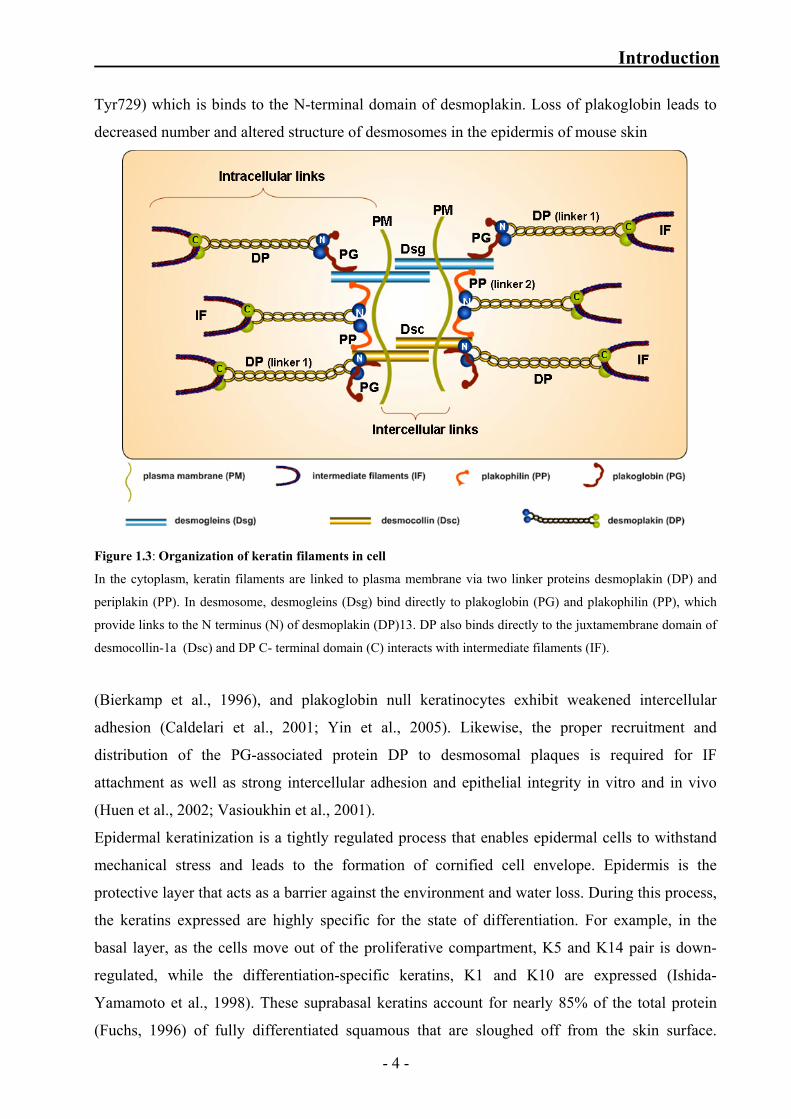
Figure 1.3: Organization of keratin filaments in cell
In the cytoplasm, keratin filaments are linked to plasma membrane via two linker proteins desmoplakin (DP) and
periplakin (PP). In desmosome, desmogleins (Dsg) bind directly to plakoglobin (PG) and plakophilin (PP), which
provide links to the N terminus (N) of desmoplakin (DP)13. DP also binds directly to the juxtamembrane domain of
desmocollin-1a (Dsc) and DP C- terminal domain (C) interacts with intermediate filaments (IF).
(Bierkamp et al., 1996), and plakoglobin null keratinocytes exhibit weakened intercellular
adhesion (Caldelari et al., 2001; Yin et al., 2005). Likewise, the proper recruitment and
distribution of the PG-associated protein DP to desmosomal plaques is required for IF
attachment as well as strong intercellular adhesion and epithelial integrity in vitro and in vivo
(Huen et al., 2002; Vasioukhin et al., 2001).
Epidermal keratinization is a tightly regulated process that enables epidermal cells to withstand
mechanical stress and leads to the formation of cornified cell envelope. Epidermis is the
protective layer that acts as a barrier against the environment and water loss. During this process,
the keratins expressed are highly specific for the state of differentiation. For example, in the
basal layer, as the cells move out of the proliferative compartment, K5 and K14 pair is down-
regulated, while the differentiation-specific keratins, K1 and K10 are expressed (Ishida-
Yamamoto et al., 1998). These suprabasal keratins account for nearly 85% of the total protein
(Fuchs, 1996) of fully differentiated squamous that are sloughed off from the skin surface.
- 4 -
Introduction
Interestingly, there are also a number of keratins with a restricted tissue distribution. For
example, K9 is expressed in the suprabasal cells of palmoplantar skin and K2e is found in
keratinocytes of the upper spinous and granular layers of the epidermis (Corden and McLean,
1996). Non-cornifying cells of the stratified mucosa express K4 and K13 and suprabasal cells of
the corneal epithelia express K3 and K12. In the normal epidermis, the expression of K6 and
K16 is restricted to the outer root sheath of the hair follicle, nail bed, palmoplantar skin and the
suprabasal layer of the orogenital mucosa. On the other hand, K17 is expressed in the nail bed,
hair follicle, sebaceous glands, and other epidermal appendages (Langbein and Schweizer,
2005).
1.1.3 Structure and organization of keratins Keratins share common protein structural characteristics (fig. 1.2), comprising an α-helical ‘rod’
domain of ~ 310 amino acids (with a 50-90% sequence identity among cytokeratins of the same
family and around 30% between cytokeratins of different families) constituted with four
consecutive domains of highly conserved length (segment 1A accounting for 35, segment 1B for
101, segment 2A for 19 and segment 2B for 121 amino acids). The non-α-helical parts between
these segments, also called ‘linkers’ (L1, L12, L2), are variable in length (8–22 amino acids).
The α-helical segments exhibit a heptad substructure in which the first and fourth positions are
commonly occupied by apolar amino acids such as Leu, Ile, Met or Val. These hydrophobic
amino acids generate a surface that is wound around the axis of a single right-handed α-helix in a
left-handed manner, ultimately leading to superhelix, i.e. coiled-coil formation of two such
molecules.
The phasing of the heptads is interrupted by deletion or insertion of amino acids in the middle of
segment 2B giving rise to a ‘stutter’ (Steinert et al., 1994) and is conserved in IF proteins.
The stutter represents a helical segment which is not engaged in coiled-coil formation. Moreover,
atomic structure analysis showed that the end of segment 2B, representing the evolutionarily
conserved IF consensus motif (TYRKLLEGEE), is not entirely part of the coiled-coil structure,
but bends away from the coiled-coil axis (Herrmann et al., 2000; Strelkov et al., 2002). The end-
domain sequences of type I and II cytokeratin chains contain in both sides of the rod domain the
subdomains V1 and V2, which have variable size and sequence. The subdomains V1 and V2
contain residues enriched by glycine/serine, the former providing the cytokeratin chain a strong
insoluble character and facilitating the interaction with other molecules. These terminal domains
are also important in defining the function of cytokeratin chain characteristic of a particular
epithelial cell type.
- 5 -
Introduction
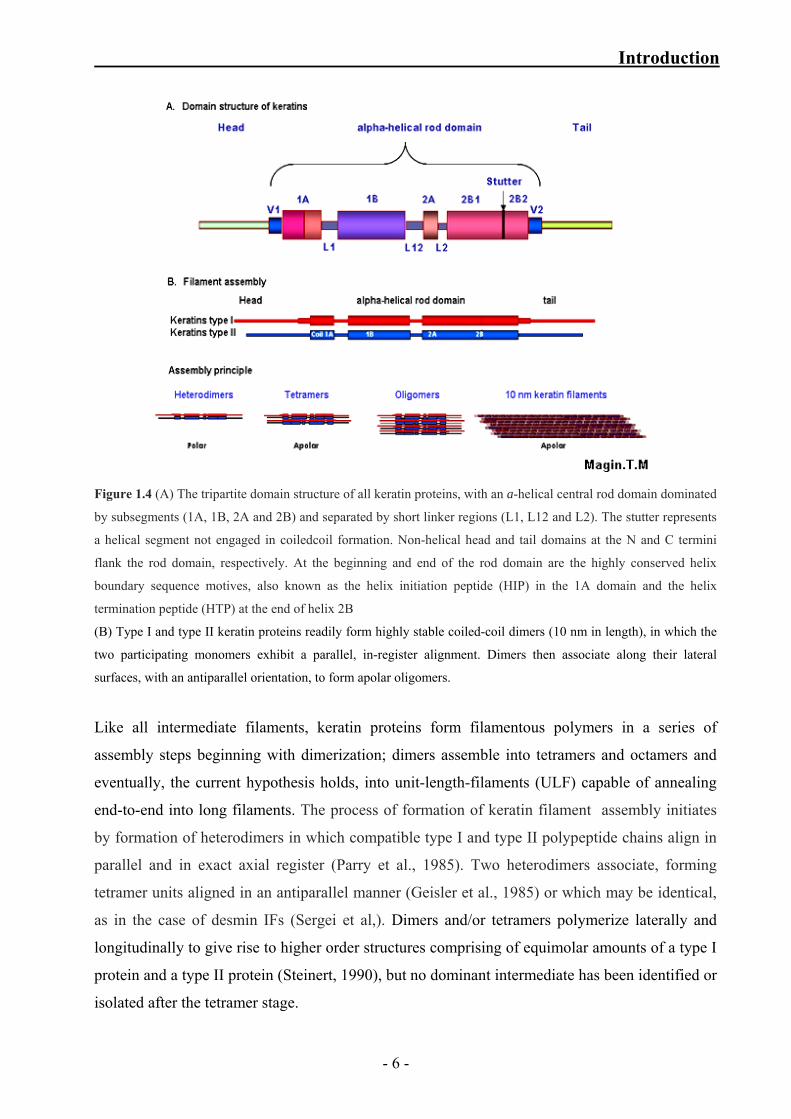
Figure 1.4 (A) The tripartite domain structure of all keratin proteins, with an a-helical central rod domain dominated
by subsegments (1A, 1B, 2A and 2B) and separated by short linker regions (L1, L12 and L2). The stutter represents
a helical segment not engaged in coiledcoil formation. Non-helical head and tail domains at the N and C termini
flank the rod domain, respectively. At the beginning and end of the rod domain are the highly conserved helix
boundary sequence motives, also known as the helix initiation peptide (HIP) in the 1A domain and the helix
termination peptide (HTP) at the end of helix 2B
(B) Type I and type II keratin proteins readily form highly stable coiled-coil dimers (10 nm in length), in which the
two participating monomers exhibit a parallel, in-register alignment. Dimers then associate along their lateral
surfaces, with an antiparallel orientation, to form apolar oligomers.
Like all intermediate filaments, keratin proteins form filamentous polymers in a series of
assembly steps beginning with dimerization; dimers assemble into tetramers and octamers and
eventually, the current hypothesis holds, into unit-length-filaments (ULF) capable of annealing
end-to-end into long filaments. The process of formation of keratin filament assembly initiates
by formation of heterodimers in which compatible type I and type II polypeptide chains align in
parallel and in exact axial register (Parry et al., 1985). Two heterodimers associate, forming
tetramer units aligned in an antiparallel manner (Geisler et al., 1985) or which may be identical,
as in the case of desmin IFs (Sergei et al,). Dimers and/or tetramers polymerize laterally and
longitudinally to give rise to higher order structures comprising of equimolar amounts of a type I
protein and a type II protein (Steinert, 1990), but no dominant intermediate has been identified or
isolated after the tetramer stage.
- 6 -
Introduction
1.1.4 Known keratin interactions and functions
The variation in expression levels of keratin proteins in different cells (in surface epithelial cells
accounting to 30% and about 1% in hepatocytes of their total proteins), and their highly specific
patterned expression profile related to the epithelial type and stage of cellular differentiation,
might hint towards the diverse role of keratins in cellular machinery.
The characteristic spanning of keratin cytoskeletal network (not so in all cell types, eg.
hepatocytes) across cytoplasm weaving the nucleus, and their attachment to cell-cell junctions –
desmosomes, itself suggests a major functional role for keratins in regulation and maintenance of
integrity and mechanical stability of cells and tissues. Pathogenic mutations have been
discovered in different keratin genes (figure 1.5) causing wide range of epithelial fragility
disorders affecting skin, mucous membranes, hair, nails, and sebaceous glands (Corden and
McLean, 1996; Lane and McLean, 2004; Smith, 2003). The general pathology in these disease
conditions corresponds to the expression pattern of the defective keratin protein resulting in
structural (eg. EBS - Dowling-Meara) or pigmentation (eg. Dowling–Degos disease) disorders. A
brief insight to this is mentioned in the next chapter.
In multilayered epithelia, keratin filaments act as a mechanical scaffold enabling their constituent
cells to withstand deformation without breaking (Takahashi et al., 1999; Wilson et al., 1992)
This function is crucial in surface epithelia, such as epidermis, oral mucosa, and hair (Wong et
al., 2000), and has been demonstrated as well for internal simple epithelia, including liver,
trophectoderm and placenta (Hesse et al., 2000; Ku et al., 2001; Magin et al., 1998; Tamai et al.,
2000). The reported binding studies between type II keratins and the desmosomal protein
desmoplakin (Smith and Fuchs, 1998), perinuclear collapse of keratin IFs around the nucleus in
live cells as frequently seen in skin blistering diseases, significantly softens the cytoplasm (Beil
et al., 2003), confirms that keratins are organized into a network architecture, which in turn is
important for cellular micromechanics (Beil et al., 2003)
Keratins and vesicle transport
The keratinocyte pigmentation disorder Dowling–Degos disease (DDD) (Dowling and
Freudenthal, 1938) due to K5 haploinsufficiency, rare skin disorders like EBS with mottled
pigmentation (Uttam et al., 1996), and Naegeli–Franceschetti–Jadassohn syndrome are caused by
mutations residing in the head domains of K5 and K14 (Betz et al., 2006; Harel et al., 2006; Liao
et al., 2007; Lugassy et al., 2006; Uttam et al., 1996). In contrast to most other keratinopathies,
- 7 -
Introduction
the described haploinsufficiency in K5 (DDD) which results from premature stop codons in the
K5 gene, affects melanosome distribution in keratinocytes but not the integrity of the keratin
cytoskeleton (Betz et al., 2006; Liao et al., 2007) and is the same in latter mentioned conditions
which show an intact keratin organization with disorganized distribution of melanosomes in
keratinocytes.
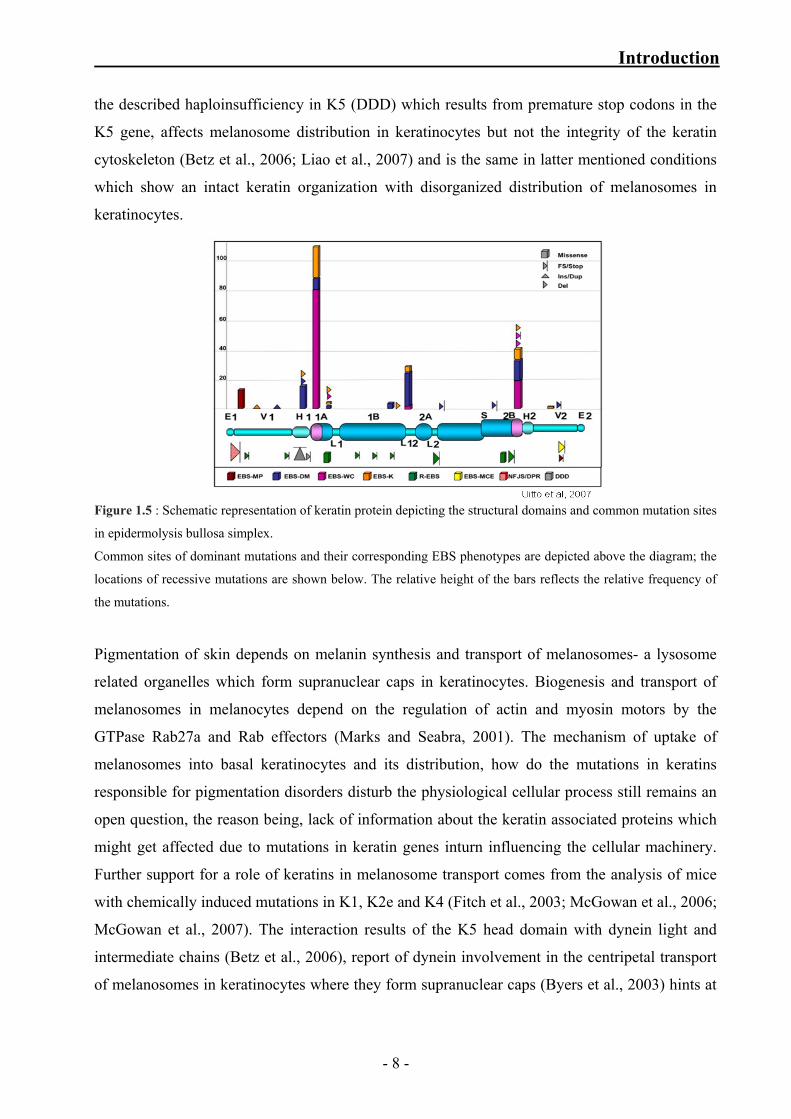
Figure 1.5 : Schematic representation of keratin protein depicting the structural domains and common mutation sites
in epidermolysis bullosa simplex.
Common sites of dominant mutations and their corresponding EBS phenotypes are depicted above the diagram; the
locations of recessive mutations are shown below. The relative height of the bars reflects the relative frequency of
the mutations.
Pigmentation of skin depends on melanin synthesis and transport of melanosomes- a lysosome
related organelles which form supranuclear caps in keratinocytes. Biogenesis and transport of
melanosomes in melanocytes depend on the regulation of actin and myosin motors by the
GTPase Rab27a and Rab effectors (Marks and Seabra, 2001). The mechanism of uptake of
melanosomes into basal keratinocytes and its distribution, how do the mutations in keratins
responsible for pigmentation disorders disturb the physiological cellular process still remains an
open question, the reason being, lack of information about the keratin associated proteins which
might get affected due to mutations in keratin genes inturn influencing the cellular machinery.
Further support for a role of keratins in melanosome transport comes from the analysis of mice
with chemically induced mutations in K1, K2e and K4 (Fitch et al., 2003; McGowan et al., 2006;
McGowan et al., 2007). The interaction results of the K5 head domain with dynein light and
intermediate chains (Betz et al., 2006), report of dynein involvement in the centripetal transport
of melanosomes in keratinocytes where they form supranuclear caps (Byers et al., 2003) hints at
- 8 -
Introduction
the role of keratins in their transport and distribution which holds great promise for the
understanding of a general role of IF proteins in vesicle trasnsport.
Role of keratins in wound healing
Re-epithelialization is a pivotal event in wound healing process. It involves the migration and
cornification of perilesional basal keratinocytes across wound bed for restoration of an intact
epidermal barrier through wound. In the initial process of wound healing the basal keratinocytes
express K6 and K16 (Wong and Coulombe, 2003), unlike the normal skin which expresses K5
and K14 pair. More experimental studies have shown that after skin wounding, K6 and K16 are
rapidly induced within 6h in human keratinocytes at the wound edge, before migration and
regeneration begins (Paladini et al., 1996). In epidermal wounding situation, transcription of the
Krt6/16/17 genes is induced and Krt1/10 gene expression is reduced (Zhong et al., 2004),
presumably providing the cell with a more pliable cytoskeleton that favours keratinocyte
migration for wound closure. K6a knockout mice showed delayed re-epithelialization upon
partial thickness skin wounding (Wojcik et al., 2000) and loss of K17 compromised wound
healing in mouse embryos (Mazzalupo et al., 2003).
Role of keratins in microtubule localization
It has been shown that intermediate filaments mediate cross-talk among other components of the
cytoskeleton (Chang and Goldman, 2004). Centrosomes are known to be located under the apical
domain in simple epithelial cells, instead of a perinuclear localization as in other cell types
(Apodaca et al., 1994; Meads and Schroer, 1995; Salas, 1999). Several research groups have
shown that γ-tubulin–containing structures are attached to intermediate filaments (IFs) (Figueroa
et al., 2002) and that this attachment is responsible for the apical distribution of centrosomes in
simple epithelial cells (Mulari et al., 2003; Salas, 1999). Similarly, overexpressed keratin
accumulates around the centrosome (Blouin et al., 1990), this colocalization can be disrupted by
Cdk1/cyclinB mediated phosphorylation in interphasic cells, and is naturally lost in mitotic cells.
Keratin knock-downs in tissue culture cells where the apical localization of centrosomes and
non-centrosomal γ–TurCs is abrogated (Salas, 1999) and the phenotype of the K8-null mice
villus enterocytes (Ameen et al., 2001) coincided to show loss of the apical γ–tubulin layer and
disorganization (not depolymerization) of MTs with loss of the apico-basal arrangement. Yet, a
full mechanistic explanation for these phenotypes has to be established. An interesting possibility
- 9 -
Introduction
of interactions between keratin filaments and molecular motors (Betz et al., 2006) (kinesins and
cytoplasmic dyneins) which may participate in the organization of the microtubular architecture
similar to that of vimentin (Helfand et al., 2004) still remains and has not been demonstrated so
far.
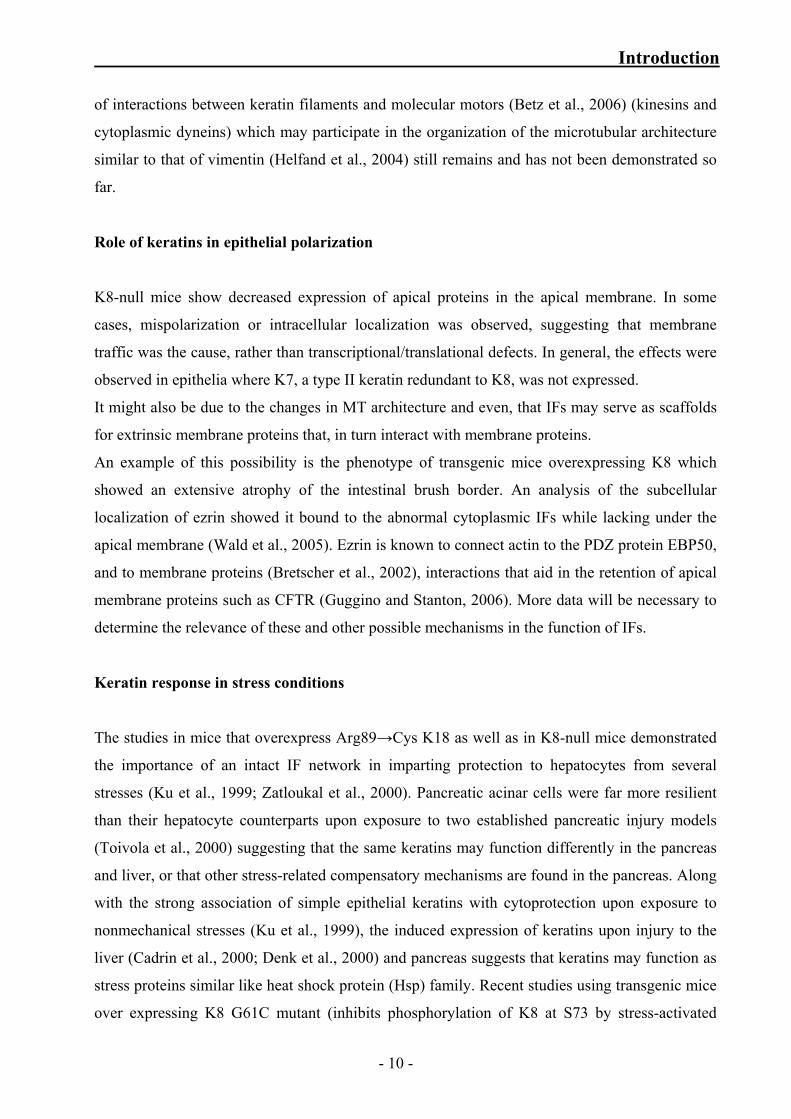
Role of keratins in epithelial polarization
K8-null mice show decreased expression of apical proteins in the apical membrane. In some
cases, mispolarization or intracellular localization was observed, suggesting that membrane
traffic was the cause, rather than transcriptional/translational defects. In general, the effects were
observed in epithelia where K7, a type II keratin redundant to K8, was not expressed.
It might also be due to the changes in MT architecture and even, that IFs may serve as scaffolds
for extrinsic membrane proteins that, in turn interact with membrane proteins.
An example of this possibility is the phenotype of transgenic mice overexpressing K8 which
showed an extensive atrophy of the intestinal brush border. An analysis of the subcellular
localization of ezrin showed it bound to the abnormal cytoplasmic IFs while lacking under the
apical membrane (Wald et al., 2005). Ezrin is known to connect actin to the PDZ protein EBP50,
and to membrane proteins (Bretscher et al., 2002), interactions that aid in the retention of apical
membrane proteins such as CFTR (Guggino and Stanton, 2006). More data will be necessary to
determine the relevance of these and other possible mechanisms in the function of IFs.
Keratin response in stress conditions
The studies in mice that overexpress Arg89→Cys K18 as well as in K8-null mice demonstrated
the importance of an intact IF network in imparting protection to hepatocytes from several
stresses (Ku et al., 1999; Zatloukal et al., 2000). Pancreatic acinar cells were far more resilient
than their hepatocyte counterparts upon exposure to two established pancreatic injury models
(Toivola et al., 2000) suggesting that the same keratins may function differently in the pancreas
and liver, or that other stress-related compensatory mechanisms are found in the pancreas. Along
with the strong association of simple epithelial keratins with cytoprotection upon exposure to
nonmechanical stresses (Ku et al., 1999), the induced expression of keratins upon injury to the
liver (Cadrin et al., 2000; Denk et al., 2000) and pancreas suggests that keratins may function as
stress proteins similar like heat shock protein (Hsp) family. Recent studies using transgenic mice
over expressing K8 G61C mutant (inhibits phosphorylation of K8 at S73 by stress-activated
- 10 -
Introduction
protein kinases such as p38, JNK and p42) has shown an increased susceptibility to stress-
induced liver injury and apoptosis (Ku and Omary, 2006). Consequently, a similar susceptibility
to stress was also observed in the S73A mutant wherein the site for phosphorylation is destroyed.
Such a role can be envisaged to occur either directly and be affected by scaffolding, chaperone or
‘sponge’-type activities absorbing the stress-activated phosphate kinases, thereby reducing their
untoward effects and hence protect the cells from injury, or indirectly via the known association
of keratins with Hsp family members. During oxidative stress or exposure to other toxins
disrupts the keratin-Raf-1 association (Ku et al., 2004) in a phosphorylation-dependent manner,
suggesting keratins regulate Raf-1 kinase signaling potential by kinase sequestration, activation,
inactivation or compartmentalization.
The results of the spatiotemporal and differential regulation of keratin phosphorylation like
Phosphorylation of K20 S13 in mucus-secreting goblet cells, but not in the other K20-expressing
enterocytes (Tao et al., 2006), and hyperphosphorylation of K20 during starvation-induced
mucin secretion indicates the complex functional properties of specific epithelial cell types.
Loss of maternal TNFα increased the survival of keratin deficient embryos (Caulin et al., 2000;
Jaquemar et al., 2003) and keratins have been shown to moderate apoptosis in Fas mediated
apoptosis (Ku et al., 2003) pathway either induced by death receptor or cell-intrinsic pathways.
1.1.5 Keratin disorders in humans
Mutations in 19 different keratin genes have so far been identified as the cause of at least 15
different genetic diseases (table 1.1). Most disorders are transmitted in an autosomal dominant
mode, although there are some reports of recessive transmission (Corden and McLean, 1996;
Irvine and McLean, 1999; Lane and McLean, 2004; Porter and Lane, 2003; Smith, 2003). The
phenotypes of keratin disorders usually reflect the expression pattern of the mutated keratins
ranging from very severe to relatively mild blistering because of fragile basal layer of epidermal
keratinocytes to pigmentation disorders. In general, a mutation in either one of a particular
keratin pair leads to the same disorder. However, there are instances in which distinctly different
phenotypes result from mutations in the same keratin (table 1.1).
Most pathogenic keratin mutations are dominant mutations caused by missense mutations that
alter amino acids at the start of ‘1A’ rod domain and the end of the ‘2B’ rod domain (fig1.2 A)
which are called as helix initiation and termination motifs respectively. These helix boundary
peptides represent genetic “hot spots” for mutations in almost all hereditary keratin disorders.
The most commonly affected amino acid is an arginine residue near the start of helix 1A that is
- 11 -
Introduction
conserved in all type I keratins (Rugg and Leigh, 2004). Mutations occurring outside the helix
boundary regions are frequently associated with milder or unusual phenotypes. Mutations that
affect residues in the head and tail domains often result in conditions that are distinct from those
caused by mutations in the central region of the keratin molecule suggesting that these regions of
the keratin molecules may have different functions to the rod domain.
The precise phenotype of each disease apparently reflects the spatial level of expression of the
mutated genes, as well as the types and positions of the mutations and their consequences at
mRNA and protein levels.
Disorders of K5 and K14
The first keratin disorder to be identified was epidermolysis bullosa simplex (EBS). EBS is
caused by mutations in the genes for keratins 5 (KRT5)/14 (KRT14), describes a heterogeneous
group of heritable skin-blistering disorders in which is characterized by rupture of the basal
keratinocytes of the epidermis in response to mild physical trauma. Based on severity,
distribution, and seasonal variations in blistering, EBS is categorized in three groups.
I. EBS Dowling-Meara (EBS-DM): is the most severe subtype characterized by widespread,
herpetiform blistering and intracellular keratin aggregates. Pathogenic defects are due to
missense mutations clustering at the highly conserved boundaries of the alpha-helical rod of K5
or K14. In most of the identified mutations, a particular arginine codon within the helix initiation
peptide in K14 (R125) is found to be replaced either by cysteine/histidine and in K5 substitution
of a highly conserved amino acid isoleucine to threonine (I466T) within this critical region.
II. EBS Kobner (EBS-K): is characterized by milder, generalized blistering of the skin without
apparent clustering, often in response to minor trauma and induced by increased ambient
temperature. Hands, feet and extremities are most consistently affected. Pathogenic condition
arises due to T-to-C transition within exon 7 of the KRT5 gene at the nucleotide level which
results in substitution of a leucine by a proline at the amino acid level. In KRT14 a heterozygous
mutations at 2B helix domain G1231T creates a premature stop codon and G1237A mutation that
produces a conservative amino acid change (alanine to threonine) at position 413 (A413T) have
been identified as the cause of EBS-K.
III. EBS Weber-Cockayne (EBS-WC): is the most common, relatively mild, localized subtype of
EBS, characterized by blisters or pigmentation disorders that are confined to the hands, feet and
areas of friction or trauma. In this relatively form of EBS, pathogenic mutations lie in most cases
outside of the helix boundaries, elsewhere in the rod domain of K5 (T-->G point mutation in the
- 12 -

Introduction
second base position of codon 161) or K14 (in-frame deletion), including the non-helical L12
linker motif or in the amino terminal homologous domain of K5 resulting in amino acid
substitutions.
Table 1.1 gives an overview of other types of disorders caused due to the discrepancies in
kerartins. The detrimental effects caused by mutations in keratins have various underlying
molecular mechanism which still remain elusive. Identification of keratin associated proteins
involved in various cellular processes will be a major advantage to this end.
Different available techniques which can be used to identify keratin associated proteins are
briefly introduced in the next chapter.
- 13 -
Introduction
Type II Type I Expression pattern Human disease
Bullous congenital ichthyosiform erythroderma or epidermolytic hyperkeratosis Autosomal recessive epidermolytic hyperkeratosis
Diffuse non-epidermolytic palmoplantar keratoderma*
Ichthyosis hystrix Curth-Macklin*
K1* K10* suprabasal cells of cornified
squamous epithelia
Palmoplantar keratoderma with tonotubules*
K3 K12 Corneal epithelium Meesmann corneal epithelial dystrophy
K4 K13 suprabasal cells of non-cornified squamous epithelia White sponge nevus
Epidermolysis bullosa simplex types Weber-Cockayne, Koebner, Dowling-Meara Autosomal-recessive Epidermolysis bullosa simplex
EBS with mottled pigmentation*
K5* K14* basal cells of stratified epithelia
Dowling-Degos disease*
Pachyonychia congenita type I K6a K16*
suprabasal orogenital mucosa; palmoplantar epidermis; epidermal appendages, epidermal expression induced by trauma/wound healing Focal non-epidermolytic PPK*
Pachyonychia congenita type II K6b K17* like K6a/K16
Steatocystoma multiplex*
K2 (K2e) Upper spinous and granular layer of cornified squamous epithelia Ichthyosis bullosa of Siemens
K9 Suprabasal layers of palmoplantar epidermis Epidermolytic palmoplantar keratoderma
K8 K18 Simple epithelia Various liver diseases, inflammatory
bowel disease
K31 (Ha1) K81 (Hb1)* Hair shaft Monilethrix*
K33 (Ha3) K83 (Hb3)*
K36 (Ha6) K86 (Hb6)*
Table 1.1: Expression patterns of keratins and the associated human disorders. The former designation is given in brackets. * indicates diseases for which mutations have been found in only one of a keratin pair
- 14 -
Introduction
1.2 Protein-protein interactions
Proteins control and mediate many of the biological activities of cells. Although some proteins
act as single monomeric units (enzymes that catalyze changes in small-molecule substrates), a
significant percentage, if not, the majority of all proteins function in association with partner
molecules or as components of large molecular assemblies. Their intrinsic biochemical and/or
catalytic activities are, to large extent, regulated/modulated by dynamic, spatially and temporally
confined physical (direct) and functional (indirect) protein–protein interactions. Protein–protein
interactions (PPIs) are an essential aspect in virtually all biological processes, including the
formation of macromolecular structures, cell signaling (Choi et al., 1994), regulation (Kischkel et
al., 1995), and metabolic pathways. In addition, PPIs have emerged as important drug targets
with small molecules binding to ‘hotspots’ on the protein contact surfaces (Ryan and Matthews,
2005; Wells and McClendon, 2007). Aberrant protein-protein interactions have the potential to
cause or contribute to human disease. The modulation of these interactions by drug-like
molecules would offer previously unavailable opportunities to explore the relevance and
therapeutic significance of pre-selected protein-protein interactions.
The availability of completed genome sequences of several eukaryotic and prokaryotic species
has shifted the focus towards the identification and characterization of all gene products that are
expressed in a given organism. In order to cope with the huge amounts of data that have been
generated by large-scale sequencing projects, high-throughout methodologies (Auerbach et al.,
2002) has to be applied in the process of identifying the interacting partners and their functional
significance.
1.2.1 General classification of detection methods
The study of protein-protein interactions can be conceptually divided into three major domains:
identification, characterization and manipulation. At present different methods have been
developed to study and analyse protein-protein interactions, they can be broadly categorized as :
I. Genetic approaches
1.Two Hybrid Systems
a) Yeast two hybrid system (Y2H)
b) Bacterial two-hybrid system (B2H)
c) Mammalian two-hybrid system (M2H)
d) Phage display system
e) Protein fragment complementation assays (PCA)
- 15 -
Introduction
2. Three-hybrid systems
a) Kinase three-hybrid system (tri-brid)
b) Protein three-hybrid system
c) Peptide ligand and small ligand three-hybrid system
d) RNA three-hybrid system
II. Biochemical methods
a) Pull down studies using tagged fusion proteins
b) Coimmunoprecipitation
c) Far western blot technique
d) Protein microarrays
e) Matrix assisted laser desorption/ionization-time of flight(MALDI-TOF)
III. Physical methods
a) Protein Affinity Chromatography
b) Affinity Blotting
c) Tandem Affinity Purification (TAP)
IV. Biophysical methods
a) Fluorescence resonance energy transfer (FRET)
b) Bioluminescence resonance energy transfer (BRET)
c) Bimolecular fluorescence complementation (BiFC)
d) Atomic force microscopy (AFM)
Living cells monitor parameters of interest in their environment for any given interaction
between the proteins. Each of the above mentioned techniques have been widely used to identify
& characterize the interaction partners. As each technique has unique advantages & limitations,
appropriate method has to be selected to create nearest internal representations of physiological
conditions to implement appropriate adaptive responses to changing conditions depending on the
scope and goal of the study to be conducted.
In this present study two of the systems has been successfully used and are briefly introduced in
the next section.
1.2.2 Yeast two-hybrid
The yeast two-hybrid system is an in vivo assay that detects binary physical interactions. The
interaction between a ‘bait’ fusion and a ‘prey’ fusion re-constitutes a functional secondary
signal which is used as read-out of the assay (growth at restrictive temperature, formation of
- 16 -
Introduction
functional transcription factor). Many improvised methods have been established since its first
application in 1989 (Fields and Song, 1989). The system is economical, scalable and hence
perfectly suited for automated high-throughput approaches (Drewes and Bouwmeester, 2003).
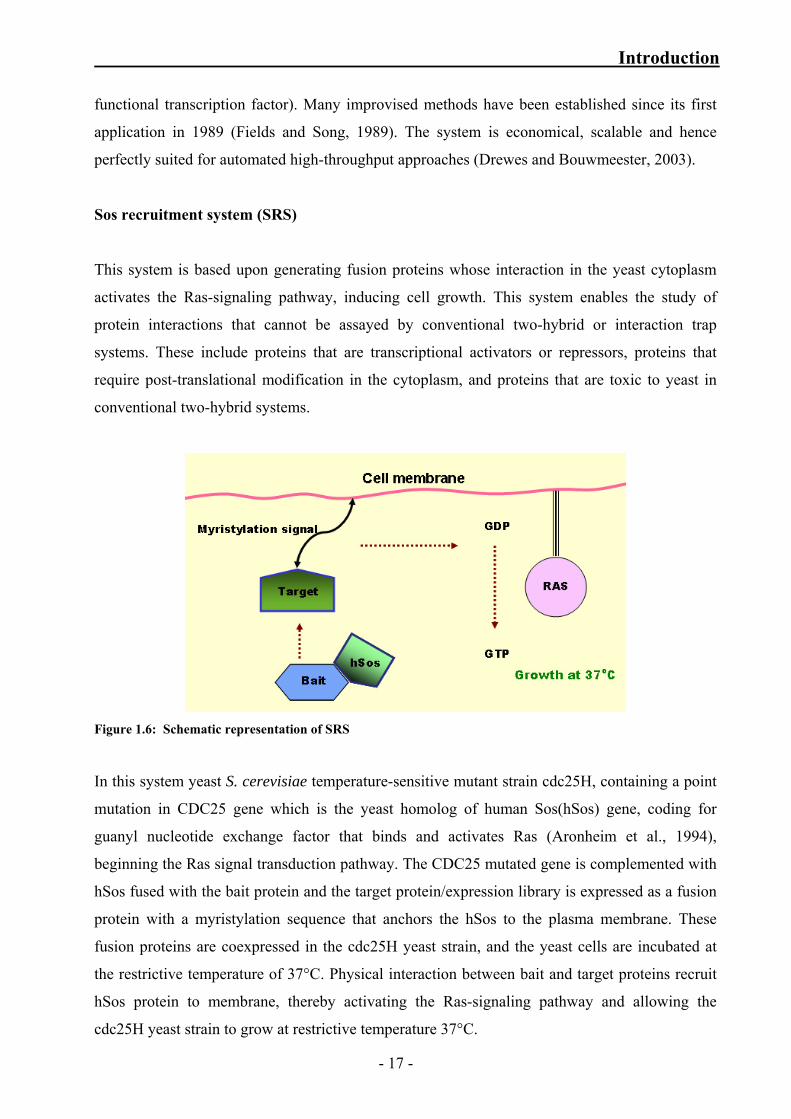
Sos recruitment system (SRS)
This system is based upon generating fusion proteins whose interaction in the yeast cytoplasm
activates the Ras-signaling pathway, inducing cell growth. This system enables the study of
protein interactions that cannot be assayed by conventional two-hybrid or interaction trap
systems. These include proteins that are transcriptional activators or repressors, proteins that
require post-translational modification in the cytoplasm, and proteins that are toxic to yeast in
conventional two-hybrid systems.
Figure 1.6: Schematic representation of SRS
In this system yeast S. cerevisiae temperature-sensitive mutant strain cdc25H, containing a point
mutation in CDC25 gene which is the yeast homolog of human Sos(hSos) gene, coding for
guanyl nucleotide exchange factor that binds and activates Ras (Aronheim et al., 1994),
beginning the Ras signal transduction pathway. The CDC25 mutated gene is complemented with
hSos fused with the bait protein and the target protein/expression library is expressed as a fusion
protein with a myristylation sequence that anchors the hSos to the plasma membrane. These
fusion proteins are coexpressed in the cdc25H yeast strain, and the yeast cells are incubated at
the restrictive temperature of 37°C. Physical interaction between bait and target proteins recruit
hSos protein to membrane, thereby activating the Ras-signaling pathway and allowing the
cdc25H yeast strain to grow at restrictive temperature 37°C.
- 17 -
Introduction
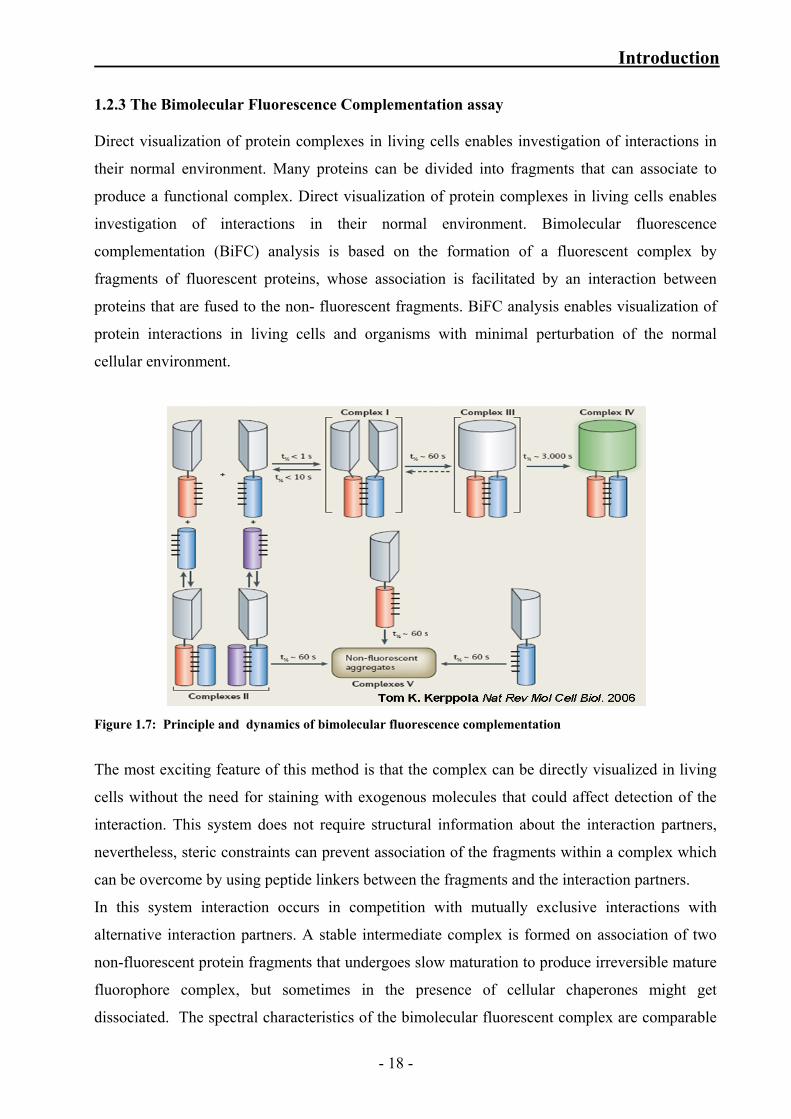
1.2.3 The Bimolecular Fluorescence Complementation assay Direct visualization of protein complexes in living cells enables investigation of interactions in
their normal environment. Many proteins can be divided into fragments that can associate to
produce a functional complex. Direct visualization of protein complexes in living cells enables
investigation of interactions in their normal environment. Bimolecular fluorescence
complementation (BiFC) analysis is based on the formation of a fluorescent complex by
fragments of fluorescent proteins, whose association is facilitated by an interaction between
proteins that are fused to the non- fluorescent fragments. BiFC analysis enables visualization of
protein interactions in living cells and organisms with minimal perturbation of the normal
cellular environment.
Figure 1.7: Principle and dynamics of bimolecular fluorescence complementation
The most exciting feature of this method is that the complex can be directly visualized in living
cells without the need for staining with exogenous molecules that could affect detection of the
interaction. This system does not require structural information about the interaction partners,
nevertheless, steric constraints can prevent association of the fragments within a complex which
can be overcome by using peptide linkers between the fragments and the interaction partners.
In this system interaction occurs in competition with mutually exclusive interactions with
alternative interaction partners. A stable intermediate complex is formed on association of two
non-fluorescent protein fragments that undergoes slow maturation to produce irreversible mature
fluorophore complex, but sometimes in the presence of cellular chaperones might get
dissociated. The spectral characteristics of the bimolecular fluorescent complex are comparable
- 18 -

Introduction
to that of the intact fluorescent protein. The fluorescence intensity produced by BiFC complexes
in living cells is generally less than 10% of that produced by expression of an intact fluorescent
protein, nevertheless, because autofluorescence is detected in the visible range similar to that of
emitted by intact fluorescent proteins with the same excitation (514 nm) and emission maximum
of 527nm. Fluorescent-protein fragments that have not associated with complementary fragments
undergo irreversible misfolding in vitro thereby reducing any non-specific signals.
- 19 -
2. Aim ‘Keratins’ – the largest subgroup of intermediate filament proteins, form a complex network of
keratin filaments in the cytoplasm of epithelial cells provides stability and integrity thereby
protecting the cells from mechanical and non-mechanical stress. The keratin family comprises
more than 50 individual members (Hesse et al., 2001; Moll et al., 1982; Schweizer et al., 2006)
which are expressed in a tissue type-restricted pattern and differentiation stage. This raises the
question on functional importance of the multiplicity of keratin sequences according to their
expression profile, and is supported by the recent findings revealing the key role of keratins in
regulatory functions of the cellular machinery like organelle transport apart from its well
established structural functions. Understanding the molecular mechanism by which keratins exert
regulatory functions will help to know about the unidentified contributions of keratins and their
extended role beyond scaffolding cytoarchitecture.
To understand the novel functions of keratins, knowledge of keratin-associated proteins is a
major pre-requisite. As a first step, this study was designed with the aim of identifying associated
proteins of “K5 and K14”, followed by the characterization of identified keratin associated
proteins.
- 20 -
3. Materials and Methods 3.1 Materials 3.1.1 Chemicals used
Unless otherwise stated, chemicals were purchased from Serva (Heidelberg, Germany), Sigma
(Deisenhofen, Germany), Roche (Basel, Switzerland), Fermentas (St.Leon-Rot, Germany),
Merck (Darmstadt, Germany), Fluka (Deisenhofen, Germany), Invitrogen Life Technologies
(Karlsruhe, Germany), or Applichem (Darmstadt, Germany).
All media base and salts for yeast culture were purchased from Becton, Dickinson and company,
Sparks. MD21152
All cell culture solutions, buffers, DNase I, antibiotics & normal goat serum were from Sigma
(Deisenhofen, Germany), Invitrogen/Life technologies (Karlsruhe, Germany) & GibcoBRL
(Karlsruhe).
In vitro High Prime DNA labeling kit was from purchased from Roche (Basel, Switzerland).
[α-32P]-dCTP was obtained from Amersham Biosciences (Buckinghamshire, UK).
Restriction enzymes, protein and DNA markers dNTPs and NTP’s were from Fermentas
(St.Leon-Rot,Germany).
PCR reaction mix (Buffers, Taq polymerase enzyme, MgCl2), RT-PCR kit were purchased from
Invitrogen/Life technologies (Karlsruhe, Germany).
3.1.2 Ready-to-use solutions / reagents Acetic Acid
Acrylamide solution (37.5:1) Acrylamide/Bisacrylamide for protein-SDS-gel
Chloroform
DAB substrate (Biogenex, DC138R006)
Dimethylsulfoxide (DMSO)
PBS- (Dulbecco’s Phosphate buffered saline) for cell culture
Ethanol
Ethidiumbromide, 10mg/ml
Formaldehyde, 37 %
Isopropanol
Methanol
ProLong® Gold antifade reagent (Molecular Probes, P36930)
Roti-Phenol TE equilibrated for purification of nucleic acids
- 21 -
Materials and Methods
TEMED for protein-SDS gel
TRIzol for isolation of RNA
Taq-Polymerase (Invitrogen, 10342-020)
Tween-20
Triton-X100
3.1.3 Kits
High Prime DNA labeling system (Roche, 11585584001)
QIAEX II Gel Extraction Kit (Qiagen, 20021)
Nucleospin Plasmid for plasmid DNA miniprep (Macherey-Nagel, 740 588.250)
Nucleobond AX for plasmid DNA midiprep (Macherey-Nagel, 740 410.100)
Superscript II Reverse Transcriptase (Invitrogen, 18064-014)
Protino Ni-IDA for recombinant protein purification (Macherey-Nagel, 745 210.5)
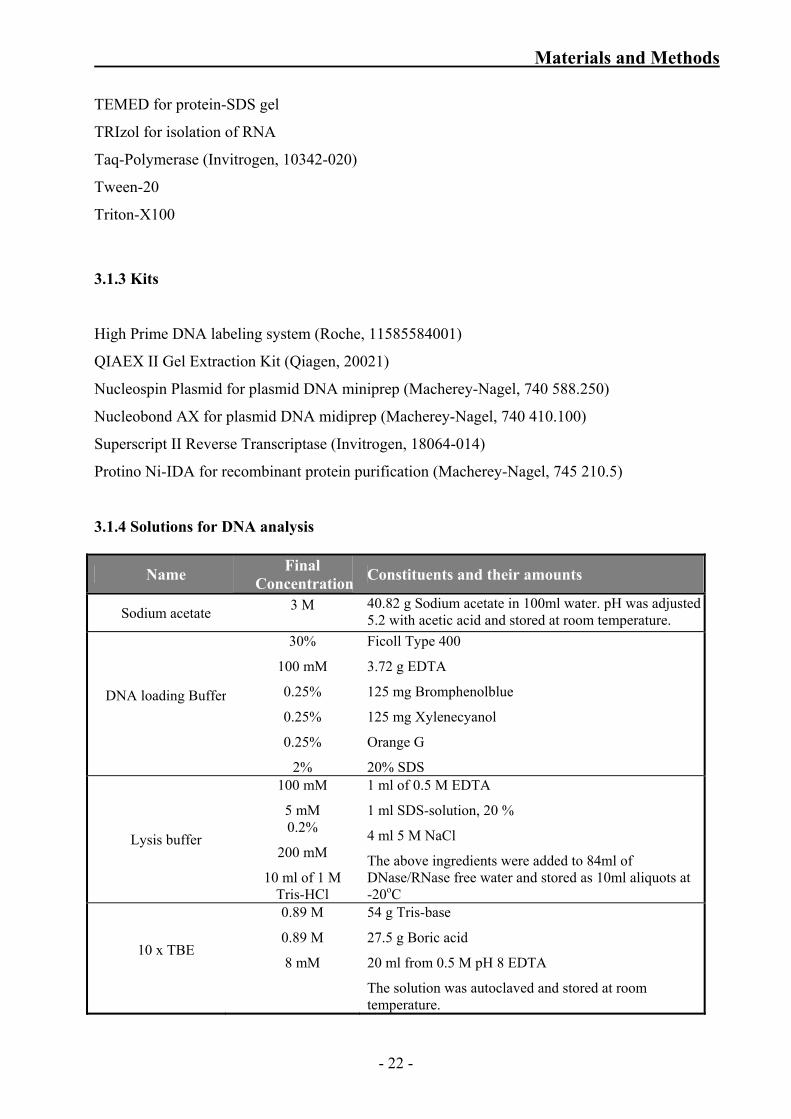
3.1.4 Solutions for DNA analysis
Name Final Concentration Constituents and their amounts
Sodium acetate 3 M
40.82 g Sodium acetate in 100ml water. pH was adjusted 5.2 with acetic acid and stored at room temperature.
DNA loading Buffer
30%
100 mM
0.25%
0.25%
0.25%
2%
Ficoll Type 400
3.72 g EDTA
125 mg Bromphenolblue
125 mg Xylenecyanol
Orange G
20% SDS
Lysis buffer
100 mM
5 mM 0.2%
200 mM
10 ml of 1 M Tris-HCl
1 ml of 0.5 M EDTA
1 ml SDS-solution, 20 %
4 ml 5 M NaCl
The above ingredients were added to 84ml of DNase/RNase free water and stored as 10ml aliquots at -20oC
10 x TBE
0.89 M
0.89 M
8 mM
54 g Tris-base
27.5 g Boric acid
20 ml from 0.5 M pH 8 EDTA
The solution was autoclaved and stored at room temperature.
- 22 -
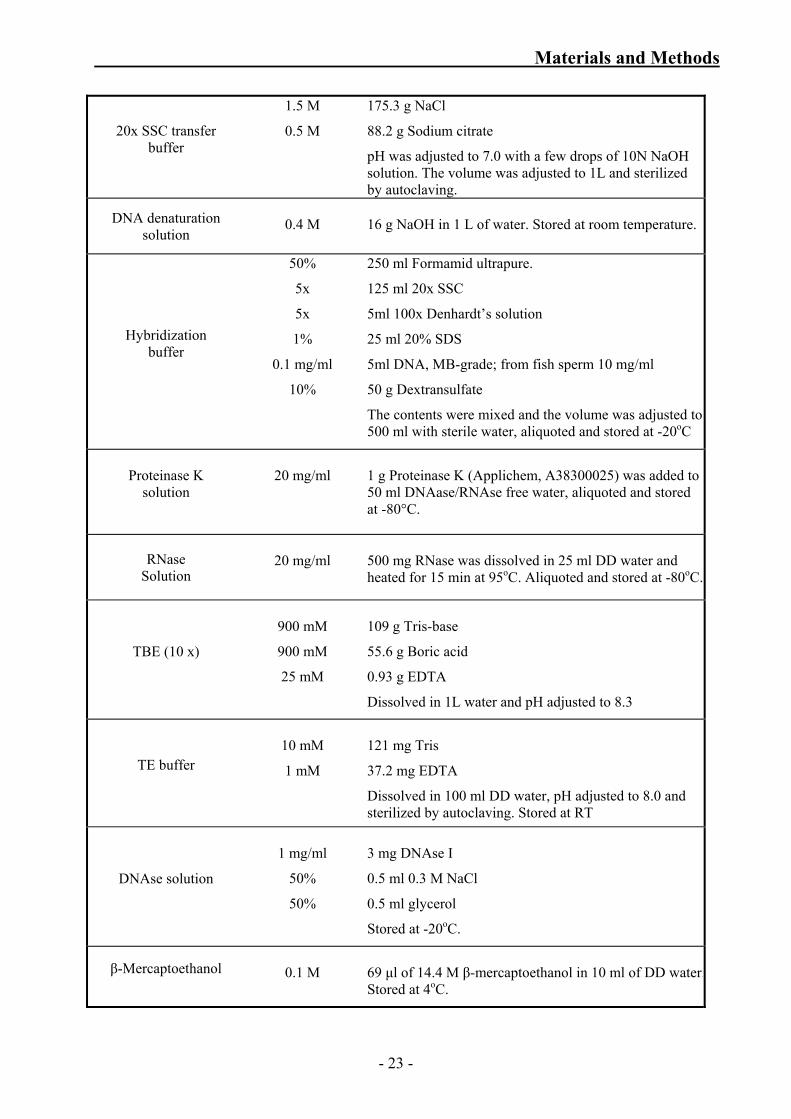
Materials and Methods
20x SSC transfer buffer
1.5 M
0.5 M
175.3 g NaCl
88.2 g Sodium citrate
pH was adjusted to 7.0 with a few drops of 10N NaOH solution. The volume was adjusted to 1L and sterilized by autoclaving.
DNA denaturation solution
0.4 M
16 g NaOH in 1 L of water. Stored at room temperature.
Hybridization buffer
50%
5x
5x
1%
0.1 mg/ml
10%
250 ml Formamid ultrapure.
125 ml 20x SSC
5ml 100x Denhardt’s solution
25 ml 20% SDS
5ml DNA, MB-grade; from fish sperm 10 mg/ml
50 g Dextransulfate
The contents were mixed and the volume was adjusted to 500 ml with sterile water, aliquoted and stored at -20oC
Proteinase K solution
20 mg/ml
1 g Proteinase K (Applichem, A38300025) was added to 50 ml DNAase/RNAse free water, aliquoted and stored at -80°C.
RNase Solution
20 mg/ml
500 mg RNase was dissolved in 25 ml DD water and heated for 15 min at 95oC. Aliquoted and stored at -80oC.
TBE (10 x)
900 mM
900 mM
25 mM
109 g Tris-base
55.6 g Boric acid
0.93 g EDTA
Dissolved in 1L water and pH adjusted to 8.3
TE buffer
10 mM
1 mM
121 mg Tris
37.2 mg EDTA
Dissolved in 100 ml DD water, pH adjusted to 8.0 and sterilized by autoclaving. Stored at RT
DNAse solution
1 mg/ml
50%
50%
3 mg DNAse I
0.5 ml 0.3 M NaCl
0.5 ml glycerol
Stored at -20oC.
β-Mercaptoethanol
0.1 M
69 μl of 14.4 M β-mercaptoethanol in 10 ml of DD water.Stored at 4oC.
- 23 -
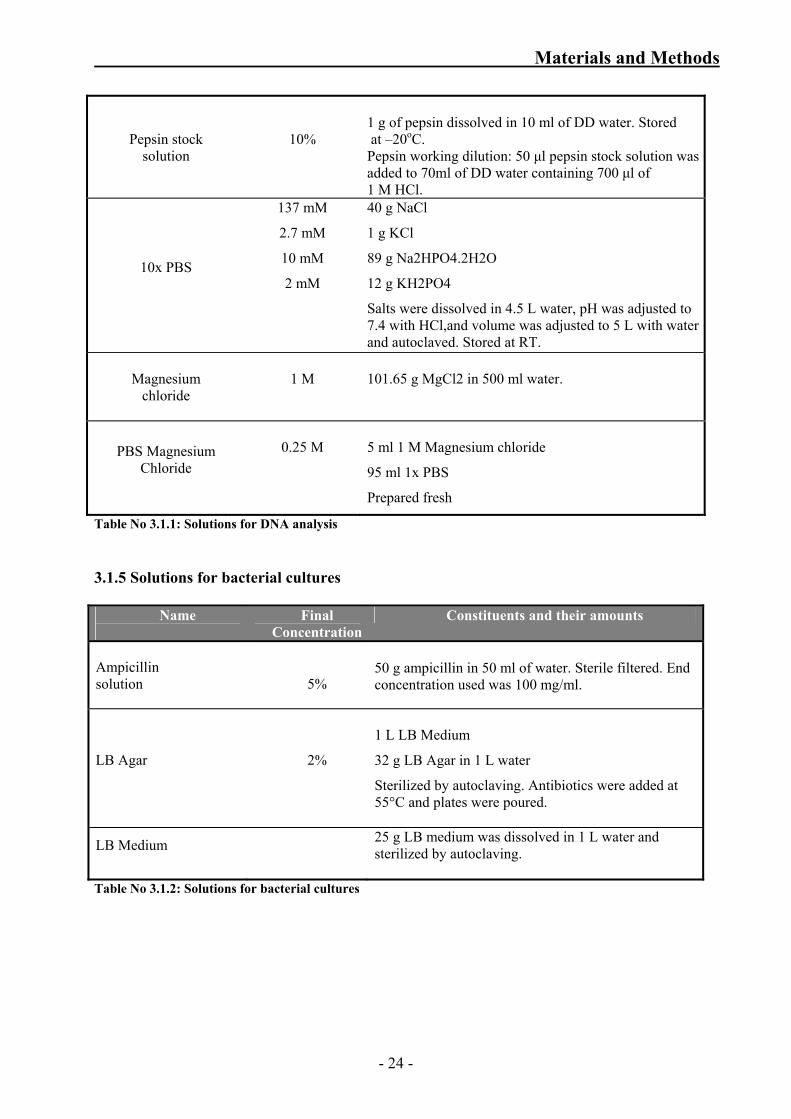
Materials and Methods
Pepsin stock solution
10%
1 g of pepsin dissolved in 10 ml of DD water. Stored at –20oC. Pepsin working dilution: 50 μl pepsin stock solution was added to 70ml of DD water containing 700 μl of 1 M HCl.
10x PBS
137 mM
2.7 mM
10 mM
2 mM
40 g NaCl
1 g KCl
89 g Na2HPO4.2H2O
12 g KH2PO4
Salts were dissolved in 4.5 L water, pH was adjusted to 7.4 with HCl,and volume was adjusted to 5 L with water and autoclaved. Stored at RT.
Magnesium
chloride
1 M
101.65 g MgCl2 in 500 ml water.
PBS Magnesium Chloride
0.25 M
5 ml 1 M Magnesium chloride
95 ml 1x PBS
Prepared fresh
Table No 3.1.1: Solutions for DNA analysis 3.1.5 Solutions for bacterial cultures
Name
Final Concentration
Constituents and their amounts
Ampicillin solution
5%
50 g ampicillin in 50 ml of water. Sterile filtered. End concentration used was 100 mg/ml.
LB Agar
2%
1 L LB Medium
32 g LB Agar in 1 L water
Sterilized by autoclaving. Antibiotics were added at 55°C and plates were poured.
LB Medium
25 g LB medium was dissolved in 1 L water and sterilized by autoclaving.
Table No 3.1.2: Solutions for bacterial cultures
- 24 -
Materials and Methods
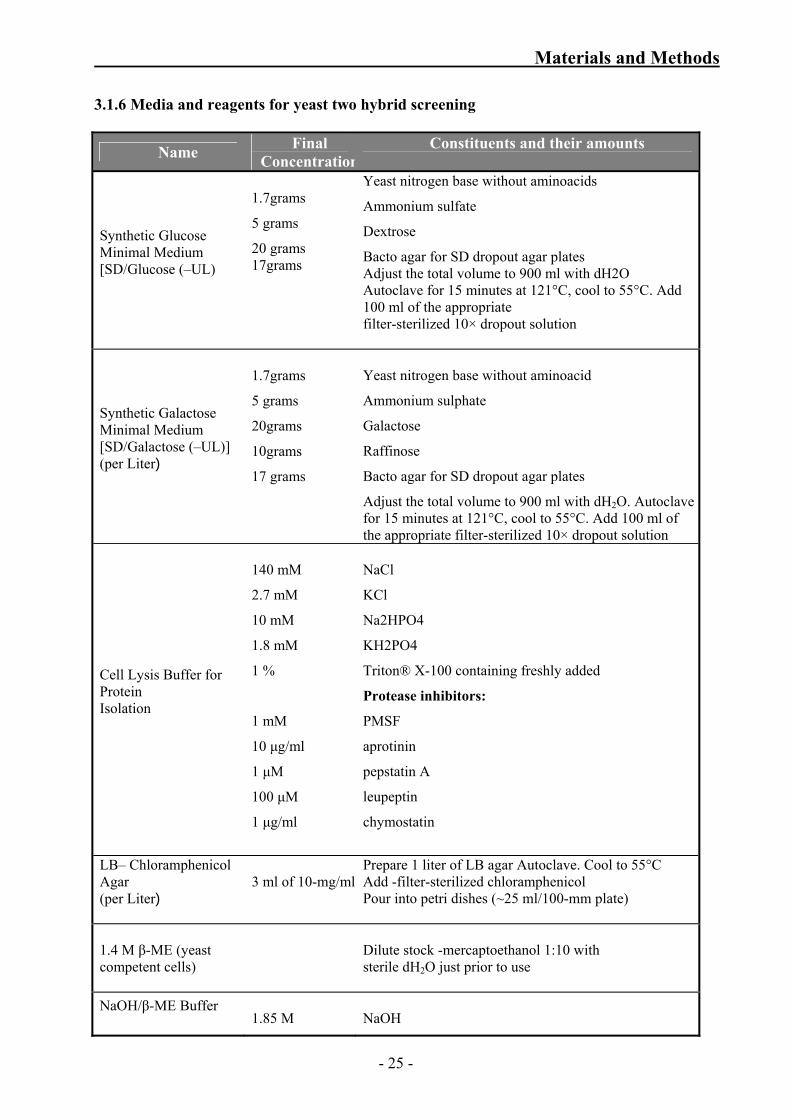
3.1.6 Media and reagents for yeast two hybrid screening
Name Final Concentration
Constituents and their amounts
Synthetic Glucose Minimal Medium [SD/Glucose (–UL)
1.7grams
5 grams
20 grams 17grams
Yeast nitrogen base without aminoacids
Ammonium sulfate
Dextrose
Bacto agar for SD dropout agar plates Adjust the total volume to 900 ml with dH2O Autoclave for 15 minutes at 121°C, cool to 55°C. Add 100 ml of the appropriate filter-sterilized 10× dropout solution
Synthetic Galactose Minimal Medium [SD/Galactose (–UL)] (per Liter)
1.7grams
5 grams
20grams
10grams
17 grams
Yeast nitrogen base without aminoacid
Ammonium sulphate
Galactose
Raffinose
Bacto agar for SD dropout agar plates
Adjust the total volume to 900 ml with dH2O. Autoclave for 15 minutes at 121°C, cool to 55°C. Add 100 ml of the appropriate filter-sterilized 10× dropout solution
Cell Lysis Buffer for Protein Isolation
140 mM
2.7 mM
10 mM
1.8 mM
1 %
1 mM
10 μg/ml
1 μM
100 μM
1 μg/ml
NaCl
KCl
Na2HPO4
KH2PO4
Triton® X-100 containing freshly added
Protease inhibitors:
PMSF
aprotinin
pepstatin A
leupeptin
chymostatin
LB– Chloramphenicol Agar (per Liter)
3 ml of 10-mg/ml
Prepare 1 liter of LB agar Autoclave. Cool to 55°C Add -filter-sterilized chloramphenicol Pour into petri dishes (~25 ml/100-mm plate)
1.4 M β-ME (yeast competent cells)
Dilute stock -mercaptoethanol 1:10 with sterile dH2O just prior to use
NaOH/β-ME Buffer
1.85 M
NaOH
- 25 -
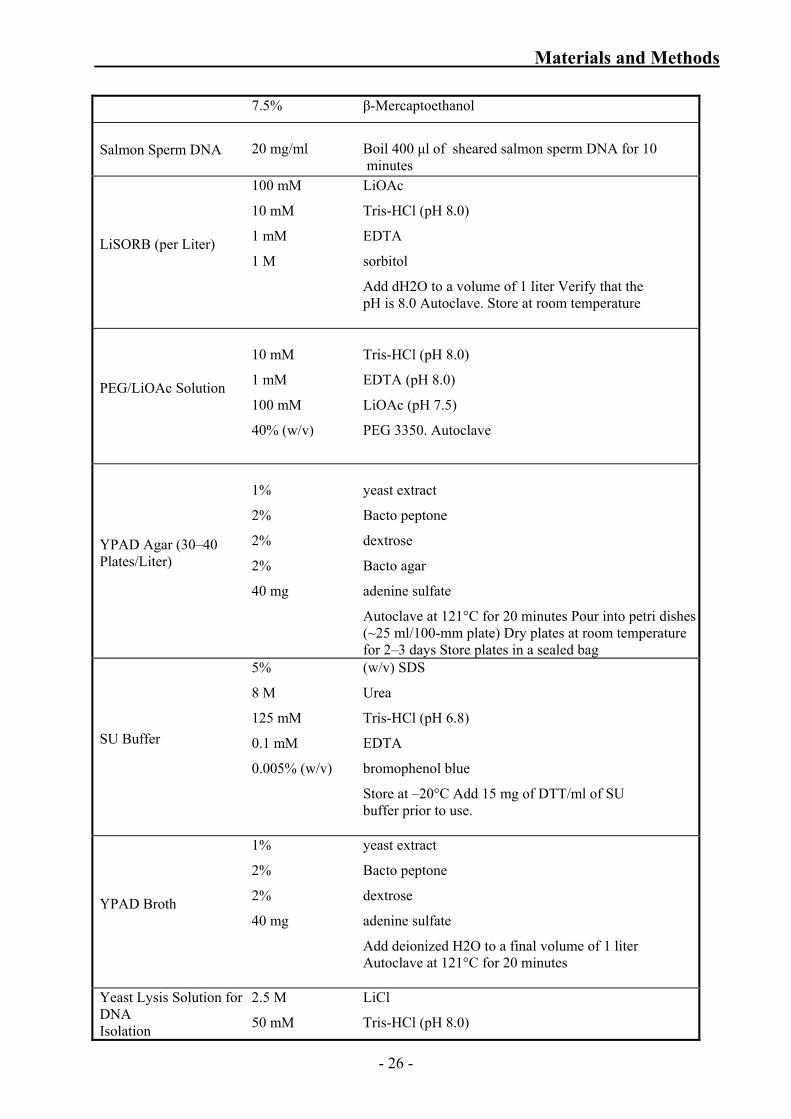
Materials and Methods
7.5% β-Mercaptoethanol
Salmon Sperm DNA 20 mg/ml
Boil 400 μl of sheared salmon sperm DNA for 10 minutes
LiSORB (per Liter)
100 mM
10 mM
1 mM
1 M
LiOAc
Tris-HCl (pH 8.0)
EDTA
sorbitol
Add dH2O to a volume of 1 liter Verify that the pH is 8.0 Autoclave. Store at room temperature
PEG/LiOAc Solution
10 mM
1 mM
100 mM
40% (w/v)
Tris-HCl (pH 8.0)
EDTA (pH 8.0)
LiOAc (pH 7.5)
PEG 3350. Autoclave
YPAD Agar (30–40 Plates/Liter)
1%
2%
2%
2%
40 mg
yeast extract
Bacto peptone
dextrose
Bacto agar
adenine sulfate
Autoclave at 121°C for 20 minutes Pour into petri dishes (~25 ml/100-mm plate) Dry plates at room temperature for 2–3 days Store plates in a sealed bag
SU Buffer
5%
8 M
125 mM
0.1 mM
0.005% (w/v)
(w/v) SDS
Urea
Tris-HCl (pH 6.8)
EDTA
bromophenol blue
Store at –20°C Add 15 mg of DTT/ml of SU buffer prior to use.
YPAD Broth
1%
2%
2%
40 mg
yeast extract
Bacto peptone
dextrose
adenine sulfate
Add deionized H2O to a final volume of 1 liter Autoclave at 121°C for 20 minutes
Yeast Lysis Solution for DNA Isolation
2.5 M
50 mM
LiCl
Tris-HCl (pH 8.0)
- 26 -
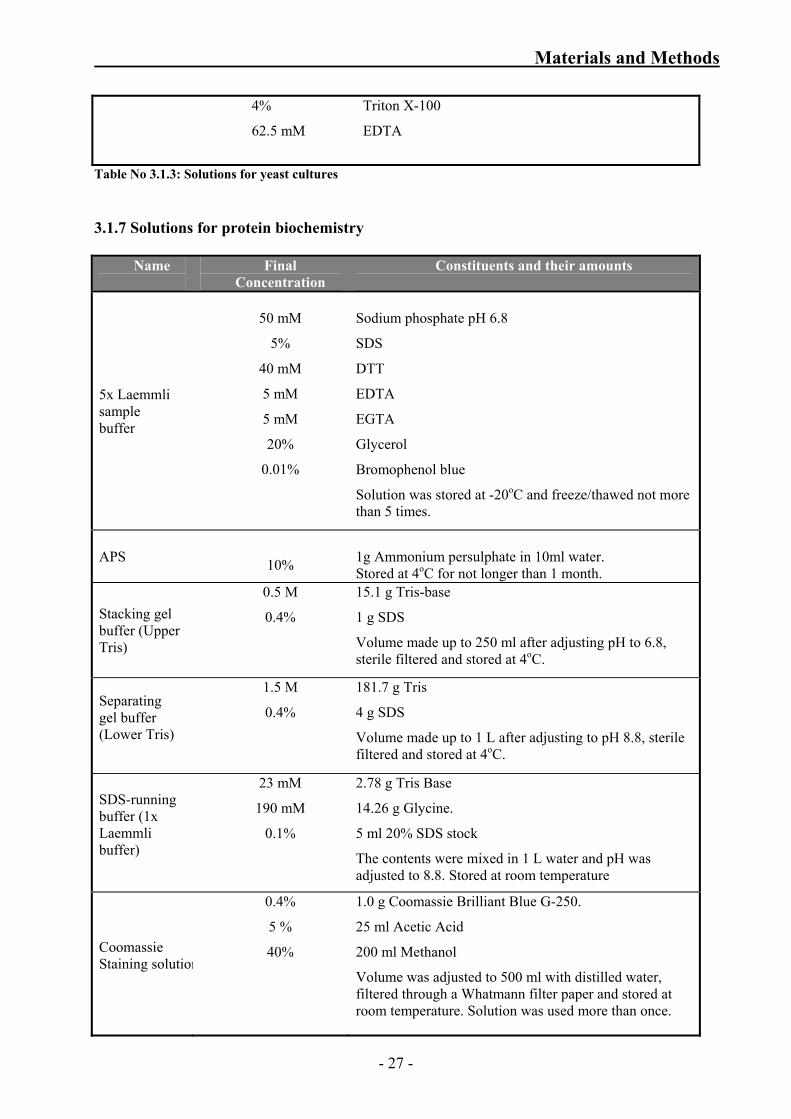
Materials and Methods
4%
62.5 mM
Triton X-100
EDTA
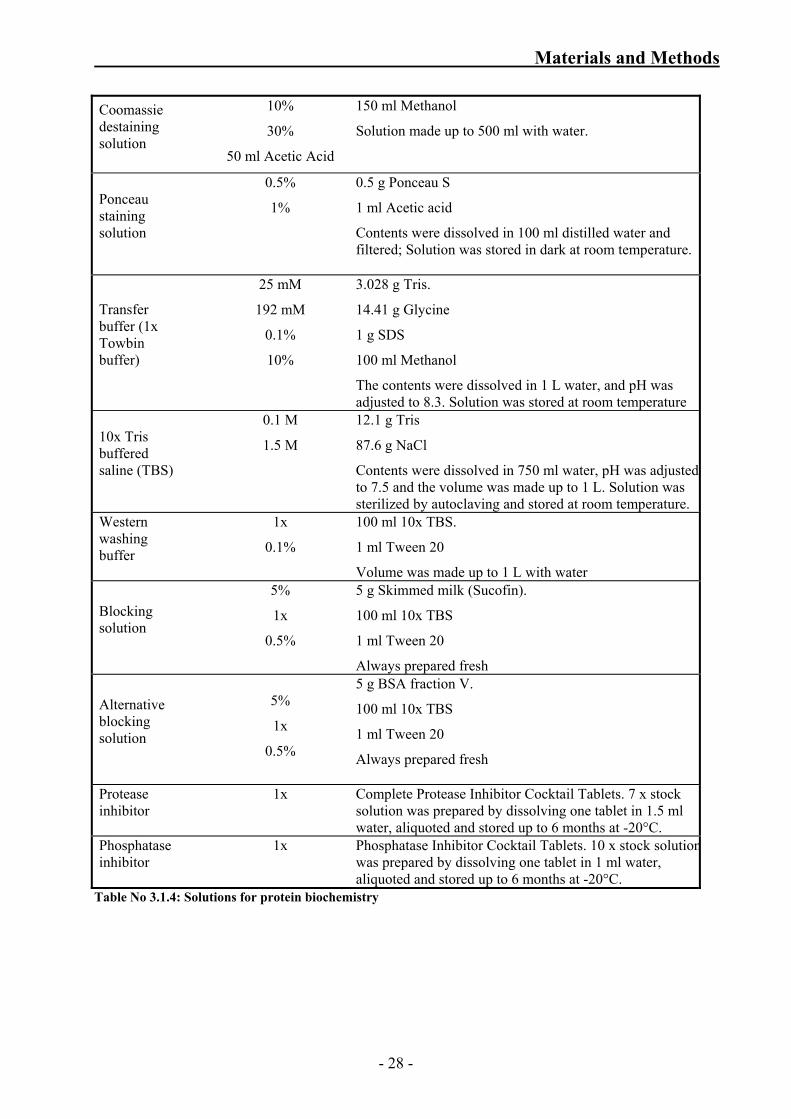
Table No 3.1.3: Solutions for yeast cultures 3.1.7 Solutions for protein biochemistry
Name
Final Concentration
Constituents and their amounts
5x Laemmli sample buffer
50 mM
5%
40 mM
5 mM
5 mM
20%
0.01%
Sodium phosphate pH 6.8
SDS
DTT
EDTA
EGTA
Glycerol
Bromophenol blue
Solution was stored at -20oC and freeze/thawed not more than 5 times.
APS 10%
1g Ammonium persulphate in 10ml water. Stored at 4oC for not longer than 1 month.
Stacking gel buffer (Upper Tris)
0.5 M
0.4%
15.1 g Tris-base
1 g SDS
Volume made up to 250 ml after adjusting pH to 6.8, sterile filtered and stored at 4oC.
Separating gel buffer (Lower Tris)
1.5 M
0.4%
181.7 g Tris
4 g SDS
Volume made up to 1 L after adjusting to pH 8.8, sterile filtered and stored at 4oC.
SDS-running buffer (1x Laemmli buffer)
23 mM
190 mM
0.1%
2.78 g Tris Base
14.26 g Glycine.
5 ml 20% SDS stock
The contents were mixed in 1 L water and pH was adjusted to 8.8. Stored at room temperature
Coomassie Staining solution
0.4%
5 %
40%
1.0 g Coomassie Brilliant Blue G-250.
25 ml Acetic Acid
200 ml Methanol
Volume was adjusted to 500 ml with distilled water, filtered through a Whatmann filter paper and stored at room temperature. Solution was used more than once.
- 27 -
Materials and Methods
Coomassie destaining solution
10%
30%
50 ml Acetic Acid
150 ml Methanol
Solution made up to 500 ml with water.
Ponceau staining solution
0.5%
1%
0.5 g Ponceau S
1 ml Acetic acid
Contents were dissolved in 100 ml distilled water and filtered; Solution was stored in dark at room temperature.
Transfer buffer (1x Towbin buffer)
25 mM
192 mM
0.1%
10%
3.028 g Tris.
14.41 g Glycine
1 g SDS
100 ml Methanol
The contents were dissolved in 1 L water, and pH was adjusted to 8.3. Solution was stored at room temperature
10x Tris buffered saline (TBS)
0.1 M
1.5 M
12.1 g Tris
87.6 g NaCl
Contents were dissolved in 750 ml water, pH was adjusted to 7.5 and the volume was made up to 1 L. Solution was sterilized by autoclaving and stored at room temperature.
Western washing buffer
1x
0.1%
100 ml 10x TBS.
1 ml Tween 20
Volume was made up to 1 L with water
Blocking solution
5%
1x
0.5%
5 g Skimmed milk (Sucofin).
100 ml 10x TBS
1 ml Tween 20
Always prepared fresh
Alternative blocking solution
5%
1x
0.5%
5 g BSA fraction V.
100 ml 10x TBS
1 ml Tween 20
Always prepared fresh
Protease inhibitor
1x
Complete Protease Inhibitor Cocktail Tablets. 7 x stock solution was prepared by dissolving one tablet in 1.5 ml water, aliquoted and stored up to 6 months at -20°C.
Phosphatase inhibitor
1x
Phosphatase Inhibitor Cocktail Tablets. 10 x stock solutionwas prepared by dissolving one tablet in 1 ml water, aliquoted and stored up to 6 months at -20°C.
Table No 3.1.4: Solutions for protein biochemistry
- 28 -
Materials and Methods
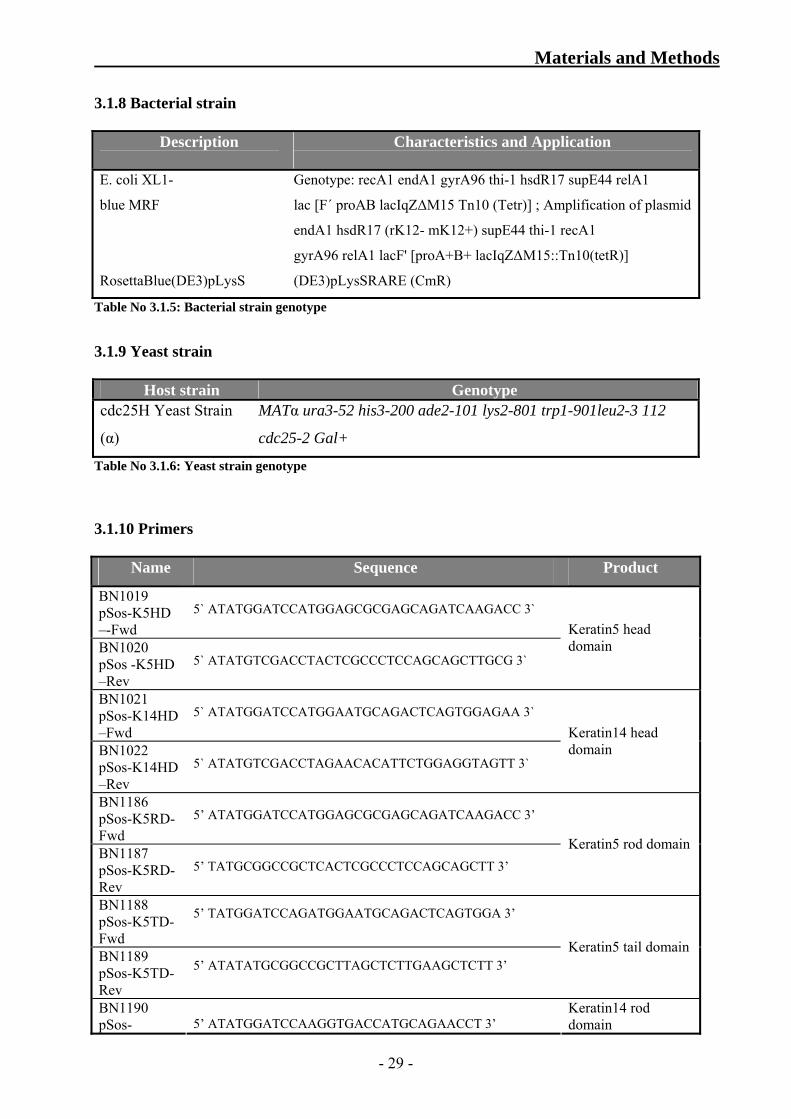
3.1.8 Bacterial strain
Description
Characteristics and Application
E. coli XL1-
blue MRF
RosettaBlue(DE3)pLysS
Genotype: recA1 endA1 gyrA96 thi-1 hsdR17 supE44 relA1
lac [F´ proAB lacIqZΔM15 Tn10 (Tetr)] ; Amplification of plasmid
endA1 hsdR17 (rK12- mK12+) supE44 thi-1 recA1
gyrA96 relA1 lacF' [proA+B+ lacIqZΔM15::Tn10(tetR)]
(DE3)pLysSRARE (CmR)
Table No 3.1.5: Bacterial strain genotype
3.1.9 Yeast strain
Host strain Genotype cdc25H Yeast Strain
(α)
MATα ura3-52 his3-200 ade2-101 lys2-801 trp1-901leu2-3 112
cdc25-2 Gal+
Table No 3.1.6: Yeast strain genotype
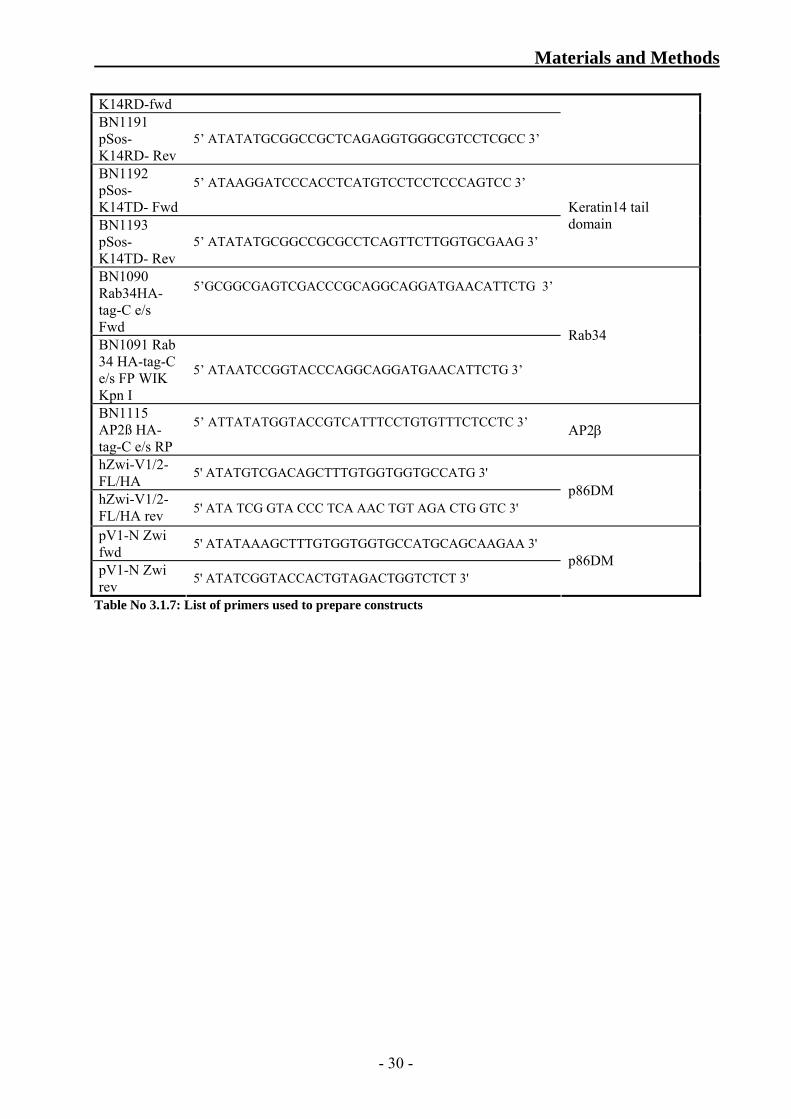
3.1.10 Primers
Name Sequence Product
BN1019 pSos-K5HD –-Fwd
5` ATATGGATCCATGGAGCGCGAGCAGATCAAGACC 3`
BN1020 pSos -K5HD –Rev
5` ATATGTCGACCTACTCGCCCTCCAGCAGCTTGCG 3`
Keratin5 head domain
BN1021 pSos-K14HD –Fwd
5` ATATGGATCCATGGAATGCAGACTCAGTGGAGAA 3`
BN1022 pSos-K14HD –Rev
5` ATATGTCGACCTAGAACACATTCTGGAGGTAGTT 3`
Keratin14 head domain
BN1186 pSos-K5RD-Fwd
5’ ATATGGATCCATGGAGCGCGAGCAGATCAAGACC 3’
BN1187 pSos-K5RD-Rev
5’ TATGCGGCCGCTCACTCGCCCTCCAGCAGCTT 3’
Keratin5 rod domain
BN1188 pSos-K5TD-Fwd
5’ TATGGATCCAGATGGAATGCAGACTCAGTGGA 3’
BN1189 pSos-K5TD-Rev
5’ ATATATGCGGCCGCTTAGCTCTTGAAGCTCTT 3’
Keratin5 tail domain
BN1190 pSos- 5’ ATATGGATCCAAGGTGACCATGCAGAACCT 3’
Keratin14 rod domain
- 29 -
Materials and Methods
K14RD-fwd BN1191 pSos-K14RD- Rev
5’ ATATATGCGGCCGCTCAGAGGTGGGCGTCCTCGCC 3’
BN1192 pSos-K14TD- Fwd
5’ ATAAGGATCCCACCTCATGTCCTCCTCCCAGTCC 3’
BN1193 pSos-K14TD- Rev
5’ ATATATGCGGCCGCGCCTCAGTTCTTGGTGCGAAG 3’
Keratin14 tail domain
BN1090 Rab34HA-tag-C e/s Fwd
5’GCGGCGAGTCGACCCGCAGGCAGGATGAACATTCTG 3’
BN1091 Rab 34 HA-tag-C e/s FP WIK Kpn I
5’ ATAATCCGGTACCCAGGCAGGATGAACATTCTG 3’
Rab34
BN1115 AP2ß HA-tag-C e/s RP
5’ ATTATATGGTACCGTCATTTCCTGTGTTTCTCCTC 3’ AP2β
hZwi-V1/2-FL/HA 5' ATATGTCGACAGCTTTGTGGTGGTGCCATG 3'
hZwi-V1/2-FL/HA rev 5' ATA TCG GTA CCC TCA AAC TGT AGA CTG GTC 3'
p86DM
pV1-N Zwi fwd 5' ATATAAAGCTTTGTGGTGGTGCCATGCAGCAAGAA 3'
pV1-N Zwi rev 5' ATATCGGTACCACTGTAGACTGGTCTCT 3'
p86DM
Table No 3.1.7: List of primers used to prepare constructs
- 30 -
Materials and Methods
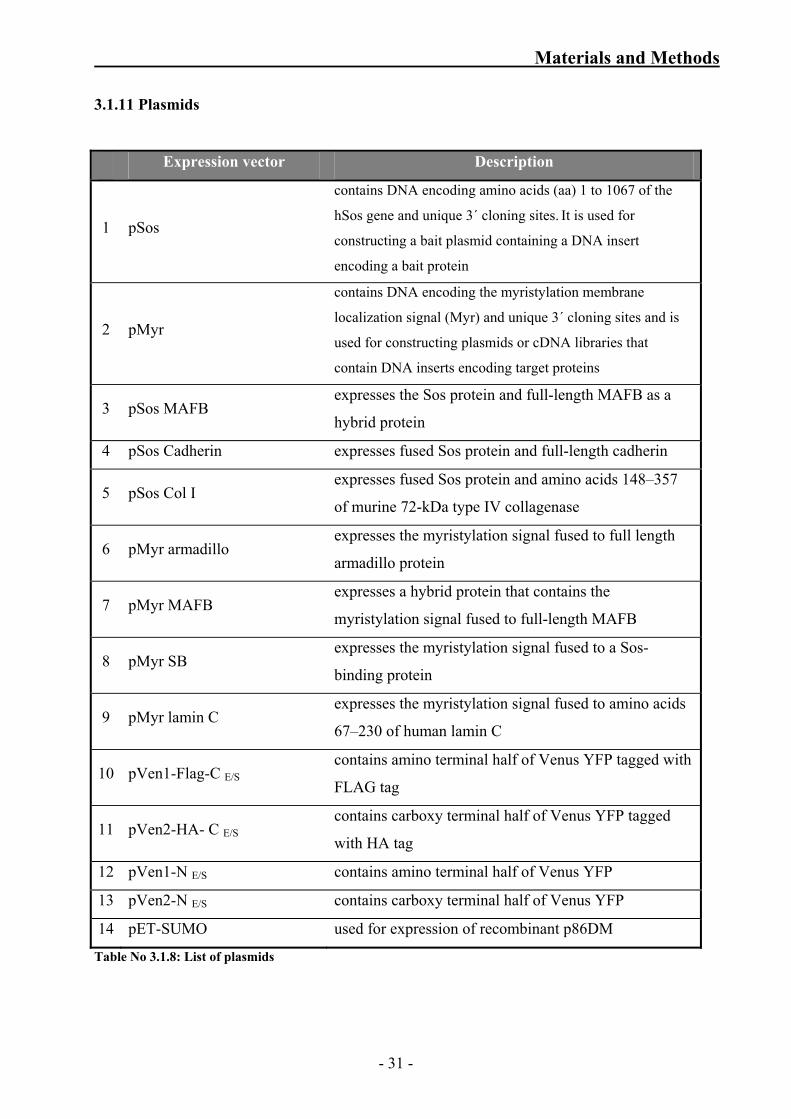
3.1.11 Plasmids
Expression vector Description
1 pSos
contains DNA encoding amino acids (aa) 1 to 1067 of the
hSos gene and unique 3´ cloning sites. It is used for
constructing a bait plasmid containing a DNA insert
encoding a bait protein
2 pMyr
contains DNA encoding the myristylation membrane
localization signal (Myr) and unique 3´ cloning sites and is
used for constructing plasmids or cDNA libraries that
contain DNA inserts encoding target proteins
3 pSos MAFB expresses the Sos protein and full-length MAFB as a
hybrid protein
4 pSos Cadherin expresses fused Sos protein and full-length cadherin
5 pSos Col I expresses fused Sos protein and amino acids 148–357
of murine 72-kDa type IV collagenase
6 pMyr armadillo expresses the myristylation signal fused to full length
armadillo protein
7 pMyr MAFB expresses a hybrid protein that contains the
myristylation signal fused to full-length MAFB
8 pMyr SB expresses the myristylation signal fused to a Sos-
binding protein
9 pMyr lamin C expresses the myristylation signal fused to amino acids
67–230 of human lamin C
10 pVen1-Flag-C E/S contains amino terminal half of Venus YFP tagged with
FLAG tag
11 pVen2-HA- C E/S contains carboxy terminal half of Venus YFP tagged
with HA tag
12 pVen1-N E/S contains amino terminal half of Venus YFP
13 pVen2-N E/S contains carboxy terminal half of Venus YFP
14 pET-SUMO used for expression of recombinant p86DM
Table No 3.1.8: List of plasmids
- 31 -
Materials and Methods
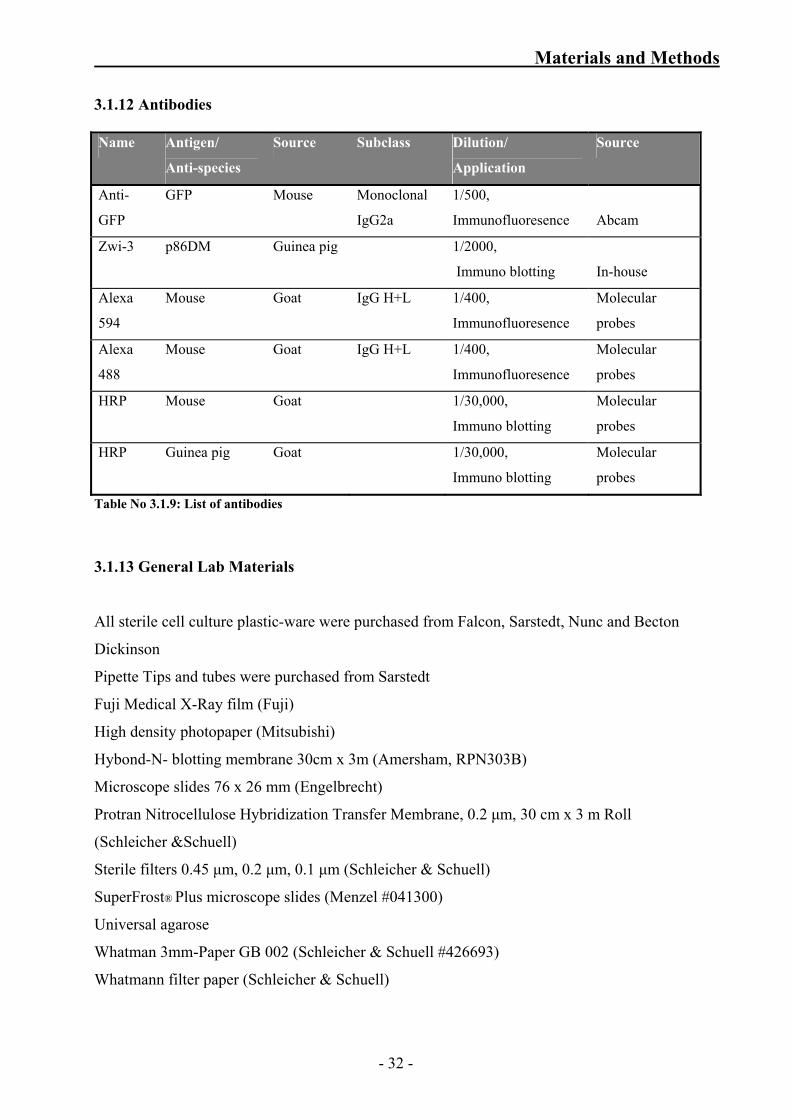
3.1.12 Antibodies Name Antigen/
Anti-species
Source Subclass Dilution/
Application
Source
Anti-
GFP
GFP Mouse Monoclonal
IgG2a
1/500,
Immunofluoresence
Abcam
Zwi-3 p86DM Guinea pig 1/2000,
Immuno blotting
In-house
Alexa
594
Mouse Goat IgG H+L 1/400,
Immunofluoresence
Molecular
probes
Alexa
488
Mouse Goat IgG H+L 1/400,
Immunofluoresence
Molecular
probes
HRP Mouse Goat 1/30,000,
Immuno blotting
Molecular
probes
HRP Guinea pig Goat 1/30,000,
Immuno blotting
Molecular
probes
Table No 3.1.9: List of antibodies
3.1.13 General Lab Materials
All sterile cell culture plastic-ware were purchased from Falcon, Sarstedt, Nunc and Becton
Dickinson
Pipette Tips and tubes were purchased from Sarstedt
Fuji Medical X-Ray film (Fuji)
High density photopaper (Mitsubishi)
Hybond-N- blotting membrane 30cm x 3m (Amersham, RPN303B)
Microscope slides 76 x 26 mm (Engelbrecht)
Protran Nitrocellulose Hybridization Transfer Membrane, 0.2 μm, 30 cm x 3 m Roll
(Schleicher &Schuell)
Sterile filters 0.45 μm, 0.2 μm, 0.1 μm (Schleicher & Schuell)
SuperFrost® Plus microscope slides (Menzel #041300)
Universal agarose
Whatman 3mm-Paper GB 002 (Schleicher & Schuell #426693)
Whatmann filter paper (Schleicher & Schuell)
- 32 -
Materials and Methods
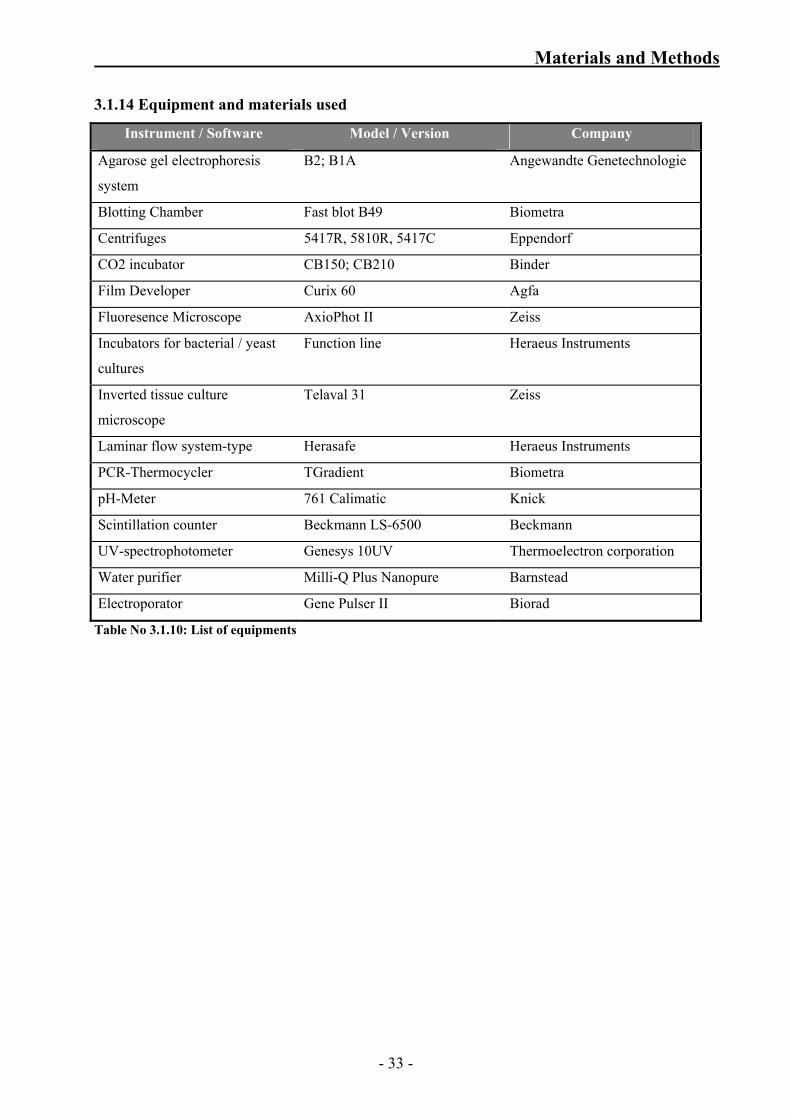
3.1.14 Equipment and materials used
Instrument / Software Model / Version Company
Agarose gel electrophoresis
system
B2; B1A Angewandte Genetechnologie
Blotting Chamber Fast blot B49 Biometra
Centrifuges 5417R, 5810R, 5417C Eppendorf
CO2 incubator CB150; CB210 Binder
Film Developer Curix 60 Agfa
Fluoresence Microscope AxioPhot II Zeiss
Incubators for bacterial / yeast
cultures
Function line Heraeus Instruments
Inverted tissue culture
microscope
Telaval 31 Zeiss
Laminar flow system-type Herasafe Heraeus Instruments
PCR-Thermocycler TGradient Biometra
pH-Meter 761 Calimatic Knick
Scintillation counter Beckmann LS-6500 Beckmann
UV-spectrophotometer Genesys 10UV Thermoelectron corporation
Water purifier Milli-Q Plus Nanopure Barnstead
Electroporator Gene Pulser II Biorad
Table No 3.1.10: List of equipments
- 33 -
Materials and Methods
3.2 Methods
3.2.1 Molecular biological methods
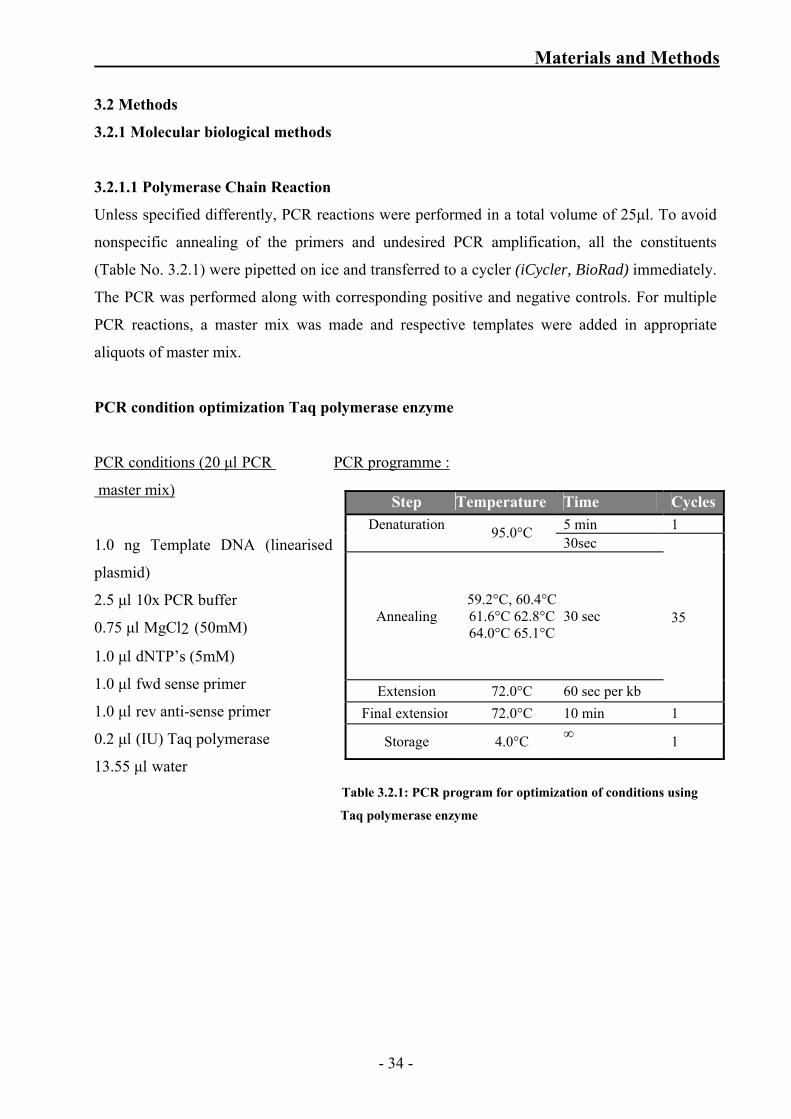
3.2.1.1 Polymerase Chain Reaction
Unless specified differently, PCR reactions were performed in a total volume of 25μl. To avoid
nonspecific annealing of the primers and undesired PCR amplification, all the constituents
(Table No. 3.2.1) were pipetted on ice and transferred to a cycler (iCycler, BioRad) immediately.
The PCR was performed along with corresponding positive and negative controls. For multiple
PCR reactions, a master mix was made and respective templates were added in appropriate
aliquots of master mix.
PCR condition optimization Taq polymerase enzyme
PCR conditions (20 μl PCR PCR programme :
master mix) Step Temperature Time Cycles
5 min 1 Denaturation 95.0°C
30sec
Annealing 59.2°C, 60.4°C61.6°C 62.8°C64.0°C 65.1°C
30 sec
Extension 72.0°C 60 sec per kb
35
Final extension 72.0°C 10 min 1
Storage 4.0°C
1.0 ng Template DNA (linearised
plasmid)
2.5 μl 10x PCR buffer
0.75 μl MgCl2 (50mM)
1.0 μl dNTP’s (5mM)
1.0 μl fwd sense primer
1.0 μl rev anti-sense primer ∞ 0.2 μl (IU) Taq polymerase
13.55 μl water Table 3.2.1: PCR program for optimization of conditions using
Taq polymerase enzyme
1
- 34 -

Materials and Methods
PCR amplification using proof reading Taq polymerase enzyme
PCR conditions (20 μl PCR PCR programme :
master mix)
10.0 ng (1.0 μl) Template DNA
(linearised plasmid)
Step Temperature Time Cycles 5 min 1 Denaturation
95.0°C 30sec
Annealing X°C from
optimization reaction
30 sec
Extension 72.0°C 60 sec per kb
20
Final extension 72.0°C 10 min 1
Storage 4.0°C ∞ 1
5.0 μl 5x high fidelity PCR buffer
with MgCl2 (50mM)
1.0 μl dNTP’s (5mM)
1.0 μl fwd sense primer
1.0 μl rev anti-sense primer
0.25 μl (IU) Taq polymerase
10.75 μl water Table 3.2.2: PCR program for optimization of conditions using
proof reading Taq polymerase enzyme
3.2.1.2 Ligation of PCR products
PCR products were ligated with the TOPO® cloning kit (Invitrogen). To avoid auto degradation
of adenosine overhangs upon longer storage intervals, freshly prepared PCR products were used.
If blunt end producing (3´-5´ exonuclease activity, proof reading activity) polymerase was used,
the ligation was carried out using the Zero Blunt® TOPO® PCR cloning kit (Invitrogen). The
ligation was done according to the manufacturer's directions.
3.2.1.3 Transformation and culture of E. coli
The ligation product (2 μl) was mixed with 20 μl of competent E. coli (XL1 blue) and incubated
on ice for 30 min. The cells were heat shocked at 42°C for 90s and were quickly placed on ice
for 2 min. 500 μl LB medium was added and cells were incubated in a bacterial shaker at 37°C
for 1 h. The cells were spread on LB-plates with respective antibiotic.
After 14-20 h of incubation at 37°C, colonies were chosen and kept for overnight cultures in 5
ml LB-growth medium with the respective antibiotic.
3.2.1.4 Preparation of plasmid DNA
3.2.1.4.1 Plasmid DNA isolation (mini preparation)
For analytical purposes, 5 ml of overnight bacterial culture was used. The plasmids were isolated
using silica columns according to manufacturer's instructions (NucleoBond PC20, Machery-
- 35 -
Materials and Methods
Nagel).
3.2.1.4.2 Preparative Plasmid DNA isolation (midi/maxi preparations)
For preparative purposes, 50 ml - 100 ml of overnight bacterial culture was used. The plasmids
were isolated with silica columns according to manufacturer's instructions (NucleoBond PC100,
Machery-Nagel).
3.2.1.5 DNA restriction digestion
Digestions of DNA with restriction endonucleases were performed according to the instructions
given by the manufacturer (Fermentas Life sciences).
3.2.1.6 Agarose gel electrophoresis
Agarose gel electrophoresis was used to resolve DNA constructs. Agarose gels were casted in
TAE Buffer. 0.5 μg/ml ethidium bromide was added while casting gel. DNA samples were
diluted in 10x loading dye before loading on agarose gels. One kb and 100 bp molecular weight
ladders (Invitrogen) were used to analyze the molecular size of the DNA. Gels were run at 80-
120 V in TAE buffer.
3.2.1.7 Isolation of DNA fragments from agarose gel
Under UV-light desired bands were cut out from the gel using a sterile scalpel. DNA was
extracted from the agarose using the Qiagen gel extraction kit.
3.2.1.8 DNA precipitation in ethanol / isopropanol
Ethanol and isopropanol precipitation was used for the purification of DNA and RNA. Ionic
concentration of the aqueous DNA and/or RNA solution was increased by addition of 1/10
volume 3 M sodium acetate solution (pH 5.2). About 2.5 times volumes of ethanol/isopropanol
were added. The DNA and/or RNA was incubated at -20°C for 30-60 min. Afterwards the
sample was centrifuged at 14,000 rpm, the pellet was washed with 70% ethanol and dried for 10
min at 60°C. Then the DNA and/or RNA pellet was dissolved in the desired quantity of Sigma
water or TE buffer pH 8.0
- 36 -
Materials and Methods
3.2.1.9 Concentration determination of nucleic acids
To determine the concentration of DNA or RNA in a solution the optical density (OD) was
measured. Nucleic acids have an absorption maximum at 260 nm and proteins absorb UV light
maximally at a wavelength of 280 nm. An OD unit corresponds to the amount of nucleic acid in
µg in a 1 ml volume using a 1 cm path length quartz cuvette that results in an OD260 reading of
1.
For DNA OD260 1 = 50 mg / ml,
For RNA OD260 1 = 40 mg / ml,
For single stranded oligonucleotides OD260 1 ~ 33 mg / ml
The ratio of readings taken at 260 nm and 280 nm wavelengths indicates of the purity of the
nucleic acid.
For pure DNA OD260/OD280 = 1.8
For pure RNA OD260/OD280 = 2.0
3.2.1.10 Sequencing of DNA
The sequencing of plasmids was performed by the Macrogen Incorporations in Seoul (South
Korea).
3.2.1.11 Southern blotting
Rod domains of Keratin 5 and 14 were amplified by PCR and obtained 929bps and 932bps
amplified product respectively. The PCR products were loaded on a 0.7% agarose gel in 1x
TBE- buffer with 0.5 μg/ml ethidiumbromide. The samples were run for about 400- 700 Vh
with a maximum of 80 V. Photograph of the gel was taken by exposing to limited UV. Gel
was incubated 30- 40 min in 0.4 M NaOH and Hybond N+ and 3 sheets of filter paper were
kept. Buffer reservoir with 300- 400 ml 20x SSC - 2x filter papers - Gel – membrane - 2x
filter paper - pile of paper cloths - glass plate- about 200 g- weights were used. Transfer was
carried out and then the membrane was removed carefully and the gel run was marked with a
pencil. Membrane was washed for 15 seconds in 2 x SSC and dried totally on filter paper.
DNA present on the membrane was baked at 80°C for 2 h or can be UV cross linked for ~30
sec (0.16kJ/m2). The membrane was washed with 5X SSPE and then incubated in 25 ml
hybridization buffer for 30 min (or longer – maximum overnight) at 42°C. In the meantime
probe was prepared. Labeling of the probe was done using dCTP. 25ng of DNA is mixed with
10 μl of buffer and made up to 40μl with water. The sample is kept in boiling water bath for
10 mins and snap cooled in ice. To the snapped chilled sample 3 µl MixC (dNTP without
- 37 -
Materials and Methods
dCTP), 5µl radioactive labelled dCTP, 1µl Klenow enzyme was added and incubated at 37°C
for 5mins.To the above sample 4μl of dNTP was added and incubated at 37°C for 10 mins
and the reaction was stopped by the addition of 1μl EDTA (0.5M). The sample is made to
200μl with TE and then to that 400μl of 70% Ethanol, 40 µl NaAcetate, 1µl glycogen. Spun
for 15 min 14.000 rpm in room temperature and the supernatant was collected for scintillation
counter. The pellet was washed twice with 70% ethanol and dissolved in 50μl Sigma water.
1μl was taken into counter.
Calculation:
counts supernatant + counts probe = counts total (~ 50-60 Mio in 5µl fresh dCTP).
Incorporation rate = counts probe / counts total.
Salmon sperm DNA (100 µg/ml hybridization solution) was added to the hybridization tubes
containing the labeled probe and incubate 5 min at 95°C before adding probes. Spun briefly
for a few seconds and the probe were added to the hybridization tubes (do not add directly on
membrane) followed by incubation at 42°C for at least 16 h. After the hybridization,
membrane was washed for Wash 20- 30 min at 68°C in the shaking water bath with 300 ml of
pre-warmed washing solution. Exposed along with StrataLogos.
3.2.1.12 Isolation of RNA
For the isolation and the analysis of RNA some precautionary measures were followed. For all
buffers and solutions sterile milli Q water was used. All used glassware was baked for at least 4
h at 180°C before use. Metallic parts such as spatulas, pincets or the homogenizer were washed
thoroughly with RNase off and followed by sterile milli Q water. The RNA was isolated with
TRIzol reagent (Invitrogen). 1 mL TRIzol reagent was used per 10 cm2 cultured dish. The
suspension was homogenized in TRIzol reagent with a homogenizator (T8 ultra turrax, IKA) and
passed through a 21 G needle at least 10 times. Homogenized samples were left at room
temperature for 5 min in 2 ml eppendorf tubes to allow complete dissociation of nucleoprotein
complexes. The homogenate was centrifuged at 5,000 rpm at 4°C for 5 min. The supernatant was
then mixed with 1/10 volume 1-Bromo-3-chloro-propane by vortexing. The mixture was
incubated for 3 min and centrifuged at 4°C at 14,000 rpm. The aqueous phase was carefully
transferred into a fresh tube and mixed with an equal volume isopropanol and incubated for 10
min. Afterwards the sample was centrifuged at 4°C at 14,000 rpm. The resulting RNA pellet was
washed with 75% ethanol. The pellet was dried in air for 10-15 min and dissolved in milli Q
water by incubating 15 min at 55°C. The RNA concentration was estimated by reading O.D.
using the Genesys 10uv.
- 38 -
Materials and Methods
3.2.1.13 Amplification of p86DM by RT-PCR from isolated RNA
For the reverse transcription reaction, 1 μg total RNA isolated from Caco-2 cells was
incubated with 20 pmol of oligonucleotide primers at 70°C for 10 min. After a short cooling
on ice, 1x first strand buffer, 10mM dithiothreitol, 1 mM dNTP’s, 20 U of RNAsin (1U) were
added to a total volume of 19 μl with RNase free water, mixed and incubated at 42oC for 2
min. 200 U of Superscript II reverse transcriptase was added to the reaction mix, mixed by
pipetting up and down and incubated at 42°C for 50 min. The reaction was stopped by
incubating the reaction at 72oC for 15 min. The reaction mix was taken directly for the PCR
reaction. PCR was performed in a 25 μl reaction mixture containing 1 μl of template cDNA,
as detailed in section 3.2.1.1.
3.2.2 Cell culture methods
Common cell culture methods
All cell lines were cultivated at 37°C in an incubator with 5% CO2 and humid atmosphere.
Adherent growing cells were grown in tissue culture dishes on 6 or 10 cm diameter dishes.
3.2.2.1 Passage of mammalian cells
Almost confluent (80-90%) grown cells were passaged into a new culture dish. First the medium
was removed and cells were washed with 10 ml PBS. Approximately 2 ml of a trypsin/EDTA
solution (Invitrogen) were added and the plate was incubated at 37°C for 3-5 min to dislodge the
cells. Trypsinization was inhibited by addition of 5 ml growth medium. Cells were mixed well
by pipetting up and down with a 10 ml glass pipette and transferred into a Falcon tube. The cells
were pelleted by centrifugation (1,200 rpm, 2 min), resuspended in growth medium and seeded
at suitable density.
3.2.2.2 Freezing and storage of cells
A 15 cm confluent culture dish was passaged as above. Cells were resuspended in 5 ml freezing
medium with 10% DMSO and transferred with a sterile 1 ml pipette in cryotubes. The cells were
stored overnight at –20°C prior to -80°C long term storage.
3.2.2.3 Thawing of cells
Cells were thawed in a 37°C water bath as quickly as possible. In order to minimize the toxic
effect of the DMSO, 5 ml fresh growth medium were added and cells were pelleted by
centrifugation at 1,200 rpm for 2 min. The cell pellet was resuspended in the appropriate cell
- 39 -
Materials and Methods
culture medium and seeded depending upon desired cell density in tissue culture dishes and
cultivated under standard conditions.
3.2.2.4 Cell counting
The cell number was determined using a Neubauer modified cell chamber. The cell number per
ml was calculated by determining the average number of cells in the 4 large squares and
multiplying by 104.
3.2.2.5 Transient transfection of eukaryotic cells
Cells were grown to 60-80% confluence before transient transfection. Transfection was
performed using Lipofectamine reagent (Invitogen) according to the manufacturer's instructions.
3.2.2.6 Immunocytochemistry
Transiently transfected cells were cultured on glass cover slips to 50-80% confluence. Cells were
fixed in 4% paraformaldehyde for 10 min followed by permeabilization with 0.1% Triton X-100
for 10 min and blocking with 5% BSA for 1 h. Cells were incubated with desired primary
antibody/antibodies, for 2 h in 1% BSA. Primary antibodies were detected by using conjugated
secondary antibodies diluted as per the manufacturer’s instructions. Coverslips were mounted on
glass slides using 15% Mowiol mounting medium. Images were acquired on a fluorescence
inverted microscope (Zeiss).
3.2.3 Screening of keratin associated proteins using Sos recruitment system
3.2.3.1 Establishing streaked yeast agar plate
Cells were obtained from the glycerol stock by scraping off splinters of solid ice with a sterile
wire loop or sterile inoculating stick. Splinters were streaked on an YPAD agar plate.
The plate was incubated at room temperature (22–25°C) until colonies appeared (~4 days).
3.2.3.2 Preparation of - 80°C yeast glycerol stock
Single colony grown on YPAD agar plate was inoculated in 10ml of YPAD broth and were
grown to late log phase (OD600 = 0.8–1.0) at room temperature (22–25°C). 4.5 ml of a sterile
solution of 50% glycerol in liquid YPAD (prepared as 5 ml of glycerol + 5 ml of YPAD
broth) was added to the yeast culture from step with continuous mixing. Glycerol-containing
cell suspension was aliquoted into sterile centrifuge tubes (1 ml/ tube) and stored at –80°C.
- 40 -
Materials and Methods
3.2.3.3 Verification of yeast host strain marker phenotype Yeast from the –80°C glycerol stock was streaked onto each of the four agar “dropout”
(tryptophan (Trp), leucine (Leu), histidine (His), and uracil (Ura)) plates and the plates were
incubated at room temperature (22–25°C) for 4–6 days. Simultaneously sample of the same
glycerol stock was streaked onto a YPAD agar plate and incubated at room temperature (22–
25°C) for 4–6 days. After the phenotype has been verified (growth on the YPAD plate and no
growth on any of the four SD agar dropout plates), colonies from the YPAD plate were used
for the preparation of competent yeast cells.
3.2.3.3 Preparation of cdc25H yeast competent cells In the preparation of the competent cell, if revertants have arisen, then it is not suitable for two-
hybrid screening experiments. Fresh plate of cdc25H (aor α,) was prepared from the glycerol
stock by scraping off splinters of solid ice with a sterile wire loop and streaked the splinters
onto a YPAD agar plate. Plate was incubated at room temperature (22–25°C) until colonies
appeared (~4 days). 4–5 cdc25H yeast colonies were picked (from a plate that is less than one
week old) into separate 1.5-ml microcentrifuge tubes containing 1 ml YPAD. Cell clumps were
completely dispersed by vortexing and yeast cell suspensions were diluted to 50 ml with YPAD
followed with incubation for 14–16 hours at room temperature (22–25°C) with shaking at 220–
250 rpm till the OD600 of the cultures was >1.
Cultures were diluted for a total diluted culture volume of 300 ml (OD600=0.2) and
incubated at room temperature (22–25°C) with shaking at 220–250 rpm for 3 hours
(OD600>0.7). 75 µl (approximately 1 × 10⁶ cells) of each culture was plated on YPAD
agar plate, sealed and incubated at 37°C. The plates were observed daily for 4–6 days,
checking for temperature-sensitive revertants. Plates with more than 30 colonies after 6
days of incubation were discarded.
Remaining volume of the yeast cultures was pelleted by centrifugation at 1000×g for 5
minutes at room temperature, yeast cell pellets were resuspended in 50 ml of dH2O and spun at
1000×g for 10 minutes at room temperature. Supernatant was discarded and the pellet was
resuspended in 50 ml of LiSORB followed by incubation at room temperature for 30 minutes.
At the end of the 30-minutes incubation, yeast cells were pelleted by spinning at 1000 × g for
5 minutes at room temperature and resuspend in 300µl of LiSORB. 600 µl of sheared salmon
sperm DNA mixture was added to the 300 µl of yeast cells from the previous step. Mixed
thoroughly, to each cell preparation 5.4ml of PEG/LiOAc solution and 530 µl of DMSO was
added and mixed. Cells were aliquoted in volumes of 500µl and 100µl in separate micro
- 41 -
Materials and Methods
centrifuge tubes.
3.2.3.4 Transforming yeast and detecting protein-protein interactions Yeast transformation mixtures were prepared as outlined in Table No: 3.2.3. Plasmid DNA
was added in the combinations listed to separate aliquots of freshly prepared cdc25H yeast
competent cells. 2 µl of 1.4 M β-mercaptoethanol was added to each tube and mixed the contents
thoroughly but gently by inversion or tapping.
Transformation suspensions were incuba ted at room temperature for 30 minutes with
occasional tapping. Cell suspensions were subjected to heat-shock treatment by incubating the
transformation suspensions at 42°C for 15 minutes. Placed immediately on ice and left for 3 min.
Cells were collected by centrifugation for 30 seconds at 14,000 rpm at room temperature and
the supernatant was discarded. Cells were resuspended in 0.5 ml of 1 M sorbitol. Each of the
transformation mixture was spread on agar plates using sterile glass beads as indicated in Table
No: 3.2.3. For transformation group1, 10 µl and 100 µl of the cells we r e p l a t e d on
separate 150 mm SD/glucose (–UL) agar plates and incubated these plates at room
temperature (22–25°C). These platings were used to determine cotransformation efficiency.
Remainder of transformation reaction 1 was plated on a150-mm SD/glucose (–UL) agar plate
and Incubated at 37°C, this plate was observed daily for 4–6 days to check for temperature-
sensitive revertants.
After incubation of this plate 37°C for 4–6 days, observed for any growth of colonies ( no
colonies should appear. Colonies present on this plate indicate that the cells used for the
transformation contained temperature-sensitive revertants or were not cdc25H).
Transformation efficiency for the competent cell preparation was evaluated if the reversion
control plates met the above criteria. Number of colonies on plates from transformation group1
(Table No: 3.2.3) incubated at room temperature (22–25°C) were counted. Cotransformation
efficiency was calculated using the following equation (The transformation efficiency should be
at least 0.5 × 10³–1 × 10⁴ cfu/µg).
For transformations 2–12, the entire transformation reaction mixture was plated on a 100-mm
SD/glucose plate (either SD/glucose (–U), SD/glucose (–L) or SD/glucose (–UL) according to
Table No: 3.2.3). Incubated at room temperature (22–25°C) until colonies were seen (4–6 days).
Three colonies from each of these transformations (5–8, and 10-12) were selected for transfer to
SD/glucose (–UL) and SD/galactose (–UL) to test for protein-protein interactions that allow
- 42 -
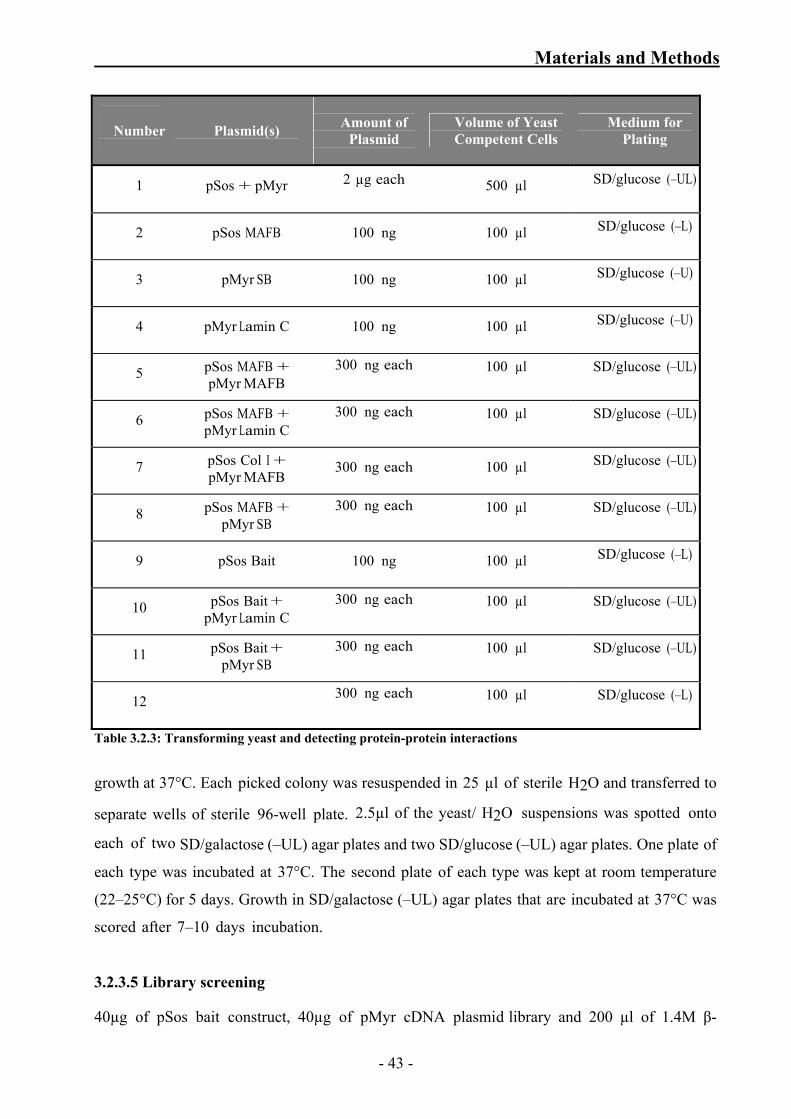
Materials and Methods
Number
Plasmid(s)
Amount of
Plasmid
Volume of Yeast Competent Cells
Medium for Plating
1 pSos + pMyr 2 µg each
500 µl SD/glucose (–UL)
2 pSos MAFB 100 ng 100 µl SD/glucose (–L)
3 pMyr SB 100 ng 100 µl SD/glucose (–U)
4 pMyr Lamin C 100 ng 100 µl SD/glucose (–U)
5 pSos MAFB + pMyr MAFB
300 ng each
100 µl
SD/glucose (–UL)
6 pSos MAFB + pMyr Lamin C
300 ng each
100 µl
SD/glucose (–UL)
7 pSos Col I + pMyr MAFB
300 ng each 100 µl SD/glucose (–UL)
8 pSos MAFB + pMyr SB
300 ng each
100 µl
SD/glucose (–UL)
9 pSos Bait 100 ng 100 µl SD/glucose (–L)
10 pSos Bait + pMyr Lamin C
300 ng each
100 µl
SD/glucose (–UL)
11 pSos Bait + pMyr SB
300 ng each
100 µl
SD/glucose (–UL)
12 300 ng each
100 µl
SD/glucose (–L)
Table 3.2.3: Transforming yeast and detecting protein-protein interactions
growth at 37°C. Each picked colony was resuspended in 25 µl of sterile H2O and transferred to
separate wells of sterile 96-well plate. 2.5µl of the yeast/ H2O suspensions was spotted onto
each of two SD/galactose (–UL) agar plates and two SD/glucose (–UL) agar plates. One plate of
each type was incubated at 37°C. The second plate of each type was kept at room temperature
(22–25°C) for 5 days. Growth in SD/galactose (–UL) agar plates that are incubated at 37°C was
scored after 7–10 days incubation.
3.2.3.5 Library screening 40µg of pSos bait construct, 40µg of pMyr cDNA plasmid library and 200 µl of 1.4M β-
- 43 -
Materials and Methods
mercaptoethanol was added to 10ml of freshly prepared cdc25H (α) yeast competent cells. The
contents were mixed thoroughly and the contents were transferred into 20 separate
microcentrifuge tubes. Cotransformation was done as mentioned in the previous section. Cells
were resuspended in 0.5 ml of 1 M sorbitol. The entire transformation reaction in each tube was
plated on a 150-mm SD/glucose (–UL) agar plate. Plates were incubated at room temperature
(22–25°C) for 2-4 days. The transformants were replica plated onto SD/galactose (–UL) agar
plates and the plates were incubated at 37°C.
After 6 days, colonies (interactor candidates) from the experimental library screen
transformation replicates were picked on galactose incubated at 37°C. In order to repress GAL1
promoter-driven expression from the pMyr library prior to interaction tests, cells from the
interactor candidate colonies were patched onto an SD/glucose (–UL) agar plate (candidate patch
plate), and the plate incubated at 22–25°C for 48 hours. The original galactose transformation
replica plates were returned to 37°C after picking colonies, since some additional colonies
appeared much later (10 days).
After 48 hrs incubation, cells from the SD/glucose (–UL) candidate patch plates were patched
onto two fresh SD/glucose (–UL) plates and one SD/galactose (–UL) plate. As a primary test to
identify interactors among the candidates, one SD/glucose (–UL) and the SD/galactose (–UL)
plate was incubated at 37°C for approximately 48 hours. The other SD/glucose (–UL) agar plate
was kept at room temperature (22–25°C) as a re-patching source plate.
After the 48 hour incubation, the primary interaction test plates (see step 16) were
evaluated, identifying the patches growing at 37°C on SD/galactose (–UL) plates, but
not on SD/glucose (–UL) plates. A secondary interaction test was performed by re-
patching the interactor candidates from the re-patching source plate kept at 22–25°C onto
another set of one SD/glucose (–UL) and one SD/galactose (–UL) agar plate, and both plates
w e r e i n c u b a t e d at 37°C for 48 hours. The candidates producing patches that grow on
SD/galactose (–UL) plates but not on SD/glucose (–UL) plates at 37°C in both the primary and
secondary interaction tests should be considered “putative positive” clones and analysed further.
3.2.3.6 Verification of interaction by yeast co transformation Putative positive colonies were grown in SD/glucose (–UL) media, cDNA library inserted
plasmid ‘pMyr’ was isolated from this yeast culture by lysing yeast cells followed by
phenol/chloroform extraction. Top aqueous phase containing the DNA was transferred to a new
microcentrifuge tube and DNA was precipitated with 100% (v/v) ice-cold ethanol at –20°C
overnight or at –80°C for 15 minutes. Suspension was spun at 14,000 × g for 10 minutes at 4°C.
- 44 -
Materials and Methods
DNA pellet was washed with 70% (v/v) ethanol and centrifuged at 14,000 × g for 5 minutes at
room temperature and the pellet was air dried, resuspended in 40 µl of dH2O.
DNA was precipitated with 3M NaOAc (pH 5.2) and ethanol. The above mentioned washing
steps were repeated twice. DNA pellet was resuspended in 20 µl of dH2O followed by
retransformation in high-efficiency electroporation-competent E. coli cells. Transformed
colonies were selected for pMyr cDNA plasmid by plating on LB-chloramphenicol agar plates.
Colonies that contain the pMyr cDNA plasmid w e r e i d e n t i f i e d by preparing miniprep.
Isolated p l a s m i d DNA was subjected to restriction digest analysis and the cDNA insert was
identified by sequencing.
3.2.4 Expression, purification and analysis of recombinant p86DM 3.2.4.1 Expression His SUMO fused-p86DM protein p86DM was cloned into pET-SUMO expression vector and retransformed (as mentioned in
previous section) in Rosetta competent cells. Transformed cell suspension was spread on LB
agar plate and incubated at 37°C for 12-16h. Positive clone was picked and inoculated in LB
broth followed with incubation at 37°C until the absorbance showed 0.5 at OD600. Grown
culture was shifted to 27°C, expression of fusion protein was induced by adding 1mM IPTG at
27°C for 210 min. The cells were pelleted by centrifugation at 3,000 g at 4°C for 10 min,
supernatant was discarded. Cell pellet were resuspended in 3 ml ice-cold PBS buffer per 50 ml
culture and centrifuged at 3,000 g at 4°C for 10 min and the pellets were frozen at -80°C for 1 hr.
The cells were thawed on ice and re-suspend cells in 3 ml of ice-cold PBS buffer per 50 ml
culture. Cells were broken by brief pulses of sonication on ice until the sample was no longer
viscous. 10 μl aliquots sample from both soluble and insoluble fractions for SDS-PAGE analysis
were taken (by adding equal volume of 5X SDS sample loading buffer, boil for 5 min and run
SDS-PAGE to determine the amount and solubility of the fusion protein).
3.2.4.2 Purification of recombinant His SUMO fused-p86DM protein
An appropriate amount of High-Affinity His resin (50% slurry) was transferred to a disposable
column using a pipette. (Usually 1 ml of resin can bind more than 6 mg of His protein). The resin
was equilibrated with 10 bed volumes of cold lysis buffer. Clear solution (supernatant of the cells
lysed by sonication) containing fusion protein was applied to the pre equilibrated column and
with the flow rate at 5 ml/min. Column was washed with 20 bed volumes of washing buffer
containing protease inhibitors. The fusion protein was eluted with 10-15 bed volumes of freshly
- 45 -
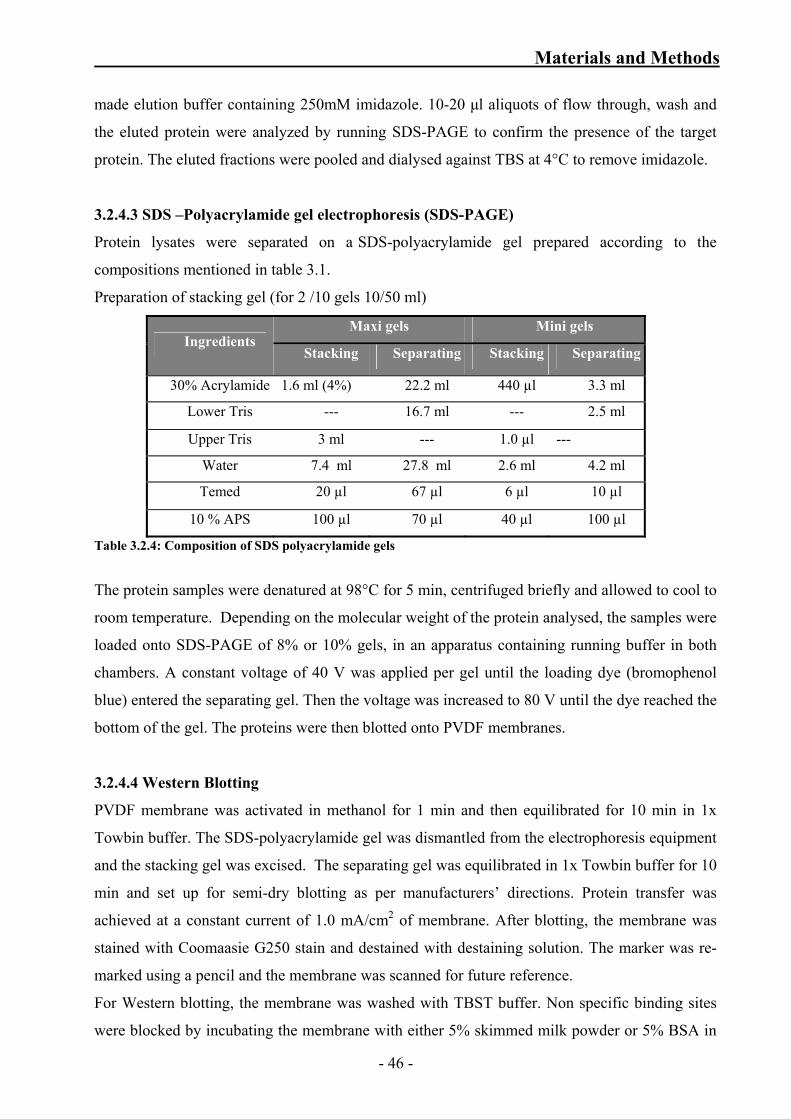
Materials and Methods
made elution buffer containing 250mM imidazole. 10-20 μl aliquots of flow through, wash and
the eluted protein were analyzed by running SDS-PAGE to confirm the presence of the target
protein. The eluted fractions were pooled and dialysed against TBS at 4°C to remove imidazole.
3.2.4.3 SDS –Polyacrylamide gel electrophoresis (SDS-PAGE)
Protein lysates were separated on a SDS-polyacrylamide gel prepared according to the
compositions mentioned in table 3.1.
Preparation of stacking gel (for 2 /10 gels 10/50 ml)
Maxi gels Mini gels Ingredients
Stacking Separating Stacking Separating
30% Acrylamide 1.6 ml (4%) 22.2 ml 440 µl 3.3 ml
Lower Tris --- 16.7 ml --- 2.5 ml
Upper Tris 3 ml --- 1.0 µl ---
Water 7.4 ml 27.8 ml 2.6 ml 4.2 ml
Temed 20 µl 67 µl 6 µl 10 µl
10 % APS 100 µl 70 µl 40 µl 100 µl
Table 3.2.4: Composition of SDS polyacrylamide gels
The protein samples were denatured at 98°C for 5 min, centrifuged briefly and allowed to cool to
room temperature. Depending on the molecular weight of the protein analysed, the samples were
loaded onto SDS-PAGE of 8% or 10% gels, in an apparatus containing running buffer in both
chambers. A constant voltage of 40 V was applied per gel until the loading dye (bromophenol
blue) entered the separating gel. Then the voltage was increased to 80 V until the dye reached the
bottom of the gel. The proteins were then blotted onto PVDF membranes.
3.2.4.4 Western Blotting
PVDF membrane was activated in methanol for 1 min and then equilibrated for 10 min in 1x
Towbin buffer. The SDS-polyacrylamide gel was dismantled from the electrophoresis equipment
and the stacking gel was excised. The separating gel was equilibrated in 1x Towbin buffer for 10
min and set up for semi-dry blotting as per manufacturers’ directions. Protein transfer was
achieved at a constant current of 1.0 mA/cm2 of membrane. After blotting, the membrane was
stained with Coomaasie G250 stain and destained with destaining solution. The marker was re-
marked using a pencil and the membrane was scanned for future reference.
For Western blotting, the membrane was washed with TBST buffer. Non specific binding sites
were blocked by incubating the membrane with either 5% skimmed milk powder or 5% BSA in
- 46 -

Materials and Methods
TBS containing 0.1% tween-20 (TBS-T) for 1h. After blocking, the membrane was incubated
with primary antibody diluted in blocking solution for 1 hour at RT or o/n at 4°C and washed
thrice with TBS-T for 5 min each at RT, to remove any unbound antibodies. The membrane was
then incubated with corresponding secondary antibody, diluted in blocking solution for 1 hour at
RT and washed thrice with TBS-T for 5 min each at RT. A final wash was carried out with 1x
TBS, pH 7.5. Bound antibodies were visualised with ECL system (Amersham Pharmacia)
according to the manufacturer’s protocol or with indigenous ECL system.
- 47 -
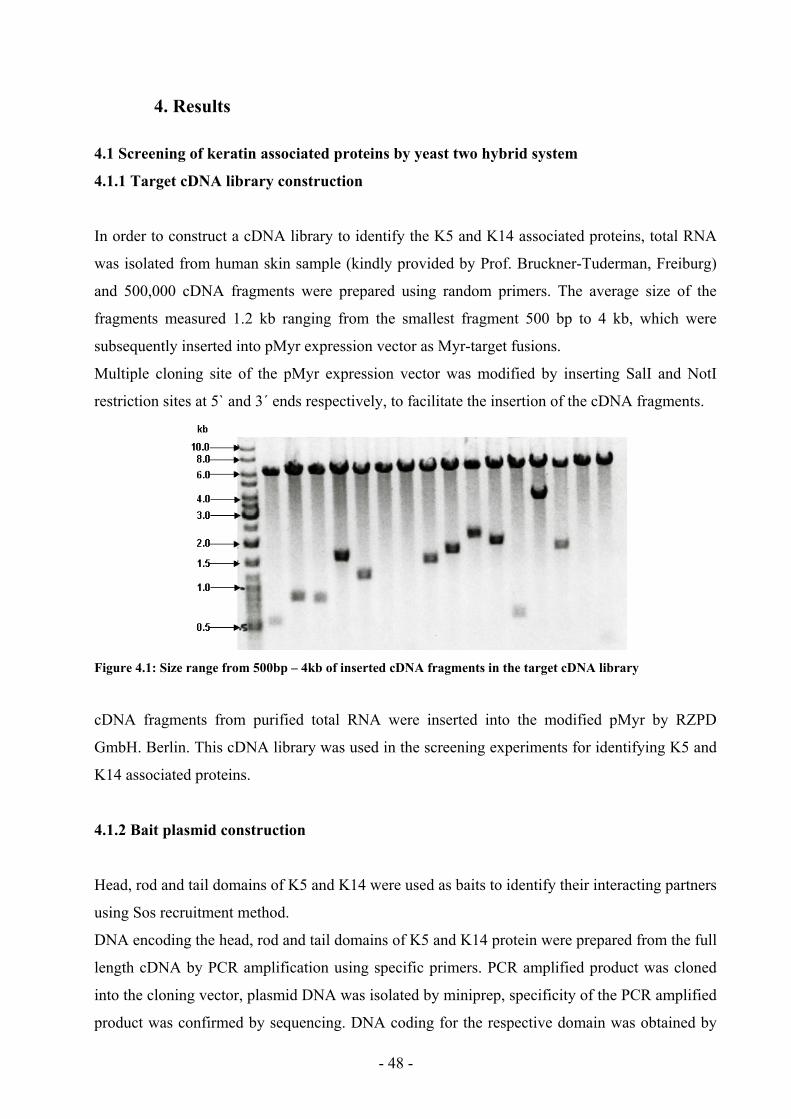
4. Results
4.1 Screening of keratin associated proteins by yeast two hybrid system
4.1.1 Target cDNA library construction
In order to construct a cDNA library to identify the K5 and K14 associated proteins, total RNA
was isolated from human skin sample (kindly provided by Prof. Bruckner-Tuderman, Freiburg)
and 500,000 cDNA fragments were prepared using random primers. The average size of the
fragments measured 1.2 kb ranging from the smallest fragment 500 bp to 4 kb, which were
subsequently inserted into pMyr expression vector as Myr-target fusions.
Multiple cloning site of the pMyr expression vector was modified by inserting SalI and NotI
restriction sites at 5` and 3´ ends respectively, to facilitate the insertion of the cDNA fragments.
Figure 4.1: Size range from 500bp – 4kb of inserted cDNA fragments in the target cDNA library
cDNA fragments from purified total RNA were inserted into the modified pMyr by RZPD
GmbH. Berlin. This cDNA library was used in the screening experiments for identifying K5 and
K14 associated proteins.
4.1.2 Bait plasmid construction
Head, rod and tail domains of K5 and K14 were used as baits to identify their interacting partners
using Sos recruitment method.
DNA encoding the head, rod and tail domains of K5 and K14 protein were prepared from the full
length cDNA by PCR amplification using specific primers. PCR amplified product was cloned
into the cloning vector, plasmid DNA was isolated by miniprep, specificity of the PCR amplified
product was confirmed by sequencing. DNA coding for the respective domain was obtained by
- 48 -
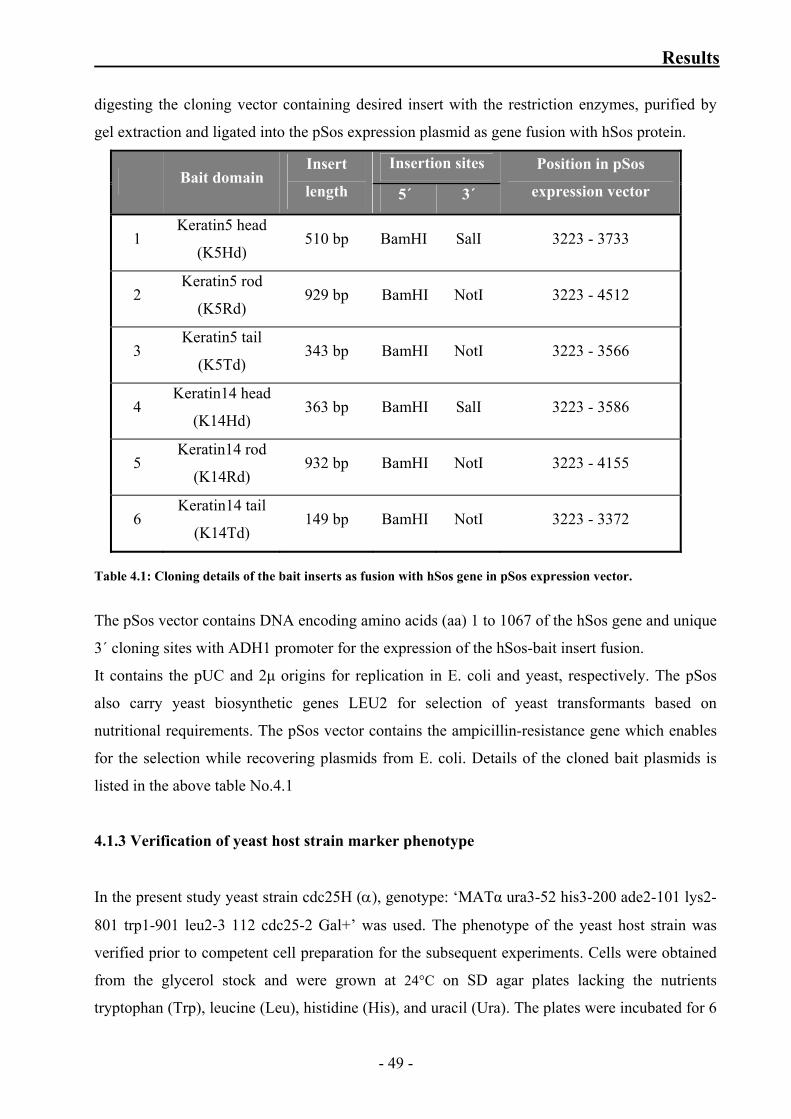
Results
digesting the cloning vector containing desired insert with the restriction enzymes, purified by
gel extraction and ligated into the pSos expression plasmid as gene fusion with hSos protein.
Insertion sites Bait domain
Insert
length 5´ 3´
Position in pSos
expression vector
1 Keratin5 head
(K5Hd) 510 bp BamHI SalI 3223 - 3733
2 Keratin5 rod
(K5Rd) 929 bp BamHI NotI 3223 - 4512
3 Keratin5 tail
(K5Td) 343 bp BamHI NotI 3223 - 3566
4 Keratin14 head
(K14Hd) 363 bp BamHI SalI 3223 - 3586
5 Keratin14 rod
(K14Rd) 932 bp BamHI NotI 3223 - 4155
6 Keratin14 tail
(K14Td) 149 bp BamHI NotI 3223 - 3372
Table 4.1: Cloning details of the bait inserts as fusion with hSos gene in pSos expression vector.
The pSos vector contains DNA encoding amino acids (aa) 1 to 1067 of the hSos gene and unique
3´ cloning sites with ADH1 promoter for the expression of the hSos-bait insert fusion.
It contains the pUC and 2μ origins for replication in E. coli and yeast, respectively. The pSos
also carry yeast biosynthetic genes LEU2 for selection of yeast transformants based on
nutritional requirements. The pSos vector contains the ampicillin-resistance gene which enables
for the selection while recovering plasmids from E. coli. Details of the cloned bait plasmids is
listed in the above table No.4.1
4.1.3 Verification of yeast host strain marker phenotype
In the present study yeast strain cdc25H (α), genotype: ‘MATα ura3-52 his3-200 ade2-101 lys2-
801 trp1-901 leu2-3 112 cdc25-2 Gal+’ was used. The phenotype of the yeast host strain was
verified prior to competent cell preparation for the subsequent experiments. Cells were obtained
from the glycerol stock and were grown at 24°C on SD agar plates lacking the nutrients
tryptophan (Trp), leucine (Leu), histidine (His), and uracil (Ura). The plates were incubated for 6
- 49 -
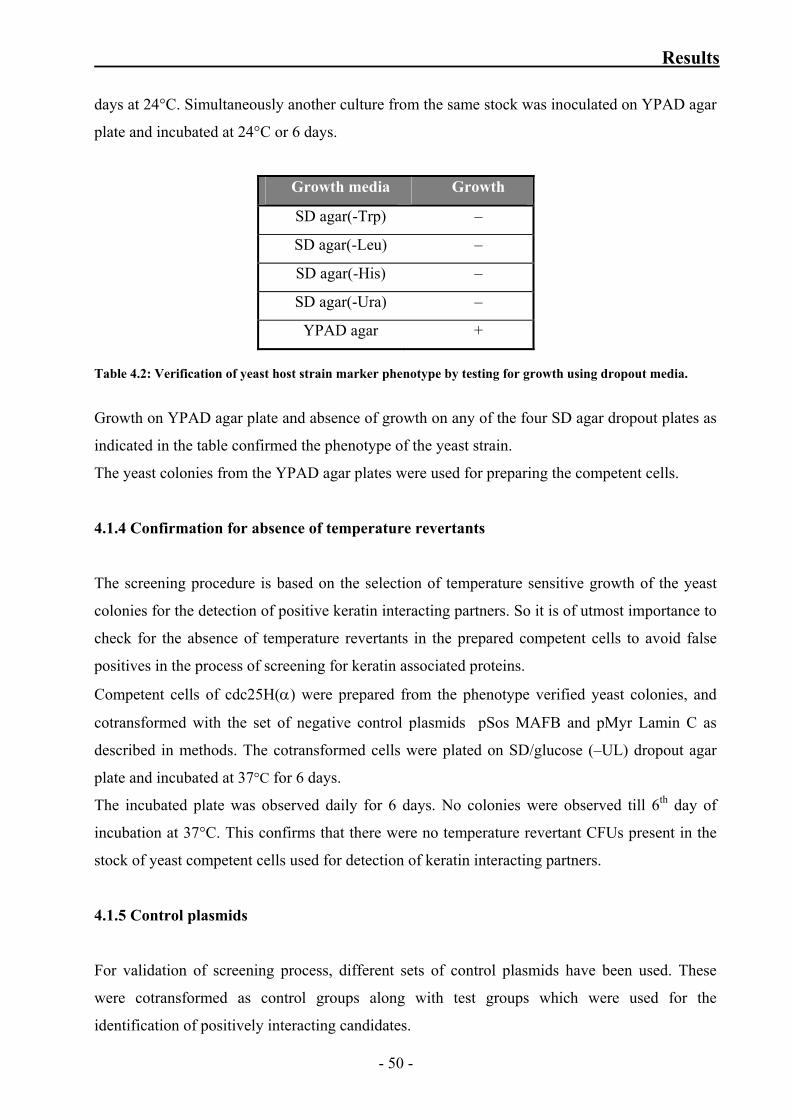
Results
days at 24°C. Simultaneously another culture from the same stock was inoculated on YPAD agar
plate and incubated at 24°C or 6 days.
Growth media Growth
SD agar(-Trp) –
SD agar(-Leu) –
SD agar(-His) –
SD agar(-Ura) –
YPAD agar +
Table 4.2: Verification of yeast host strain marker phenotype by testing for growth using dropout media.
Growth on YPAD agar plate and absence of growth on any of the four SD agar dropout plates as
indicated in the table confirmed the phenotype of the yeast strain.
The yeast colonies from the YPAD agar plates were used for preparing the competent cells.
4.1.4 Confirmation for absence of temperature revertants
The screening procedure is based on the selection of temperature sensitive growth of the yeast
colonies for the detection of positive keratin interacting partners. So it is of utmost importance to
check for the absence of temperature revertants in the prepared competent cells to avoid false
positives in the process of screening for keratin associated proteins.
Competent cells of cdc25H(α) were prepared from the phenotype verified yeast colonies, and
cotransformed with the set of negative control plasmids pSos MAFB and pMyr Lamin C as
described in methods. The cotransformed cells were plated on SD/glucose (–UL) dropout agar
plate and incubated at 37°C for 6 days.
The incubated plate was observed daily for 6 days. No colonies were observed till 6th day of
incubation at 37°C. This confirms that there were no temperature revertant CFUs present in the
stock of yeast competent cells used for detection of keratin interacting partners.
4.1.5 Control plasmids
For validation of screening process, different sets of control plasmids have been used. These
were cotransformed as control groups along with test groups which were used for the
identification of positively interacting candidates.
- 50 -
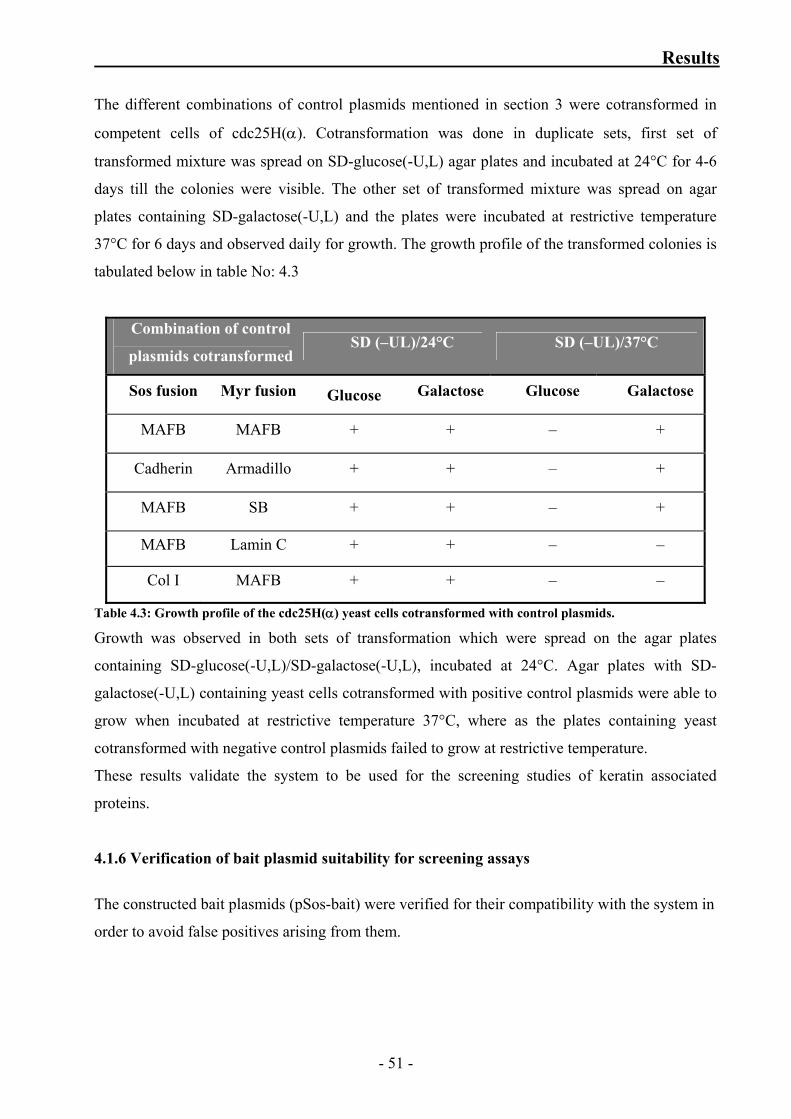
Results
The different combinations of control plasmids mentioned in section 3 were cotransformed in
competent cells of cdc25H(α). Cotransformation was done in duplicate sets, first set of
transformed mixture was spread on SD-glucose(-U,L) agar plates and incubated at 24°C for 4-6
days till the colonies were visible. The other set of transformed mixture was spread on agar
plates containing SD-galactose(-U,L) and the plates were incubated at restrictive temperature
37°C for 6 days and observed daily for growth. The growth profile of the transformed colonies is
tabulated below in table No: 4.3
Combination of control
plasmids cotransformed SD (–UL)/24°C SD (–UL)/37°C
Sos fusion Myr fusion Glucose Galactose Glucose Galactose
MAFB MAFB + + – +
Cadherin Armadillo + + – +
MAFB SB + + – +
MAFB Lamin C + + – –
Col I MAFB + + – –
Table 4.3: Growth profile of the cdc25H(α) yeast cells cotransformed with control plasmids.
Growth was observed in both sets of transformation which were spread on the agar plates
containing SD-glucose(-U,L)/SD-galactose(-U,L), incubated at 24°C. Agar plates with SD-
galactose(-U,L) containing yeast cells cotransformed with positive control plasmids were able to
grow when incubated at restrictive temperature 37°C, where as the plates containing yeast
cotransformed with negative control plasmids failed to grow at restrictive temperature.
These results validate the system to be used for the screening studies of keratin associated
proteins.
4.1.6 Verification of bait plasmid suitability for screening assays
The constructed bait plasmids (pSos-bait) were verified for their compatibility with the system in
order to avoid false positives arising from them.
- 51 -
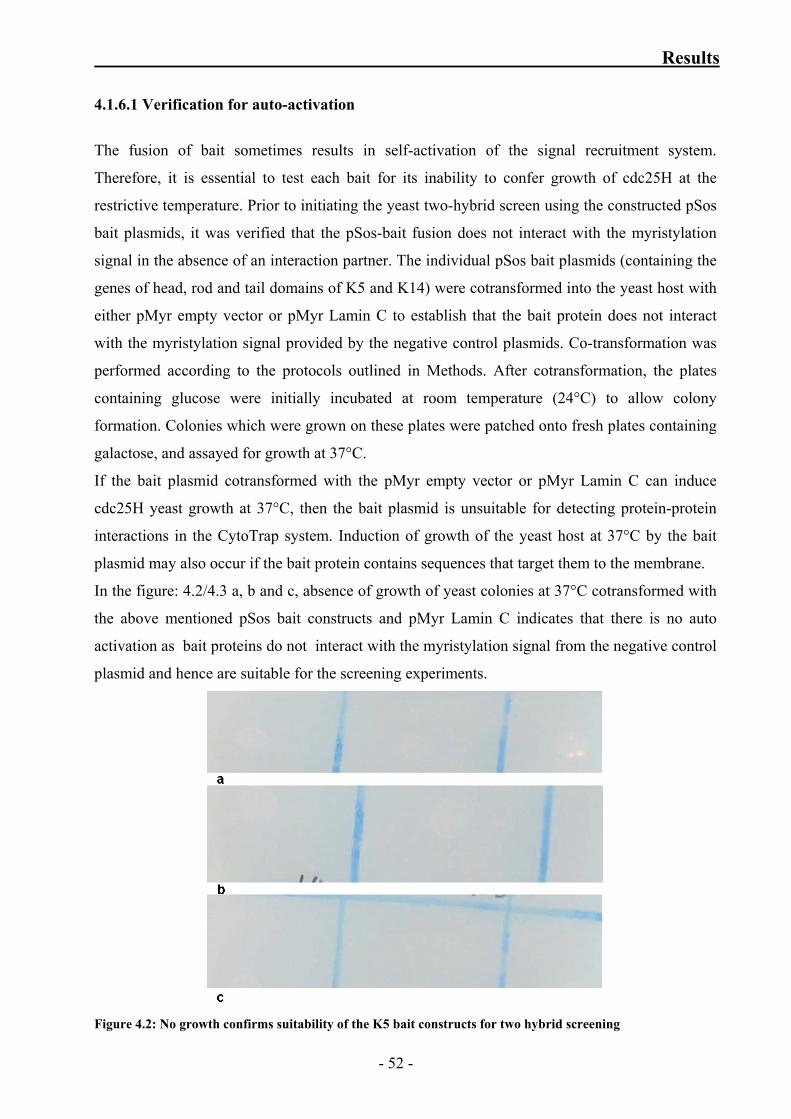
Results
4.1.6.1 Verification for auto-activation
The fusion of bait sometimes results in self-activation of the signal recruitment system.
Therefore, it is essential to test each bait for its inability to confer growth of cdc25H at the
restrictive temperature. Prior to initiating the yeast two-hybrid screen using the constructed pSos
bait plasmids, it was verified that the pSos-bait fusion does not interact with the myristylation
signal in the absence of an interaction partner. The individual pSos bait plasmids (containing the
genes of head, rod and tail domains of K5 and K14) were cotransformed into the yeast host with
either pMyr empty vector or pMyr Lamin C to establish that the bait protein does not interact
with the myristylation signal provided by the negative control plasmids. Co-transformation was
performed according to the protocols outlined in Methods. After cotransformation, the plates
containing glucose were initially incubated at room temperature (24°C) to allow colony
formation. Colonies which were grown on these plates were patched onto fresh plates containing
galactose, and assayed for growth at 37°C.
If the bait plasmid cotransformed with the pMyr empty vector or pMyr Lamin C can induce
cdc25H yeast growth at 37°C, then the bait plasmid is unsuitable for detecting protein-protein
interactions in the CytoTrap system. Induction of growth of the yeast host at 37°C by the bait
plasmid may also occur if the bait protein contains sequences that target them to the membrane.
In the figure: 4.2/4.3 a, b and c, absence of growth of yeast colonies at 37°C cotransformed with
the above mentioned pSos bait constructs and pMyr Lamin C indicates that there is no auto
activation as bait proteins do not interact with the myristylation signal from the negative control
plasmid and hence are suitable for the screening experiments.
Figure 4.2: No growth confirms suitability of the K5 bait constructs for two hybrid screening
- 52 -
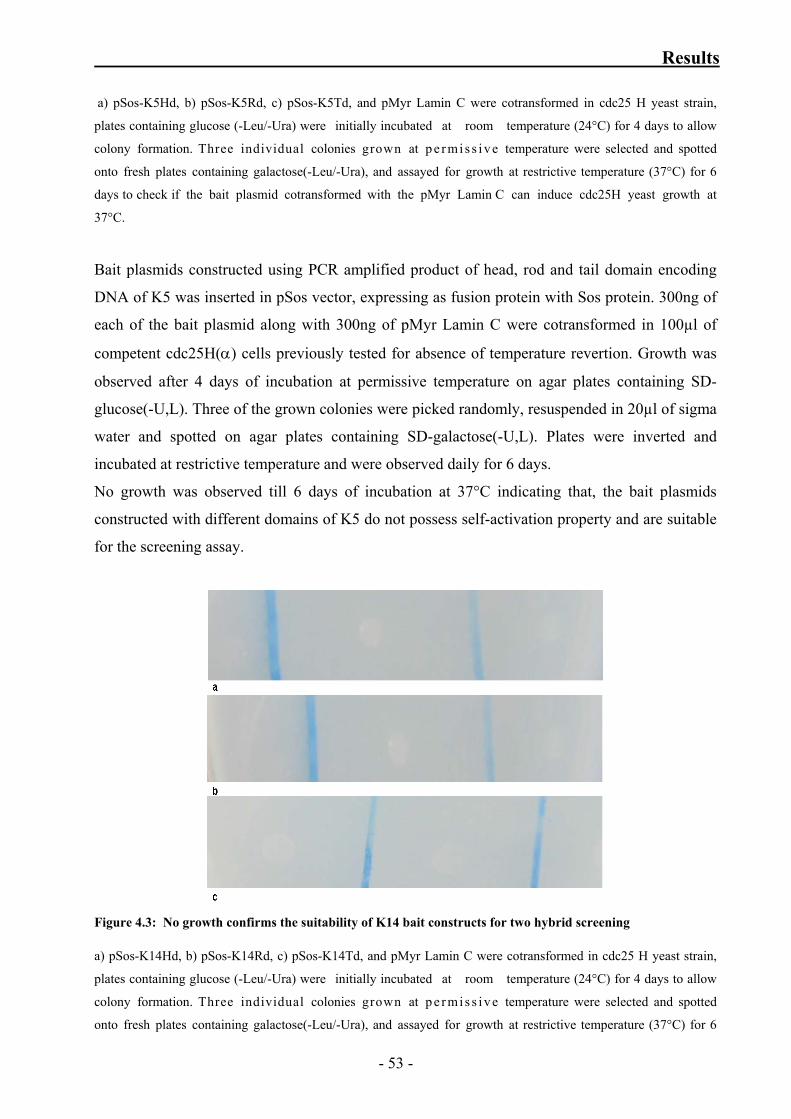
Results
a) pSos-K5Hd, b) pSos-K5Rd, c) pSos-K5Td, and pMyr Lamin C were cotransformed in cdc25 H yeast strain,
plates containing glucose (-Leu/-Ura) were initially incubated at room temperature (24°C) for 4 days to allow
colony formation. Three individual colonies grown at p e r mi s s ive temperature were selected and spotted
onto fresh plates containing galactose(-Leu/-Ura), and assayed for growth at restrictive temperature (37°C) for 6
days to check if the bait plasmid cotransformed with the pMyr Lamin C can induce cdc25H yeast growth at
37°C.
Bait plasmids constructed using PCR amplified product of head, rod and tail domain encoding
DNA of K5 was inserted in pSos vector, expressing as fusion protein with Sos protein. 300ng of
each of the bait plasmid along with 300ng of pMyr Lamin C were cotransformed in 100µl of
competent cdc25H(α) cells previously tested for absence of temperature revertion. Growth was
observed after 4 days of incubation at permissive temperature on agar plates containing SD-
glucose(-U,L). Three of the grown colonies were picked randomly, resuspended in 20µl of sigma
water and spotted on agar plates containing SD-galactose(-U,L). Plates were inverted and
incubated at restrictive temperature and were observed daily for 6 days.
No growth was observed till 6 days of incubation at 37°C indicating that, the bait plasmids
constructed with different domains of K5 do not possess self-activation property and are suitable
for the screening assay.
Figure 4.3: No growth confirms the suitability of K14 bait constructs for two hybrid screening a) pSos-K14Hd, b) pSos-K14Rd, c) pSos-K14Td, and pMyr Lamin C were cotransformed in cdc25 H yeast strain,
plates containing glucose (-Leu/-Ura) were initially incubated at room temperature (24°C) for 4 days to allow
colony formation. Three individual colonies grown at p e r mi s s ive temperature were selected and spotted
onto fresh plates containing galactose(-Leu/-Ura), and assayed for growth at restrictive temperature (37°C) for 6
- 53 -
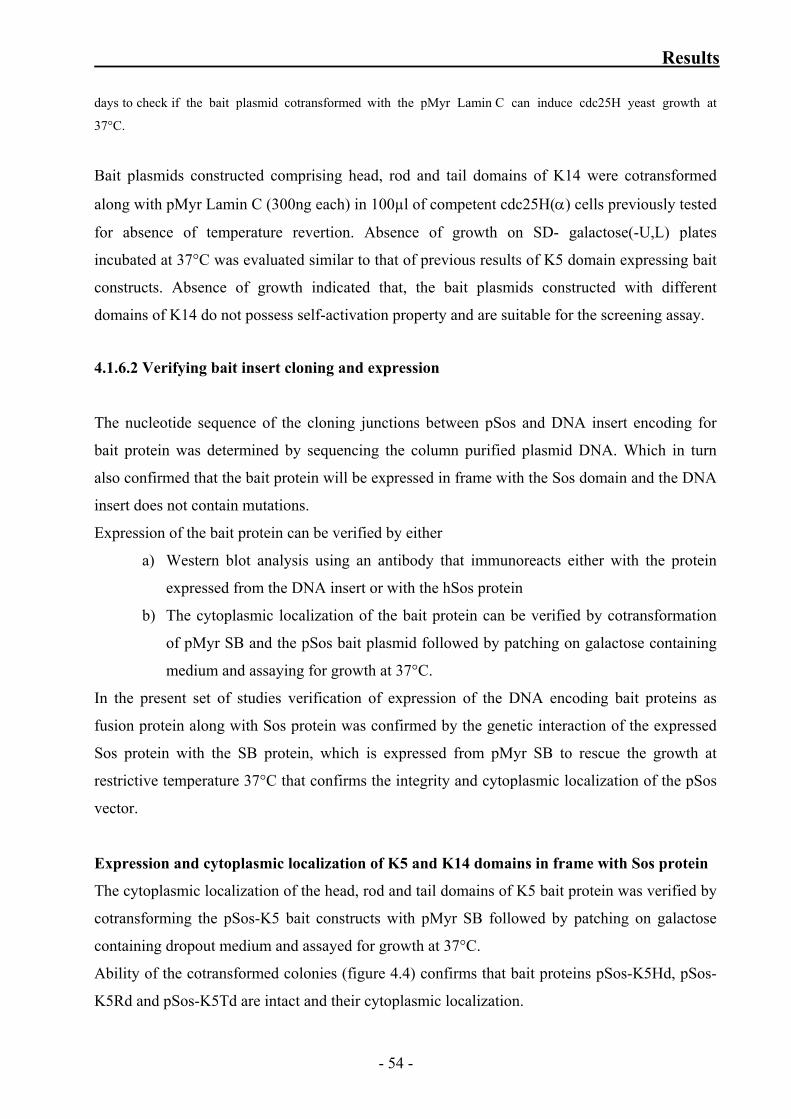
Results
days to check if the bait plasmid cotransformed with the pMyr Lamin C can induce cdc25H yeast growth at
37°C.
Bait plasmids constructed comprising head, rod and tail domains of K14 were cotransformed
along with pMyr Lamin C (300ng each) in 100µl of competent cdc25H(α) cells previously tested
for absence of temperature revertion. Absence of growth on SD- galactose(-U,L) plates
incubated at 37°C was evaluated similar to that of previous results of K5 domain expressing bait
constructs. Absence of growth indicated that, the bait plasmids constructed with different
domains of K14 do not possess self-activation property and are suitable for the screening assay.
4.1.6.2 Verifying bait insert cloning and expression
The nucleotide sequence of the cloning junctions between pSos and DNA insert encoding for
bait protein was determined by sequencing the column purified plasmid DNA. Which in turn
also confirmed that the bait protein will be expressed in frame with the Sos domain and the DNA
insert does not contain mutations.
Expression of the bait protein can be verified by either
a) Western blot analysis using an antibody that immunoreacts either with the protein
expressed from the DNA insert or with the hSos protein
b) The cytoplasmic localization of the bait protein can be verified by cotransformation
of pMyr SB and the pSos bait plasmid followed by patching on galactose containing
medium and assaying for growth at 37°C.
In the present set of studies verification of expression of the DNA encoding bait proteins as
fusion protein along with Sos protein was confirmed by the genetic interaction of the expressed
Sos protein with the SB protein, which is expressed from pMyr SB to rescue the growth at
restrictive temperature 37°C that confirms the integrity and cytoplasmic localization of the pSos
vector.
Expression and cytoplasmic localization of K5 and K14 domains in frame with Sos protein
The cytoplasmic localization of the head, rod and tail domains of K5 bait protein was verified by
cotransforming the pSos-K5 bait constructs with pMyr SB followed by patching on galactose
containing dropout medium and assayed for growth at 37°C.
Ability of the cotransformed colonies (figure 4.4) confirms that bait proteins pSos-K5Hd, pSos-
K5Rd and pSos-K5Td are intact and their cytoplasmic localization.
- 54 -
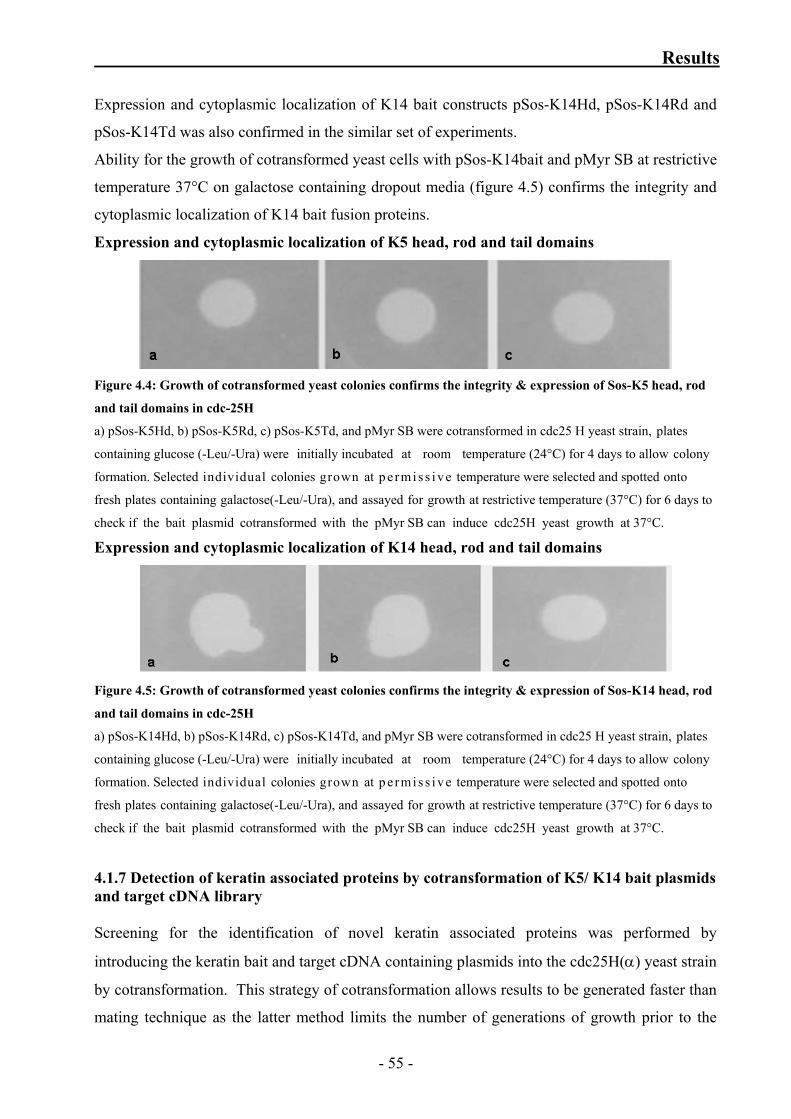
Results
Expression and cytoplasmic localization of K14 bait constructs pSos-K14Hd, pSos-K14Rd and
pSos-K14Td was also confirmed in the similar set of experiments.
Ability for the growth of cotransformed yeast cells with pSos-K14bait and pMyr SB at restrictive
temperature 37°C on galactose containing dropout media (figure 4.5) confirms the integrity and
cytoplasmic localization of K14 bait fusion proteins.
Expression and cytoplasmic localization of K5 head, rod and tail domains
Figure 4.4: Growth of cotransformed yeast colonies confirms the integrity & expression of Sos-K5 head, rod
and tail domains in cdc-25H
a) pSos-K5Hd, b) pSos-K5Rd, c) pSos-K5Td, and pMyr SB were cotransformed in cdc25 H yeast strain, plates
containing glucose (-Leu/-Ura) were initially incubated at room temperature (24°C) for 4 days to allow colony
formation. Selected individual colonies grown at p e rmi s s iv e temperature were selected and spotted onto
fresh plates containing galactose(-Leu/-Ura), and assayed for growth at restrictive temperature (37°C) for 6 days to
check if the bait plasmid cotransformed with the pMyr SB can induce cdc25H yeast growth at 37°C.
Expression and cytoplasmic localization of K14 head, rod and tail domains
Figure 4.5: Growth of cotransformed yeast colonies confirms the integrity & expression of Sos-K14 head, rod
and tail domains in cdc-25H
a) pSos-K14Hd, b) pSos-K14Rd, c) pSos-K14Td, and pMyr SB were cotransformed in cdc25 H yeast strain, plates
containing glucose (-Leu/-Ura) were initially incubated at room temperature (24°C) for 4 days to allow colony
formation. Selected individual colonies grown at p e rmi s s iv e temperature were selected and spotted onto
fresh plates containing galactose(-Leu/-Ura), and assayed for growth at restrictive temperature (37°C) for 6 days to
check if the bait plasmid cotransformed with the pMyr SB can induce cdc25H yeast growth at 37°C.
4.1.7 Detection of keratin associated proteins by cotransformation of K5/ K14 bait plasmids and target cDNA library Screening for the identification of novel keratin associated proteins was performed by
introducing the keratin bait and target cDNA containing plasmids into the cdc25H(α) yeast strain
by cotransformation. This strategy of cotransformation allows results to be generated faster than
mating technique as the latter method limits the number of generations of growth prior to the
- 55 -
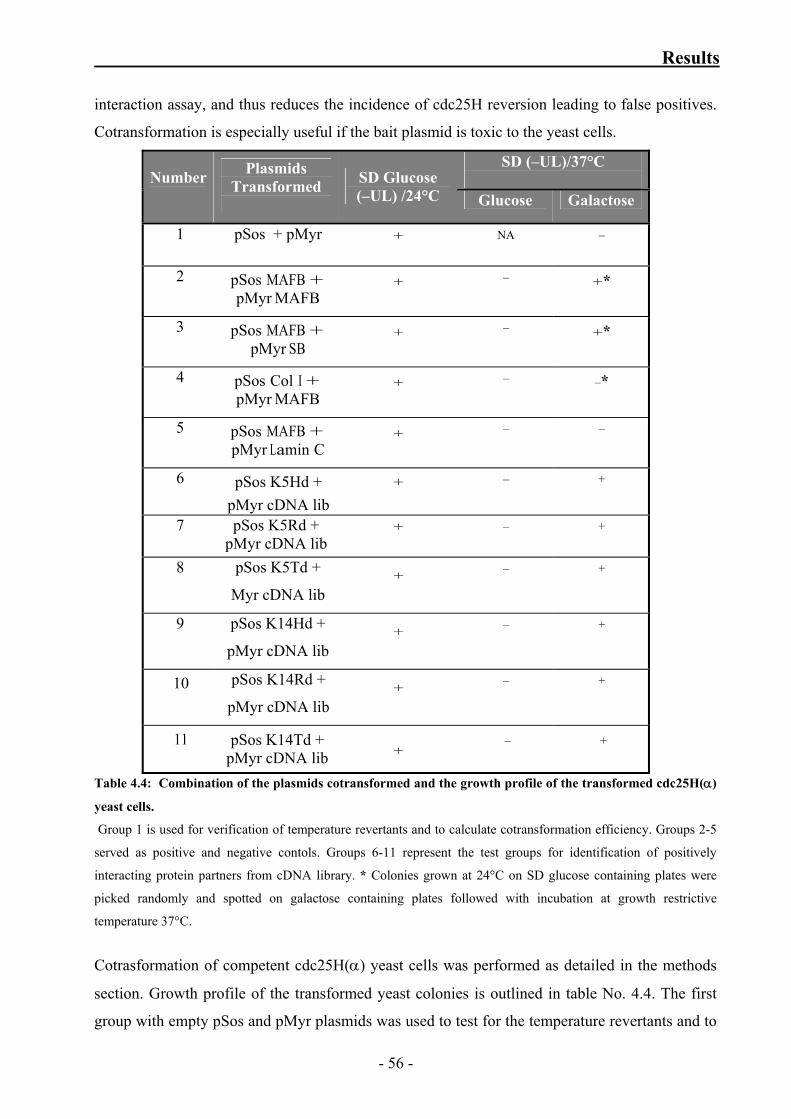
Results
interaction assay, and thus reduces the incidence of cdc25H reversion leading to false positives.
Cotransformation is especially useful if the bait plasmid is toxic to the yeast cells.
SD (–UL)/37°C Number
Plasmids Transformed
SD Glucose (–UL) /24°C Glucose Galactose
1 pSos + pMyr +
NA
–
2 pSos MAFB +
pMyr MAFB +
–
+*
3 pSos MAFB +
pMyr SB +
–
+*
4 pSos Col I +
pMyr MAFB +
–
–*
5 pSos MAFB +
pMyr Lamin C +
–
–
6 pSos K5Hd + pMyr cDNA lib
+
–
+
7 pSos K5Rd +
pMyr cDNA lib +
–
+
8 pSos K5Td +
Myr cDNA lib +
–
+
9 pSos K14Hd +
pMyr cDNA lib +
–
+
10 pSos K14Rd +
pMyr cDNA lib +
–
+
11 pSos K14Td + pMyr cDNA lib
+ – +
Table 4.4: Combination of the plasmids cotransformed and the growth profile of the transformed cdc25H(α)
yeast cells.
Group 1 is used for verification of temperature revertants and to calculate cotransformation efficiency. Groups 2-5
served as positive and negative contols. Groups 6-11 represent the test groups for identification of positively
interacting protein partners from cDNA library. * Colonies grown at 24°C on SD glucose containing plates were
picked randomly and spotted on galactose containing plates followed with incubation at growth restrictive
temperature 37°C.
Cotrasformation of competent cdc25H(α) yeast cells was performed as detailed in the methods
section. Growth profile of the transformed yeast colonies is outlined in table No. 4.4. The first
group with empty pSos and pMyr plasmids was used to test for the temperature revertants and to
- 56 -
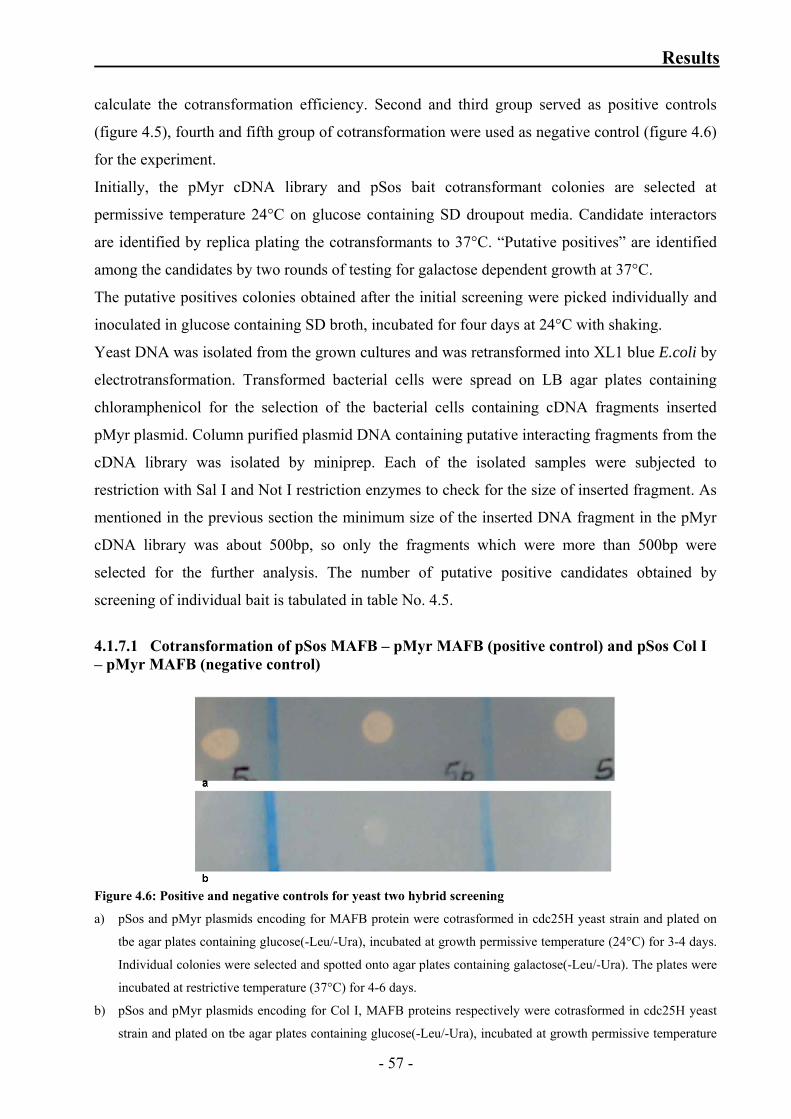
Results
calculate the cotransformation efficiency. Second and third group served as positive controls
(figure 4.5), fourth and fifth group of cotransformation were used as negative control (figure 4.6)
for the experiment.
Initially, the pMyr cDNA library and pSos bait cotransformant colonies are selected at
permissive temperature 24°C on glucose containing SD droupout media. Candidate interactors
are identified by replica plating the cotransformants to 37°C. “Putative positives” are identified
among the candidates by two rounds of testing for galactose dependent growth at 37°C.
The putative positives colonies obtained after the initial screening were picked individually and
inoculated in glucose containing SD broth, incubated for four days at 24°C with shaking.
Yeast DNA was isolated from the grown cultures and was retransformed into XL1 blue E.coli by
electrotransformation. Transformed bacterial cells were spread on LB agar plates containing
chloramphenicol for the selection of the bacterial cells containing cDNA fragments inserted
pMyr plasmid. Column purified plasmid DNA containing putative interacting fragments from the
cDNA library was isolated by miniprep. Each of the isolated samples were subjected to
restriction with Sal I and Not I restriction enzymes to check for the size of inserted fragment. As
mentioned in the previous section the minimum size of the inserted DNA fragment in the pMyr
cDNA library was about 500bp, so only the fragments which were more than 500bp were
selected for the further analysis. The number of putative positive candidates obtained by
screening of individual bait is tabulated in table No. 4.5.
4.1.7.1 Cotransformation of pSos MAFB – pMyr MAFB (positive control) and pSos Col I – pMyr MAFB (negative control)
Figure 4.6: Positive and negative controls for yeast two hybrid screening
a) pSos and pMyr plasmids encoding for MAFB protein were cotrasformed in cdc25H yeast strain and plated on
tbe agar plates containing glucose(-Leu/-Ura), incubated at growth permissive temperature (24°C) for 3-4 days.
Individual colonies were selected and spotted onto agar plates containing galactose(-Leu/-Ura). The plates were
incubated at restrictive temperature (37°C) for 4-6 days.
b) pSos and pMyr plasmids encoding for Col I, MAFB proteins respectively were cotrasformed in cdc25H yeast
strain and plated on tbe agar plates containing glucose(-Leu/-Ura), incubated at growth permissive temperature
- 57 -
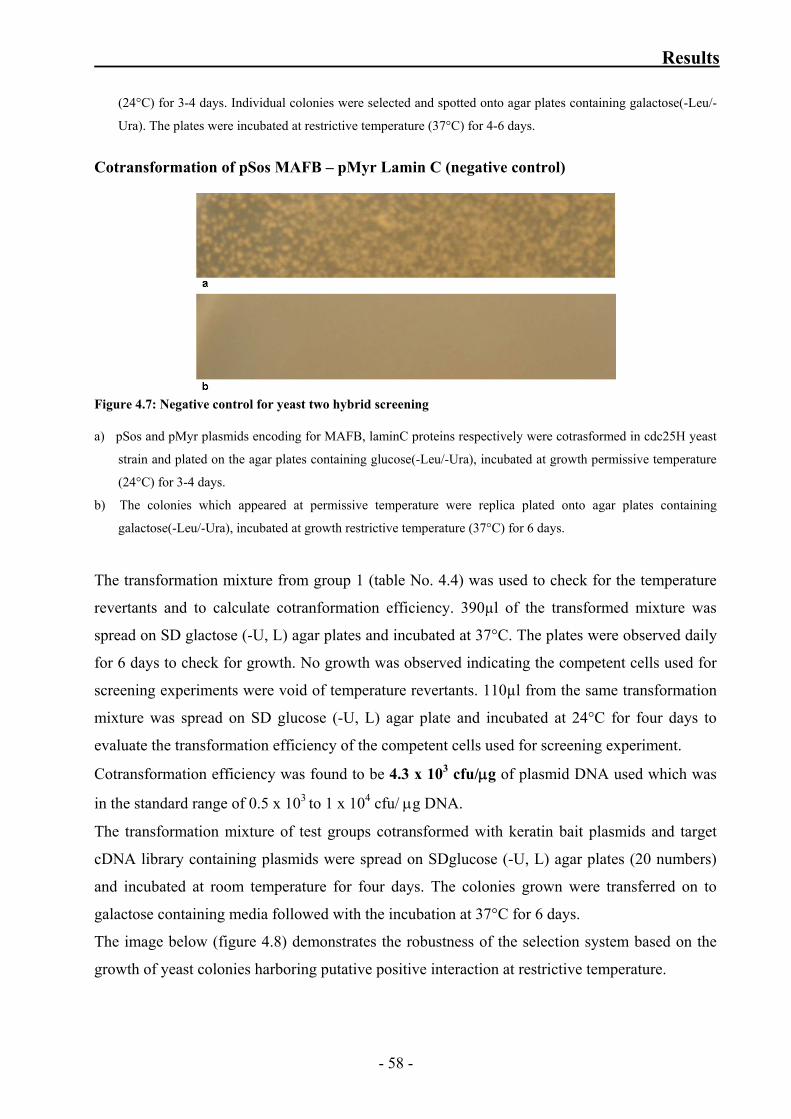
Results
(24°C) for 3-4 days. Individual colonies were selected and spotted onto agar plates containing galactose(-Leu/-
Ura). The plates were incubated at restrictive temperature (37°C) for 4-6 days.
Cotransformation of pSos MAFB – pMyr Lamin C (negative control)
Figure 4.7: Negative control for yeast two hybrid screening a) pSos and pMyr plasmids encoding for MAFB, laminC proteins respectively were cotrasformed in cdc25H yeast
strain and plated on the agar plates containing glucose(-Leu/-Ura), incubated at growth permissive temperature
(24°C) for 3-4 days.
b) The colonies which appeared at permissive temperature were replica plated onto agar plates containing
galactose(-Leu/-Ura), incubated at growth restrictive temperature (37°C) for 6 days.
The transformation mixture from group 1 (table No. 4.4) was used to check for the temperature
revertants and to calculate cotranformation efficiency. 390µl of the transformed mixture was
spread on SD glactose (-U, L) agar plates and incubated at 37°C. The plates were observed daily
for 6 days to check for growth. No growth was observed indicating the competent cells used for
screening experiments were void of temperature revertants. 110µl from the same transformation
mixture was spread on SD glucose (-U, L) agar plate and incubated at 24°C for four days to
evaluate the transformation efficiency of the competent cells used for screening experiment.
Cotransformation efficiency was found to be 4.3 x 10³ cfu/μg of plasmid DNA used which was
in the standard range of 0.5 x 10³ to 1 x 10⁴ cfu/ μg DNA.
The transformation mixture of test groups cotransformed with keratin bait plasmids and target
cDNA library containing plasmids were spread on SDglucose (-U, L) agar plates (20 numbers)
and incubated at room temperature for four days. The colonies grown were transferred on to
galactose containing media followed with the incubation at 37°C for 6 days.
The image below (figure 4.8) demonstrates the robustness of the selection system based on the
growth of yeast colonies harboring putative positive interaction at restrictive temperature.
- 58 -
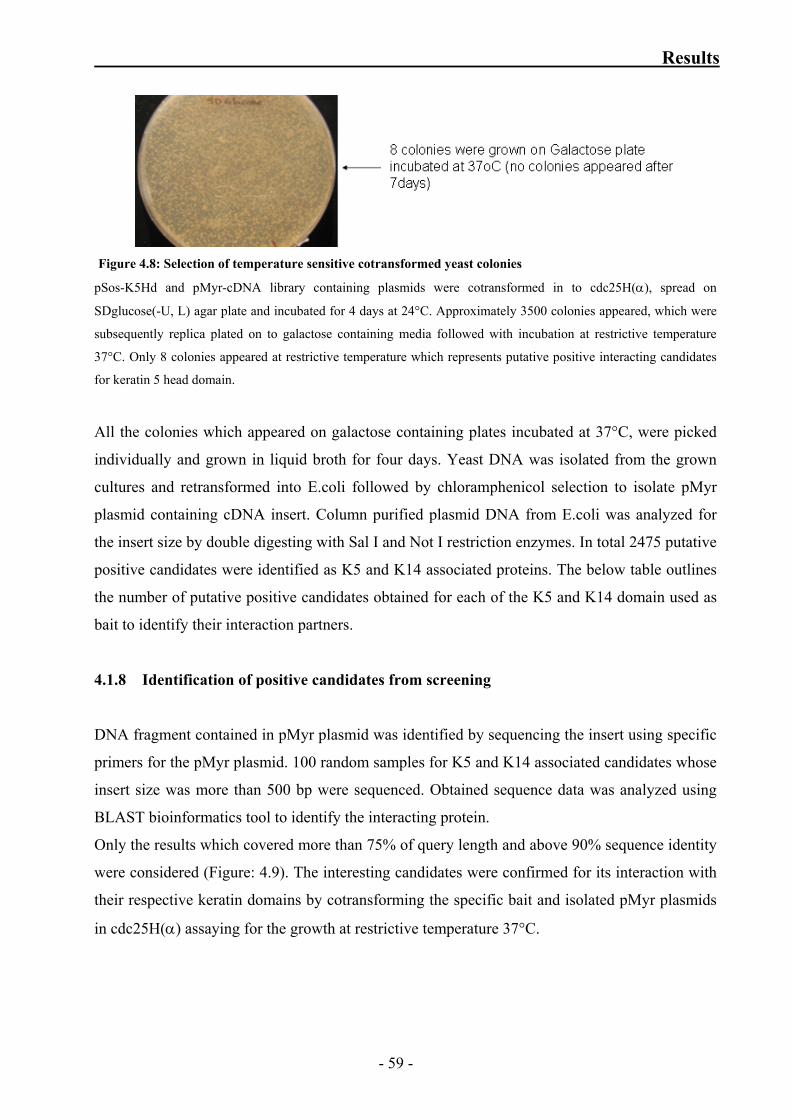
Results
Figure 4.8: Selection of temperature sensitive cotransformed yeast colonies
pSos-K5Hd and pMyr-cDNA library containing plasmids were cotransformed in to cdc25H(α), spread on
SDglucose(-U, L) agar plate and incubated for 4 days at 24°C. Approximately 3500 colonies appeared, which were
subsequently replica plated on to galactose containing media followed with incubation at restrictive temperature
37°C. Only 8 colonies appeared at restrictive temperature which represents putative positive interacting candidates
for keratin 5 head domain.
All the colonies which appeared on galactose containing plates incubated at 37°C, were picked
individually and grown in liquid broth for four days. Yeast DNA was isolated from the grown
cultures and retransformed into E.coli followed by chloramphenicol selection to isolate pMyr
plasmid containing cDNA insert. Column purified plasmid DNA from E.coli was analyzed for
the insert size by double digesting with Sal I and Not I restriction enzymes. In total 2475 putative
positive candidates were identified as K5 and K14 associated proteins. The below table outlines
the number of putative positive candidates obtained for each of the K5 and K14 domain used as
bait to identify their interaction partners.
4.1.8 Identification of positive candidates from screening
DNA fragment contained in pMyr plasmid was identified by sequencing the insert using specific
primers for the pMyr plasmid. 100 random samples for K5 and K14 associated candidates whose
insert size was more than 500 bp were sequenced. Obtained sequence data was analyzed using
BLAST bioinformatics tool to identify the interacting protein.
Only the results which covered more than 75% of query length and above 90% sequence identity
were considered (Figure: 4.9). The interesting candidates were confirmed for its interaction with
their respective keratin domains by cotransforming the specific bait and isolated pMyr plasmids
in cdc25H(α) assaying for the growth at restrictive temperature 37°C.
- 59 -
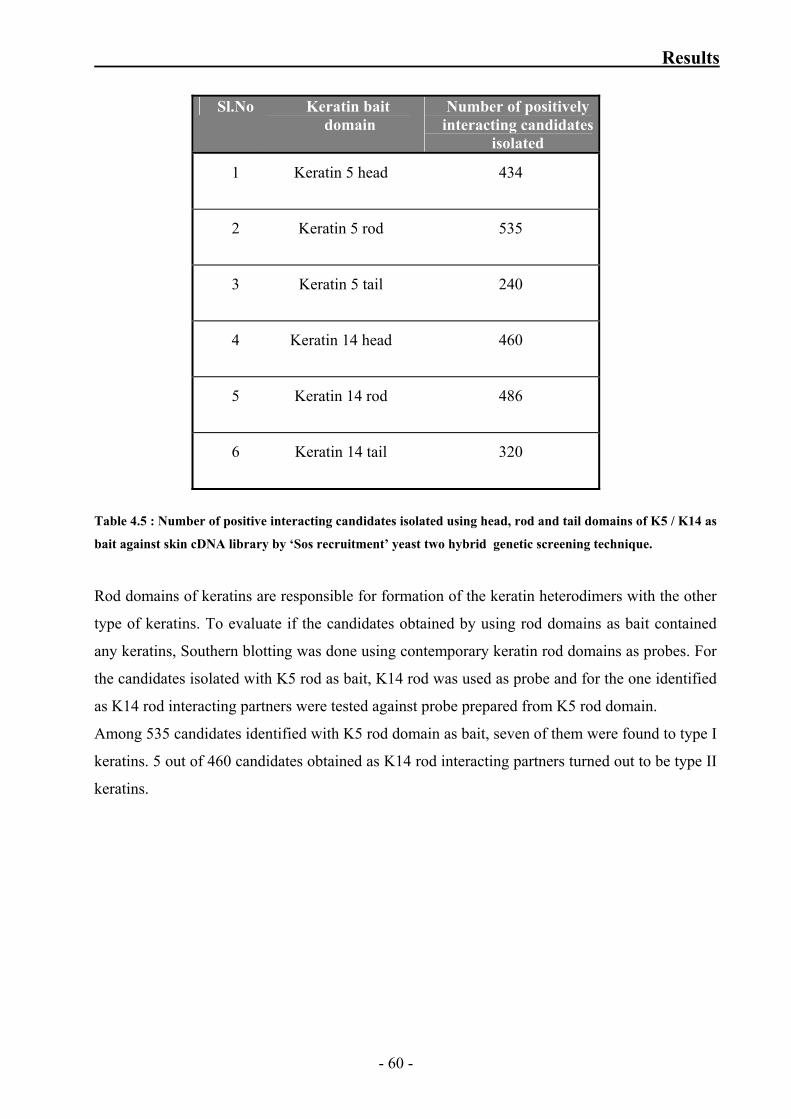
Results
Sl.No Keratin bait domain
Number of positively interacting candidates
isolated
1 Keratin 5 head 434
2 Keratin 5 rod 535
3 Keratin 5 tail 240
4 Keratin 14 head 460
5 Keratin 14 rod 486
6 Keratin 14 tail 320
Table 4.5 : Number of positive interacting candidates isolated using head, rod and tail domains of K5 / K14 as
bait against skin cDNA library by ‘Sos recruitment’ yeast two hybrid genetic screening technique.
Rod domains of keratins are responsible for formation of the keratin heterodimers with the other
type of keratins. To evaluate if the candidates obtained by using rod domains as bait contained
any keratins, Southern blotting was done using contemporary keratin rod domains as probes. For
the candidates isolated with K5 rod as bait, K14 rod was used as probe and for the one identified
as K14 rod interacting partners were tested against probe prepared from K5 rod domain.
Among 535 candidates identified with K5 rod domain as bait, seven of them were found to type I
keratins. 5 out of 460 candidates obtained as K14 rod interacting partners turned out to be type II
keratins.
- 60 -
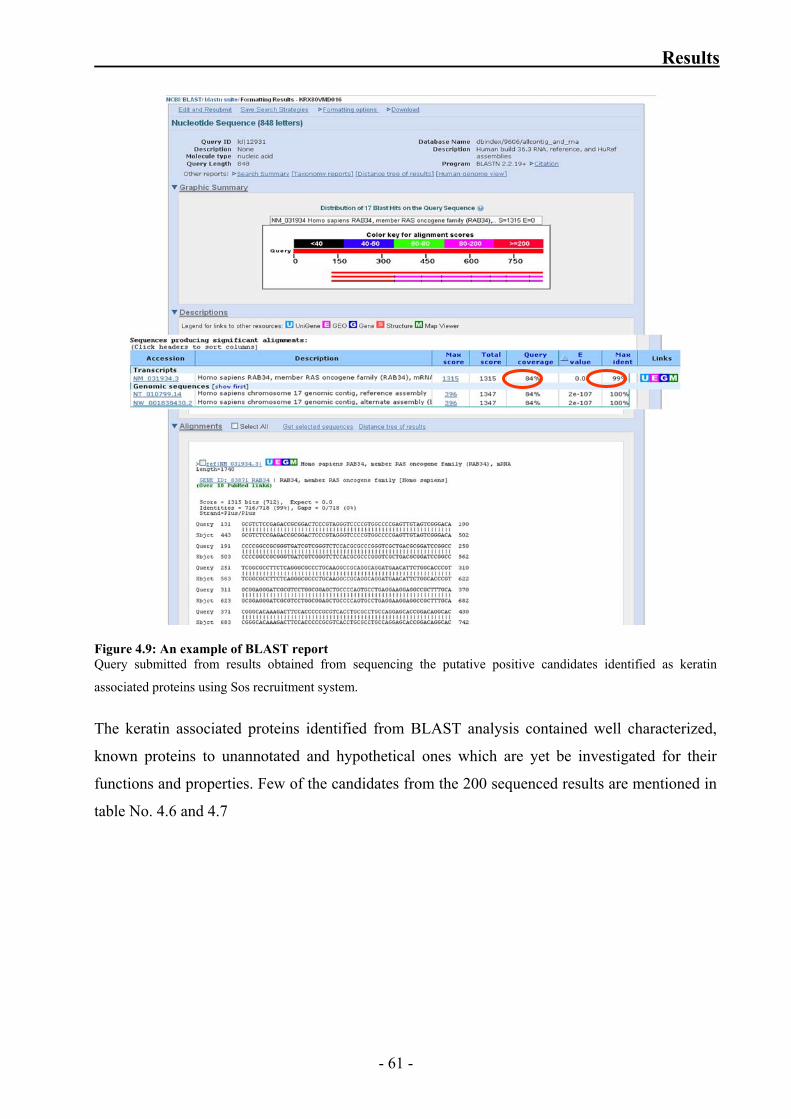
Results
Figure 4.9: An example of BLAST report Query submitted from results obtained from sequencing the putative positive candidates identified as keratin
associated proteins using Sos recruitment system.
The keratin associated proteins identified from BLAST analysis contained well characterized,
known proteins to unannotated and hypothetical ones which are yet be investigated for their
functions and properties. Few of the candidates from the 200 sequenced results are mentioned in
table No. 4.6 and 4.7
- 61 -
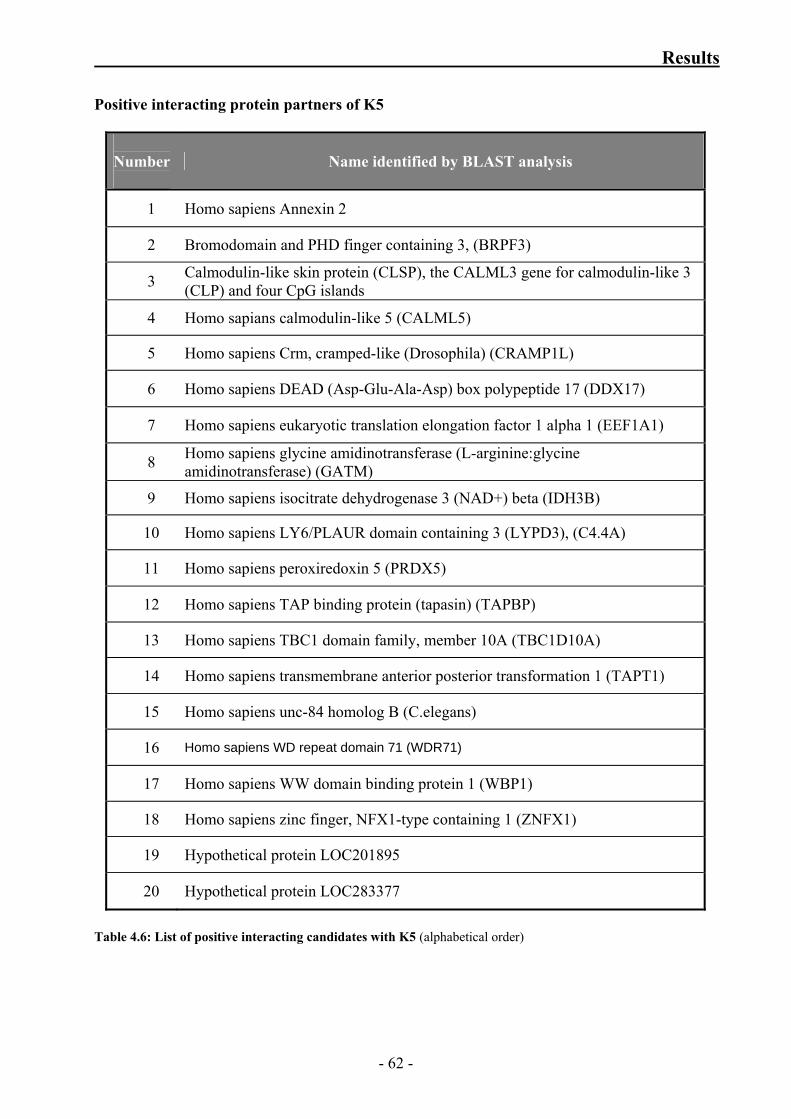
Results
Positive interacting protein partners of K5
Number
Name identified by BLAST analysis
1 Homo sapiens Annexin 2
2 Bromodomain and PHD finger containing 3, (BRPF3)
3 Calmodulin-like skin protein (CLSP), the CALML3 gene for calmodulin-like 3 (CLP) and four CpG islands
4 Homo sapians calmodulin-like 5 (CALML5)
5 Homo sapiens Crm, cramped-like (Drosophila) (CRAMP1L)
6 Homo sapiens DEAD (Asp-Glu-Ala-Asp) box polypeptide 17 (DDX17)
7 Homo sapiens eukaryotic translation elongation factor 1 alpha 1 (EEF1A1)
8 Homo sapiens glycine amidinotransferase (L-arginine:glycine amidinotransferase) (GATM)
9 Homo sapiens isocitrate dehydrogenase 3 (NAD+) beta (IDH3B)
10 Homo sapiens LY6/PLAUR domain containing 3 (LYPD3), (C4.4A)
11 Homo sapiens peroxiredoxin 5 (PRDX5)
12 Homo sapiens TAP binding protein (tapasin) (TAPBP)
13 Homo sapiens TBC1 domain family, member 10A (TBC1D10A)
14 Homo sapiens transmembrane anterior posterior transformation 1 (TAPT1)
15 Homo sapiens unc-84 homolog B (C.elegans)
16 Homo sapiens WD repeat domain 71 (WDR71)
17 Homo sapiens WW domain binding protein 1 (WBP1)
18 Homo sapiens zinc finger, NFX1-type containing 1 (ZNFX1)
19 Hypothetical protein LOC201895
20 Hypothetical protein LOC283377
Table 4.6: List of positive interacting candidates with K5 (alphabetical order)
- 62 -
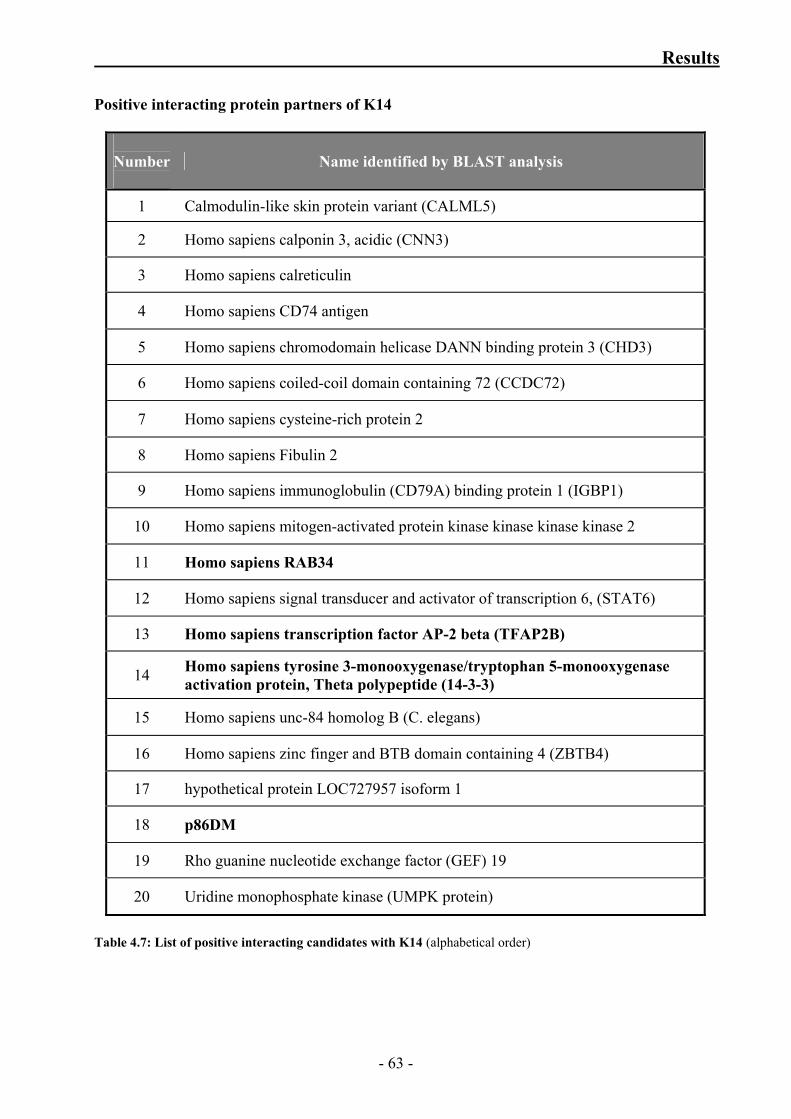
Results
Positive interacting protein partners of K14
Number
Name identified by BLAST analysis
1 Calmodulin-like skin protein variant (CALML5)
2 Homo sapiens calponin 3, acidic (CNN3)
3 Homo sapiens calreticulin
4 Homo sapiens CD74 antigen
5 Homo sapiens chromodomain helicase DANN binding protein 3 (CHD3)
6 Homo sapiens coiled-coil domain containing 72 (CCDC72)
7 Homo sapiens cysteine-rich protein 2
8 Homo sapiens Fibulin 2
9 Homo sapiens immunoglobulin (CD79A) binding protein 1 (IGBP1)
10 Homo sapiens mitogen-activated protein kinase kinase kinase kinase 2
11 Homo sapiens RAB34
12 Homo sapiens signal transducer and activator of transcription 6, (STAT6)
13 Homo sapiens transcription factor AP-2 beta (TFAP2B)
14 Homo sapiens tyrosine 3-monooxygenase/tryptophan 5-monooxygenase activation protein, Theta polypeptide (14-3-3)
15 Homo sapiens unc-84 homolog B (C. elegans)
16 Homo sapiens zinc finger and BTB domain containing 4 (ZBTB4)
17 hypothetical protein LOC727957 isoform 1
18 p86DM
19 Rho guanine nucleotide exchange factor (GEF) 19
20 Uridine monophosphate kinase (UMPK protein)
Table 4.7: List of positive interacting candidates with K14 (alphabetical order)
- 63 -
Results
4.2 Verification of the positive interacting candidates in mammalian cell culture system
Transcription factor AP2β, Rab34 a small GTPase of the ras superfamily, 14-3-3τ a member of
14-3-3 family proteins and the unannotated protein p86DM which were identified as K14 head
domain interacting proteins by Sos recruitment technique were selected for further investigation
to confirm their interaction with K14 in mammalian cell culture system.
Even though the above mentioned proteins were identified as interacting partners of K14 head
domain, owing to the stability and expression pattern of K14 head domain in the cell culture
system, full length K14 was used to verify the interaction with the identified candidate proteins.
To confirm the interaction, firstly expression of K14 head domain as GST fusion protein and
subsequent efforts to perform pulldown assays of endogenously expressed candidates was not
successful because of the aggregation of GST fusion protein. Similar kind of challenge was
experienced when tried to express K14 head domain alone in mammalian cells.
To overcome these challenges, full length K14 was used to confirm the interaction by
‘Bimolecular fluorescence complementation technique’, which enables direct visualization of
protein complexes in living cells and investigation of interactions in normal physiological cell
environment.
Full length keratin protein was expressed along with ‘N’ terminal half of Venus-YFP and
candidate proteins were expressed in fusion with ‘C’ terminal half Venus-YFP. Direct interaction
of the expressed K14 and candidate protein, constituted full length active Venus-YFP.
- 64 -
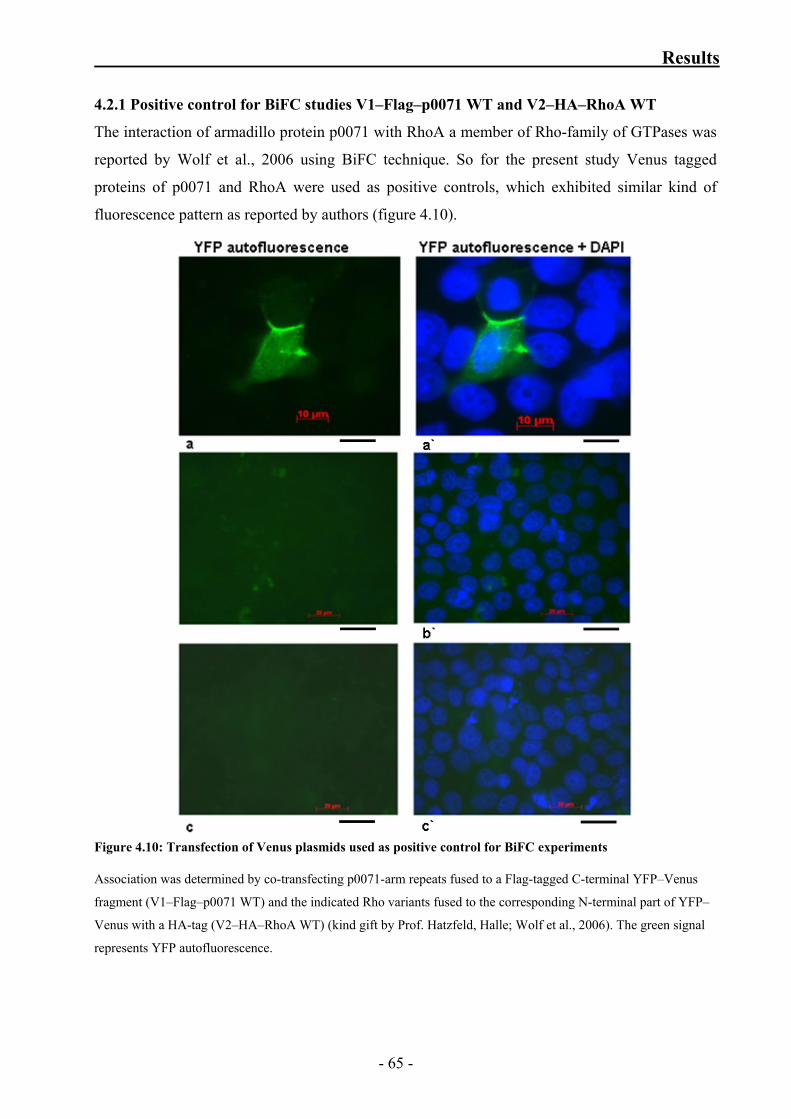
Results
4.2.1 Positive control for BiFC studies V1–Flag–p0071 WT and V2–HA–RhoA WT
The interaction of armadillo protein p0071 with RhoA a member of Rho-family of GTPases was
reported by Wolf et al., 2006 using BiFC technique. So for the present study Venus tagged
proteins of p0071 and RhoA were used as positive controls, which exhibited similar kind of
fluorescence pattern as reported by authors (figure 4.10).
Figure 4.10: Transfection of Venus plasmids used as positive control for BiFC experiments Association was determined by co-transfecting p0071-arm repeats fused to a Flag-tagged C-terminal YFP–Venus
fragment (V1–Flag–p0071 WT) and the indicated Rho variants fused to the corresponding N-terminal part of YFP–
Venus with a HA-tag (V2–HA–RhoA WT) (kind gift by Prof. Hatzfeld, Halle; Wolf et al., 2006). The green signal
represents YFP autofluorescence.
- 65 -

Results
a & a` : MCF7 cells were transiently cotransfected with V1–Flag–p0071 WT and V2–HA–RhoA WT, and were
fixed using PFA after 48 hours of transfection. p0071 associates with wild-type RhoA at the midbody as shown by
the authors and served as a positive control for BiFC experiments carried out in the present study.
b & b` : MCF7 cells were transiently transfected with V1–Flag–p0071 WT and were fixed using PFA after 48 hours
of transfection. Absence of the green signal for YFP indicates there is no false or nonspecific signal from the YFP-
Venus1 fragment.
c & c` : MCF7 cells were transiently transfected with V2–HA–RhoA WT and were fixed using PFA after 48 hours
of transfection. Absence of the green signal for YFP indicates there is no false or nonspecific signal from the YFP-
Venus2 fragment.
- 66 -
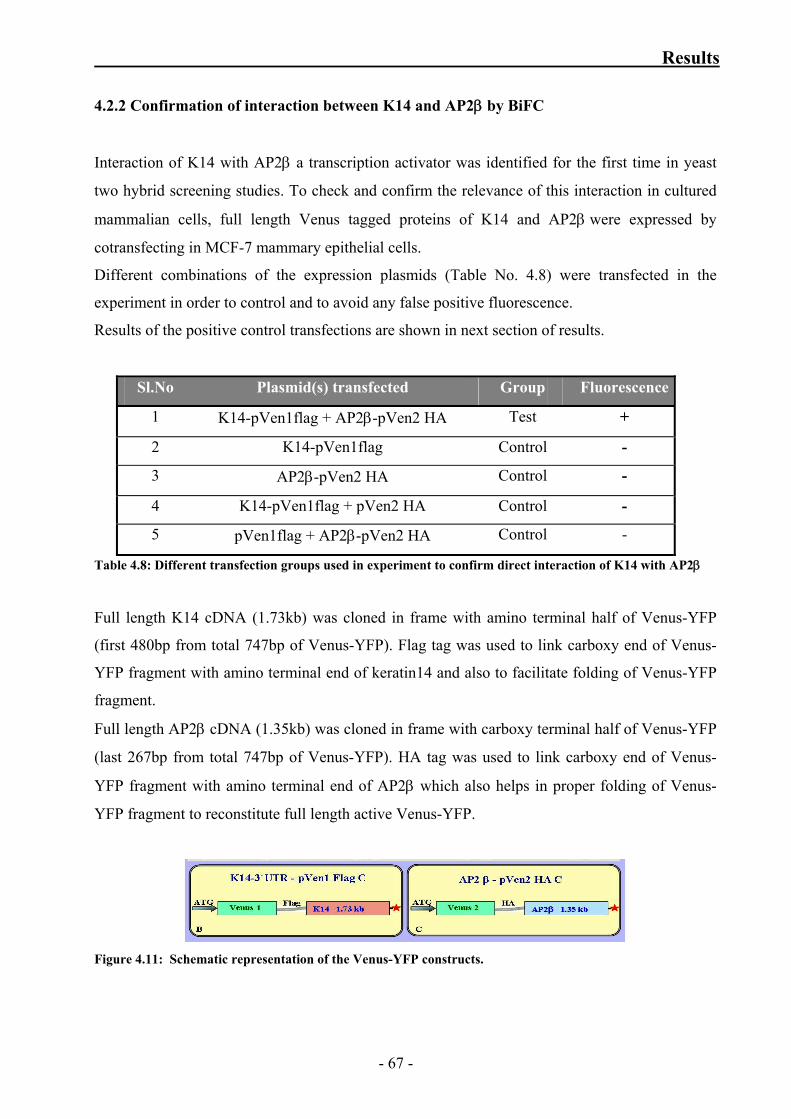
Results
4.2.2 Confirmation of interaction between K14 and AP2β by BiFC
Interaction of K14 with AP2β a transcription activator was identified for the first time in yeast
two hybrid screening studies. To check and confirm the relevance of this interaction in cultured
mammalian cells, full length Venus tagged proteins of K14 and AP2β were expressed by
cotransfecting in MCF-7 mammary epithelial cells.
Different combinations of the expression plasmids (Table No. 4.8) were transfected in the
experiment in order to control and to avoid any false positive fluorescence.
Results of the positive control transfections are shown in next section of results.
Sl.No Plasmid(s) transfected Group Fluorescence
1 K14-pVen1flag + AP2β-pVen2 HA Test +
2 K14-pVen1flag Control -
3 AP2β-pVen2 HA Control -
4 K14-pVen1flag + pVen2 HA Control -
5 pVen1flag + AP2β-pVen2 HA Control -
Table 4.8: Different transfection groups used in experiment to confirm direct interaction of K14 with AP2β
Full length K14 cDNA (1.73kb) was cloned in frame with amino terminal half of Venus-YFP
(first 480bp from total 747bp of Venus-YFP). Flag tag was used to link carboxy end of Venus-
YFP fragment with amino terminal end of keratin14 and also to facilitate folding of Venus-YFP
fragment.
Full length AP2β cDNA (1.35kb) was cloned in frame with carboxy terminal half of Venus-YFP
(last 267bp from total 747bp of Venus-YFP). HA tag was used to link carboxy end of Venus-
YFP fragment with amino terminal end of AP2β which also helps in proper folding of Venus-
YFP fragment to reconstitute full length active Venus-YFP.
Figure 4.11: Schematic representation of the Venus-YFP constructs.
- 67 -
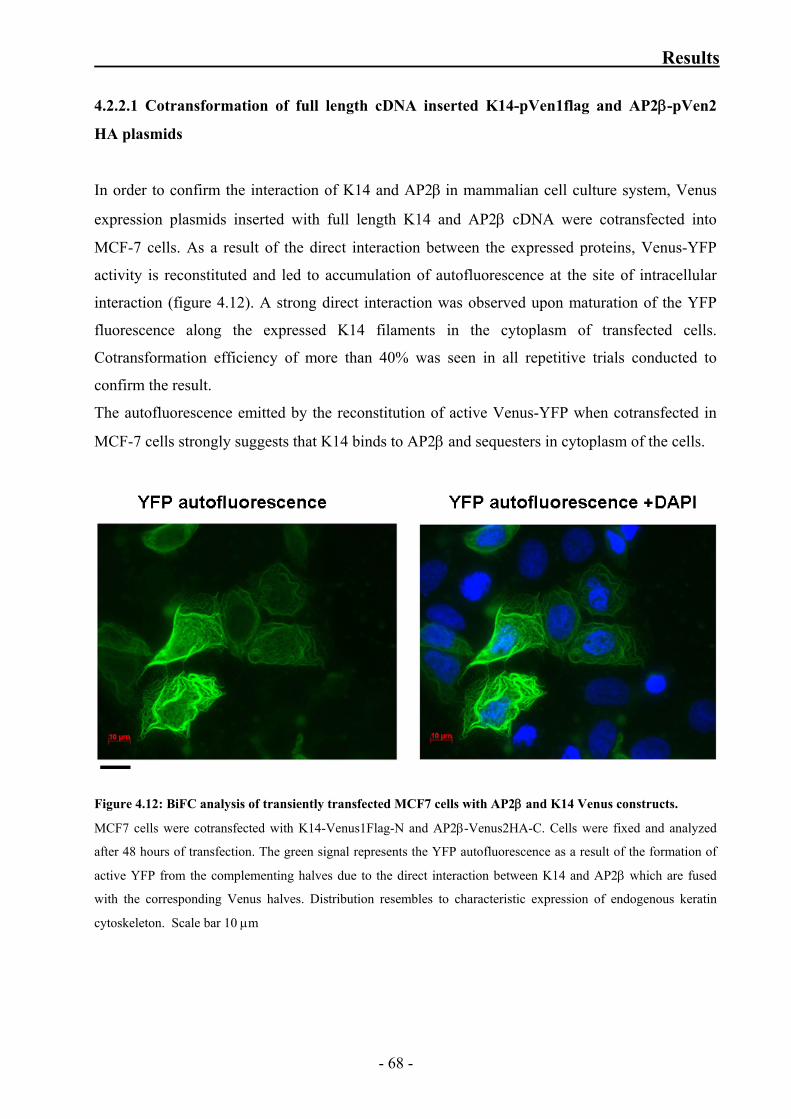
Results
4.2.2.1 Cotransformation of full length cDNA inserted K14-pVen1flag and AP2β-pVen2
HA plasmids
In order to confirm the interaction of K14 and AP2β in mammalian cell culture system, Venus
expression plasmids inserted with full length K14 and AP2β cDNA were cotransfected into
MCF-7 cells. As a result of the direct interaction between the expressed proteins, Venus-YFP
activity is reconstituted and led to accumulation of autofluorescence at the site of intracellular
interaction (figure 4.12). A strong direct interaction was observed upon maturation of the YFP
fluorescence along the expressed K14 filaments in the cytoplasm of transfected cells.
Cotransformation efficiency of more than 40% was seen in all repetitive trials conducted to
confirm the result.
The autofluorescence emitted by the reconstitution of active Venus-YFP when cotransfected in
MCF-7 cells strongly suggests that K14 binds to AP2β and sequesters in cytoplasm of the cells.
Figure 4.12: BiFC analysis of transiently transfected MCF7 cells with AP2β and K14 Venus constructs.
MCF7 cells were cotransfected with K14-Venus1Flag-N and AP2β-Venus2HA-C. Cells were fixed and analyzed
after 48 hours of transfection. The green signal represents the YFP autofluorescence as a result of the formation of
active YFP from the complementing halves due to the direct interaction between K14 and AP2β which are fused
with the corresponding Venus halves. Distribution resembles to characteristic expression of endogenous keratin
cytoskeleton. Scale bar 10 μm
- 68 -
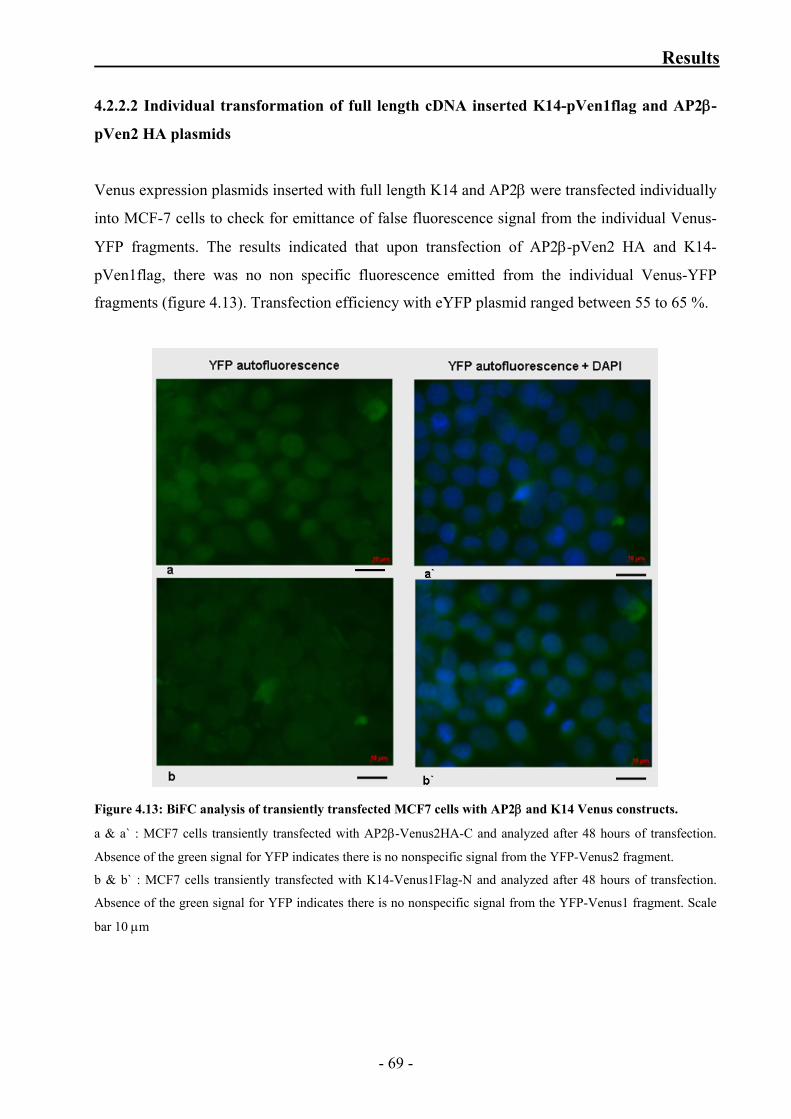
Results
4.2.2.2 Individual transformation of full length cDNA inserted K14-pVen1flag and AP2β-
pVen2 HA plasmids
Venus expression plasmids inserted with full length K14 and AP2β were transfected individually
into MCF-7 cells to check for emittance of false fluorescence signal from the individual Venus-
YFP fragments. The results indicated that upon transfection of AP2β-pVen2 HA and K14-
pVen1flag, there was no non specific fluorescence emitted from the individual Venus-YFP
fragments (figure 4.13). Transfection efficiency with eYFP plasmid ranged between 55 to 65 %.
Figure 4.13: BiFC analysis of transiently transfected MCF7 cells with AP2β and K14 Venus constructs.
a & a` : MCF7 cells transiently transfected with AP2β-Venus2HA-C and analyzed after 48 hours of transfection.
Absence of the green signal for YFP indicates there is no nonspecific signal from the YFP-Venus2 fragment.
b & b` : MCF7 cells transiently transfected with K14-Venus1Flag-N and analyzed after 48 hours of transfection.
Absence of the green signal for YFP indicates there is no nonspecific signal from the YFP-Venus1 fragment. Scale
bar 10 μm
- 69 -
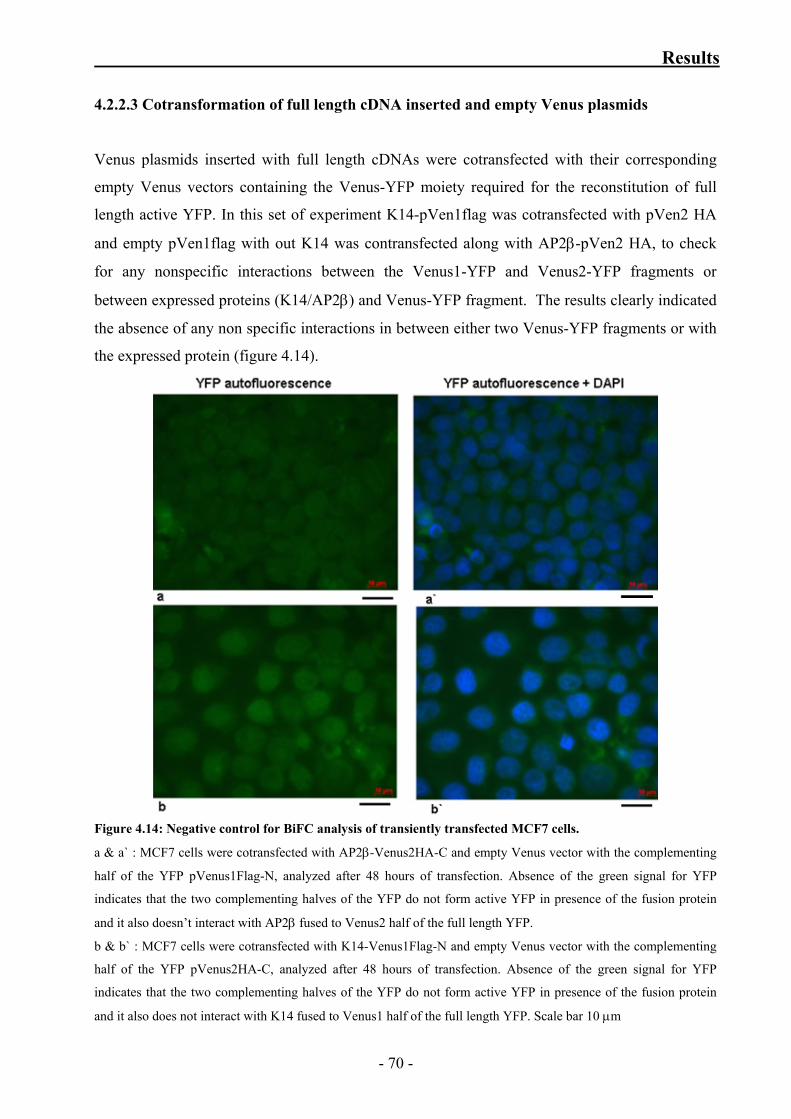
Results
4.2.2.3 Cotransformation of full length cDNA inserted and empty Venus plasmids
Venus plasmids inserted with full length cDNAs were cotransfected with their corresponding
empty Venus vectors containing the Venus-YFP moiety required for the reconstitution of full
length active YFP. In this set of experiment K14-pVen1flag was cotransfected with pVen2 HA
and empty pVen1flag with out K14 was contransfected along with AP2β-pVen2 HA, to check
for any nonspecific interactions between the Venus1-YFP and Venus2-YFP fragments or
between expressed proteins (K14/AP2β) and Venus-YFP fragment. The results clearly indicated
the absence of any non specific interactions in between either two Venus-YFP fragments or with
the expressed protein (figure 4.14).
Figure 4.14: Negative control for BiFC analysis of transiently transfected MCF7 cells.
a & a` : MCF7 cells were cotransfected with AP2β-Venus2HA-C and empty Venus vector with the complementing
half of the YFP pVenus1Flag-N, analyzed after 48 hours of transfection. Absence of the green signal for YFP
indicates that the two complementing halves of the YFP do not form active YFP in presence of the fusion protein
and it also doesn’t interact with AP2β fused to Venus2 half of the full length YFP.
b & b` : MCF7 cells were cotransfected with K14-Venus1Flag-N and empty Venus vector with the complementing
half of the YFP pVenus2HA-C, analyzed after 48 hours of transfection. Absence of the green signal for YFP
indicates that the two complementing halves of the YFP do not form active YFP in presence of the fusion protein
and it also does not interact with K14 fused to Venus1 half of the full length YFP. Scale bar 10 μm
- 70 -

Results
Different sets of the above shown control experiments confirmed that, autofluorescence emitted
by cotransfection of Venus constructs tagged to K14 and AP2β is only due to the direct
interaction of K14 and AP2β thereby reconstituting the mature Venus-YFP.
These results confirm the interaction between two expressed proteins and strongly suggest that
AP-2β is sequestered in the cytoplasm by interaction with K14 and also opens a new avenue for
the first time to address a novel regulatory mechanism which controls the activity of AP-2β and
possibly other AP-2 family members by interaction with keratins.
- 71 -
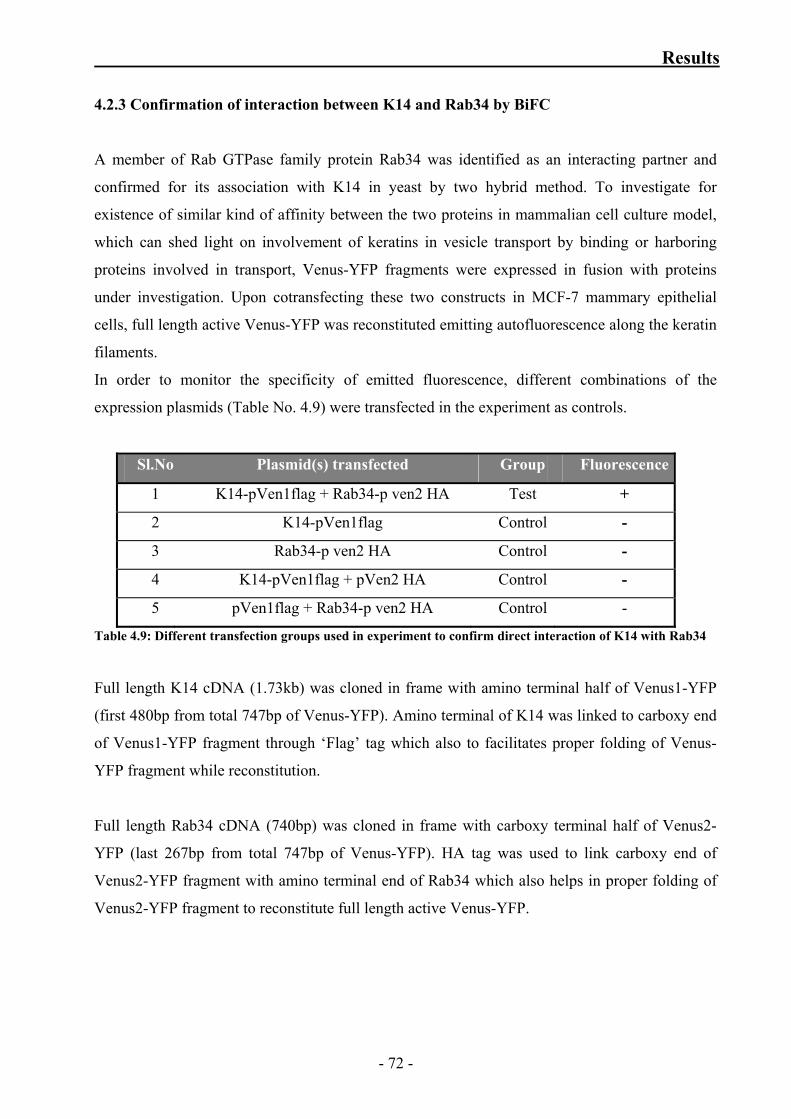
Results
4.2.3 Confirmation of interaction between K14 and Rab34 by BiFC
A member of Rab GTPase family protein Rab34 was identified as an interacting partner and
confirmed for its association with K14 in yeast by two hybrid method. To investigate for
existence of similar kind of affinity between the two proteins in mammalian cell culture model,
which can shed light on involvement of keratins in vesicle transport by binding or harboring
proteins involved in transport, Venus-YFP fragments were expressed in fusion with proteins
under investigation. Upon cotransfecting these two constructs in MCF-7 mammary epithelial
cells, full length active Venus-YFP was reconstituted emitting autofluorescence along the keratin
filaments.
In order to monitor the specificity of emitted fluorescence, different combinations of the
expression plasmids (Table No. 4.9) were transfected in the experiment as controls.
Sl.No Plasmid(s) transfected Group Fluorescence
1 K14-pVen1flag + Rab34-p ven2 HA Test +
2 K14-pVen1flag Control -
3 Rab34-p ven2 HA Control -
4 K14-pVen1flag + pVen2 HA Control -
5 pVen1flag + Rab34-p ven2 HA Control -
Table 4.9: Different transfection groups used in experiment to confirm direct interaction of K14 with Rab34
Full length K14 cDNA (1.73kb) was cloned in frame with amino terminal half of Venus1-YFP
(first 480bp from total 747bp of Venus-YFP). Amino terminal of K14 was linked to carboxy end
of Venus1-YFP fragment through ‘Flag’ tag which also to facilitates proper folding of Venus-
YFP fragment while reconstitution.
Full length Rab34 cDNA (740bp) was cloned in frame with carboxy terminal half of Venus2-
YFP (last 267bp from total 747bp of Venus-YFP). HA tag was used to link carboxy end of
Venus2-YFP fragment with amino terminal end of Rab34 which also helps in proper folding of
Venus2-YFP fragment to reconstitute full length active Venus-YFP.
- 72 -
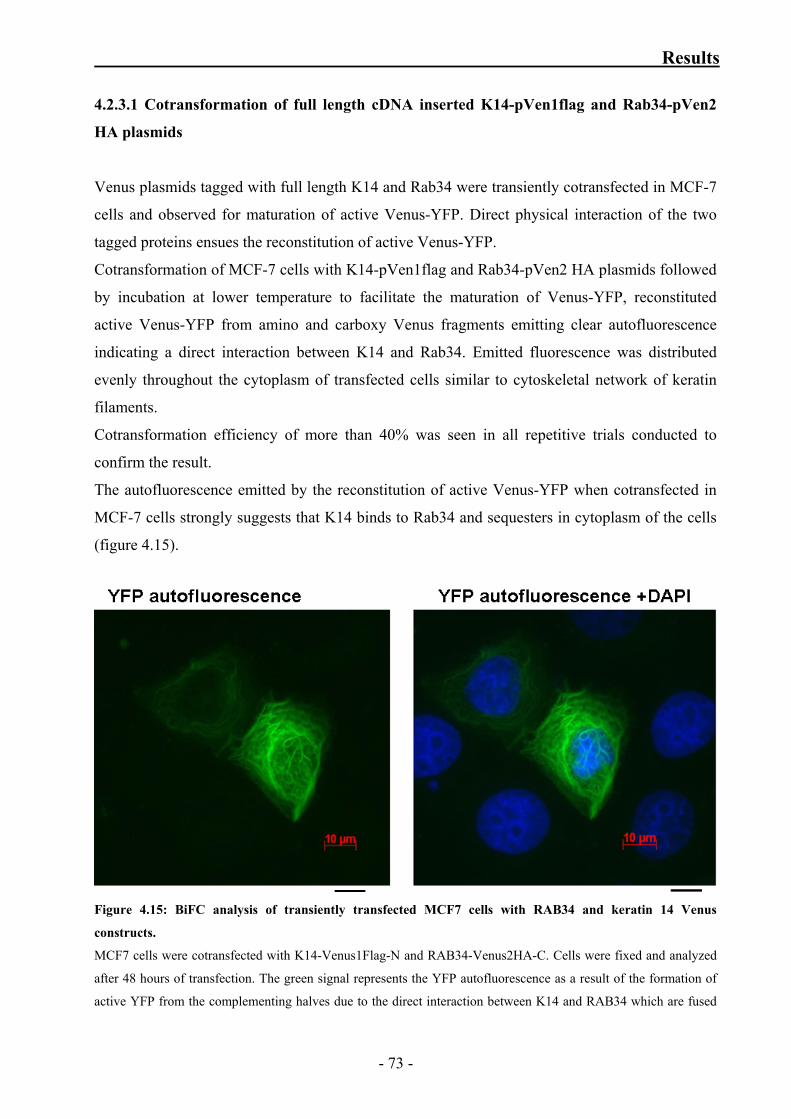
Results
4.2.3.1 Cotransformation of full length cDNA inserted K14-pVen1flag and Rab34-pVen2
HA plasmids
Venus plasmids tagged with full length K14 and Rab34 were transiently cotransfected in MCF-7
cells and observed for maturation of active Venus-YFP. Direct physical interaction of the two
tagged proteins ensues the reconstitution of active Venus-YFP.
Cotransformation of MCF-7 cells with K14-pVen1flag and Rab34-pVen2 HA plasmids followed
by incubation at lower temperature to facilitate the maturation of Venus-YFP, reconstituted
active Venus-YFP from amino and carboxy Venus fragments emitting clear autofluorescence
indicating a direct interaction between K14 and Rab34. Emitted fluorescence was distributed
evenly throughout the cytoplasm of transfected cells similar to cytoskeletal network of keratin
filaments.
Cotransformation efficiency of more than 40% was seen in all repetitive trials conducted to
confirm the result.
The autofluorescence emitted by the reconstitution of active Venus-YFP when cotransfected in
MCF-7 cells strongly suggests that K14 binds to Rab34 and sequesters in cytoplasm of the cells
(figure 4.15).
Figure 4.15: BiFC analysis of transiently transfected MCF7 cells with RAB34 and keratin 14 Venus
constructs.
MCF7 cells were cotransfected with K14-Venus1Flag-N and RAB34-Venus2HA-C. Cells were fixed and analyzed
after 48 hours of transfection. The green signal represents the YFP autofluorescence as a result of the formation of
active YFP from the complementing halves due to the direct interaction between K14 and RAB34 which are fused
- 73 -
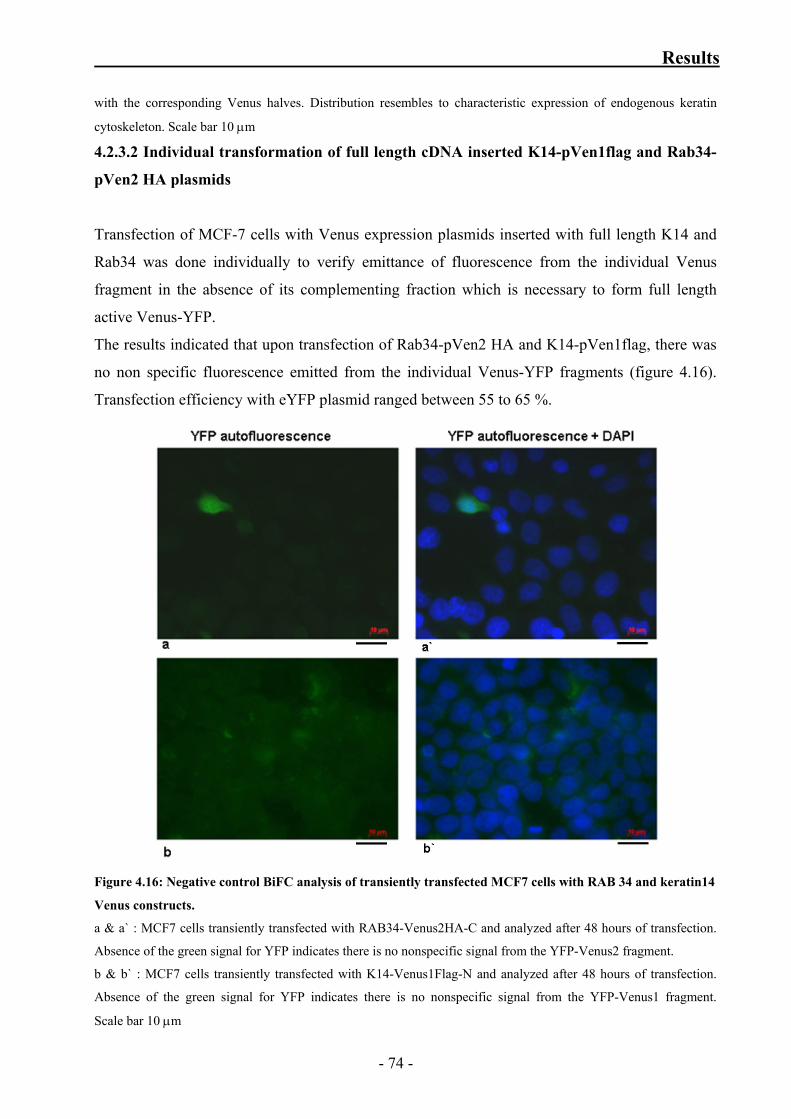
Results
with the corresponding Venus halves. Distribution resembles to characteristic expression of endogenous keratin
cytoskeleton. Scale bar 10 μm
4.2.3.2 Individual transformation of full length cDNA inserted K14-pVen1flag and Rab34-
pVen2 HA plasmids
Transfection of MCF-7 cells with Venus expression plasmids inserted with full length K14 and
Rab34 was done individually to verify emittance of fluorescence from the individual Venus
fragment in the absence of its complementing fraction which is necessary to form full length
active Venus-YFP.
The results indicated that upon transfection of Rab34-pVen2 HA and K14-pVen1flag, there was
no non specific fluorescence emitted from the individual Venus-YFP fragments (figure 4.16).
Transfection efficiency with eYFP plasmid ranged between 55 to 65 %.
Figure 4.16: Negative control BiFC analysis of transiently transfected MCF7 cells with RAB 34 and keratin14
Venus constructs.
a & a` : MCF7 cells transiently transfected with RAB34-Venus2HA-C and analyzed after 48 hours of transfection.
Absence of the green signal for YFP indicates there is no nonspecific signal from the YFP-Venus2 fragment.
b & b` : MCF7 cells transiently transfected with K14-Venus1Flag-N and analyzed after 48 hours of transfection.
Absence of the green signal for YFP indicates there is no nonspecific signal from the YFP-Venus1 fragment.
Scale bar 10 μm
- 74 -
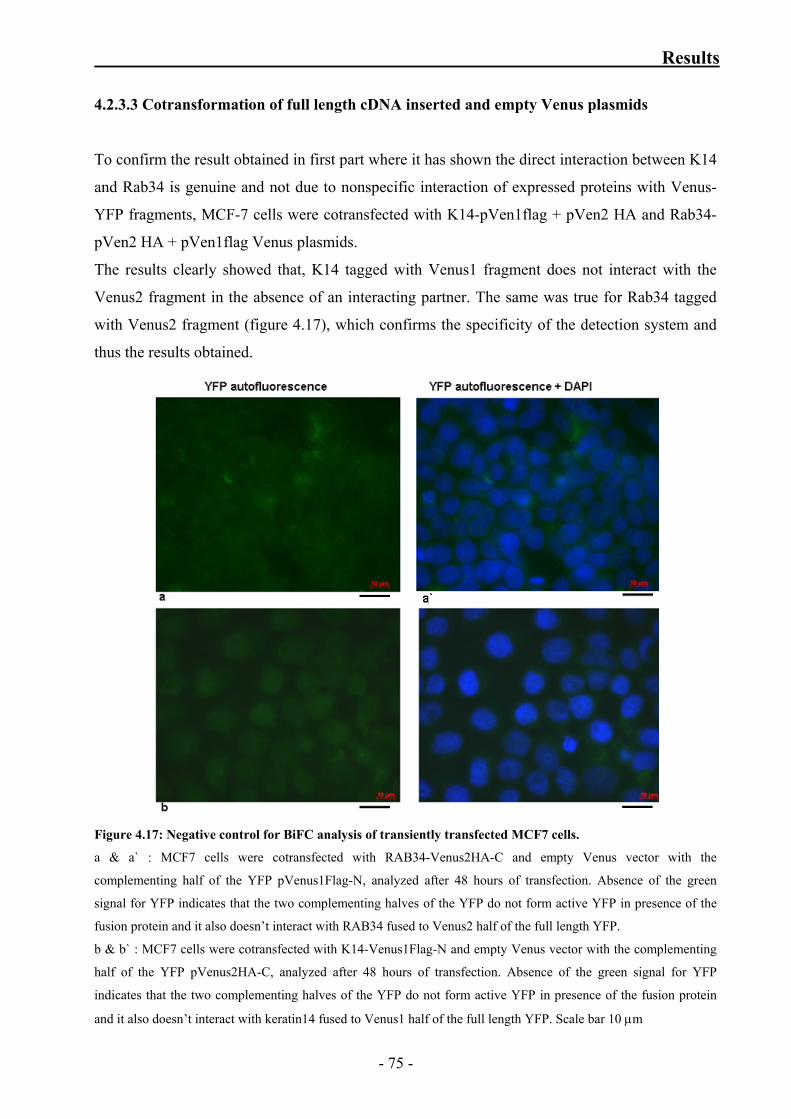
Results
4.2.3.3 Cotransformation of full length cDNA inserted and empty Venus plasmids
To confirm the result obtained in first part where it has shown the direct interaction between K14
and Rab34 is genuine and not due to nonspecific interaction of expressed proteins with Venus-
YFP fragments, MCF-7 cells were cotransfected with K14-pVen1flag + pVen2 HA and Rab34-
pVen2 HA + pVen1flag Venus plasmids.
The results clearly showed that, K14 tagged with Venus1 fragment does not interact with the
Venus2 fragment in the absence of an interacting partner. The same was true for Rab34 tagged
with Venus2 fragment (figure 4.17), which confirms the specificity of the detection system and
thus the results obtained.
Figure 4.17: Negative control for BiFC analysis of transiently transfected MCF7 cells.
a & a` : MCF7 cells were cotransfected with RAB34-Venus2HA-C and empty Venus vector with the
complementing half of the YFP pVenus1Flag-N, analyzed after 48 hours of transfection. Absence of the green
signal for YFP indicates that the two complementing halves of the YFP do not form active YFP in presence of the
fusion protein and it also doesn’t interact with RAB34 fused to Venus2 half of the full length YFP.
b & b` : MCF7 cells were cotransfected with K14-Venus1Flag-N and empty Venus vector with the complementing
half of the YFP pVenus2HA-C, analyzed after 48 hours of transfection. Absence of the green signal for YFP
indicates that the two complementing halves of the YFP do not form active YFP in presence of the fusion protein
and it also doesn’t interact with keratin14 fused to Venus1 half of the full length YFP. Scale bar 10 μm
- 75 -

Results
BiFC analysis confirmed the direct interaction between cytoskeletal protein keratin14 and Rab34
a transporter protein in the cytoplasm of MCF-7 cells. This result was supported by various
control experiments conducted in parallel.
The finding of interaction between K14 with transporter protein Rab34 will further support the
recent reports stating the role of keratin in vesicle transport. Rab proteins (Rab27) are involved in
melanosome transport and distribution in melanocytes, Rab34 being the member of same family
and its interaction with K14 hints that, this specific interaction might be having some role to play
in uptake and redistribution of melanosomes in keratinocytes. Further investigations towards this
aspect would be highly significant to elucidate the role of keratins in melanosome transport and
redistribution in keratinocytes.
- 76 -
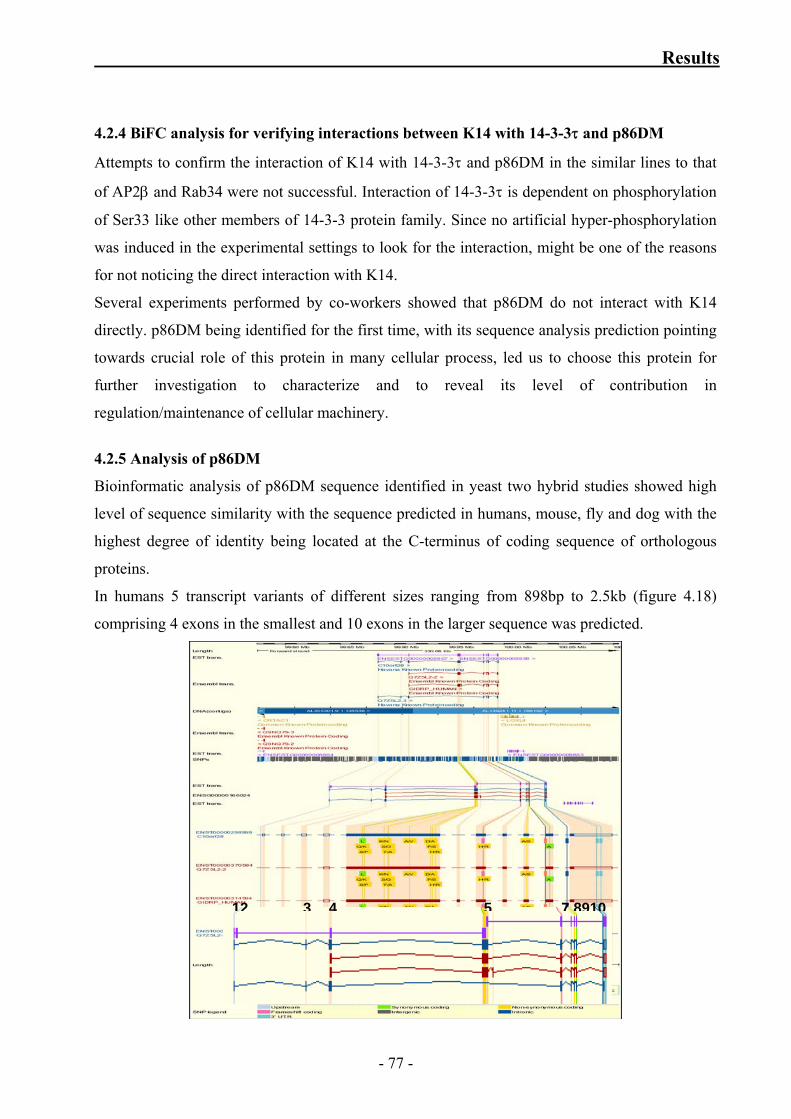
Results
4.2.4 BiFC analysis for verifying interactions between K14 with 14-3-3τ and p86DM
Attempts to confirm the interaction of K14 with 14-3-3τ and p86DM in the similar lines to that
of AP2β and Rab34 were not successful. Interaction of 14-3-3τ is dependent on phosphorylation
of Ser33 like other members of 14-3-3 protein family. Since no artificial hyper-phosphorylation
was induced in the experimental settings to look for the interaction, might be one of the reasons
for not noticing the direct interaction with K14.
Several experiments performed by co-workers showed that p86DM do not interact with K14
directly. p86DM being identified for the first time, with its sequence analysis prediction pointing
towards crucial role of this protein in many cellular process, led us to choose this protein for
further investigation to characterize and to reveal its level of contribution in
regulation/maintenance of cellular machinery.
4.2.5 Analysis of p86DM
Bioinformatic analysis of p86DM sequence identified in yeast two hybrid studies showed high
level of sequence similarity with the sequence predicted in humans, mouse, fly and dog with the
highest degree of identity being located at the C-terminus of coding sequence of orthologous
proteins.
In humans 5 transcript variants of different sizes ranging from 898bp to 2.5kb (figure 4.18)
comprising 4 exons in the smallest and 10 exons in the larger sequence was predicted.
12 3 4 5 7 8910
- 77 -
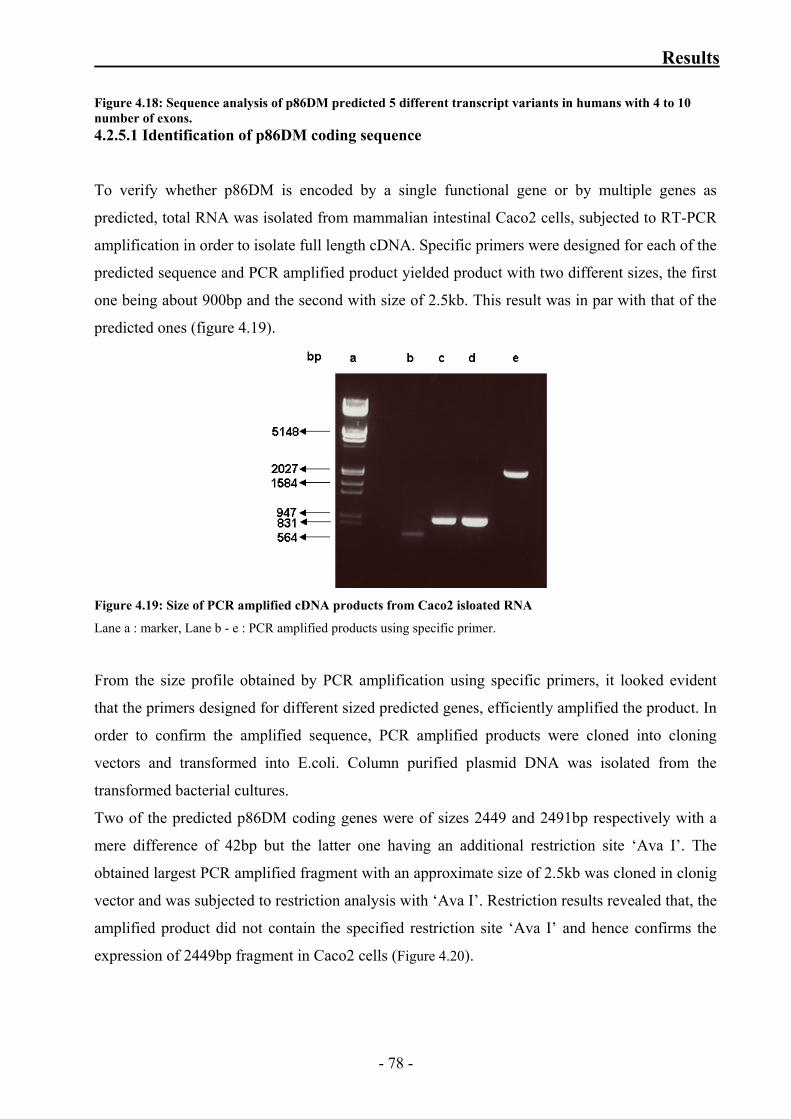
Results
Figure 4.18: Sequence analysis of p86DM predicted 5 different transcript variants in humans with 4 to 10 number of exons. 4.2.5.1 Identification of p86DM coding sequence
To verify whether p86DM is encoded by a single functional gene or by multiple genes as
predicted, total RNA was isolated from mammalian intestinal Caco2 cells, subjected to RT-PCR
amplification in order to isolate full length cDNA. Specific primers were designed for each of the
predicted sequence and PCR amplified product yielded product with two different sizes, the first
one being about 900bp and the second with size of 2.5kb. This result was in par with that of the
predicted ones (figure 4.19).
Figure 4.19: Size of PCR amplified cDNA products from Caco2 isloated RNA
Lane a : marker, Lane b - e : PCR amplified products using specific primer.
From the size profile obtained by PCR amplification using specific primers, it looked evident
that the primers designed for different sized predicted genes, efficiently amplified the product. In
order to confirm the amplified sequence, PCR amplified products were cloned into cloning
vectors and transformed into E.coli. Column purified plasmid DNA was isolated from the
transformed bacterial cultures.
Two of the predicted p86DM coding genes were of sizes 2449 and 2491bp respectively with a
mere difference of 42bp but the latter one having an additional restriction site ‘Ava I’. The
obtained largest PCR amplified fragment with an approximate size of 2.5kb was cloned in clonig
vector and was subjected to restriction analysis with ‘Ava I’. Restriction results revealed that, the
amplified product did not contain the specified restriction site ‘Ava I’ and hence confirms the
expression of 2449bp fragment in Caco2 cells (Figure 4.20).
- 78 -
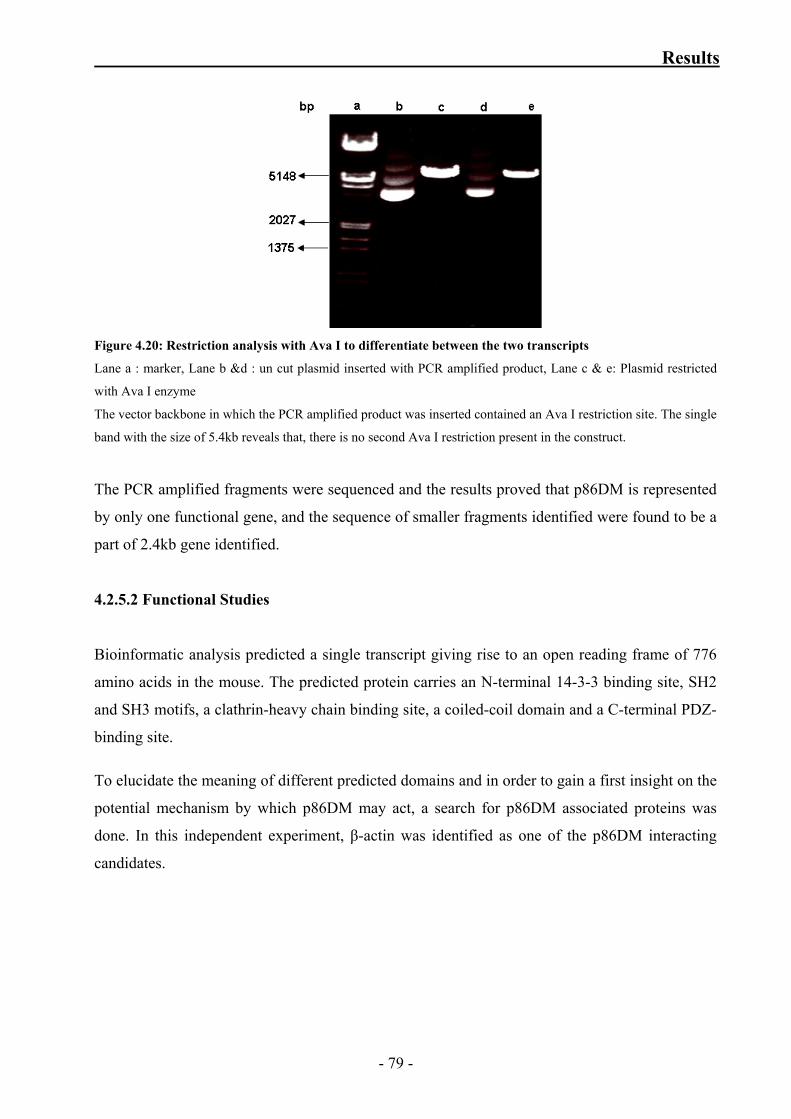
Results
Figure 4.20: Restriction analysis with Ava I to differentiate between the two transcripts
Lane a : marker, Lane b &d : un cut plasmid inserted with PCR amplified product, Lane c & e: Plasmid restricted
with Ava I enzyme
The vector backbone in which the PCR amplified product was inserted contained an Ava I restriction site. The single
band with the size of 5.4kb reveals that, there is no second Ava I restriction present in the construct.
The PCR amplified fragments were sequenced and the results proved that p86DM is represented
by only one functional gene, and the sequence of smaller fragments identified were found to be a
part of 2.4kb gene identified.
4.2.5.2 Functional Studies
Bioinformatic analysis predicted a single transcript giving rise to an open reading frame of 776
amino acids in the mouse. The predicted protein carries an N-terminal 14-3-3 binding site, SH2
and SH3 motifs, a clathrin-heavy chain binding site, a coiled-coil domain and a C-terminal PDZ-
binding site.
To elucidate the meaning of different predicted domains and in order to gain a first insight on the
potential mechanism by which p86DM may act, a search for p86DM associated proteins was
done. In this independent experiment, β-actin was identified as one of the p86DM interacting
candidates.
- 79 -
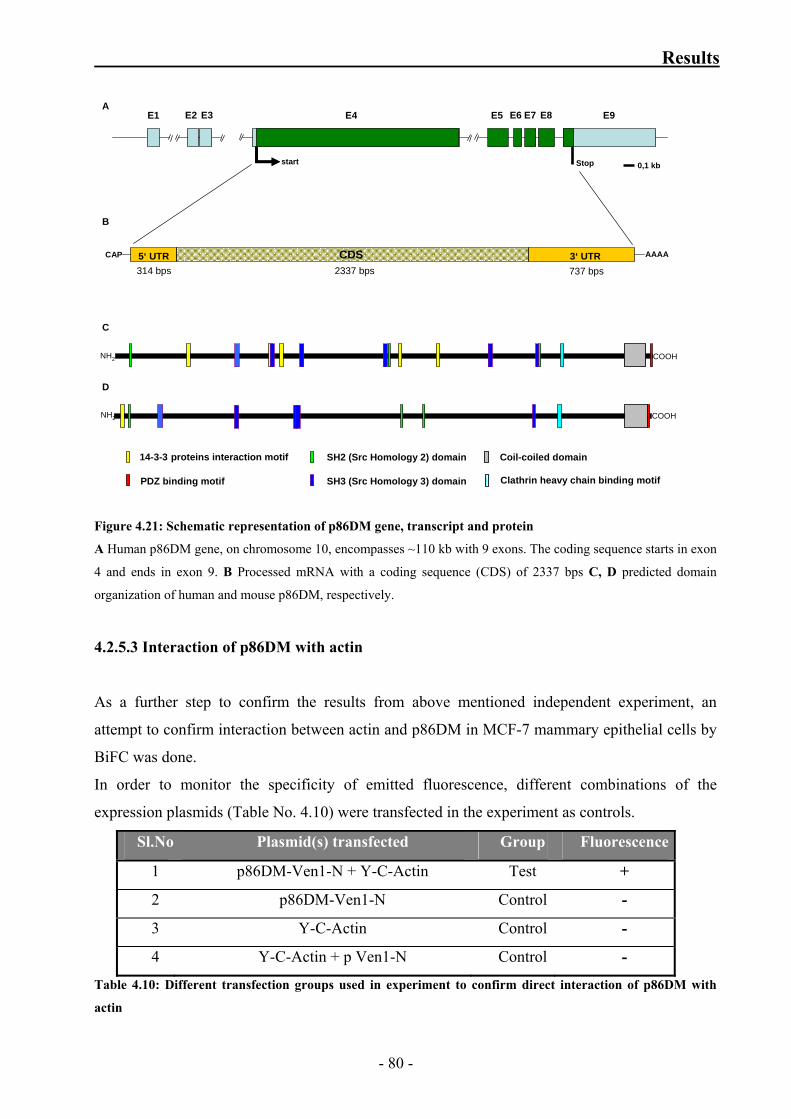
Results
CAP
2337 bps314 bps 737 bps5‘ UTR 3‘ UTR AAAACDS
E1 E4 E5 E9E2 E3 E6 E7 E8
start Stop
NH2 COOH
0,1 kb
A
B
C
NH2 COOH
D
14-3-3 proteins interaction motif
PDZ binding motif
SH2 (Src Homology 2) domain
SH3 (Src Homology 3) domain
Coil-coiled domain
Clathrin heavy chain binding motif
Figure 4.21: Schematic representation of p86DM gene, transcript and protein
A Human p86DM gene, on chromosome 10, encompasses ~110 kb with 9 exons. The coding sequence starts in exon
4 and ends in exon 9. B Processed mRNA with a coding sequence (CDS) of 2337 bps C, D predicted domain
organization of human and mouse p86DM, respectively.
4.2.5.3 Interaction of p86DM with actin
As a further step to confirm the results from above mentioned independent experiment, an
attempt to confirm interaction between actin and p86DM in MCF-7 mammary epithelial cells by
BiFC was done.
In order to monitor the specificity of emitted fluorescence, different combinations of the
expression plasmids (Table No. 4.10) were transfected in the experiment as controls.
Sl.No Plasmid(s) transfected Group Fluorescence
1 p86DM-Ven1-N + Y-C-Actin Test +
2 p86DM-Ven1-N Control -
3 Y-C-Actin Control -
4 Y-C-Actin + p Ven1-N Control -
Table 4.10: Different transfection groups used in experiment to confirm direct interaction of p86DM with
actin
- 80 -
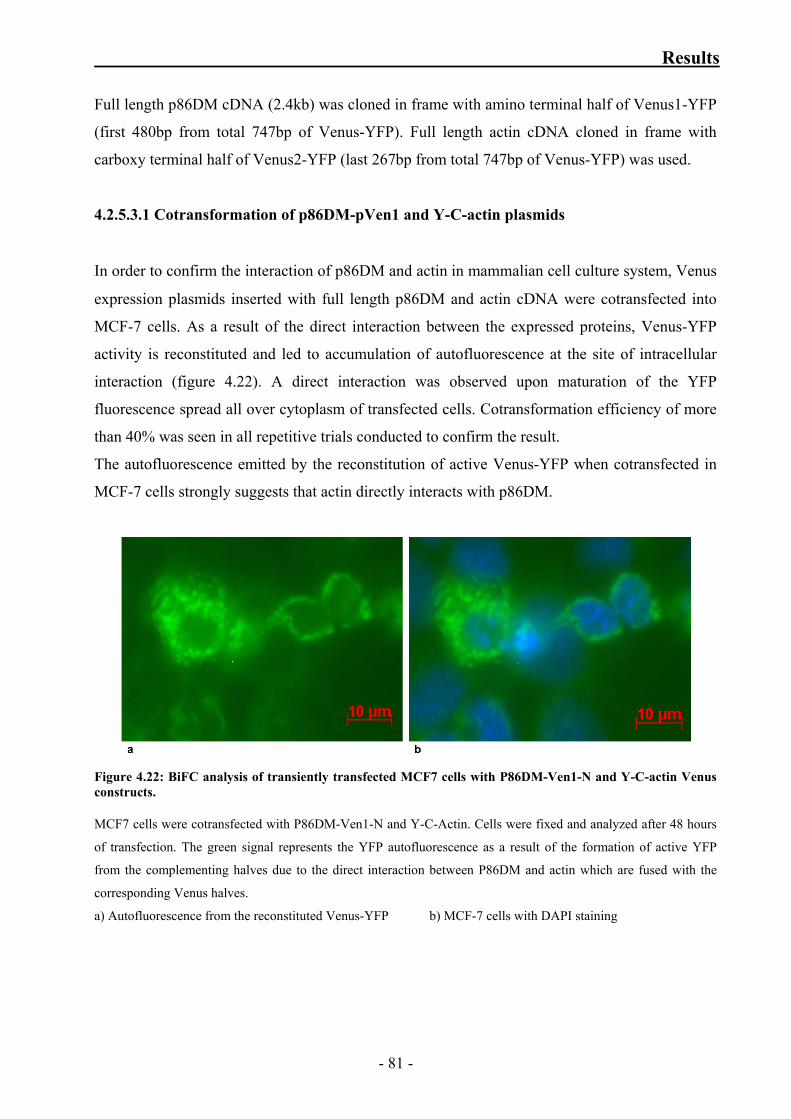
Results
Full length p86DM cDNA (2.4kb) was cloned in frame with amino terminal half of Venus1-YFP
(first 480bp from total 747bp of Venus-YFP). Full length actin cDNA cloned in frame with
carboxy terminal half of Venus2-YFP (last 267bp from total 747bp of Venus-YFP) was used.
4.2.5.3.1 Cotransformation of p86DM-pVen1 and Y-C-actin plasmids
In order to confirm the interaction of p86DM and actin in mammalian cell culture system, Venus
expression plasmids inserted with full length p86DM and actin cDNA were cotransfected into
MCF-7 cells. As a result of the direct interaction between the expressed proteins, Venus-YFP
activity is reconstituted and led to accumulation of autofluorescence at the site of intracellular
interaction (figure 4.22). A direct interaction was observed upon maturation of the YFP
fluorescence spread all over cytoplasm of transfected cells. Cotransformation efficiency of more
than 40% was seen in all repetitive trials conducted to confirm the result.
The autofluorescence emitted by the reconstitution of active Venus-YFP when cotransfected in
MCF-7 cells strongly suggests that actin directly interacts with p86DM.
Figure 4.22: BiFC analysis of transiently transfected MCF7 cells with P86DM-Ven1-N and Y-C-actin Venus constructs. MCF7 cells were cotransfected with P86DM-Ven1-N and Y-C-Actin. Cells were fixed and analyzed after 48 hours
of transfection. The green signal represents the YFP autofluorescence as a result of the formation of active YFP
from the complementing halves due to the direct interaction between P86DM and actin which are fused with the
corresponding Venus halves.
a) Autofluorescence from the reconstituted Venus-YFP b) MCF-7 cells with DAPI staining
- 81 -
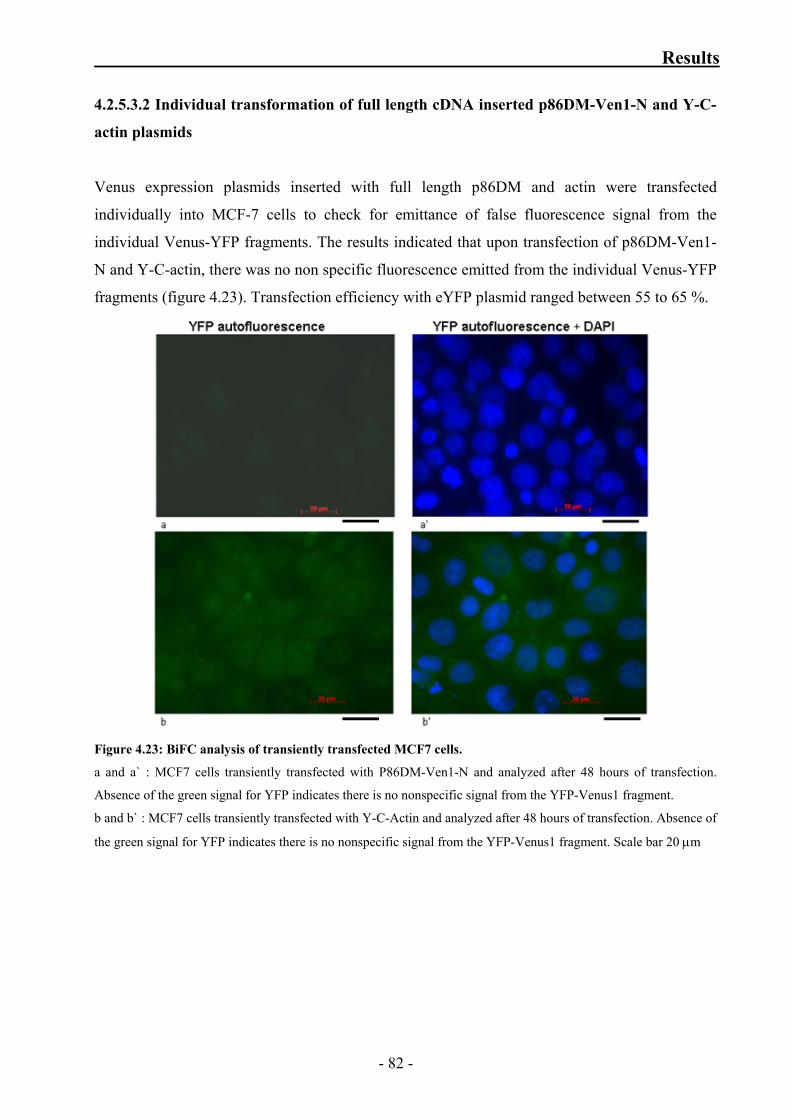
Results
4.2.5.3.2 Individual transformation of full length cDNA inserted p86DM-Ven1-N and Y-C-
actin plasmids
Venus expression plasmids inserted with full length p86DM and actin were transfected
individually into MCF-7 cells to check for emittance of false fluorescence signal from the
individual Venus-YFP fragments. The results indicated that upon transfection of p86DM-Ven1-
N and Y-C-actin, there was no non specific fluorescence emitted from the individual Venus-YFP
fragments (figure 4.23). Transfection efficiency with eYFP plasmid ranged between 55 to 65 %.
Figure 4.23: BiFC analysis of transiently transfected MCF7 cells.
a and a` : MCF7 cells transiently transfected with P86DM-Ven1-N and analyzed after 48 hours of transfection.
Absence of the green signal for YFP indicates there is no nonspecific signal from the YFP-Venus1 fragment.
b and b` : MCF7 cells transiently transfected with Y-C-Actin and analyzed after 48 hours of transfection. Absence of
the green signal for YFP indicates there is no nonspecific signal from the YFP-Venus1 fragment. Scale bar 20 μm
- 82 -
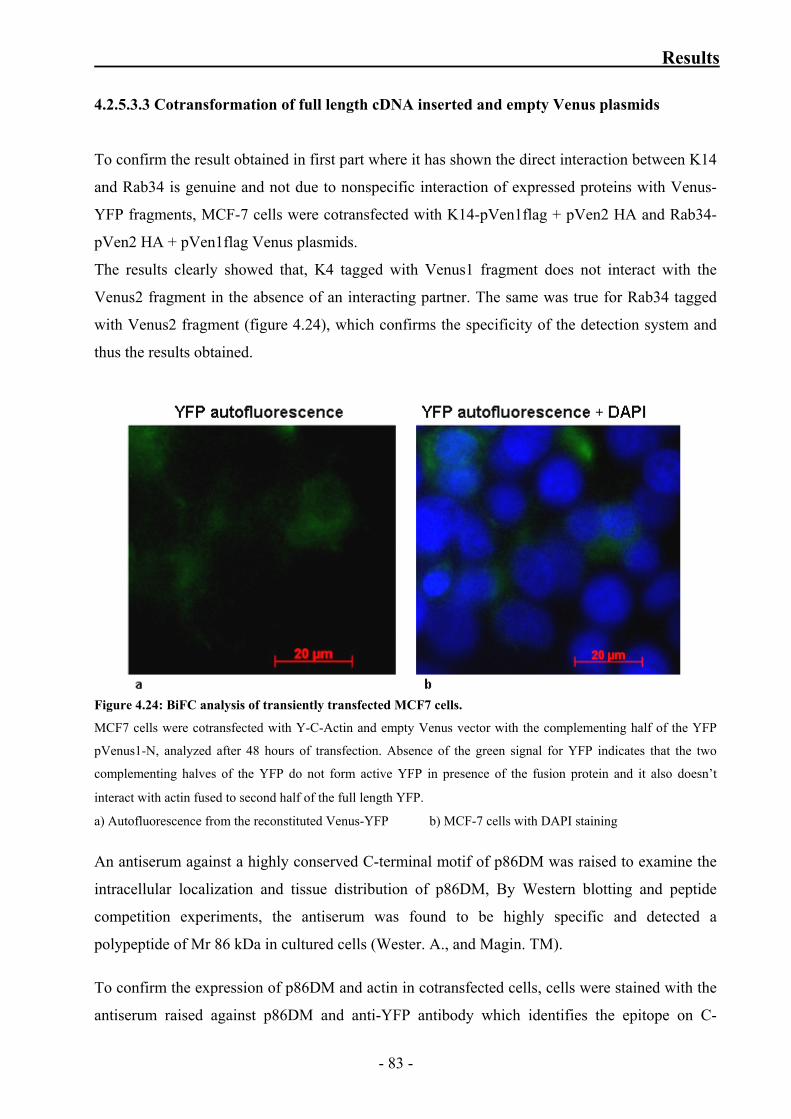
Results
4.2.5.3.3 Cotransformation of full length cDNA inserted and empty Venus plasmids
To confirm the result obtained in first part where it has shown the direct interaction between K14
and Rab34 is genuine and not due to nonspecific interaction of expressed proteins with Venus-
YFP fragments, MCF-7 cells were cotransfected with K14-pVen1flag + pVen2 HA and Rab34-
pVen2 HA + pVen1flag Venus plasmids.
The results clearly showed that, K4 tagged with Venus1 fragment does not interact with the
Venus2 fragment in the absence of an interacting partner. The same was true for Rab34 tagged
with Venus2 fragment (figure 4.24), which confirms the specificity of the detection system and
thus the results obtained.
Figure 4.24: BiFC analysis of transiently transfected MCF7 cells.
MCF7 cells were cotransfected with Y-C-Actin and empty Venus vector with the complementing half of the YFP
pVenus1-N, analyzed after 48 hours of transfection. Absence of the green signal for YFP indicates that the two
complementing halves of the YFP do not form active YFP in presence of the fusion protein and it also doesn’t
interact with actin fused to second half of the full length YFP.
a) Autofluorescence from the reconstituted Venus-YFP b) MCF-7 cells with DAPI staining
An antiserum against a highly conserved C-terminal motif of p86DM was raised to examine the
intracellular localization and tissue distribution of p86DM, By Western blotting and peptide
competition experiments, the antiserum was found to be highly specific and detected a
polypeptide of Mr 86 kDa in cultured cells (Wester. A., and Magin. TM).
To confirm the expression of p86DM and actin in cotransfected cells, cells were stained with the
antiserum raised against p86DM and anti-YFP antibody which identifies the epitope on C-
- 83 -
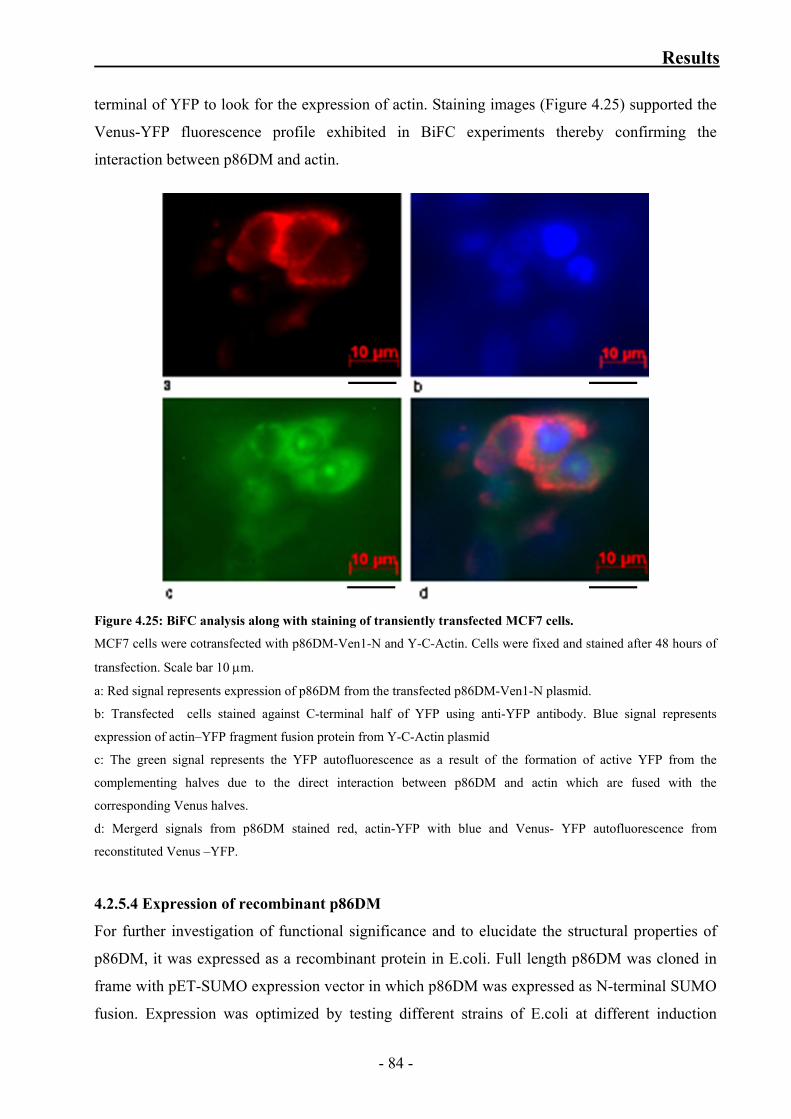
Results
terminal of YFP to look for the expression of actin. Staining images (Figure 4.25) supported the
Venus-YFP fluorescence profile exhibited in BiFC experiments thereby confirming the
interaction between p86DM and actin.
Figure 4.25: BiFC analysis along with staining of transiently transfected MCF7 cells.
MCF7 cells were cotransfected with p86DM-Ven1-N and Y-C-Actin. Cells were fixed and stained after 48 hours of
transfection. Scale bar 10 μm.
a: Red signal represents expression of p86DM from the transfected p86DM-Ven1-N plasmid.
b: Transfected cells stained against C-terminal half of YFP using anti-YFP antibody. Blue signal represents
expression of actin–YFP fragment fusion protein from Y-C-Actin plasmid
c: The green signal represents the YFP autofluorescence as a result of the formation of active YFP from the
complementing halves due to the direct interaction between p86DM and actin which are fused with the
corresponding Venus halves.
d: Mergerd signals from p86DM stained red, actin-YFP with blue and Venus- YFP autofluorescence from
reconstituted Venus –YFP.
4.2.5.4 Expression of recombinant p86DM
For further investigation of functional significance and to elucidate the structural properties of
p86DM, it was expressed as a recombinant protein in E.coli. Full length p86DM was cloned in
frame with pET-SUMO expression vector in which p86DM was expressed as N-terminal SUMO
fusion. Expression was optimized by testing different strains of E.coli at different induction
- 84 -
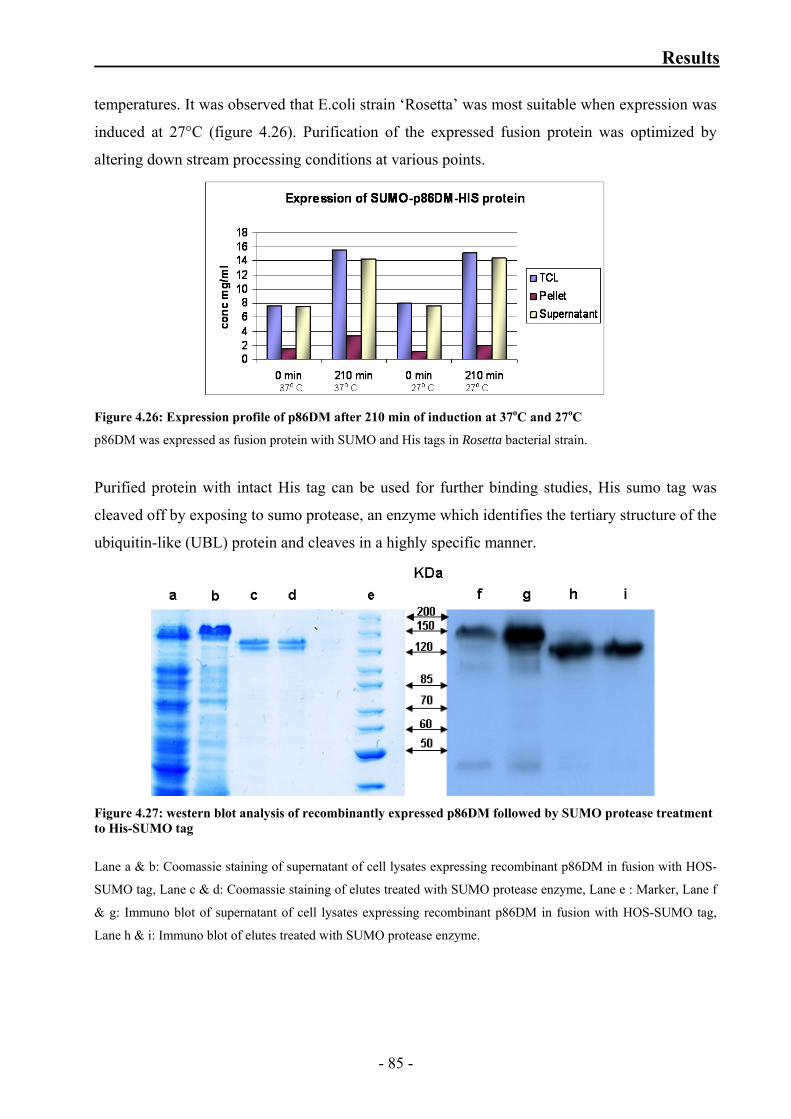
Results
temperatures. It was observed that E.coli strain ‘Rosetta’ was most suitable when expression was
induced at 27°C (figure 4.26). Purification of the expressed fusion protein was optimized by
altering down stream processing conditions at various points.
Figure 4.26: Expression profile of p86DM after 210 min of induction at 37oC and 27oC
p86DM was expressed as fusion protein with SUMO and His tags in Rosetta bacterial strain.
Purified protein with intact His tag can be used for further binding studies, His sumo tag was
cleaved off by exposing to sumo protease, an enzyme which identifies the tertiary structure of the
ubiquitin-like (UBL) protein and cleaves in a highly specific manner.
Figure 4.27: western blot analysis of recombinantly expressed p86DM followed by SUMO protease treatment to His-SUMO tag
Lane a & b: Coomassie staining of supernatant of cell lysates expressing recombinant p86DM in fusion with HOS-
SUMO tag, Lane c & d: Coomassie staining of elutes treated with SUMO protease enzyme, Lane e : Marker, Lane f
& g: Immuno blot of supernatant of cell lysates expressing recombinant p86DM in fusion with HOS-SUMO tag,
Lane h & i: Immuno blot of elutes treated with SUMO protease enzyme.
- 85 -
5. Discussion In order to understand how keratins act at the molecular level and how mutations in keratins
cause pathological alterations, it is essential to have an in-depth understanding of keratin
structure and its associated proteins. At the start of the work done in this thesis, very few keratin-
associated proteins were known, including the structural proteins desmoplakin, filaggrin and
plectin. The major work was to identify keratin-associated proteins which might act together
with keratins to execute its actions beyond maintenance of cyctoarchitecture and might provide
insight to molecular mechanisms responsible for functions of keratins in normal and diseased
keratinocytes.
Keratins, being the major intermediate filament proteins of epithelia, display an outstanding
degree of molecular diversity. The 54 human keratin genes which have been identified till date
are expressed in highly specific patterns related to epithelial and stage of cellular differentiation,
major of them being restricted to various compartments of hair follicles.
In the present study major focus was on epidermal keratins, K5 and K14.
K5 and K14 are expressed in the undifferentiated basal keratinocytes of stratified epithelium
(Fuchs and Green, 1980), stratified follicular outer root sheath, basal and myoepithelial cells of
complex glandular epithelial tissue (Purkis et al., 1990). During the process of terminal
differentiation, expression of K5 and K14 is downregulated and a new set of keratins, K1 and
K10 are expressed in the suprabasal spinous layer (Byrne et al., 1994). Most important function
of K5 and K14 is to provide mechanical stability to epithelial cells and apart from this, these
keratins have shown to be involved in other functions like vesicle transport. Mutations in genes
encoding K5 and K14 lead to several skin disorders like Epidermolysis bullosa simplex (EBS),
Naegeli-Franceschetti-Jadassohn syndrome (NFJS), Dermatopathia pigmentosa reticularis (DPR)
and Dowling-Degos Disease (DDD). Thereby it raises the need for a detailed study in order to
reveal the functions of keratins and keratin associated proteins, during physiological and
pathological situations.
A closer look at the diseases caused due to mutations in K5 and K14 reveals that more disorders
arise from mutation in K5 than from K14 and certain disorders like Dowling-Degos Disease
(DDD) arise from K5 but not from K14, and disorder Recessive EBS-WC arises from due to
mutated K14. This raises the question whether in a pair, both partners have the same function.
- 86 -
Discussion
In order to verify keratin-associated proteins, we have performed screening studies cDNA library
constructed with 500,000 cDNA fragments isolated rom human skin sample. These fragments
were inserted randomly in yeast expression vector.
The screening was done using a novel genetic screening method ‘Sos recruitment system’’ in
which the proteins like transcriptional activators/repressors, proteins that require post
translational modification in the cytoplasm and the proteins /protein complex that are toxic to
yeast can be identified which is not possible in the former Y2H screening techniques.
In this system, temperature sensitive yeast strain S.cerevisiae which carries mutated CDC45
gene, a homolog of human Sos protein. Bait is expressed as hSos fusion protein and prey is
expressed as Myr fusion protein – myristylation signal containing gene. Upon physical
interaction between the bait and the prey, anchors hSos to membrane there by activating the Ras
signalling pathway which in turn enables the yeast to grow at restrictive temperature 37oC.
All keratins have similar domain structure with a α-helical rod, flanked by non-helical head and
tail domains. Type I and type II keratins form obligatory heterodimers via their highly conserved
rod domains among different of keratins which are interrupted by non-α-helical linker
sequences. The positively charged head domain permits the formation of filaments via
antiparallel tetramers, while tail regulates the lateral association of individual filaments into
bundles.
A significant similarity of 70% in the amino acid sequence was observed between the rod
domains of stratified epithelial keratins K5/K14 with their embryonic and simple epithelial
keratins K8/K18, where as sequences of head tail domains share only about 30%.
To get an insight into the differential properties of different keratin domains, head, rod and tail
domains of K5 and K14 were individually expressed as fusion proteins with hSos and co-
transformed along with cDNA library fragment containing pMyr.
The putative positive interacting candidates, which were isolated in the preliminary screening
procedure, were confirmed for the interaction in yeast by replica plating on to the selective media
followed by incubation at restrictive temperature.
More than 2400 interacting candidates were confirmed by yeast two hybrid screening were
obtained from screening of 6 domains in-total of K5 and K14.
The purified plasmid DNA of these interacting yeast colonies was sequenced followed by
bioinformatics analysis to identify the interacting candidates. Few of them are listed in the results
section table 4.4 and table 4.5
- 87 -
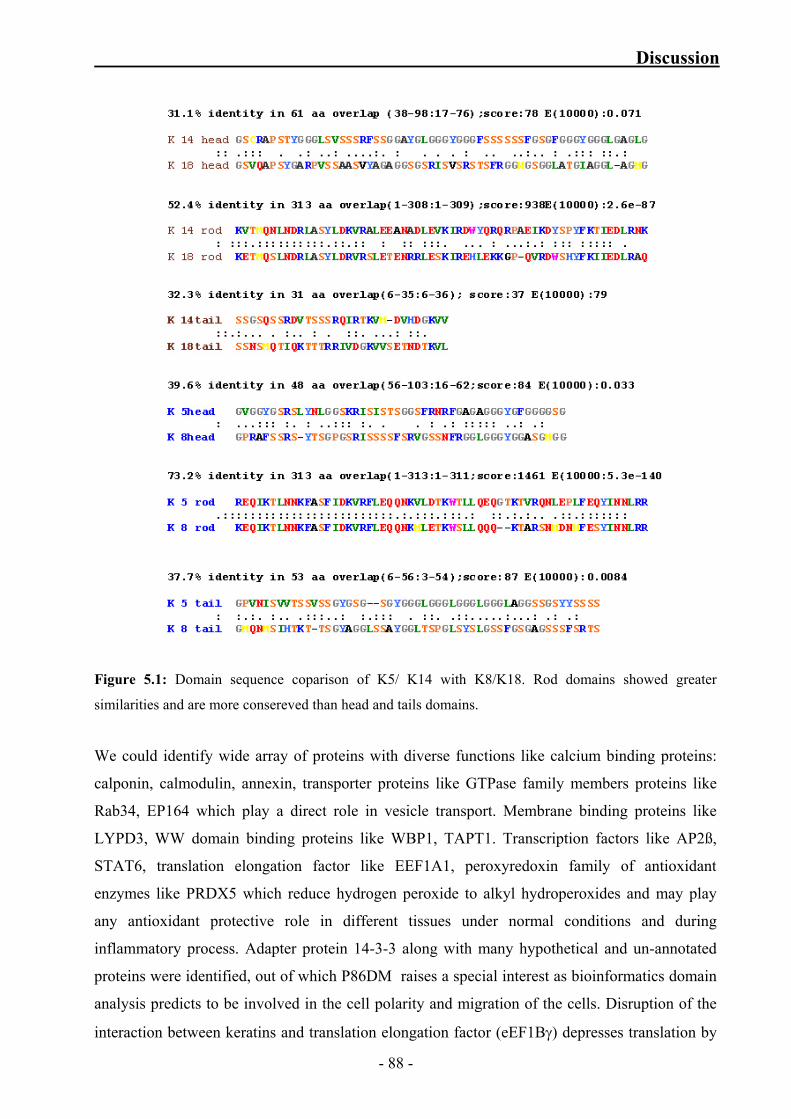
Discussion
Figure 5.1: Domain sequence coparison of K5/ K14 with K8/K18. Rod domains showed greater
similarities and are more consereved than head and tails domains.
We could identify wide array of proteins with diverse functions like calcium binding proteins:
calponin, calmodulin, annexin, transporter proteins like GTPase family members proteins like
Rab34, EP164 which play a direct role in vesicle transport. Membrane binding proteins like
LYPD3, WW domain binding proteins like WBP1, TAPT1. Transcription factors like AP2ß,
STAT6, translation elongation factor like EEF1A1, peroxyredoxin family of antioxidant
enzymes like PRDX5 which reduce hydrogen peroxide to alkyl hydroperoxides and may play
any antioxidant protective role in different tissues under normal conditions and during
inflammatory process. Adapter protein 14-3-3 along with many hypothetical and un-annotated
proteins were identified, out of which P86DM raises a special interest as bioinformatics domain
analysis predicts to be involved in the cell polarity and migration of the cells. Disruption of the
interaction between keratins and translation elongation factor (eEF1Bγ) depresses translation by
- 88 -
Discussion
20% with the selective increase of 80S ribosomes in epithelial cells, which establish that the
keratin cytoskeleton and protein synthesis machinery are functionally integrated (Kim et al.,
2007).
Among the 40 listed candidates, RAB34, 14-3-3 theta, AP2β and P86DM were selected for
further analysis and confirmation of their interaction with keratins in mammalian cell culture
system.
To confirm the interaction in the mammalian cell system, bimolecular fluorescence
complementation (BiFC) technique was used, which is based on the principle of formation of a
mature fluorescent YFP from the two non-fluorescent fragments of YFP which are fused with the
proteins whose interaction has to be studied. The physical interaction of the two proteins brings
together the non-fluorescent fragments of YFP and forms a functionally active fluorescent
complex. This method detects the direct physical interactions and has the advantage that
autofluorescence reveals the confirmation of interaction thereby rendering the staining of cells
non-essential.
- 89 -
Discussion
Keratins and 14-3-3τ
Using ‘Sos recruitment system’ Theta isoform of 14-3-3 family of proteins has been identified as
one of the interacting candidate with K14 head domain.
14-3-3 proteins were first described in the brain (Moore and Perez, 1967) and include seven
members (β, γ, , η, σ, τ and ζ) that range in size between 28 and 33 kDa. 14-3-3 proteins are
important regulators which are involved in many cellular processes like cell cycle regulation
(Bridges and Moorhead, 2004; Hermeking, 2003; Hermeking and Benzinger, 2006) signal
transduction and stress response (Fu et al., 1994; Yoshida et al., 2005), apoptosis (Datta et al.,
2000), transcriptional regulation (Brunet et al., 2002), co-ordination of cell adhesion and motility
(Santoro et al., 2003).
14-3-3 proteins regulate many cellular processes by binding to phosphorylated sites in diverse
target proteins (Tzivion and Avruch, 2002). In general interaction of 14-3-3 proteins with target
proteins is generally mediated through two canonical 14-3-3-binding motifs RSXpS/TXP or
RXXXpS/TXP sequences, in which ‘X’ denotes ‘any amino acid residue’ and pS/T is
phosphorylated (Yaffe, 2004).
To confirm the interaction between K14 and 14-3-3τ , bimolecular fluorescence
complementation technique (BiFC) which allows visualizing the direct interactions was used.
Upon co-transfection of Venus-tagged 14-3-3τ and K14 cDNAs into MCF-7 mammary epithelial
cells, no fluorescence signal was observed which hinted towards absence of direct interaction
between K14 and 14-3-3τ.
But it has been shown that 14-3-3 family proteins bind to keratin 18 in phosphorylation
dependent manner with the mandatory phosphorylation of Ser33 for the association. Moreover
the interaction of K18 with 14-3-3 proteins was observed only under induced
hyperphosphorylated conditions by subjecting the transfected cells to heat or ocadiac acid
treatment (Ku et al., 1998; Liao and Omary, 1996).
In the present study experimental settings with minimal deviation from normal physiological
conditions were used to detect interaction between K14 and 14-3-3τ. It is possible that the
stoichiometry of basal phosphorylation might be low in the cells studied here, which might be
acting as a limiting factor for the interaction of the transfected Venus tagged K14 and 14-3-
3τ proteins.
- 90 -
Discussion
Keratins and Rab34
With the growing list of keratin-based genetic diseases hint at the role of keratins in skin
pigmentation. EBS with mottled pigmentation (EBS-MP) is a rare EBS subtype, giving the skin
a mottled appearance exhibiting hyper / hypo-pigmented skin. Until recently, all cases of EBS-
MP had been linked to a single missense allele, P25L, in K5 (Uttam et al., 1996), which no
longer might be true, since a missense mutation in the a-helical rod domain of K14, M119T
(Harel et al., 2006), as well as the 1649delG mutation in K5 were reported with telltale signs of
EBS-MP (Horiguchi et al., 2005). Patients suffering from EBS-MCE develop hyper- or hypo-
pigmented patches as adults (Gu et al., 2003). Dowling-Degos disease (DDD) is typified by
reticulate hyperpigmentation along with dark hyperkeratotic papules in skin known to be caused
because of K5 haploinsufficiency (Betz et al., 2006). Naegeli–Franceschetti–Jadassohn
syndrome caused by mutations located early in the head domain of K14 (Lugassy et al., 2006)
causes mottled hyperpigmentation of the skin. Although the mechanism remains unclear,
evidence supporting a novel role for keratin proteins in regulating skin pigmentation reveals that
premature stop codons in the K5 gene affect melanosome distribution in keratinocytes (Betz et
al., 2006; Liao et al., 2007). Also genetic mouse models with chemically induced mutations
identify involvement of keratins in coat color determination (Fitch et al., 2003; McGowan et al.,
2006; McGowan et al., 2007).
With all the above findings pointing towards the disturbed redistribution of melanosomes in skin,
it becomes very important and interesting to understand the underlying mechanism in uptake of
melanin granules packed in membrane-bound organelles termed ‘melanosomes’ from
melanocytes - a neural-crest-derived, highly dendritic cell type to the neighboring keratinocytes
and redistribution in keratinocytes. One hypothesis for melanosome uptake is endocytotic
process and the redistribution through various transporter / motor proteins.
In the process of identifying keratin associated proteins, we have identified the protein Rab34 a
member of small GTPases of ras superfamily as interacting partner of K14 head domain using
Sos recruitment system.
Rab proteins are small GTPases of the ras superfamily that confer timing and target specificity to
vesicle budding, tethering, docking, fusion, play essential roles in the endocytic and exocytic
processes of transport vesicle formation within the eukaryotic secretory and endosomal pathways
(Segev, 2001; Somsel Rodman and Wandinger-Ness, 2000; Zerial and McBride, 2001). They
thus ensure accurate delivery of cargo macromolecules to the right target organelle. Most
mammalian rabs are broadly expressed and regulate membrane transport between ubiquitous
- 91 -
Discussion
compartments, such as endoplasmic reticulum and the golgi apparatus. However, certain cell
types in higher eukaryotes harbor additional unique organelles that carry out tissue-specific
functions. The best characterized are so-called lysosome-related organelles, which include
melanosomes, the pigment organelle of melanocytes and of pigment epithelia in the eye. These
proteins are also associated with particular vesicle membrane compartments and function in
specific stages of the diverse vesicle trafficking events.
Rab34 is a 29-kDa protein present both in the cytosol and in the Golgi apparatus. Rab34 is
present in the Golgi apparatus and cytosol (Wang and Hong, 2005) and it interacts with Rab7-
interacting lysosomal protein (RILP) to regulate the morphology and spatial distribution of
lysosomes(Wang and Hong, 2002). Rab34 is involved in the regulation of lysosome
morphogenesis through cooperation with the dynein–dynactin complex (Jordens et al., 2001)
Rab34 plays a crucial role in facilitating the formation of macropinosomes from the membrane
ruffles (Wang and Hong, 2005). Rab34 is colocalized with actin to the membrane ruffles and
macropinosome membrane (Sun et al., 2003). During macropinocytosis, Rab34 is associated
with nascent macropinosomes and replaced by Rab5 at later stages. Overexpression of Rab34
elevates the number of macropinosomes, whereas the expression of a dominant-negative Rab34
prevents macropinosome formation induced by platelet-derived growth factor (PDGF) or PMA.
The direct interaction between Rab34 and K14 in the mammalian cell system was confirmed
using bimolecular fluorescence complementation (BiFC) in cytoplasm of human MCF-7 cells.
Non fluorescent fragments of Venus were tagged to Rab34 and K14 cDNAs. Upon co-
transfection into MCF-7 mammary epithelial cells, a direct physical interaction between the two
proteins was observed in the form of autofluorescence emitted by the reconstituted mature YFP
(Figure: 4.15). In endogenously keratin expressing MCF-7 cells K14 gets incorporated with the
other type II keratins like K8/K9 to form the filamentous structure (Planko et al., 2007; Werner
et al., 2004). Control transfections with empty vectors revealed no interaction, demonstrating the
specificity of the interaction.
These data strongly suggest that Rab34 a member of transporter protein family directly interacts
with K14. Understanding the significance of this interaction and further in-depth studies might
definitely help in knowing process of import and regulation of melanosome by keratinocytes.
- 92 -
Discussion
Keratins and AP-2β
The transcription factor family AP-2 consists of upto five members which are known to exhibit a
highly homologous structure. AP-2 proteins form homo- or hetero-dimers with other AP-2
family members and bind specific DNA sequences. They are thought to stimulate cell
proliferation and suppress terminal differentiation of specific cell types during embryonic
development. Specific AP-2 family members differ in their expression patterns and binding
affinity for different promoters. This protein functions as both a transcriptional activator and
repressor, however their functions are considered to be different (Eckert et al., 2005). In skin AP-
2β is expressed in the basal layer while AP-2β is restricted to the sweat glands and AP-2γ is
found in basal, spinous and granular layers (Byrne et al., 1994; Oyama et al., 2002; Panteleyev et
al., 2003; Takahashi et al., 2000).
A role of AP-2 in epidermal differentiation is substantiated by studies of embryonic and adult
skin in Xenopus demonstrate that the keratin gene-regulatory factor KTF-1 is identical with or
closely related to AP-2 (Snape et al., 1991; Winning et al., 1991). This factor, also known as
KER1 from human keratinocytes, is involved in regulation of keratin gene promoters during
epidermal differentiation (Leask et al., 1991). The keratin proteins K1, K5, K10 and K14 as well
as the EGFR which play a critical role in epidermal development and differentiation have been
shown to harbor functional AP-2 binding sites in their promoters (Byrne et al., 1994; Koster et
al., 2006; Leask et al., 1991; Maytin et al., 1999; Wang et al., 1997). Analysis of murine
embryonic skin development revealed that AP-2 mRNA is expressed in a pattern similar to, but
preceding that of basal keratin mRNAs (Byrne et al., 1994). Most recently, the conditional
ablation of both AP-2α and γ has demonstrated their major role in terminal differentiation in skin
epidermis (Wang et al., 2008).
The 5 members of the AP-2 family of helix-span-helix transcription factors determine the cell-
type-restricted proliferation and the suppression of terminal differentiation of epithelia and
additional tissues. Regulation of activity of AP-2 proteins still not well known.
All together more than 50 different type I and type II keratins form the major cytoskeleton of
epithelial cells and are differentially expressed in all epithelia, creating protein scaffolds with
unique properties. In addition to their well-established function as cytoskeletal scaffolds in
epithelia, the disruption of which affects cytoarchitecture, recent papers have been reported
establishing novel and unexpected keratin functions in cell proliferation, growth, survival and
organelle transport.
- 93 -
Discussion
In the yeast two hybrid screening for keratin associated proteins, we have isolated a clone
encoding for the transcription factor AP-2β as a binding partner for the K14 head domain. Full
length AP-2β cDNA was provided by Prof. Dr. Hubert Schorle, Bonn, was used for the further
experiments.
The direct interaction between AP-2β and K14 was confirmed using bimolecular fluorescence
complementation (BiFC), in the cytoplasm of human MCF-7 cells.
Upon co-transfection of Venus-tagged AP-2β and K14 cDNAs into MCF-7 mammary epithelial
cells, a strong interaction between the two proteins was apparent that was highly reminiscent of
staining these cells with a keratin antibody (Figure: 4.12). In fact, MCF-7 cells form an extensive
cytoskeleton from endogenous keratins in which K14 becomes incorporated following
transfection(Planko et al., 2007; Werner et al., 2004). Control transfections with empty vectors
revealed no interaction, demonstrating the specificity of the interaction. These data strongly
suggest that AP-2β is sequestered in the cytoplasm by interaction with K14.
In eukaryotes, transcription factors (like most proteins) are transcribed in the nucleus but are then
translated in the cell's cytoplasm. Many proteins that are active in the nucleus contain nuclear
localization signals that direct them to the nucleus. But for many transcription factors this is a
key point in their regulation. Important classes of transcription factors such as some nuclear
receptors must first bind to a ligand while in the cytoplasm before they can relocate to the
nucleus.
We hypothesize that sequestration by distinct keratins represents a novel mechanism to regulate
the activity of AP-2 transcription factors.
AP-2β can be a potential drug target as therapeutic agent in treatment of cancer (Deng et al.,
2007). It has been validated as direct target gene mediating the anti-apoptotic function of
PAX3/FKHR with a well known oncogenic role (Ebauer et al., 2007). AP-2 has been implicated
to play a role in carcinogenesis, as well as in the development of the kidney. AP-2β expression
was observed in the low-stage subtypes of renal cell carcinoma (Oya et al., 2004). AP-2β is
reported to be a promising target for treatment of type 2 diabetes where it is known to regulate
adipocytokine gene expression contribute to the pathogenesis of type 2 diabetes through
regulation of adipocytokine gene expression, and that AP-2β may be a promising target for
treatment or prevention of this disease (Maeda et al., 2005; Tsukada et al., 2006).
To understand and to elucidate the functional role of interaction between K14 and AP-2β , it
becomes important to look for the molecular mechanism for the long-proposed scaffolding role
of keratins and the signalling pathways regulate the AP-2β – K14 interaction.
- 94 -
Discussion
Analysis of p86DM
We have isolated an unannotated protein as keratin associated protein using a genetic screening
method ‘Sos recruitment system’ in yeast. We found this protein as interacting partner with K14
head and rod domain. Unfortunately the effort to prove its direct interaction with K14 in
mammalian cell culture system using BiFC was not successful. At present, it appears that
p86DM does not directly interact with K14, based on a number of experiments carried out by
others in the lab.
p86DM still being unannotated in the database and sequence analysis of p86DM using
bioinformatics tools predicted interesting functions like role in endocytosis, migration and
regulation of tight junctions with relevant domains in its sequence. The predicted protein carries
an N-terminal 14-3-3 binding site, SH2 and SH3 motifs, a clathrin-heavy chain binding site, a
coiled-coil domain and a C-terminal PDZ-binding site, a domain organization similar to that of
TJ-associated proteins.
These factors (see above) made us to select this protein for further investigation despite being not
successful to identify the direct interaction in mammalian cells as the indirect interaction with
functional significance cannot be ruled out.
Bioinformatics analysis predicted a single transcript giving rise to an open reading frame of 776
amino acids in the mouse and 5 isoforms for human p86DM gene. To verify whether p86DM is
encoded by a single functional gene, total RNA was isolated from Caco-2 cells, full length
cDNA was obtained by performing RT-PCR using the different set of primers according to the
predicted isoforms with a coding sequence of 2337bp located in between exon 4 and exon 9. The
multiple length cDNAs obtained by RT-PCR were sequenced and their analysis showed
existence of a single functional gene for p86DM in cultured Caco-2 cells.
In order to gain a first insight on the potential mechanism by which p86DM may act, in an
independent experiment (Wester.A and Magin.T.M) β-actin was identified as one of the p86DM
associated proteins.
Immunofluorescence anylaysis in cultured epithelial cells demonstrated that at the apical
plasmam membrane P86DM colocalized with actin at tight junctions (personal communication
with Wester.A and Magin.T.M). The eukaryotic actin cytoskeleton has an important role in
remarkable diverse processes, including cell migration, endocytosis, vesicle traffiking and
cytokinesis, many of which are essential for survival of the cell (Goley and Welch, 2006). The
dynamic assembly and disassembly of actin filaments and the formation of larger scale filament
- 95 -
Discussion
structures are crucial aspects of actin’s function, and are therefore under scrupulous control by
over a hundred actin-binding proteins.
To investigate the interaction of p86DM with candidate proteins, its interaction with actin was
investigated further. For this purpose we once again used BiFC technique which has successfully
demonstrated the direct interactions between two proteins in previous experiments. Full length
actin and p86DM were tagged with the non-fluorescent fragments of Venus-YFP, upon
cotransfection in MCF-7 cells, autofluorescence as a result of formation of mature YFP revealed
the interaction between actin and p86DM (Figure: 4.22). The cotransfected cells were stained for
actin and p86DM, their staining profile and the images (Figure: 4.25) further supported the
results obtained from BiFC experiment thereby confirming the interaction between actin and
p86DM.
To carry out the further functional studies for p86DM, recombinant protein was expressed in E.
coli with the SUMO-His tag (Figure: 4.27), which will be used in the further functional studies.
The purified protein which has been cleaved off from SUMO-His tag, can be used for structural
analysis and to raise p86DM specific monoclonal antibody.
Based on the preliminary set of results from the functional studies, p86DM enjoys the status of a
promising candidate and requires thorough investigation to reveal the importance of its direct
interaction with actin which might be involved in the local regulation of actin organization.
- 96 -
6. Summary
Keratins are an integral and important constituent of the epithelial cytoskeleton and protect
epithelial cells against stress. In addition to their well-established function as cytoskeletal
scaffolds in epithelia, recent findings have revealed that beyond maintenance of cytoarchitecture,
keratins play important role in cell proliferation, growth, survival and organelle transport along
with its associated proteins. To understand these novel keratin functions and to address the
molecular mechanisms, the identification of keratin-associated proteins was a major prerequisite.
The aim of the present study was to find novel keratin associated proteins that might provide
missing links. To this end, screening for the KAPs was carried out by a genetic approach ‘Sos
recruitment’ technique based on temperature sensitive selection of positive interacting candidates
in yeast to isolate K5 and K14 interacting proteins. As the first step, cDNA library was
constructed with 500,000 cDNA fragments (size ranging from 500 bp to 4 kb) isolated from
human skin sample. Yeast-two-hybrid screen was performed using head, rod and tail domains of
epidermal keratins K5 and K14 as baits against cDNA library.
Screening in yeast yielded more than 2400 interacting candidates, out of which 200 selected
cDNA fragments were sequenced.
It was observed that proteins affiliated with diverse functions seem to interact with K5 and K14.
To name a few, small GTPase family members proteins (Rab34, EP164), membrane binding
proteins (LYPD3), WW domain binding proteins (WBP1, TAPT1 etc), transcription factors
(AP2β, STAT6), translation elongation factor (EEF1A1), 14-3-3theta a member of 14-3-3 family
proteins along with many hypothetical and un-annotated proteins like p86DM were identified as
interacting partners.
K14 head domain interacting candidates ‘Rab34’ a small GTPase of the ras superfamily reported
to be involved in the regulation of lysosome morphogenesis (Jordens et al., 2001) and in
formation of macropinosomes (Wang and Hong, 2005), regulator protein ‘14-3-3 theta’,
transcription factor ‘AP2-β’ a member AP-2 family of helix-span-helix transcription factors
which determine the cell-type-restricted proliferation and the suppression of terminal
differentiation of epithelia and additional tissues, and the anannotated protein ‘p86DM’ were
selected for further analysis.
A direct interaction of full length K14 with AP-2β, and Rab34 was confirmed in cytoplasm of
mammary epithelial MCF-7 cells by bimolecular fluorescence complementation (BiFC)
technique.
97
Summary
These results strongly suggest:
1. Ras-related protein Rab-34 belonging to small GTPase Rab family directly interacts with
K14. Understanding the significance of this interaction and further in-depth studies might
definitely help in knowing process of import and regulation of melanosome by keratinocytes.
2. Direct interaction between K14 with AP-2β strongly suggests that AP-2β is sequestered in
the cytoplasm by interaction with K14 and can be hypothesized that sequestration by distinct
keratins represents a novel mechanism to regulate the activity of AP-2 transcription factors.
3. Preliminary set of results from the functional studies of p86DM displayed encouraging
results and thus can be considered as a promising candidate and requires thorough
investigation to reveal the importance of its direct interaction with actin.
It is worthwhile to note that, for the first time a detailed screen has been undertaken to identify
keratin-associated proteins and less than 10% of the candidates obtained from Y2H screen have
been sequenced so far. Further analysis of the already identified proteins and identifying the
preserved un-sequenced samples will be beneficial towards understanding the molecular
mechanism of keratin regulated functions.
98
References
References 1. Ameen, N. A., Figueroa, Y., and Salas, P. J. (2001). Anomalous apical plasma membrane
phenotype in CK8-deficient mice indicates a novel role for intermediate filaments in the
polarization of simple epithelia. J Cell Sci 114, 563-575.
2. Apodaca, G., Katz, L. A., and Mostov, K. E. (1994). Receptor-mediated transcytosis of IgA in
MDCK cells is via apical recycling endosomes. J Cell Biol 125, 67-86.
3. Aronheim, A., Engelberg, D., Li, N., al-Alawi, N., Schlessinger, J., and Karin, M. (1994).
Membrane targeting of the nucleotide exchange factor Sos is sufficient for activating the Ras
signaling pathway. Cell 78, 949-961.
4. Auerbach, D., Thaminy, S., Hottiger, M. O., and Stagljar, I. (2002). The post-genomic era of
interactive proteomics: facts and perspectives. Proteomics 2, 611-623.
5. Beil, M., Micoulet, A., von Wichert, G., Paschke, S., Walther, P., Omary, M. B., Van
Veldhoven, P. P., Gern, U., Wolff-Hieber, E., Eggermann, J., et al. (2003).
Sphingosylphosphorylcholine regulates keratin network architecture and visco-elastic
properties of human cancer cells. Nat Cell Biol 5, 803-811.
6. Betz, R. C., Planko, L., Eigelshoven, S., Hanneken, S., Pasternack, S. M., Bussow, H., Van
Den Bogaert, K., Wenzel, J., Braun-Falco, M., Rutten, A., et al. (2006). Loss-of-function
mutations in the keratin 5 gene lead to Dowling-Degos disease. Am J Hum Genet 78, 510-519.
7. Bierkamp, C., McLaughlin, K. J., Schwarz, H., Huber, O., and Kemler, R. (1996). Embryonic
heart and skin defects in mice lacking plakoglobin. Dev Biol 180, 780-785.
8. Blouin, R., Kawahara, H., French, S. W., and Marceau, N. (1990). Selective accumulation of
IF proteins at a focal juxtanuclear site in COS-1 cells transfected with mouse keratin 18
cDNA. Exp Cell Res 187, 234-242.
9. Bretscher, A., Edwards, K., and Fehon, R. G. (2002). ERM proteins and merlin: integrators at
the cell cortex. Nat Rev Mol Cell Biol 3, 586-599.
10. Bridges, D., and Moorhead, G. B. (2004). 14-3-3 proteins: a number of functions for a
numbered protein. Sci STKE 2004, re10.
11. Brunet, A., Kanai, F., Stehn, J., Xu, J., Sarbassova, D., Frangioni, J. V., Dalal, S. N.,
DeCaprio, J. A., Greenberg, M. E., and Yaffe, M. B. (2002). 14-3-3 transits to the nucleus and
participates in dynamic nucleocytoplasmic transport. J Cell Biol 156, 817-828.
12. Byers, H. R., Maheshwary, S., Amodeo, D. M., and Dykstra, S. G. (2003). Role of
cytoplasmic dynein in perinuclear aggregation of phagocytosed melanosomes and
supranuclear melanin cap formation in human keratinocytes. J Invest Dermatol 121, 813-820.
13. Byrne, C., Tainsky, M., and Fuchs, E. (1994). Programming gene expression in developing
epidermis. Development 120, 2369-2383.
- 99 -
References
14. Cadrin, M., Hovington, H., Marceau, N., and McFarlane-Anderson, N. (2000). Early
perturbations in keratin and actin gene expression and fibrillar organisation in griseofulvin-fed
mouse liver. J Hepatol 33, 199-207.
15. Caldelari, R., de Bruin, A., Baumann, D., Suter, M. M., Bierkamp, C., Balmer, V., and Muller,
E. (2001). A central role for the armadillo protein plakoglobin in the autoimmune disease
pemphigus vulgaris. J Cell Biol 153, 823-834.
16. Caulin, C., Ware, C. F., Magin, T. M., and Oshima, R. G. (2000). Keratin-dependent,
epithelial resistance to tumor necrosis factor-induced apoptosis. J Cell Biol 149, 17-22.
17. Chang, L., and Goldman, R. D. (2004). Intermediate filaments mediate cytoskeletal crosstalk.
Nat Rev Mol Cell Biol 5, 601-613.
18. Choi, H. J., Park-Snyder, S., Pascoe, L. T., Green, K. J., and Weis, W. I. (2002). Structures of
two intermediate filament-binding fragments of desmoplakin reveal a unique repeat motif
structure. Nat Struct Biol 9, 612-620.
19. Choi, K. Y., Satterberg, B., Lyons, D. M., and Elion, E. A. (1994). Ste5 tethers multiple
protein kinases in the MAP kinase cascade required for mating in S. cerevisiae. Cell 78, 499-
512.
20. Corden, L. D., and McLean, W. H. (1996). Human keratin diseases: hereditary fragility of
specific epithelial tissues. Exp Dermatol 5, 297-307.
21. Datta, S. R., Katsov, A., Hu, L., Petros, A., Fesik, S. W., Yaffe, M. B., and Greenberg, M. E.
(2000). 14-3-3 proteins and survival kinases cooperate to inactivate BAD by BH3 domain
phosphorylation. Mol Cell 6, 41-51.
22. Deng, W. G., Jayachandran, G., Wu, G., Xu, K., Roth, J. A., and Ji, L. (2007). Tumor-specific
activation of human telomerase reverses transcriptase promoter activity by activating
enhancer-binding protein-2beta in human lung cancer cells. J Biol Chem 282, 26460-26470.
23. Denk, H., Stumptner, C., and Zatloukal, K. (2000). Mallory bodies revisited. J Hepatol 32,
689-702.
24. Drewes, G., and Bouwmeester, T. (2003). Global approaches to protein-protein interactions.
Curr Opin Cell Biol 15, 199-205.
25. Ebauer, M., Wachtel, M., Niggli, F. K., and Schafer, B. W. (2007). Comparative expression
profiling identifies an in vivo target gene signature with TFAP2B as a mediator of the survival
function of PAX3/FKHR. Oncogene 26, 7267-7281.
26. Eckert, D., Buhl, S., Weber, S., Jager, R., and Schorle, H. (2005). The AP-2 family of
transcription factors. Genome Biol 6, 246.
27. Fields, S., and Song, O. (1989). A novel genetic system to detect protein-protein interactions.
Nature 340, 245-246.
- 100 -
References
28. Figueroa, Y., Wald, F. A., and Salas, P. J. (2002). p34cdc2-mediated phosphorylation
mobilizes microtubule-organizing centers from the apical intermediate filament scaffold in
CACO-2 epithelial cells. J Biol Chem 277, 37848-37854.
29. Fitch, K. R., McGowan, K. A., van Raamsdonk, C. D., Fuchs, H., Lee, D., Puech, A., Herault,
Y., Threadgill, D. W., Hrabe de Angelis, M., and Barsh, G. S. (2003). Genetics of dark skin in
mice. Genes Dev 17, 214-228.
30. Freedberg, I. M., Tomic-Canic, M., Komine, M., and Blumenberg, M. (2001). Keratins and
the keratinocyte activation cycle. J Invest Dermatol 116, 633-640.
31. Fu, H., Xia, K., Pallas, D. C., Cui, C., Conroy, K., Narsimhan, R. P., Mamon, H., Collier, R.
J., and Roberts, T. M. (1994). Interaction of the protein kinase Raf-1 with 14-3-3 proteins.
Science 266, 126-129.
32. Fuchs, E. (1996). The cytoskeleton and disease: genetic disorders of intermediate filaments.
Annu Rev Genet 30, 197-231.
33. Fuchs, E., and Green, H. (1980). Changes in keratin gene expression during terminal
differentiation of the keratinocyte. Cell 19, 1033-1042.
34. Garrod, D., and Chidgey, M. (2008). Desmosome structure, composition and function.
Biochim Biophys Acta 1778, 572-587.
35. Geisler, N., Kaufmann, E., and Weber, K. (1985). Antiparallel orientation of the two double-
stranded coiled-coils in the tetrameric protofilament unit of intermediate filaments. J Mol Biol
182, 173-177.
36. Goley, E. D., and Welch, M. D. (2006). The ARP2/3 complex: an actin nucleator comes of
age. Nat Rev Mol Cell Biol 7, 713-726.
37. Gu, L. H., Kim, S. C., Ichiki, Y., Park, J., Nagai, M., and Kitajima, Y. (2003). A usual
frameshift and delayed termination codon mutation in keratin 5 causes a novel type of
epidermolysis bullosa simplex with migratory circinate erythema. J Invest Dermatol 121, 482-
485.
38. Guggino, W. B., and Stanton, B. A. (2006). New insights into cystic fibrosis: molecular
switches that regulate CFTR. Nat Rev Mol Cell Biol 7, 426-436.
39. Harel, A., Bergman, R., Indelman, M., and Sprecher, E. (2006). Epidermolysis bullosa
simplex with mottled pigmentation resulting from a recurrent mutation in KRT14. J Invest
Dermatol 126, 1654-1657.
40. Helfand, B. T., Chang, L., and Goldman, R. D. (2004). Intermediate filaments are dynamic
and motile elements of cellular architecture. J Cell Sci 117, 133-141.
41. Hermeking, H. (2003). The 14-3-3 cancer connection. Nat Rev Cancer 3, 931-943.
42. Hermeking, H., and Benzinger, A. (2006). 14-3-3 proteins in cell cycle regulation. Semin
Cancer Biol 16, 183-192.
- 101 -
References
43. Herrmann, H., Strelkov, S. V., Feja, B., Rogers, K. R., Brettel, M., Lustig, A., Haner, M.,
Parry, D. A., Steinert, P. M., Burkhard, P., and Aebi, U. (2000). The intermediate filament
protein consensus motif of helix 2B: its atomic structure and contribution to assembly. J Mol
Biol 298, 817-832.
44. Hesse, M., Franz, T., Tamai, Y., Taketo, M. M., and Magin, T. M. (2000). Targeted deletion
of keratins 18 and 19 leads to trophoblast fragility and early embryonic lethality. Embo J 19,
5060-5070.
45. Hesse, M., Magin, T. M., and Weber, K. (2001). Genes for intermediate filament proteins and
the draft sequence of the human genome: novel keratin genes and a surprisingly high number
of pseudogenes related to keratin genes 8 and 18. J Cell Sci 114, 2569-2575.
46. Horiguchi, Y., Sawamura, D., Mori, R., Nakamura, H., Takahashi, K., and Shimizu, H.
(2005). Clinical heterogeneity of 1649delG mutation in the tail domain of keratin 5: a
Japanese family with epidermolysis bullosa simplex with mottled pigmentation. J Invest
Dermatol 125, 83-85.
47. Huen, A. C., Park, J. K., Godsel, L. M., Chen, X., Bannon, L. J., Amargo, E. V., Hudson, T.
Y., Mongiu, A. K., Leigh, I. M., Kelsell, D. P., et al. (2002). Intermediate filament-membrane
attachments function synergistically with actin-dependent contacts to regulate intercellular
adhesive strength. J Cell Biol 159, 1005-1017.
48. Irvine, A. D., and McLean, W. H. (1999). Human keratin diseases: the increasing spectrum of
disease and subtlety of the phenotype-genotype correlation. Br J Dermatol 140, 815-828.
49. Ishida-Yamamoto, A., Tanaka, H., Nakane, H., Takahashi, H., and Iizuka, H. (1998). Inherited
disorders of epidermal keratinization. J Dermatol Sci 18, 139-154.
50. Jaquemar, D., Kupriyanov, S., Wankell, M., Avis, J., Benirschke, K., Baribault, H., and
Oshima, R. G. (2003). Keratin 8 protection of placental barrier function. J Cell Biol 161, 749-
756.
51. Jordens, I., Fernandez-Borja, M., Marsman, M., Dusseljee, S., Janssen, L., Calafat, J., Janssen,
H., Wubbolts, R., and Neefjes, J. (2001). The Rab7 effector protein RILP controls lysosomal
transport by inducing the recruitment of dynein-dynactin motors. Curr Biol 11, 1680-1685.
52. Kim, S., Kellner, J., Lee, C. H., and Coulombe, P. A. (2007). Interaction between the keratin
cytoskeleton and eEF1Bgamma affects protein synthesis in epithelial cells. Nat Struct Mol
Biol 14, 982-983.
53. Kirfel, J., Magin, T. M., and Reichelt, J. (2003). Keratins: a structural scaffold with emerging
functions. Cell Mol Life Sci 60, 56-71.
54. Kischkel, F. C., Hellbardt, S., Behrmann, I., Germer, M., Pawlita, M., Krammer, P. H., and
Peter, M. E. (1995). Cytotoxicity-dependent APO-1 (Fas/CD95)-associated proteins form a
death-inducing signaling complex (DISC) with the receptor. Embo J 14, 5579-5588.
- 102 -
References
55. Koster, M. I., Kim, S., Huang, J., Williams, T., and Roop, D. R. (2006). TAp63alpha induces
AP-2gamma as an early event in epidermal morphogenesis. Dev Biol 289, 253-261.
56. Kowalczyk, A. P., Bornslaeger, E. A., Borgwardt, J. E., Palka, H. L., Dhaliwal, A. S.,
Corcoran, C. M., Denning, M. F., and Green, K. J. (1997). The amino-terminal domain of
desmoplakin binds to plakoglobin and clusters desmosomal cadherin-plakoglobin complexes.
J Cell Biol 139, 773-784.
57. Ku, N. O., Fu, H., and Omary, M. B. (2004). Raf-1 activation disrupts its binding to keratins
during cell stress. J Cell Biol 166, 479-485.
58. Ku, N. O., Gish, R., Wright, T. L., and Omary, M. B. (2001). Keratin 8 mutations in patients
with cryptogenic liver disease. N Engl J Med 344, 1580-1587.
59. Ku, N. O., Liao, J., and Omary, M. B. (1998). Phosphorylation of human keratin 18 serine 33
regulates binding to 14-3-3 proteins. Embo J 17, 1892-1906.
60. Ku, N. O., and Omary, M. B. (2006). A disease- and phosphorylation-related nonmechanical
function for keratin 8. J Cell Biol 174, 115-125.
61. Ku, N. O., Soetikno, R. M., and Omary, M. B. (2003). Keratin mutation in transgenic mice
predisposes to Fas but not TNF-induced apoptosis and massive liver injury. Hepatology 37,
1006-1014.
62. Ku, N. O., Zhou, X., Toivola, D. M., and Omary, M. B. (1999). The cytoskeleton of digestive
epithelia in health and disease. Am J Physiol 277, G1108-1137.
63. Lane, E. B., and McLean, W. H. (2004). Keratins and skin disorders. J Pathol 204, 355-366.
64. Langbein, L., and Schweizer, J. (2005). Keratins of the human hair follicle. Int Rev Cytol 243,
1-78.
65. Leask, A., Byrne, C., and Fuchs, E. (1991). Transcription factor AP2 and its role in epidermal-
specific gene expression. Proc Natl Acad Sci U S A 88, 7948-7952.
66. Liao, H., Zhao, Y., Baty, D. U., McGrath, J. A., Mellerio, J. E., and McLean, W. H. (2007). A
heterozygous frameshift mutation in the V1 domain of keratin 5 in a family with Dowling-
Degos disease. J Invest Dermatol 127, 298-300.
67. Liao, J., and Omary, M. B. (1996). 14-3-3 proteins associate with phosphorylated simple
epithelial keratins during cell cycle progression and act as a solubility cofactor. J Cell Biol
133, 345-357.
68. Lugassy, J., Itin, P., Ishida-Yamamoto, A., Holland, K., Huson, S., Geiger, D., Hennies, H. C.,
Indelman, M., Bercovich, D., Uitto, J., et al. (2006). Naegeli-Franceschetti-Jadassohn
syndrome and dermatopathia pigmentosa reticularis: two allelic ectodermal dysplasias caused
by dominant mutations in KRT14. Am J Hum Genet 79, 724-730.
69. Maeda, S., Tsukada, S., Kanazawa, A., Sekine, A., Tsunoda, T., Koya, D., Maegawa, H.,
Kashiwagi, A., Babazono, T., Matsuda, M., et al. (2005). Genetic variations in the gene
encoding TFAP2B are associated with type 2 diabetes mellitus. J Hum Genet 50, 283-292.
- 103 -
References
70. Magin, T. M., Reichelt, J., and Hatzfeld, M. (2004). Emerging functions: diseases and animal
models reshape our view of the cytoskeleton. Exp Cell Res 301, 91-102.
71. Magin, T. M., Schroder, R., Leitgeb, S., Wanninger, F., Zatloukal, K., Grund, C., and Melton,
D. W. (1998). Lessons from keratin 18 knockout mice: formation of novel keratin filaments,
secondary loss of keratin 7 and accumulation of liver-specific keratin 8-positive aggregates. J
Cell Biol 140, 1441-1451.
72. Marks, M. S., and Seabra, M. C. (2001). The melanosome: membrane dynamics in black and
white. Nat Rev Mol Cell Biol 2, 738-748.
73. Mathur, M., Goodwin, L., and Cowin, P. (1994). Interactions of the cytoplasmic domain of the
desmosomal cadherin Dsg1 with plakoglobin. J Biol Chem 269, 14075-14080.
74. Maytin, E. V., Lin, J. C., Krishnamurthy, R., Batchvarova, N., Ron, D., Mitchell, P. J., and
Habener, J. F. (1999). Keratin 10 gene expression during differentiation of mouse epidermis
requires transcription factors C/EBP and AP-2. Dev Biol 216, 164-181.
75. Mazzalupo, S., Wong, P., Martin, P., and Coulombe, P. A. (2003). Role for keratins 6 and 17
during wound closure in embryonic mouse skin. Dev Dyn 226, 356-365.
76. McGowan, K. A., Aradhya, S., Fuchs, H., de Angelis, M. H., and Barsh, G. S. (2006). A
mouse keratin 1 mutation causes dark skin and epidermolytic hyperkeratosis. J Invest
Dermatol 126, 1013-1016.
77. McGowan, K. A., Fuchs, H., Hrabe de Angelis, M., and Barsh, G. S. (2007). Identification of
a Keratin 4 mutation in a chemically induced mouse mutant that models white sponge nevus. J
Invest Dermatol 127, 60-64.
78. Meads, T., and Schroer, T. A. (1995). Polarity and nucleation of microtubules in polarized
epithelial cells. Cell Motil Cytoskeleton 32, 273-288.
79. Moll, R., Franke, W. W., Schiller, D. L., Geiger, B., and Krepler, R. (1982). The catalog of
human cytokeratins: patterns of expression in normal epithelia, tumors and cultured cells. Cell
31, 11-24.
80. Mulari, M. T., Patrikainen, L., Kaisto, T., Metsikko, K., Salo, J. J., and Vaananen, H. K.
(2003). The architecture of microtubular network and Golgi orientation in osteoclasts--major
differences between avian and mammalian species. Exp Cell Res 285, 221-235.
81. Oya, M., Mikami, S., Mizuno, R., Miyajima, A., Horiguchi, Y., Nakashima, J., Marumo, K.,
Mukai, M., and Murai, M. (2004). Differential expression of activator protein-2 isoforms in
renal cell carcinoma. Urology 64, 162-167.
82. Oyama, N., Takahashi, H., Tojo, M., Iwatsuki, K., Iizuka, H., Nakamura, K., Homma, Y., and
Kaneko, F. (2002). Different properties of three isoforms (alpha, beta, and gamma) of
transcription factor AP-2 in the expression of human keratinocyte genes. Arch Dermatol Res
294, 273-280.
- 104 -
References
83. Paladini, R. D., Takahashi, K., Bravo, N. S., and Coulombe, P. A. (1996). Onset of re-
epithelialization after skin injury correlates with a reorganization of keratin filaments in
wound edge keratinocytes: defining a potential role for keratin 16. J Cell Biol 132, 381-397.
84. Panteleyev, A. A., Mitchell, P. J., Paus, R., and Christiano, A. M. (2003). Expression patterns
of the transcription factor AP-2alpha during hair follicle morphogenesis and cycling. J Invest
Dermatol 121, 13-19.
85. Parry, D. A., Steven, A. C., and Steinert, P. M. (1985). The coiled-coil molecules of
intermediate filaments consist of two parallel chains in exact axial register. Biochem Biophys
Res Commun 127, 1012-1018.
86. Planko, L., Bohse, K., Hohfeld, J., Betz, R. C., Hanneken, S., Eigelshoven, S., Kruse, R.,
Nothen, M. M., and Magin, T. M. (2007). Identification of a keratin-associated protein with a
putative role in vesicle transport. Eur J Cell Biol 86, 827-839.
87. Porter, R. M., and Lane, E. B. (2003). Phenotypes, genotypes and their contribution to
understanding keratin function. Trends Genet 19, 278-285.
88. Purkis, P. E., Steel, J. B., Mackenzie, I. C., Nathrath, W. B., Leigh, I. M., and Lane, E. B.
(1990). Antibody markers of basal cells in complex epithelia. J Cell Sci 97 (Pt 1), 39-50.
89. Rugg, E. L., and Leigh, I. M. (2004). The keratins and their disorders. Am J Med Genet C
Semin Med Genet 131C, 4-11.
90. Ryan, D. P., and Matthews, J. M. (2005). Protein-protein interactions in human disease. Curr
Opin Struct Biol 15, 441-446.
91. Salas, P. J. (1999). Insoluble gamma-tubulin-containing structures are anchored to the apical
network of intermediate filaments in polarized CACO-2 epithelial cells. J Cell Biol 146, 645-
658.
92. Santoro, M. M., Gaudino, G., and Marchisio, P. C. (2003). The MSP receptor regulates
alpha6beta4 and alpha3beta1 integrins via 14-3-3 proteins in keratinocyte migration. Dev Cell
5, 257-271.
93. Schweizer, J., Bowden, P. E., Coulombe, P. A., Langbein, L., Lane, E. B., Magin, T. M.,
Maltais, L., Omary, M. B., Parry, D. A., Rogers, M. A., and Wright, M. W. (2006). New
consensus nomenclature for mammalian keratins. J Cell Biol 174, 169-174.
94. Segev, N. (2001). Ypt and Rab GTPases: insight into functions through novel interactions.
Curr Opin Cell Biol 13, 500-511.
95. Sinha, S., Degenstein, L., Copenhaver, C., and Fuchs, E. (2000). Defining the regulatory
factors required for epidermal gene expression. Mol Cell Biol 20, 2543-2555.
96. Sinha, S., and Fuchs, E. (2001). Identification and dissection of an enhancer controlling
epithelial gene expression in skin. Proc Natl Acad Sci U S A 98, 2455-2460.
97. Smith, E. A., and Fuchs, E. (1998). Defining the interactions between intermediate filaments
and desmosomes. J Cell Biol 141, 1229-1241.
- 105 -
References
98. Smith, F. (2003). The molecular genetics of keratin disorders. Am J Clin Dermatol 4, 347-364.
99. Snape, A. M., Winning, R. S., and Sargent, T. D. (1991). Transcription factor AP-2 is tissue-
specific in Xenopus and is closely related or identical to keratin transcription factor 1 (KTF-1).
Development 113, 283-293.
100. Somsel Rodman, J., and Wandinger-Ness, A. (2000). Rab GTPases coordinate endocytosis. J
Cell Sci 113 Pt 2, 183-192.
101. Stappenbeck, T. S., Lamb, J. A., Corcoran, C. M., and Green, K. J. (1994). Phosphorylation of
the desmoplakin COOH terminus negatively regulates its interaction with keratin intermediate
filament networks. J Biol Chem 269, 29351-29354.
102. Steinert, P. M. (1990). The two-chain coiled-coil molecule of native epidermal keratin
intermediate filaments is a type I-type II heterodimer. J Biol Chem 265, 8766-8774.
103. Steinert, P. M., North, A. C., and Parry, D. A. (1994). Structural features of keratin
intermediate filaments. J Invest Dermatol 103, 19S-24S.
104. Strelkov, S. V., Herrmann, H., Geisler, N., Wedig, T., Zimbelmann, R., Aebi, U., and
Burkhard, P. (2002). Conserved segments 1A and 2B of the intermediate filament dimer: their
atomic structures and role in filament assembly. Embo J 21, 1255-1266.
105. Sun, P., Yamamoto, H., Suetsugu, S., Miki, H., Takenawa, T., and Endo, T. (2003). Small
GTPase Rah/Rab34 is associated with membrane ruffles and macropinosomes and promotes
macropinosome formation. J Biol Chem 278, 4063-4071.
106. Takahashi, H., Oyama, N., Itoh, Y., Ishida-Yamamoto, A., Kaneko, F., and Iizuka, H. (2000).
Transcriptional factor AP-2gamma increases human cystatin A gene transcription of
keratinocytes. Biochem Biophys Res Commun 278, 719-723.
107. Takahashi, K., Coulombe, P. A., and Miyachi, Y. (1999). Using transgenic models to study
the pathogenesis of keratin-based inherited skin diseases. J Dermatol Sci 21, 73-95.
108. Tamai, Y., Ishikawa, T., Bosl, M. R., Mori, M., Nozaki, M., Baribault, H., Oshima, R. G., and
Taketo, M. M. (2000). Cytokeratins 8 and 19 in the mouse placental development. J Cell Biol
151, 563-572.
109. Tao, G. Z., Toivola, D. M., Zhou, Q., Strnad, P., Xu, B., Michie, S. A., and Omary, M. B.
(2006). Protein phosphatase-2A associates with and dephosphorylates keratin 8 after
hyposmotic stress in a site- and cell-specific manner. J Cell Sci 119, 1425-1432.
110. Toivola, D. M., Baribault, H., Magin, T., Michie, S. A., and Omary, M. B. (2000). Simple
epithelial keratins are dispensable for cytoprotection in two pancreatitis models. Am J Physiol
Gastrointest Liver Physiol 279, G1343-1354.
111. Tsukada, S., Tanaka, Y., Maegawa, H., Kashiwagi, A., Kawamori, R., and Maeda, S. (2006).
Intronic polymorphisms within TFAP2B regulate transcriptional activity and affect
adipocytokine gene expression in differentiated adipocytes. Mol Endocrinol 20, 1104-1111.
- 106 -
References
112. Tzivion, G., and Avruch, J. (2002). 14-3-3 proteins: active cofactors in cellular regulation by
serine/threonine phosphorylation. J Biol Chem 277, 3061-3064.
113. Uttam, J., Hutton, E., Coulombe, P. A., Anton-Lamprecht, I., Yu, Q. C., Gedde-Dahl, T., Jr.,
Fine, J. D., and Fuchs, E. (1996). The genetic basis of epidermolysis bullosa simplex with
mottled pigmentation. Proc Natl Acad Sci U S A 93, 9079-9084.
114. Vasioukhin, V., Bowers, E., Bauer, C., Degenstein, L., and Fuchs, E. (2001). Desmoplakin is
essential in epidermal sheet formation. Nat Cell Biol 3, 1076-1085.
115. Wald, F. A., Oriolo, A. S., Casanova, M. L., and Salas, P. J. (2005). Intermediate filaments
interact with dormant ezrin in intestinal epithelial cells. Mol Biol Cell 16, 4096-4107.
116. Wang, D., Shin, T. H., and Kudlow, J. E. (1997). Transcription factor AP-2 controls
transcription of the human transforming growth factor-alpha gene. J Biol Chem 272, 14244-
14250.
117. Wang, T., and Hong, W. (2002). Interorganellar regulation of lysosome positioning by the
Golgi apparatus through Rab34 interaction with Rab-interacting lysosomal protein. Mol Biol
Cell 13, 4317-4332.
118. Wang, T., and Hong, W. (2005). Assay and functional properties of Rab34 interaction with
RILP in lysosome morphogenesis. Methods Enzymol 403, 675-687.
119. Wang, X., Pasolli, H. A., Williams, T., and Fuchs, E. (2008). AP-2 factors act in concert with
Notch to orchestrate terminal differentiation in skin epidermis. J Cell Biol 183, 37-48.
120. Wells, J. A., and McClendon, C. L. (2007). Reaching for high-hanging fruit in drug discovery
at protein-protein interfaces. Nature 450, 1001-1009.
121. Werner, N. S., Windoffer, R., Strnad, P., Grund, C., Leube, R. E., and Magin, T. M. (2004).
Epidermolysis bullosa simplex-type mutations alter the dynamics of the keratin cytoskeleton
and reveal a contribution of actin to the transport of keratin subunits. Mol Biol Cell 15, 990-
1002.
122. Wilson, A. K., Coulombe, P. A., and Fuchs, E. (1992). The roles of K5 and K14 head, tail,
and R/K L L E G E domains in keratin filament assembly in vitro. J Cell Biol 119, 401-414.
123. Winning, R. S., Shea, L. J., Marcus, S. J., and Sargent, T. D. (1991). Developmental
regulation of transcription factor AP-2 during Xenopus laevis embryogenesis. Nucleic Acids
Res 19, 3709-3714.
124. Wojcik, S. M., Bundman, D. S., and Roop, D. R. (2000). Delayed wound healing in keratin 6a
knockout mice. Mol Cell Biol 20, 5248-5255.
125. Wong, P., Colucci-Guyon, E., Takahashi, K., Gu, C., Babinet, C., and Coulombe, P. A.
(2000). Introducing a null mutation in the mouse K6alpha and K6beta genes reveals their
essential structural role in the oral mucosa. J Cell Biol 150, 921-928.
126. Wong, P., and Coulombe, P. A. (2003). Loss of keratin 6 (K6) proteins reveals a function for
intermediate filaments during wound repair. J Cell Biol 163, 327-337.
- 107 -
References
127. Yin, T., Getsios, S., Caldelari, R., Kowalczyk, A. P., Muller, E. J., Jones, J. C., and Green, K.
J. (2005). Plakoglobin suppresses keratinocyte motility through both cell-cell adhesion-
dependent and -independent mechanisms. Proc Natl Acad Sci U S A 102, 5420-5425.
128. Yoshida, K., Yamaguchi, T., Natsume, T., Kufe, D., and Miki, Y. (2005). JNK
phosphorylation of 14-3-3 proteins regulates nuclear targeting of c-Abl in the apoptotic
response to DNA damage. Nat Cell Biol 7, 278-285.
129. Zatloukal, K., Stumptner, C., Lehner, M., Denk, H., Baribault, H., Eshkind, L. G., and Franke,
W. W. (2000). Cytokeratin 8 protects from hepatotoxicity, and its ratio to cytokeratin 18
determines the ability of hepatocytes to form Mallory bodies. Am J Pathol 156, 1263-1274.
130. Zerial, M., and McBride, H. (2001). Rab proteins as membrane organizers. Nat Rev Mol Cell
Biol 2, 107-117.
131. Zhong, B., Zhou, Q., Toivola, D. M., Tao, G. Z., Resurreccion, E. Z., and Omary, M. B.
(2004). Organ-specific stress induces mouse pancreatic keratin overexpression in association
with NF-kappaB activation. J Cell Sci 117, 1709-1719.
- 108 -
PROJECTS
1. Identification and characterization of novel keratin associated proteins using a genetic interaction screening system Institue of Physiological chemistry
Guide : Prof. Thomas M. Magin
Brief project profile: Cell architecture is mainly based on the interaction of cytoskeletal proteins, which include intermediate filaments, micro filaments, microtubules as well as type-specific membrane attachment structures and associated proteins. Keratin 5 and keratin 14 form the major intermediate filaments of basal epidermis, their primary function is to impart mechanical strength to cells as highlighted by the dominant mutations causing inherited skin disorders. In order to understand the molecular mechanism of keratin dependent functions, we intend to identify novel keratin associated proteins.
Yeast two hybrid screen was performed using K5 and K14 as bait against a cDNA library prepared from human skin tissue. From the six baits used about 2000 positive interacting candidates were obtained, which included anticipated transporter proteins along with some unexpected and un-annotated proteins.
Among the different methods tested to confirm the interaction between positive candidates from the screen and keratins, bimolecular fluorescence complementation (Bifc) was found to be the most suitable method and thus was used to confirm the interaction for some of the short listed candidates. At present further functional studies are being carried out for characterization of some of the selected interacting candidates identified by screening experiments.
2. Evaluation of estrogenic activity using MCF -7 human breast cancer cells
Natural Remedies Ltd., Bangalore, INDIA. Team size: 1
Brief project profile:
This project is focused on discovering the potent phytoestrogens from the herbal extracts.
Estrogenic activity is determined using an estrogen-dependent MCF-7 breast cancer cell
proliferation assay.
3. Nitric oxide scavenging activity in freshly isolated macrophages
Natural Remedies Ltd., Bangalore, INDIA. Team size: 1
Brief project profile:
A mixture of water extracts of certain medicinal plants is being investigated for the nitric oxide
scavenging activity in freshly isolated macrophages from the peritoneal cavity of mice. The nitric
oxide release is stimulated using lipopolysaccharide (LPS) & the extract mixture is being tested
for its scavenging activity by a microtitre plate assay method based on Griess reaction.
4. Evaluation of anti-hyperglycemic effect of herbal extracts through the inhibition of intestinal
enzymes in normal rats.
Natural Remedies Ltd., Bangalore, INDIA. Team size: 1
Brief project profile:
We examined the inhibitory effects of different herbal extracts on starch and sucrose loading
induced hyperglycemia in normal Wistar rats. Blood glucose level was estimated at different
intervals after the carbohydrate loading to examine the inhibitory activity of the test extracts on
disaccharidases in the small intestine of rats.
5. Evaluation of anti stress property by swim endurance test
Natural Remedies Ltd., Bangalore, INDIA. Team size: 1
Brief project profile:
The anti stress property of the herbal extracts was tested on Swiss albino mice, exposed to swim
endurance test model of stress. Positive control compound and the test extracts were administered
orally for 30 days. Reactivity of the mice, loss in body weight, length of endurance and incidence
of mortality were graded and measured.
6. Method Development For Isolation And Purification Of HBsAg Protein
Yashraj Biotechnology Ltd., New Bombay, INDIA.
Brief project profile:
The project involves the method development for isolation & purification of the diagnostically
important proteins (HBsAg, Cancer antigens) from the biological fluids of human origin, scale-up
to production process & the study of stability properties of the purified proteins.
7. Tool for finding ORF in a nucleotide sequence. Manvish InfoTech Ltd, Bangalore, INDIA,. Guide: Dr. Raja Mugasimangalam. Team size: 3 Brief project profile: A tool was developed using C programming language, to locate the Open Reading Frames (ORF) and its position in the original nucleotide sequence, along with six frame translations. The results obtained from this tool were similar to that of the currently available online tools. As a useful analytical tool, it also provided the percentage GC content. This utility is a useful and fast way to translate a sequence in combination with ORF analysis.
8. In-vitro and in-vivo investigation on the hepatoprotective activity of certain medicinal plants. J.S.S College of Pharmacy, Ooty, Guides :Dr.P.Vijayan. Team size: 1 Brief project profile:
The methanolic extracts of the root, root bark and stem of Berberis tinctoria, ethanolic extract of whole plant of Phyllanthus amarus and the total alkaloids isolated from the leaves of Solanum pseudocapsicum were investigated for its hepatoprotective activity against CCl4 induced toxicity in freshly isolated rat hepatocytes, HepG2 cell line in-vitro and in animal models. The extracts were able to normalise the levels of ASAT, ALAT, ALP, TGL, total proteins, albumin, total bilirubin and direct bilirubin which were altered due to CCl4 intoxication in freshly isolated rat hepatocytes and also in animal models.
9. Comparative cytotoxic studies of synthetic drugs in established cell lines and primary culture. J.S.S College of Pharmacy, Ooty, Guide : Dr. P. Vijayan & Ms. Sarita G.S Team size : 2 Brief project profile: Eight drugs belonging to pyridine & mannich bases were selected for systematic screening for
cytotoxicity as a means of identifying potential anti-tumor drug moieties. Long-term cytotoxicity
studies were performed on HEp-2 and Vero cell lines and mouse lung & kidney primary cultures.
The cytotoxic effect of all the eight drugs was estimated by dye exclusion, protein synthesis
estimation and MTT assay methods. All studies confirmed that the drug activity was significant
only at very high concentration.
COMPUTER KNOWLEDGE
• Windows, Linux, MS Office
• Working knowledge in C, HTML, ORACLE • Working knowledge of Bioinformatics related software and tools like EMBOSS, GCG, Vector
NTI, ClustalW, FASTA, BLAST, SCOP, FUGUE, J-Pred, 3DPSSM, PDB-BLAST, Swiss-Model, SwissPDB Viewer, PDB tool, RASMOL, Pfam.
PUBLICATIONS • Comparative cytotoxic studies of synthetic drugs in established cell lines and primary culture,
paper accepted for presentation at 52nd IPC held at Hyderabad. • Hepatoprotective effect of the alkaloid fraction of Solanum pseudocapsicum leaves,
Pharmaceutical Biology –2003; 41: 443 - 448 • The cytotoxic activity of the total alkaloids isolated from different parts of Solanum
pseudocapsicum, Biol Pharm Bull. 2004 Apr;27(4):528-30.