Embed Size (px)
Citation preview
Identification of fission fragments from tracks measured by the FDC1
S. Reichert,∗1,∗2 M. Sako,∗2 M. Sasano,∗2 D. Mucher,∗1,∗2 A. Andreyev,∗3 T. Aumann,∗4 H. Baba,∗2
M. Bohmer,∗1 M. Dozono,∗5 N. Fukuda,∗2 R. Gernhauser,∗1 W. F. Henning,∗6 K. Hirose,∗3
N. Inabe,∗2 D. Kameda,∗2 N. Kobayashi,∗2 T. Kobayashi,∗7 Y. Kondo,∗8 T. Kubo,∗2 Y. Kubota,∗2,∗5 R. Lang,∗1
L. Maier,∗1 Y. Matsuda,∗9 S. Mitsuoka,∗4 T. Motobayashi,∗2 T. Nakamura,∗8 N. Nakatsuka,∗9 S. Nishimura,∗2
I. Nishinaka,∗3 K. Nishio,∗3 R. Orlandi,∗3 H. Otsu,∗2 V. Panin,∗2 S. Sakaguchi,∗2 H. Sato,∗2 Y. Shimizu,∗2
L. Stuhl,∗2 T. Sumikama,∗2 H. Suzuki,∗2 H. Takeda,∗2 Y. Togano,∗2 T. Uesaka,∗2 J. Yasuda,∗2 K. Yoneda,∗2
and J. Zenihiro∗2
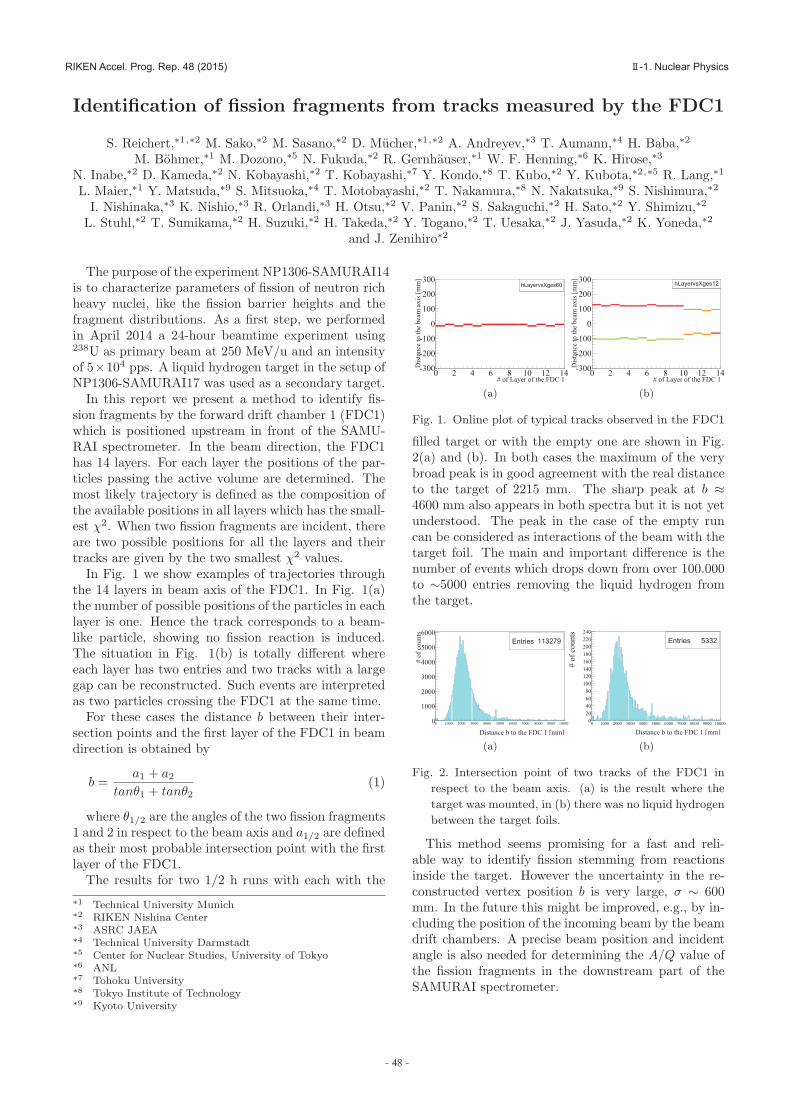
The purpose of the experiment NP1306-SAMURAI14is to characterize parameters of fission of neutron richheavy nuclei, like the fission barrier heights and thefragment distributions. As a first step, we performedin April 2014 a 24-hour beamtime experiment using238U as primary beam at 250 MeV/u and an intensityof 5×10⁴ pps. A liquid hydrogen target in the setup ofNP1306-SAMURAI17 was used as a secondary target.In this report we present a method to identify fis-
sion fragments by the forward drift chamber 1 (FDC1)which is positioned upstream in front of the SAMU-RAI spectrometer. In the beam direction, the FDC1has 14 layers. For each layer the positions of the par-ticles passing the active volume are determined. Themost likely trajectory is defined as the composition ofthe available positions in all layers which has the small-est χ2. When two fission fragments are incident, thereare two possible positions for all the layers and theirtracks are given by the two smallest χ2 values.
In Fig. 1 we show examples of trajectories throughthe 14 layers in beam axis of the FDC1. In Fig. 1(a)the number of possible positions of the particles in eachlayer is one. Hence the track corresponds to a beam-like particle, showing no fission reaction is induced.The situation in Fig. 1(b) is totally different whereeach layer has two entries and two tracks with a largegap can be reconstructed. Such events are interpretedas two particles crossing the FDC1 at the same time.For these cases the distance b between their inter-
section points and the first layer of the FDC1 in beamdirection is obtained by
b =a1 + a2
tanθ1 + tanθ2(1)
where θ1/2 are the angles of the two fission fragments1 and 2 in respect to the beam axis and a1/2 are definedas their most probable intersection point with the firstlayer of the FDC1.The results for two 1/2 h runs with each with the
∗1 Technical University Munich∗2 RIKEN Nishina Center∗3 ASRC JAEA∗4 Technical University Darmstadt∗5 Center for Nuclear Studies, University of Tokyo∗6 ANL∗7 Tohoku University∗8 Tokyo Institute of Technology∗9 Kyoto University
# of Layer of the FDC 10 2 4 6 8 10 12 14
Dis
tanc
e to
the
beam
axi
s [m
m]
-300
-200
-100
0
100
200
300hLayervsXges60hLayervsXges60
(a)
# of Layer of the FDC 10 2 4 6 8 10 12 14
Dis
tanc
e to
the
beam
axi
s [m
m]
-300
-200
-100
0
100
200
300 hLayervsXges12hLayervsXges12
(b)
Fig. 1. Online plot of typical tracks observed in the FDC1
filled target or with the empty one are shown in Fig.2(a) and (b). In both cases the maximum of the verybroad peak is in good agreement with the real distanceto the target of 2215 mm. The sharp peak at b ≈4600 mm also appears in both spectra but it is not yetunderstood. The peak in the case of the empty runcan be considered as interactions of the beam with thetarget foil. The main and important difference is thenumber of events which drops down from over 100.000to ∼5000 entries removing the liquid hydrogen fromthe target.
Entries 113279
Distance b to the FDC 1 [mm]0 1000 2000 3000 4000 5000 6000 7000 8000 9000 10000
# of
cou
nts
0
1000
2000
3000
4000
5000
6000Entries 113279
(a)
Entries 5332
Distance b to the FDC 1 [mm]0 1000 2000 3000 4000 5000 6000 7000 8000 9000 10000
# of
cou
nts
020406080
100120140160180200220240
Entries 5332
(b)
Fig. 2. Intersection point of two tracks of the FDC1 in
respect to the beam axis. (a) is the result where the
target was mounted, in (b) there was no liquid hydrogen
between the target foils.
This method seems promising for a fast and reli-able way to identify fission stemming from reactionsinside the target. However the uncertainty in the re-constructed vertex position b is very large, σ ∼ 600mm. In the future this might be improved, e.g., by in-cluding the position of the incoming beam by the beamdrift chambers. A precise beam position and incidentangle is also needed for determining the A/Q value ofthe fission fragments in the downstream part of theSAMURAI spectrometer.
Analysis status of the experiment on fission associated with the(p,2p) reaction with 238U beam
M. Sako,∗1 S. Reichert,∗1,∗2 M. Sasano,∗1 D. Mucher,∗2 A. Andreyev,∗3 T. Aumann,∗4 H. Baba,∗1 M. Bohmer,∗2
M. Dozono,∗5 N. Fukuda,∗1 R. Gernhaeuser,∗2 W. F. Henning,∗6 K. Hirose,∗3 N. Inabe,∗1 D. Kameda,∗1
N. Kobayashi,∗1 T. Kobayashi,∗7 Y. Kondo,∗8 T. Kubo,∗1 Y. Kubota,∗1,∗5 R. Lang,∗2 L. Meier,∗2 Y. Matsuda,∗9
S. Mitsuoka,∗4 T. Motobayashi,∗1 T. Nakamura,∗8 N. Nakatsuka,∗1,∗9 S. Nishimura,∗1 I. Nishinaka,∗3
K. Nishio,∗3 R. Orlandi,∗3 H. Otsu,∗1 V. Panin,∗1 S. Sakaguchi,∗7 H. Sato,∗1 Y. Shimizu,∗1 L. Stuhl,∗1
T. Sumikama,∗1 H. Suzuki,∗1 H. Takeda,∗1 Y. Togano,∗8 T. Uesaka,∗1 J. Yasuda,∗1,∗10 K. Yoneda,∗1 andJ. Zenihiro∗1
Our experimental program NP1306-SAMURAI141)
is the first attempt to determine fission barrier heightfor neutron-rich heavy nuclei such as 212Bi or 213Po.In this experiment, we use missing mass spectroscopyto determine the excitation energy of the fissioning nu-cleus produced by the (p,2p) reaction in combinationwith the SAMURAI spectrometer.
In this report, we show preliminary results of dataanalysis for the test experiment performed using a pri-mary 238U beam with a typical intensity of 5×10⁴ ppsand at a beam energy of 250A MeV.Liquid hydrogenwith a 10-mm thickness was used as the secondary tar-get to study the proton induced (p,2p) reaction.
Figure 1(a) shows the layout of the experimentalsetup in the downstream part of the SAMURAI spec-trometer2,3): the forward drift chamber 2 (FDC2),the ion chamber for fragment (ICF), the hodoscope(HODS), and the total energy detector (TED). HODShas seven slats of plastic scintillators. Here, we la-bel the slats with IDs from 0 (lower rigidity side) to 6(higher rigidity side). TED is an array of 8 × 4 CsIcrystals, labeled from 0 to 7 corresponding to HODSfor the second row from the bottom side.
Figure 1(b) shows the energy deposition for the slatID = 1 in HODS without any constraint on the HODSmultiplicity, while Fig. 1(c) is constrained by mul-tiplicity = 2. A peak around 3000 ch in Fig. 1(b)corresponds to 238U beam, which disappears with themultiplicity gate. A bump structure around 1000 chcorresponds to fission fragments in Fig. 1(c).
Figure 2 shows two-dimensional histograms of the∆E-E correlation for fission fragments. Slats ID = 1(left) and 6 (right) in HODS are selected for ∆E, whilethe crustal ID = 1 and 6 are selected for total E. Themultiplicity gate is applied to Fig. 2 (b) and (d). Thetest experiment was successful to measure the fissionfragments associated with the (p,2p) reaction.
∗1 RIKEN Nishina Center∗2 Technical University Munich∗3 ASRC JAEA∗4 Technical University Darmstadt∗5 Center for Nuclear Studies, University of Tokyo∗6 ANL∗7 Tohoku University∗8 Tokyo Institute of Technology∗9 Department of Physics,Kyoto University∗10 Department of Physics,Kyushu University
(a)
1
10
210
310 (b)
0 2000 4000
1
10
(c)
Num
ber o
f Cou
nts
ADC of ID = 1 in HODS (ch)
Fig. 1. (a)Layout of the experimental setup of the SAMU-
RAI downstream detectors. The energy deposition
(ADC) of slat ID = 1 in the HODS without (b) and
with (c) multiplicity gate for slat ID = 1 and 6.
2000
4000 (a)
0 2000 40000
2000
4000 (b)
AD
C o
f ID
= 1
in T
ED
(ch)
ADC of ID = 1 in HODS (ch)
2000
4000 (c)
0 2000 40000
2000
4000 (d)
AD
C o
f ID
= 6
in T
ED
(ch)
ADC of ID = 6 in HODS (ch)
Fig. 2. ∆E-E correlation for each fission fragment with
ADC between the TED and HODS with slat ID = 1
(left) and 6 (right) without (top) and with (bottom)
the multiplicity gate.
Further analysis will be performed to establish theidentification of mass and charge number for each fis-sion fragment.
References1) D. Mucher, M. Sasano, M. Sako et al.: Proposal RIBF
NP-PAC- 12 Fission Barrier Studies of Neutron-RichNuclei via the (p,2p) Reaction (2013).
2) T. Kobayashi et al.: Nucl. Instr. Meth. B 317, 294,(2013).
3) SAMURAI Magnet and Detectors: http://ribf.
riken.jp/SAMURAI/index.php?ChargedParticleDetector
- 48 - - 49 -
Ⅱ-1. Nuclear Physics RIKEN Accel. Prog. Rep. 48 (2015)RIKEN Accel. Prog. Rep. 48 (2015) Ⅱ-1. Nuclear Physics
完全版2014_本文.indd 48 15/10/16 17:41