Embed Size (px)
Citation preview
Identification of sample mix-ups and mixtures
in microbiome data in Diversity Outbred mice
Alexandra K. Lobo∗, Lindsay L. Traeger†, Mark P. Keller‡, Alan D. Attie‡,
Federico E. Rey†, Karl W. Broman∗,1
Departments of ∗Biostatistics and Medical Informatics, †Bacteriology, and ‡Biochemistry,
University of Wisconsin–Madison, Madison, Wisconsin 53706
2019-02-14
1
Running head: Microbiome mix-ups and mixtures
Key words: data cleaning, quantitative trait loci, multi-parent populations, data diagnostics,
sample mislabeling
1Corresponding author:
Karl W Broman
Department of Biostatistics and Medical Informatics
University of Wisconsin–Madison
2126 Genetics-Biotechnology Center
425 Henry Mall
Madison, WI 53706
Phone: 608–262–4633
Email: [email protected]
2
Abstract
In a Diversity Outbred mouse project with genotype data on 500 mice, including 297 with
microbiome data, we identified three sets of sample mix-ups (two pairs and one trio) as well as at
least 15 microbiome samples that appear to be mixtures of pairs of mice. The microbiome data
consisted of shotgun sequencing reads from fecal DNA, used to characterize the gut microbial
communities present in these mice. These sequence reads included sufficient reads derived from
the host mouse to identify the individual. A number of microbiome samples appeared to contain a
mixture of DNA from two mice. We describe a method for identifying sample mix-ups in such
microbiome data, as well as a method for evaluating sample mixtures in this context.
3
Introduction
Sample mix-ups and other sample mislabelings interfere with our ability to map the genetic
loci affecting complex phenotypes, as the mis-alignment of genotype and phenotype will weaken
associations, reduce power, and give biased estimates of locus effects.
In traditional genetic studies, one has limited ability to detect sample mix-ups. Inconsistencies
between subjects’ sex and X chromosome genotypes may reveal some problems, but one is blind
to most errors. However, in studies that include genome-wide gene expression data, there is an
opportunity to not just identify but also correct sample mix-ups (Westra et al. 2011; Lynch et al.
2012; Broman et al. 2015), as strong local expression quantitative trait loci (eQTL) can be used to
identify individuals.
Studies to identify host loci that affect microbiome population composition could similarly be
affected by sample mix-ups. If the microbiome analysis focuses on a single locus (such as 16S
ribosomal RNA), one would have little ability to detect mix-ups. But when applying shotgun
sequencing to microbiome samples to obtain metagenomic data, there may be sufficient sequence
reads from the host to identify the individual. Fecal samples contain a variable fraction of host
DNA that comes from intestinal epithelial cells. These cells are renewed every 4–5 days
(Eastwood 1977), and dead cell slough off into the lumen and are eliminated in feces.
In a Diversity Outbred (DO) mouse project with genotype data on 500 animals (Keller et al.
2018), including 297 with metagenomic sequencing data from their fecal microbiome, we
identified three sets of sample mix-ups (two pairs and one trio) as well as at least 15 microbiome
samples that appeared to be mixtures of pairs of mice. DO mice (Churchill et al. 2012; Svenson
et al. 2012) are an advanced intercross population derived from eight founder strains (the same
4
founders as the Collaborative Cross; Churchill et al. 2004).
The microbiome data consisted of shotgun sequencing reads from DNA extracted from mouse
feces, in order to characterize the population of microbial functions in the mouse gut. These
sequence reads included sufficient reads derived from the host to identify the individual. A
number of microbiome samples appeared to contain a mixture of DNA from two mice. We
describe a method for identifying sample mix-ups in such microbiome data, as well as a method
for evaluating sample mixtures in this context.
5
Material and Methods
This study was part of a larger study (see Keller et al. 2018) that involved 500 Diversity
Outbred (DO) mice that were obtained in five batches of 100 mice each, from generations 17, 18,
19, 21, and 23. The mice were obtained from the Jackson Laboratories (stock no. 009376) at 4
weeks of age, were maintained on a high fat/high sucrose Western-style diet, and were singly
housed.
Microbiome data
DNA was extracted from the feces of three of the five batches of DO mice (1, 2, and 4). DNA
was isolated as described in Turnbaugh et al. (2009) and Kreznar et al. (2017). Libraries were
prepared for Illumina sequencing according to the methods laid out in McNulty et al. (2011) with
the following alteration: in the gel purification stage, DNA fragments were isolated at ∼450 bp
instead of 200 bp. Paired-end sequencing (2×125) was performed using both MiSeq and Illumina
HiSeq 2500 technologies, to allow for testing libraries before Hiseq runs, and to obtain additional
sequences from under-sequenced samples. Raw reads were demultiplexed using the Fastx Toolkit
(version 0.0.13; Hannon 2010), fastx_barcode_splitter.pl with partial 2 and
mismatch 2. Demultiplexed reads from the same samples that occurred on multiple lanes or
sequencing platforms were concatenated into one forward and one reverse read file. Reads were
then trimmed to remove barcodes (fastx_trimmer -f 9 -Q 33) and for read quality
(fastq_quality_trimmer -t 20 -l 30 -Q33). Trimmed reads files were re-paired
(with unpaired reads removed) using custom perl scripts. Reads were mapped to the mouse
genome using bowtie2 (version 2.2.7; Langmead and Salzberg 2012) with default settings.
6
Host-derived reads were identified using samtools (version 1.3; Li et al. 2009). Three
metagenomic samples did not yield DNA and were excluded from further analysis (DO-148,
DO-182, and DO-202).
SNP genotypes
Mouse genotyping was performed on tail biopsies as described in Svenson et al. (2012), using
the third-generation Mouse Universal Genotyping Array (GigaMUGA; Morgan et al. 2016) at
Neogen (Lincoln, NE). The GigaMUGA array includes 143,259 SNPs. We focused on 110,143
autosomal SNPs that were placed in quality tiers 1 or 2 (out of 4) in Morgan et al. (2016).
We used a hidden Markov model (HMM) to calculate the probability of each of the 36
possible diplotypes (that is, pairs of founder haplotypes) along each chromosome in each DO
mouse, given the multipoint SNP genotype data. We then used a database of genotypes of the
eight founder strains at 33 million SNP variants (based on a resequencing project at Sanger) to get
inferred SNP genotypes for all 500 DO mice at all SNPs. To save computation time, we assumed
constant diplotype probabilities within the intervals between SNPs on the GigaMUGA array and
took the average of the probabilities for the two endpoints as the probabilities within the interval.
We used the founder strains’ SNP genotypes to collapse the 36-state diplotype probabilities to
3-state SNP genotypes. The inferred SNP genotype was that with maximum marginal probability,
provided it was > 0.95. Calculations were performed in R (R Core Team 2018) using R/qtl2
(Broman et al. 2019).
7
Sample mix-ups
For each microbiome sample, we counted the number of reads with each allele at the locations
of the 33 millions SNPs among the eight founder strains. We omitted SNPs that had more than
two alleles among the eight founders. We compared each microbiome sample to each of the 500
genotyped samples and calculated a measure of distance by taking, among reads that overlapped a
SNP where the genotyped sample was homozygous, the proportion with an allele that was
discordant with the inferred SNP genotype.
Sample mixtures
A number of the microbiome samples appeared to be mixtures of DNA from two mice. For
each microbiome sample, we studied the possibility that it was a mixture between the correctly
labeled sample and a single contaminant, and considered each of the other 499 genomic DNA
samples as the possible contaminant. For a given microbiome sample and a pair of genomic DNA
samples, we counted the number of reads that overlapped a SNP, split according to the SNP allele
on the read and the joint SNP genotypes for the pair of samples.
We assumed that the microbiome sample contained a proportion p of the contaminant, and
assumed a sequencing error rate of ε, and calculated the expected proportion of reads with an A
vs. B allele as a function of the genotypes of the two mice that contributed to the mixture
(Supplementary Table S1). With this multinomial model, we then derived maximum likelihood
estimates (MLEs) for p and ε by numerical optimization, and we calculated the likelihood ratio
test (LRT) statistic for the null hypothesis that there is no contamination (p = 0), as twice the
natural log of the ratio of the likelihood, plugging in the MLEs of p and ε, to the likelihood
8
evaluated at p = 0 with ε estimated under that constraint.
The LRT values throughout are extremely large, and so to identify potential mixtures, we
considered a plot of the LRT vs. the estimated mixture proportion, with a sample considered as a
mixture with each of the other possible sample as the contaminant, and looked for a separation
between one possible contaminant and the others.
Calculations were performed in R (R Core Team 2018), with the R package R/mbmixture
(https://github.com/kbroman/mbmixture).
Data and software availability
Raw microbiome sequence reads will be made available at the Sequence Read Archive. The
GigaMUGA SNP genotypes will be made available in R/qtl2 format at FigShare. Founder SNP
genotypes are available as a SQLite database at figshare, doi:10.6084/m9.figshare.5280229.v2.
The processed data and the custom R scripts used for our analyses and to create the figures
and tables are at GitHub (https://github.com/kbroman/Paper_MBmixups).
An R package, R/mbmixture, for performing the mixture analysis is available at Github:
https://github.com/kbroman/mbmixture.
9
Results
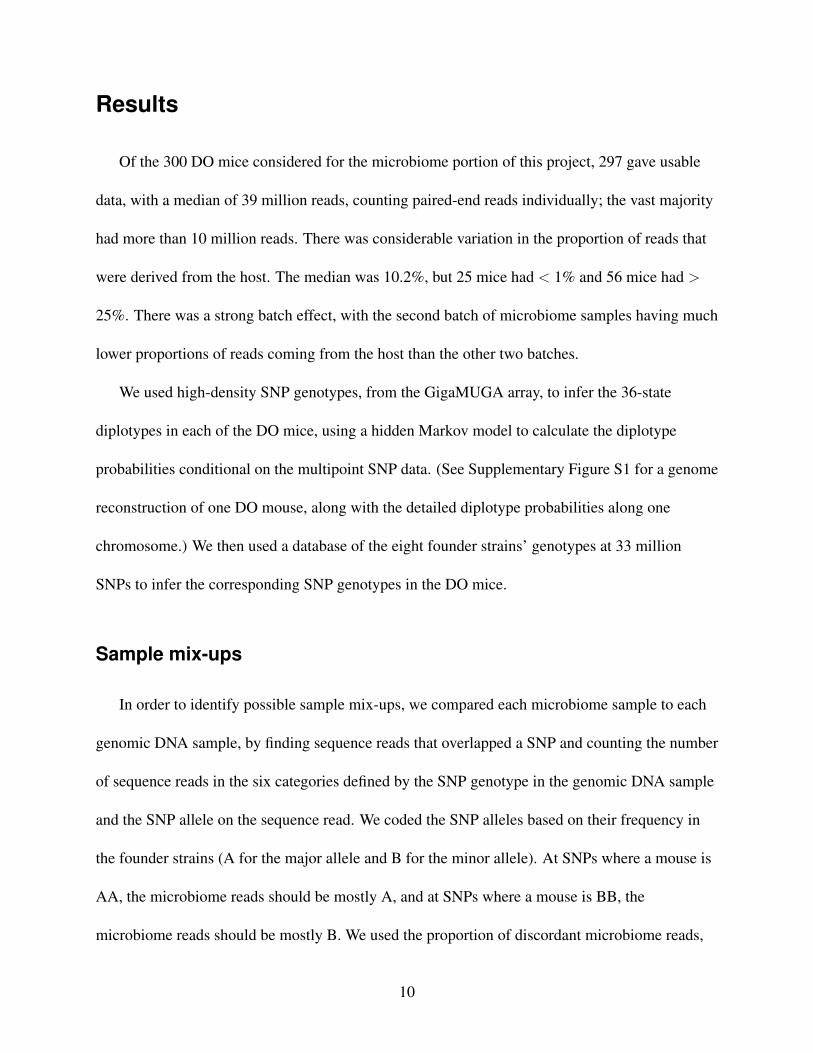
Of the 300 DO mice considered for the microbiome portion of this project, 297 gave usable
data, with a median of 39 million reads, counting paired-end reads individually; the vast majority
had more than 10 million reads. There was considerable variation in the proportion of reads that
were derived from the host. The median was 10.2%, but 25 mice had < 1% and 56 mice had >
25%. There was a strong batch effect, with the second batch of microbiome samples having much
lower proportions of reads coming from the host than the other two batches.
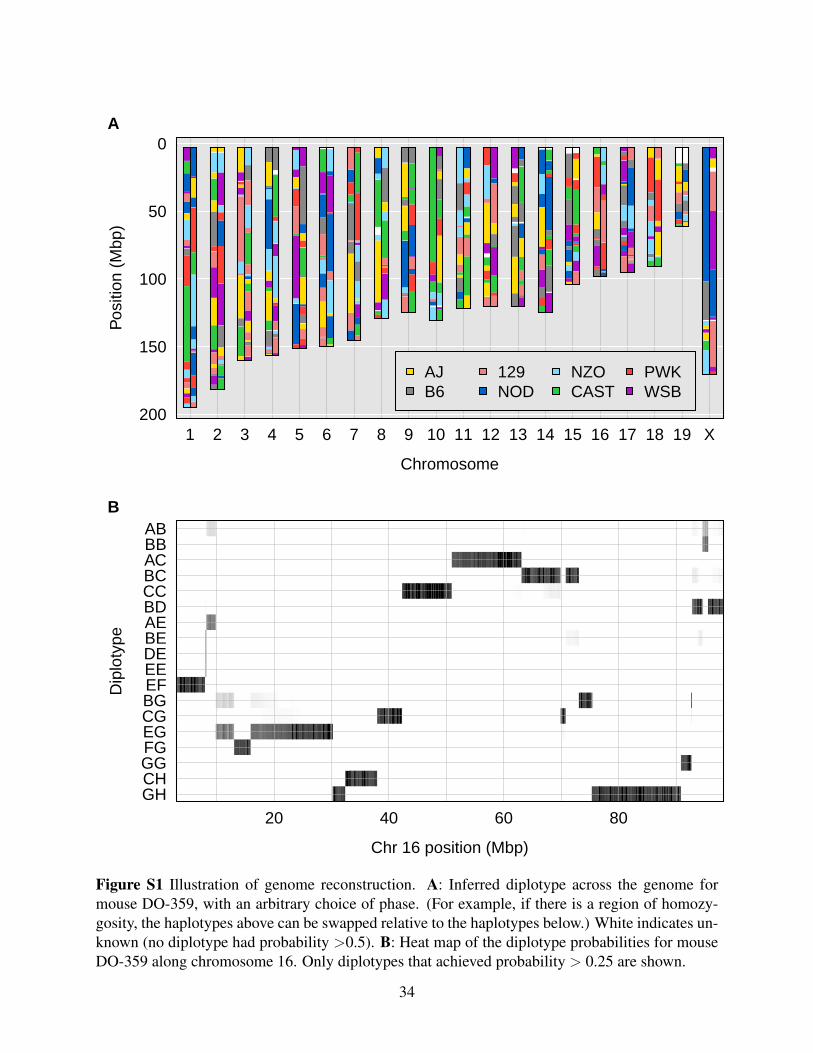
We used high-density SNP genotypes, from the GigaMUGA array, to infer the 36-state
diplotypes in each of the DO mice, using a hidden Markov model to calculate the diplotype
probabilities conditional on the multipoint SNP data. (See Supplementary Figure S1 for a genome
reconstruction of one DO mouse, along with the detailed diplotype probabilities along one
chromosome.) We then used a database of the eight founder strains’ genotypes at 33 million
SNPs to infer the corresponding SNP genotypes in the DO mice.
Sample mix-ups
In order to identify possible sample mix-ups, we compared each microbiome sample to each
genomic DNA sample, by finding sequence reads that overlapped a SNP and counting the number
of sequence reads in the six categories defined by the SNP genotype in the genomic DNA sample
and the SNP allele on the sequence read. We coded the SNP alleles based on their frequency in
the founder strains (A for the major allele and B for the minor allele). At SNPs where a mouse is
AA, the microbiome reads should be mostly A, and at SNPs where a mouse is BB, the
microbiome reads should be mostly B. We used the proportion of discordant microbiome reads,
10
among those overlapping a SNP where the genomic DNA sample was homozygous, as a measure
of distance between the microbiome sample and the genomic DNA sample.
For example, Supplementary Table S2 contains counts of sequence reads from the
microbiome sample for mouse DO-360, classified by the SNP genotype of DO-360 and by the
allele present in the read. Among the 10.4 million reads that overlapped a SNP where DO-360
had genotype AA, 14.6% had a B allele, and among the 1.2 million reads that overlapped a SNP
where DO-360 had genotype BB, 55.6% had an A allele. The distance between microbiome
sample DO-360 and genomic DNA sample DO-360 was thus 0.19.
If we compare microbiome sample DO-360 to genomic DNA sample DO-370
(Supplementary Table S3), however, we find that only 0.2% of reads overlapping an AA SNP had
a B, and only 0.5% of reads overlapping a BB SNP had an A, for an overall distance of 0.002.
Similarly, microbiome sample DO-370 is most like genomic DNA sample DO-360. Thus, for
samples DO-360 and DO-370, either the genomic DNA samples got swapped or the microbiome
samples got swapped. A comparison of RNA-Seq data for these samples (Keller et al. 2018) to
the SNP genotypes also indicated a sample swap, and so we can infer that the mix-up was in the
genomic DNA samples.
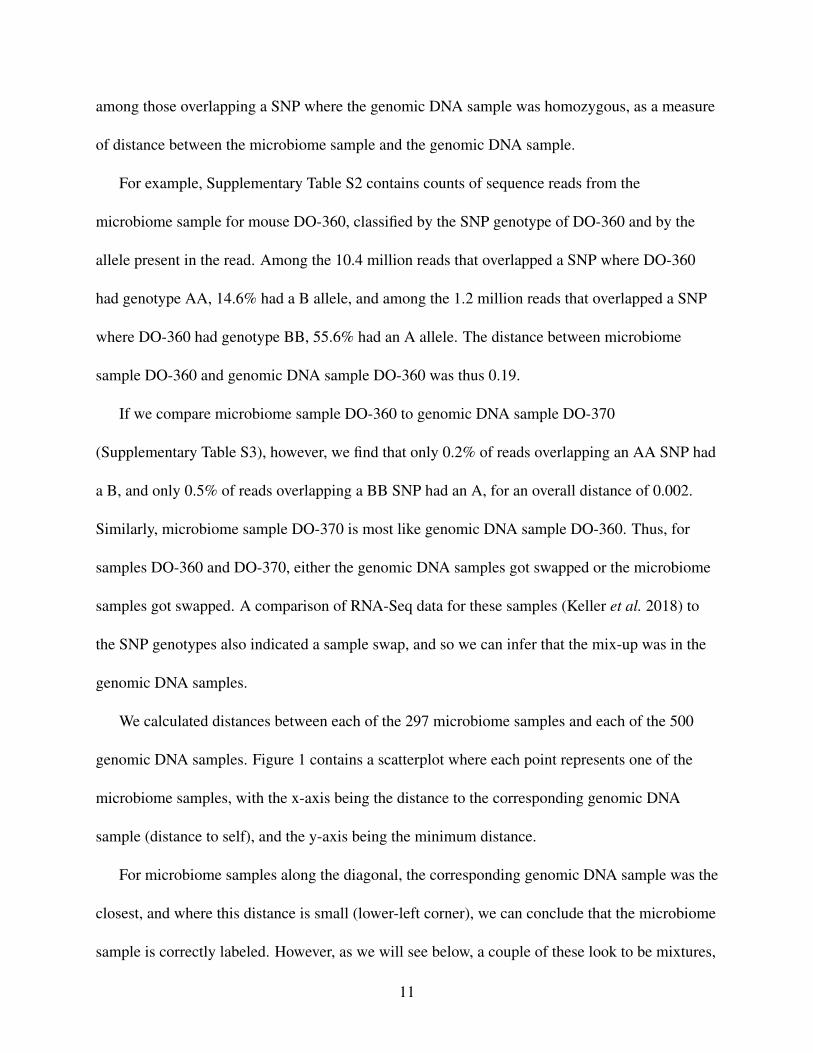
We calculated distances between each of the 297 microbiome samples and each of the 500
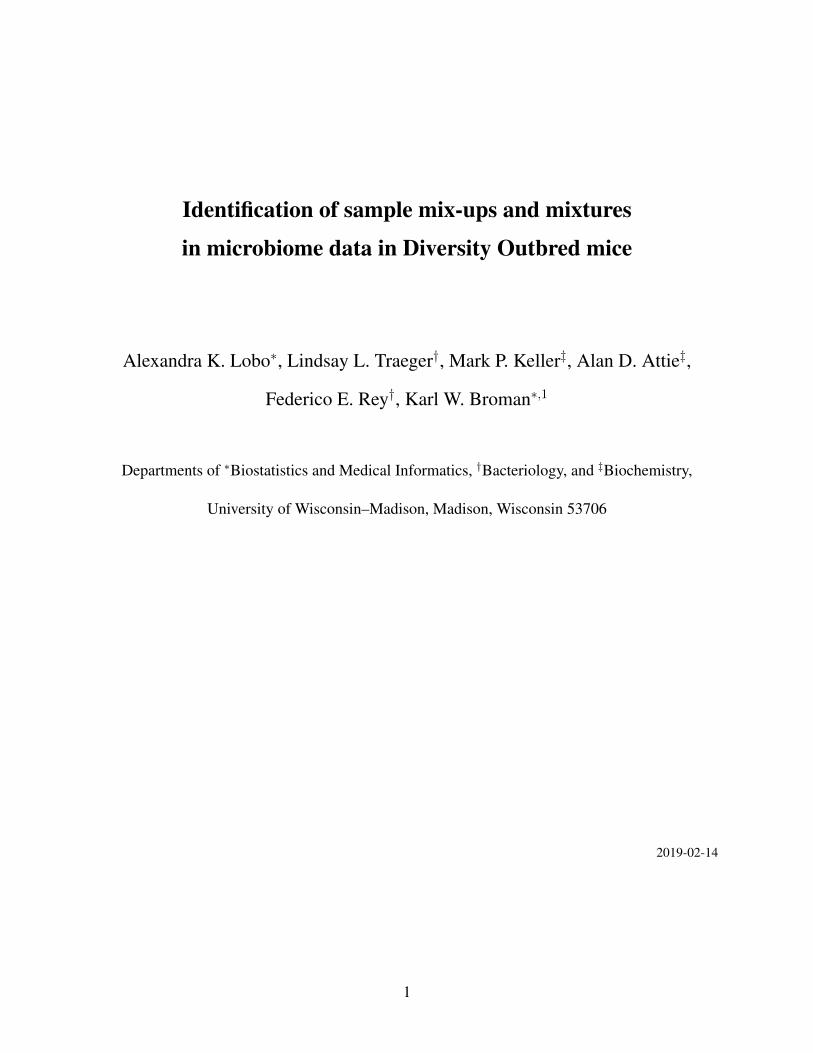
genomic DNA samples. Figure 1 contains a scatterplot where each point represents one of the
microbiome samples, with the x-axis being the distance to the corresponding genomic DNA
sample (distance to self), and the y-axis being the minimum distance.
For microbiome samples along the diagonal, the corresponding genomic DNA sample was the
closest, and where this distance is small (lower-left corner), we can conclude that the microbiome
sample is correctly labeled. However, as we will see below, a couple of these look to be mixtures,
11
Proportion discordant with self
Min
imum
pro
port
ion
disc
orda
nt
0.00 0.05 0.10 0.15 0.200.00
0.05
0.10
0.15
●
●●●●
●
●●●
●
●
●
●
●●●
●●●
●●
●
●
●●
●
●
●●
●
●
●
●
●
●●●
●
●
●
●●
●
●
●
●
●
●●●
●
●●
●
●
●
●●
●
●●●
●
●
●
●●
●
●●●●●
●
●●
●
●
●●
●●
●
●
●
●
●●
●
●
●
●●●
●
●
●
●
●
●
●●
●
●●
●
●
●
●
●●
●
●
●●●
●
●
●
●●●●
●●●●●●●●●●
●
●●
●
●
●
●●
●
●
●●
●
●
●●●
●
●
●●
●
●
●
●
●●●●
●●
●●
●
●●
●
●
●
●●●
●
●●●●●●● ●●
●
●●●●●●●●●●●●●●
●
●
●●●●●●●●●●
●
●
●●●
●●●●●●●●
●●●●
●
●●●
●
●●●
●
●●●●●●
●
●●●●● ● ●●●●●●
●●●●●●●●
●
●●●
●●
●
●
●●●
●
●
●●
●● ●●
●
●●
●
●●
●
●●●●●
●
●
●
●
●
●
●
● ●
●●
●
●
●
●
●
●
DO−205
DO−174
DO−397
DO−385
DO−336
DO−142
DO−186DO−191
DO−329
DO−340
DO−344
DO−346
DO−354
DO−357
DO−358
DO−41
●
DO−343
●DO−359
●
DO−362
● DO−53●
DO−54●
DO−83
●
DO−88
●DO−370●DO−85
●
DO−360
●DO−111 ●
DO−324
●
DO−327
●
●
●
●
●
okaylow readsbad DNAmixturesample mix−up
Figure 1 Plot of minimum distance vs. distance to self. Each point is a microbiome sample anddistances to genomic DNA samples are measured by taking, among reads that overlapped a SNPwhere the genotyped sample was homozygous, the proportion with an allele that was discordantwith the inferred SNP genotype. The microbiome samples are categorized according to our con-clusions about their status.
12
contaminated by a small amount of another sample.
There are seven microbiome samples (colored purple in Figure 1) where the distance to the
corresponding genomic DNA sample was > 0.15 but the minimum distance to a microbiome
sample was < 0.01. These are clear sample mix-ups, and form two pairs and one trio:
DO-360/DO-370 (mentioned above), DO-53/DO-54, and DO-83/DO-85/DO-88.
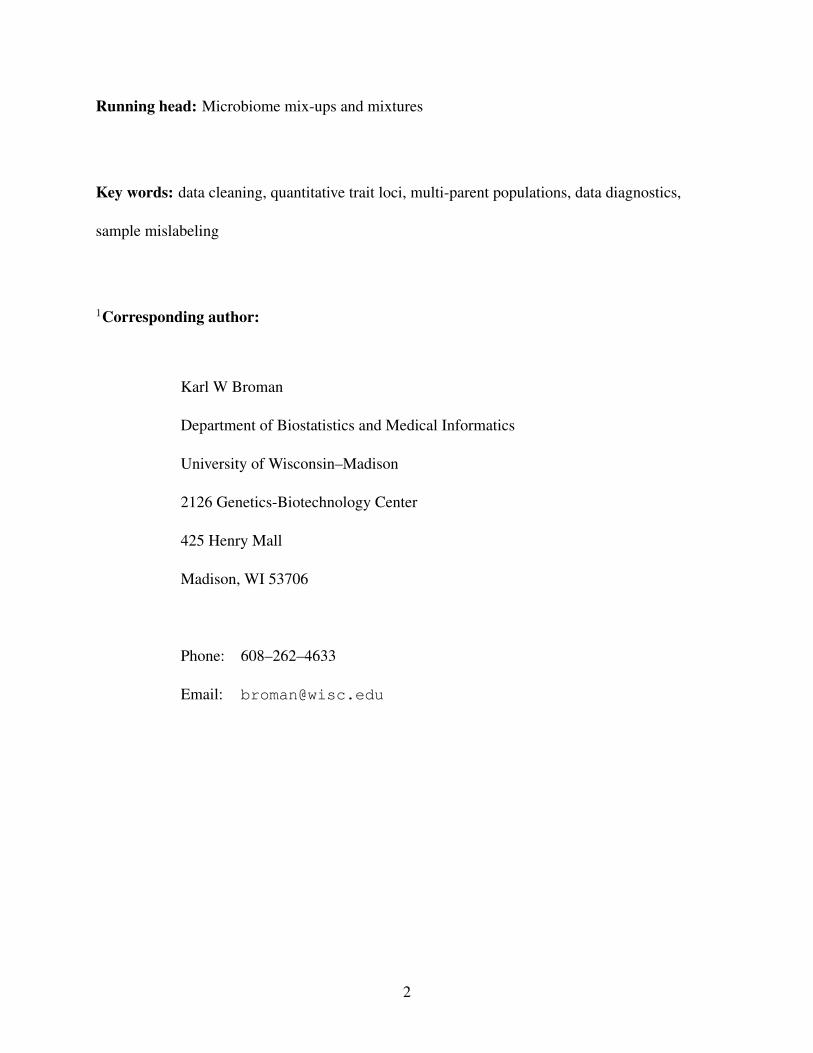
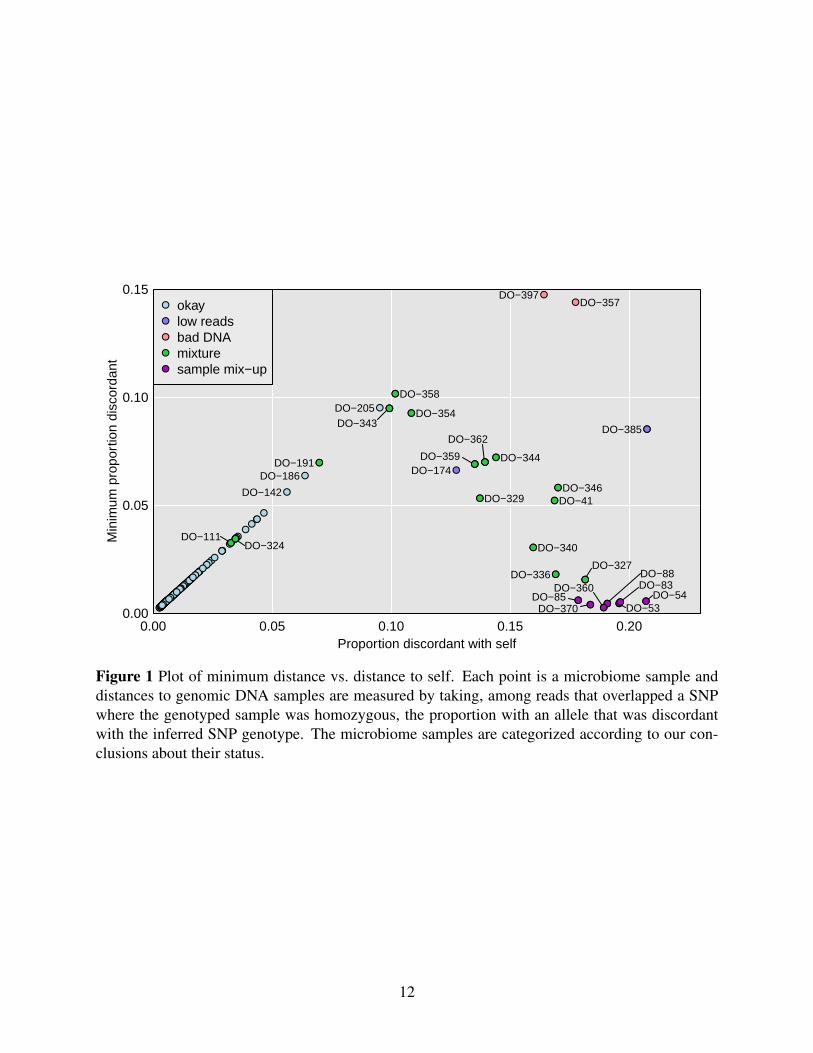
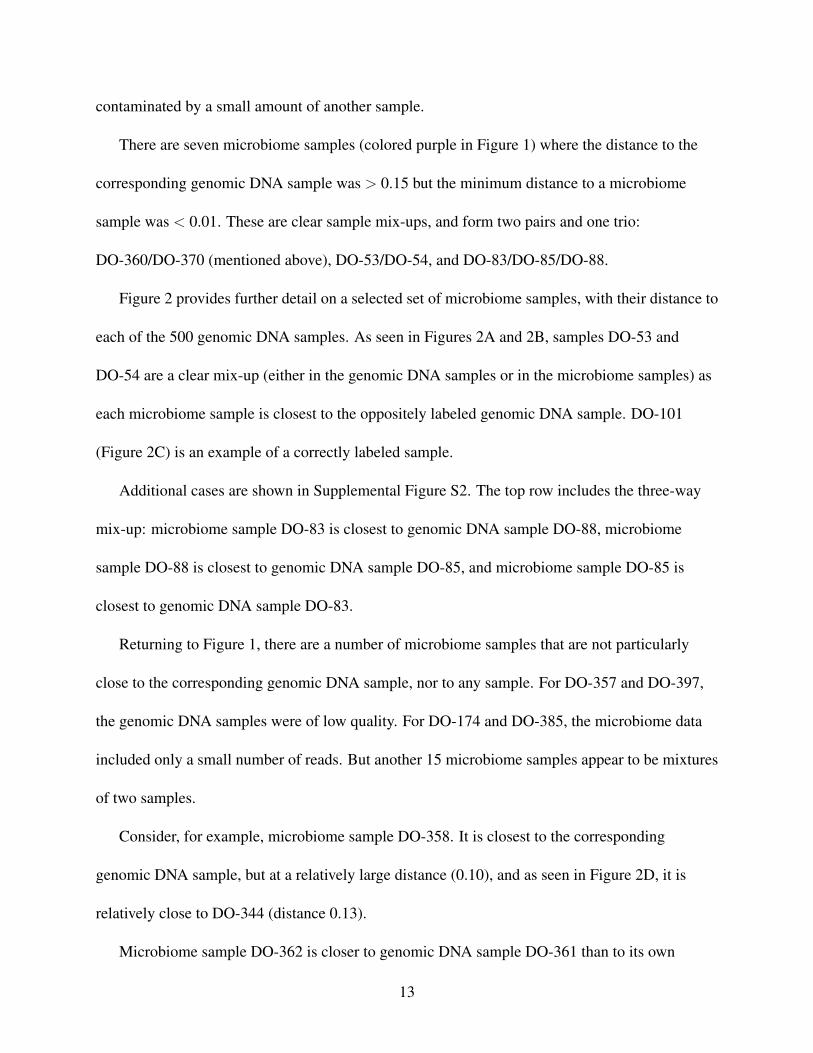
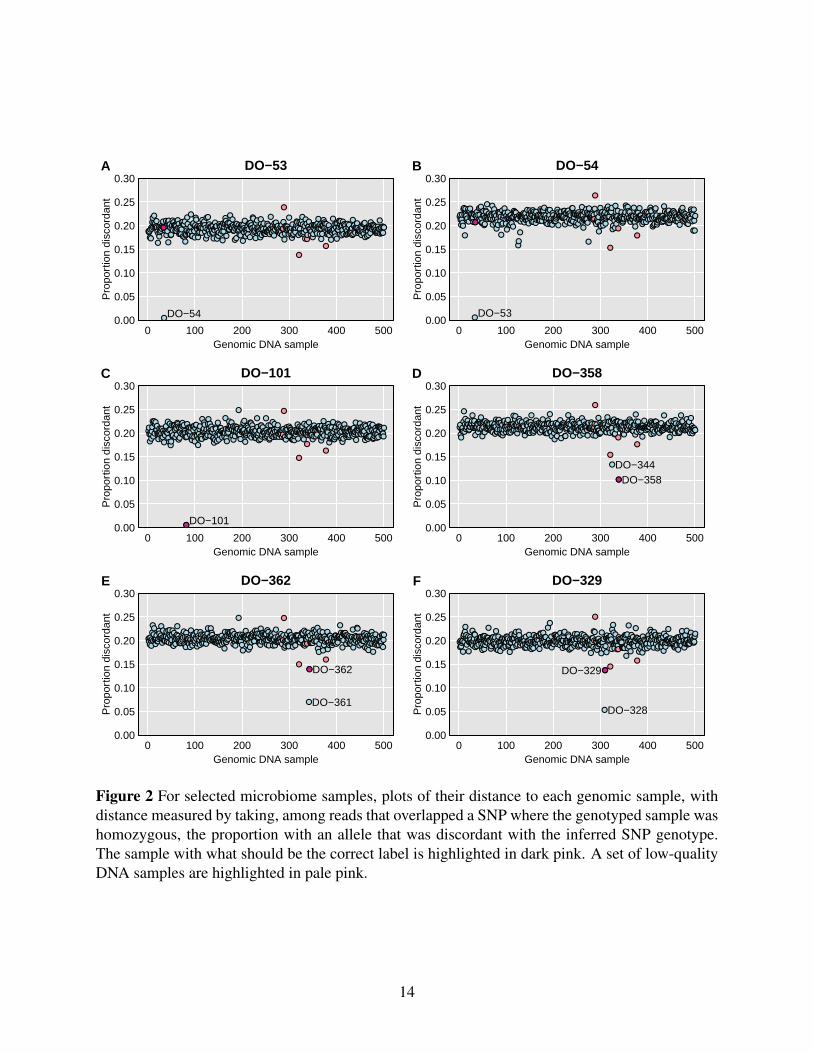
Figure 2 provides further detail on a selected set of microbiome samples, with their distance to
each of the 500 genomic DNA samples. As seen in Figures 2A and 2B, samples DO-53 and
DO-54 are a clear mix-up (either in the genomic DNA samples or in the microbiome samples) as
each microbiome sample is closest to the oppositely labeled genomic DNA sample. DO-101
(Figure 2C) is an example of a correctly labeled sample.
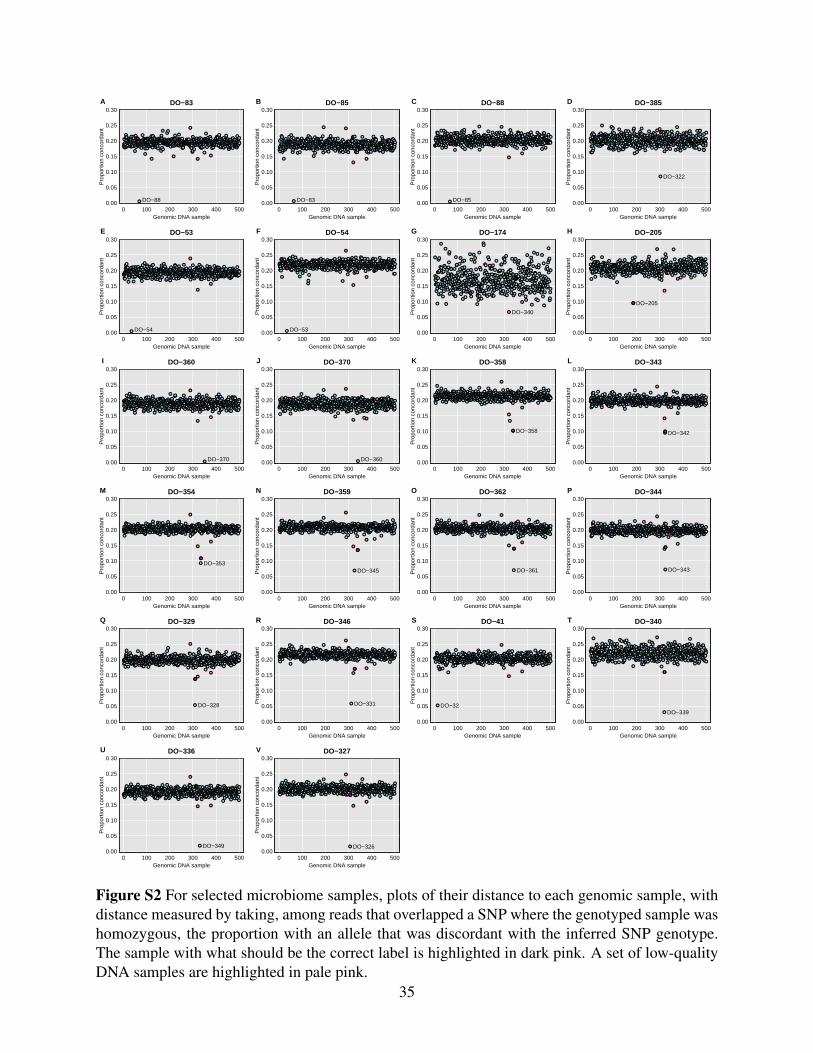
Additional cases are shown in Supplemental Figure S2. The top row includes the three-way
mix-up: microbiome sample DO-83 is closest to genomic DNA sample DO-88, microbiome
sample DO-88 is closest to genomic DNA sample DO-85, and microbiome sample DO-85 is
closest to genomic DNA sample DO-83.
Returning to Figure 1, there are a number of microbiome samples that are not particularly
close to the corresponding genomic DNA sample, nor to any sample. For DO-357 and DO-397,
the genomic DNA samples were of low quality. For DO-174 and DO-385, the microbiome data
included only a small number of reads. But another 15 microbiome samples appear to be mixtures
of two samples.
Consider, for example, microbiome sample DO-358. It is closest to the corresponding
genomic DNA sample, but at a relatively large distance (0.10), and as seen in Figure 2D, it is
relatively close to DO-344 (distance 0.13).
Microbiome sample DO-362 is closer to genomic DNA sample DO-361 than to its own
13
DO−53
Genomic DNA sample
Pro
port
ion
disc
orda
nt
0 100 200 300 400 5000.00
0.05
0.10
0.15
0.20
0.25
0.30
●●●●
●
●
●●●●
●●●
●●●●●●●
●
●●
●●●●●●●●●●
●
●●●●
●
●●
●
●
●●●●●●●●●
●
●●●●●●●●●●●●
●●●●●●●●
●
●●
●
●
●●●●
●●
●●●●●●
●
●●●
●●●●●
●●●
●●●
●●●●●●●●●
●
●●●●●●●
●
●
●●
●
●●●
●●●●●●●●●
●●●●●●
●
●●●●
●●●●●●●
●
●
●●●●●●
●
●●●●●●●●
●●●●
●●●●●
●
●●
●
●●●●●●●●
●
●●●●
●
●●●●
●●●●●●
●●●●
●
●●●●●
●●
●●●●●
●●
●●●●●●●●
●
●●●●●●
●●●●●●●●●●●●●●
●
●●●●●●●
●●●●●●●●●●
●●●●●●
●●●●
●
●●●●●●●●●●
●
●●●●●
●
●
●●●●●●●●●●●●●
●
●●●
●
●
●●●
●●●●
●
●
●●
●●
●●●●●●●●●●
●●●●●●●●●●
●●
●●●●
●●
●
●
●●●●●●●●
●
●
●●●●●
●●●●
●
●●●
●
●●●
●●
●●
●
●●●●●●●●●
●
●●
●
●
●●●●●●●●●
●●●
●●●●●●●
●
●
●●●●●●●●●●●●●●●●
●●●●
●
●
●●
●●●●●
●●●●●●●
●●●●●●●●●●●●●●●●●●●
●
●●●●●●●●●●
DO−54
A DO−54
Genomic DNA sample
Pro
port
ion
disc
orda
nt
0 100 200 300 400 5000.00
0.05
0.10
0.15
0.20
0.25
0.30
●●●●●●
●●
●●●
●
●●●●●●●
●
●●●
●●●●●●●
●●
●
●●●●●●●●
●●●
●●
●●●●●●
●●●●●●
●
●●●●●●●●●●
●
●●●●●●●●
●
●●●
●●●●●●
●
●
●
●●●●●●●●
●
●
●●●●●
●
●
●●●●●
●
●●●●●●●●●●
●●
●●
●
●●●●●●●●●●●●●●●
●●●
●●●●●●●●●
●
●●●●
●
●
●●●●●●●●
●●●
●●●●●●
●●●●●●●
●●●●●
●●●●●
●●●●●●●●●●●●
●
●●●●●●●●●●●●●
●●●●●
●●●●●●
●
●●●
●●
●●●●●●
●●●●●
●
●●●●●●●
●
●●
●●●●●●
●
●●
●
●
●
●●●●●●●●●●●●
●
●
●●
●●●●●
●
●
●
●
●
●●●●●●●●●
●●●
●●●
●●●●
●
●●●
●
●●
●●●●
●
●●●●●
●
●●●●●●●●●●●●●●●●●
●●
●●●●●
●●●●●●●●
●
●●●
●●●
●
●●●●
●●●●●●●●●●●●●●
●●●●●●●●●
●●●●●
●
●
●●●
●●
●●
●●●●●●●●●●●●●●●
●
●●●●●●●●
●●
●●●●●●●●
●●●●●●●●●●●●●●
●
●●●●●●●●●●●●●●●●●●●●●●●
●●●●●
●
●
●
●
●●
DO−53
B
DO−101
Genomic DNA sample
Pro
port
ion
disc
orda
nt
0 100 200 300 400 5000.00
0.05
0.10
0.15
0.20
0.25
0.30
●●●●
●●●●●●
●
●●
●
●●●●●●●●●●●●●●●
●
●●●
●
●●●●●●●
●
●
●
●
●●
●●
●●●●
●●●●●
●●●
●●●
●
●
●●●●●
●●
●●●
●●●●
●
●
●
●●●●●●●●
●●●
●●●
●●
●●●
●●●
●●●●●
●●●●
●
●●●●●
●●●●●●
●●
●●
●
●●●●●●
●●●
●●
●●●●●
●
●●●●●●●●●●●●●●●
●
●
●●●●●●●●●●●●●●
●
●
●●
●
●●●●●●●
●
●●●
●
●●●●●
●●
●
●
●●●●●●●●●●●
●●
●●●●●●●●●●●●
●
●
●●●
●●
●
●●
●●●●●●●●●
●
●●●●
●●●●●●●●●
●
●●●●●●●●●●●
●●●●●●●●●●●●
●
●●●
●
●●●●●●
●
●
●●●●●●●●●●●●●●●●●
●
●
●
●●●●●●●●●●
●●●●●
●
●
●●●
●●●●●●●●
●
●●
●●●●
●●●●●●●●●●
●●
●
●●●
●
●
●●●
●
●●●●
●●
●
●
●●●
●
●●
●
●●●
●
●
●
●●●●
●●●●●●
●●●●
●
●
●●●●●●●●●●●●●●●●●●●●●
●●●●
●
●
●●●●●●●●
●●●●●●●
●●●
●
●
●●●
●
●●●●●
●
●●●●●
●●●●●●●●●●
●
●
●●●●●●●●●●●
●
●DO−101
C DO−358
Genomic DNA sample
Pro
port
ion
disc
orda
nt
0 100 200 300 400 5000.00
0.05
0.10
0.15
0.20
0.25
0.30
●●
●●●●●●
●
●
●●●
●●●●●●●●●●●●●●●
●●●●●●●●●●●
●●●●●●●●●●
●●●
●●
●●●●●●●●●●●●●●●●●●●●●
●●●
●●●
●●●●●●
●
●●●
●●●●●●●●●●●●
●●●●●●
●●●●●
●
●●●●
●●●●
●●●●●●●●●●●●●●●●●●
●●●●●●
●●●
●●
●
●●●●●●●●●
●●●●●●●●●
●●●●●●
●●●●●●●●●
●
●●●●
●
●●●
●
●●●●●●
●●●●●
●●●●●●
●●
●
●●●●●●●
●●
●●●●●
●●●●●●●●
●●
●
●●●●●●●●●●●
●●●
●
●●●
●
●●●
●
●●●●●●●●
●●●●●●●●●●●●●●●
●
●●●●●●
●
●●●
●
●●●●●●●●●●●●●●
●●●●●●
●
●●●
●
●
●●●
●●
●●●●●●
●
●
●●●●●●●●●●
●
●●●●●●●●●●●●●●●●●●●●●●●
●
●●
●
●
●●●●●●●●●●
●
●●●●●●●●●●●●
●●●●●●
●
●●●●
●
●
●
●●●●●●●●●●●●●●●●●●●
●
●●●●●●●●●●●●●●●
●●●●●●●●
●●●●●●●
●
●●●●
●
●●●●●●●●●●●●
●●●●●
●●●
●
●●●●●●●●●
●DO−358DO−344
D
DO−362
Genomic DNA sample
Pro
port
ion
disc
orda
nt
0 100 200 300 400 5000.00
0.05
0.10
0.15
0.20
0.25
0.30
●●●●●●●●●●
●●●
●●●●●●●●●
●●●●●
●
●●●
●●●●●●●●
●●●●
●●●●●●●●●
●●
●●●●●●●
●
●●●●●●●●●●●●●●
●●
●●
●●●●●●●●
●●
●
●●●●●●●●●●●●
●●●●●●●
●●●●●●●
●●●●●●
●●●●
●●●●●
●
●●●●●●●●●●●●●●●●●●●●●●●
●●●●●●
●●●●●●●●●●●●●●●●●●
●●●
●●●●●●●●
●
●●●●●●●
●
●
●●●●●●●●●
●●
●
●●●
●●●●●●●●●●●●●●●●●●●
●
●●
●●●
●●●●●●●●●●●
●
●
●
●
●●●●●●●●●●●●
●
●●
●●●●●●●●●●●●●●●●
●
●●●●●●●●●●
●●●●●●●●●●●●●●
●●●●●●●
●
●●●●●●●●
●●
●
●●
●●●●
●●●
●
●
●●●●●
●
●●●
●
●●●
●
●●●
●
●
●
●
●●●●●●●
●
●●
●●●
●
●●●
●●●●
●●
●●●●●●●●●●●●●●●●●●●●
●
●●●●
●
●●●●●●●
●●●●●●●●●●●●●●
●
●
●●●●●●●
●●
●●●
●●●●●●●●●●●●
●
●●●
●
●●
●●●●●●●●
●
●
●
●●●●
●
●●●●●●●●●●●●●
●●
●●●
●
DO−361
DO−362
E DO−329
Genomic DNA sample
Pro
port
ion
disc
orda
nt
0 100 200 300 400 5000.00
0.05
0.10
0.15
0.20
0.25
0.30
●●●●●●●
●
●●●
●●
●●
●●●●
●
●●●●●●●
●
●●●●●
●●●●●●●●●●●●●●●●
●
●
●
●
●
●●●●●●●
●
●●●●●●
●●●●●●●●●
●
●●●
●
●●●●●
●●●●●●●●●●
●●●●●●●●●
●
●●●
●●●
●●●●
●
●●
●●●●●
●●●●●●●●●●●●●●●●
●●●●●●●
●●
●●●●●●●
●●●●●●●●●●●●
●●
●●●●●●
●●●●●●
●●●●
●
●●●
●
●●●
●●●●●●●●●●●●●
●●●●●
●●●●●●●●●●
●●●●●●●●●
●●●●●●●●●●●●
●
●●●●●
●●
●
●●●●●
●●●●●●
●
●●●
●●●●●●●●●●
●
●●●●
●
●
●
●
●
●●●
●●●●●●●●●
●
●
●●●●
●
●
●
●
●
●
●●●●●●●
●
●●
●
●
●
●●
●●●
●
●●●
●●●
●●●●●●●●●●
●
●●
●●●
●
●
●
●●
●
●●●
●
●●
●●●
●●●●●
●
●●
●
●●●
●
●●
●●●●
●
●●●●
●●●●●●
●●●●●●
●
●●●●●●●
●●●●
●●●●●
●●●●●●●●●●●
●
●
●●●
●●●●●
●
●●●●●●●●●●●●●●
●●
●●●●
●
●●●●●●
●
●●●●●●●
●●●
●
●●●●●●●●●
●●●●●●●●●
●
DO−328
DO−329
F
Figure 2 For selected microbiome samples, plots of their distance to each genomic sample, withdistance measured by taking, among reads that overlapped a SNP where the genotyped sample washomozygous, the proportion with an allele that was discordant with the inferred SNP genotype.The sample with what should be the correct label is highlighted in dark pink. A set of low-qualityDNA samples are highlighted in pale pink.
14
genomic DNA sample, but as seen in Figure 2E, its own sample is second-closest. A similar
pattern is seen for microbiome sample DO-329, which is closest to genomic DNA sample
DO-328, but its own genomic DNA sample is second-closest. Additional examples are shown in
Supplementary Figure S2.
Sample mixtures
To investigate the possibility that a microbiome sample is a mixture of two samples, we break
down the counts of sequence reads by the SNP genotype at two genomic DNA samples. For
example, Supplementary Table S4 contains sequence read counts for microbiome sample
DO-358, split according to the SNP genotypes at genomic DNA samples DO-358 and DO-344. If
the microbiome sample DO-358 contains only DNA from DO-358, then the proportion of reads
with the B allele shouldn’t depend on the genotype at DO-344, but in reads overlapping SNPs
where both DO-358 and DO-344 are AA, 0.3% have a B, while in reads overlapping SNPs where
DO-358 is AA but DO-344 is BB, 40.9% have a B. This is strong evidence for the microbiome
sample DO-358 being a mixture of DO-358 and DO-344, and 40.9% is a rough estimate of the
proportion of the sample that came from DO-344. (Further, we can estimate the sequencing error
rate as 0.3%.)
In Table S5 we consider reads for microbiome sample DO-101, split according to the SNP
genotypes at genomic DNA samples DO-101 and DO-102. In contrast to Table S4, we see that
the frequency of A reads does not depend on the genotype at DO-102; the DO-101 microbiome
sample does not appear to be contaminated by DO-102.
More formally, we fit a multinomial model to the read counts for a microbiome sample,
15
assumed to be a mixture of the corresponding genomic DNA sample plus one other, and derive
derive maximum likelihood estimates (MLEs) of the contaminant probability p (the proportion of
the microbiome sample that came from the second genomic DNA sample) and the sequencing
error rate ε. We further calculate a likelihood ratio test (LRT) statistic for a test of p = 0 (that is,
the microbiome sample having no contamination).
For microbiome sample DO-358, considered as a mixture of DO-358 and DO-344, we
estimate the contaminant probability as 42.0% and the sequencing error rate as 0.3%. The LRT
statistic (for testing p = 0) is 1.1 ×10⁶.
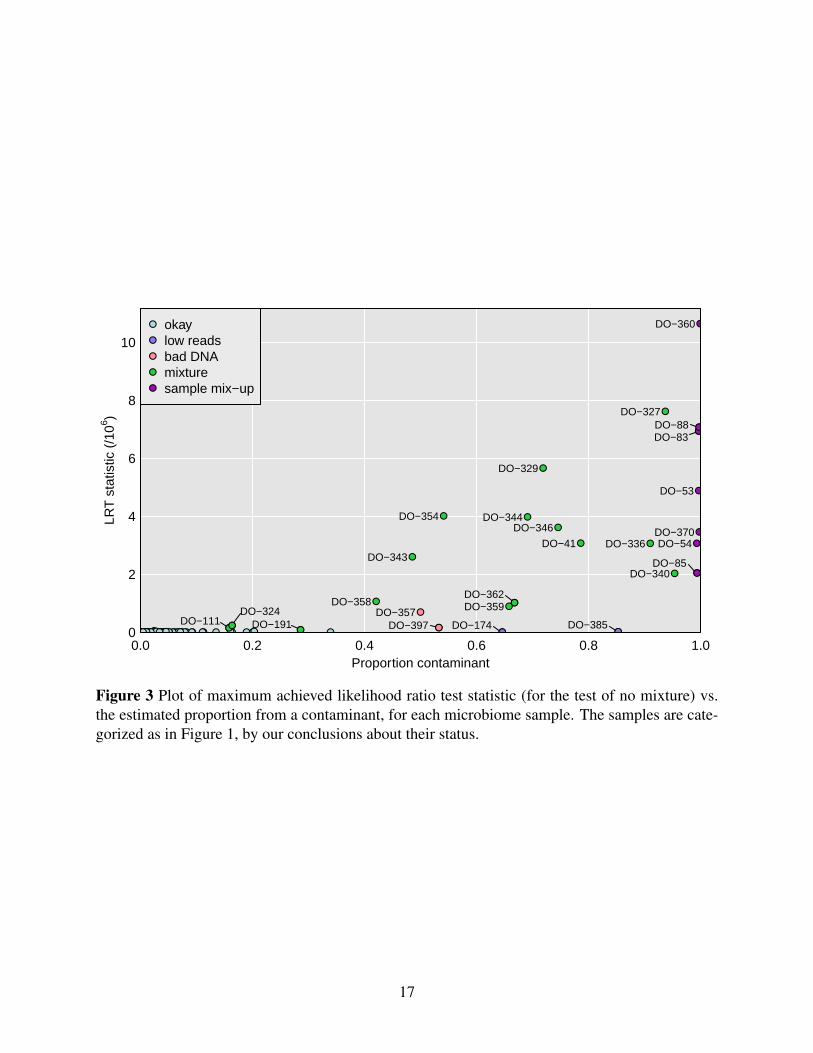
Figure 3 displays the results for each microbiome sample, considered as a mixture of the
correct sample plus each possible other genomic DNA sample, one at a time, as a contaminant.
On the y-axis is the LRT statistic for the contaminant sample that gave the largest such statistics,
and on the x-axis is the corresponding estimate of the contaminant probability.
The seven sample mix-ups, mentioned previously, are on the far right of Figure 3, with
estimated contaminant probability near 1, and with large values for the LRT statistic. There are 15
apparent mixtures, shown in green. Of these, 12 are quite clear, with estimated contaminant
probabilities between 42% and 95%, and with LRT statistics > 8 ×10⁵. There are three others
(DO-111, DO-191, and DO-324) that are more subtle, with estimated contaminant probabilities of
16–29%, and with LRT statistics of 8–23 ×104.
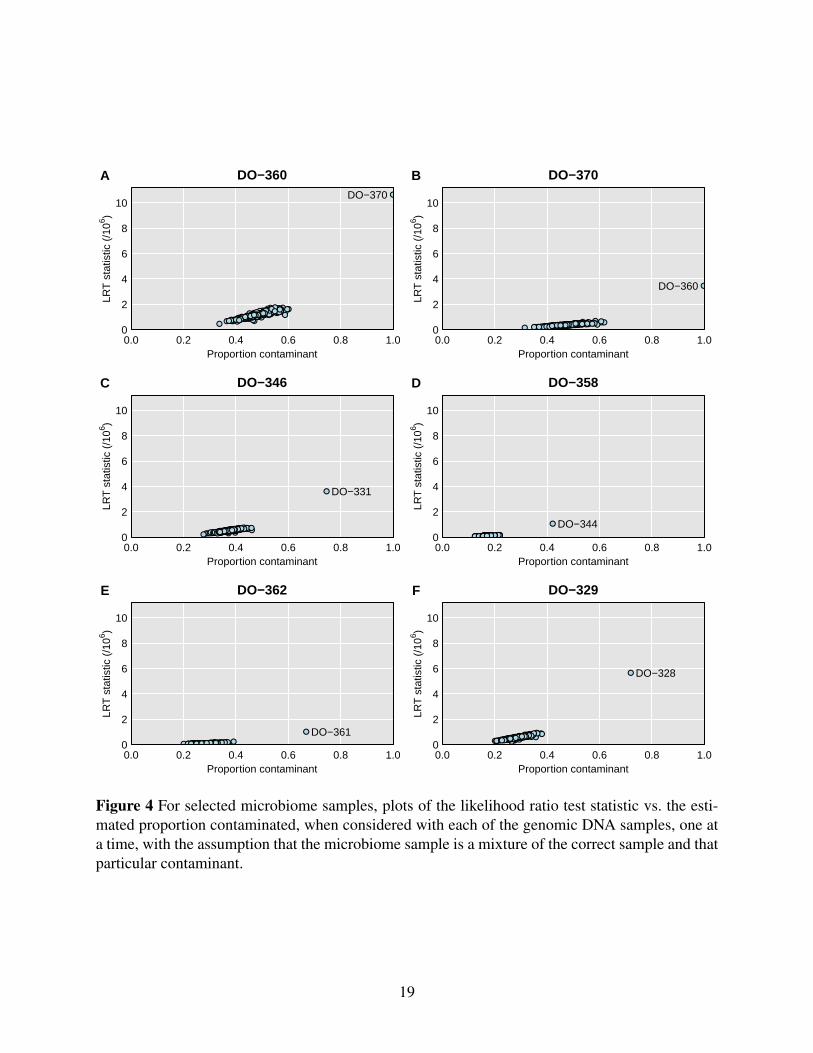
Figure 4 provides more detailed results for a selected set of samples. Each panel is a
scatterplot of the LRT statistic vs. the estimated contaminant probability, for a single microbiome
sample considered as a mixture of itself and one other genomic DNA sample, and with the points
corresponding to the other 499 genomic DNA samples. In each case, a single possible
contaminant stands out. Figures 4A and 4B are for the apparent mix-up of DO-360 and DO-370,
16
Proportion contaminant
LRT
sta
tistic
(/1
06 )
0.0 0.2 0.4 0.6 0.8 1.00
2
4
6
8
10
●●●●● ●●●●●●●
●●●● ●●●●● ●●●●● ●●● ●● ●●●●●● ●●● ●● ●● ●● ●●●● ●●● ● ●● ●● ●●●● ●● ●●● ●●●●●● ●●● ● ● ●●●● ●● ●●●● ● ●●●●● ●● ●● ●●●● ●● ●●● ●● ●●● ●●●● ●● ●●●●●●●●●●●●●●●●
●●
●
●
●
●● ●●●●●
●
●●●
●
●●●
●
●
●
●
●●●●●●●●
●
●●
●
●●
●
●●
●
●●●●●●●
●
● ●●●●●●●●●●●●●●● ●●●●●●●●●●●●●●
●●●●●●●●●●●●●●●
●
●●● ●●●● ●●●●●●● ●●●●●●
●
●
●●●●●●●●●●●●●●●●● ●●● ●●●● ●●●●
●
●
●
● ●
●
● ●●●●●●●●●●
DO−327
DO−329
DO−336
DO−340
DO−343
DO−344DO−346
DO−354
DO−357DO−358 DO−359
DO−360
DO−370DO−41
DO−53
DO−54
●DO−83
●DO−88
●DO−362
●DO−174
●DO−85
●DO−397●DO−111
●DO−191●
DO−324
●DO−385
●
●
●
●
●
okaylow readsbad DNAmixturesample mix−up
Figure 3 Plot of maximum achieved likelihood ratio test statistic (for the test of no mixture) vs.the estimated proportion from a contaminant, for each microbiome sample. The samples are cate-gorized as in Figure 1, by our conclusions about their status.
17
and each is estimated to be 100% from the other mouse.
Figures 4C-4F are four selected mixtures: DO-346 looks to be 74% from DO-331, DO-358
looks to be 42% from DO-344, DO-362 looks to be 67% from DO-361, and DO-329 looks to be
72% from DO-328. The LRT statistic is a measure of the strength of evidence for the sample
being a mixture; it depends both on the contaminant probability as well as total number of
sequence reads.
Additional cases are shown in Supplemental Figure S3, including the three more subtle cases
(DO-111, DO-191, and DO-324), for which the LRT statistic is a factor of 10 smaller. For these
cases, the single-sample analysis to investigate sample mix-ups (see Figure 1) looked okay, but
the mixture analysis indicates reasonably strong evidence that these microbiome samples are
contaminated. Supplementary Tables S6 and S7 contain the detailed read counts for microbiome
sample DO-111 (considered as a mixture with DO-112) and DO-191 (considered as a mixture
with DO-146). In each case, the proportion of sequence reads with a B allele clearly depends on
the genotype of the second sample.
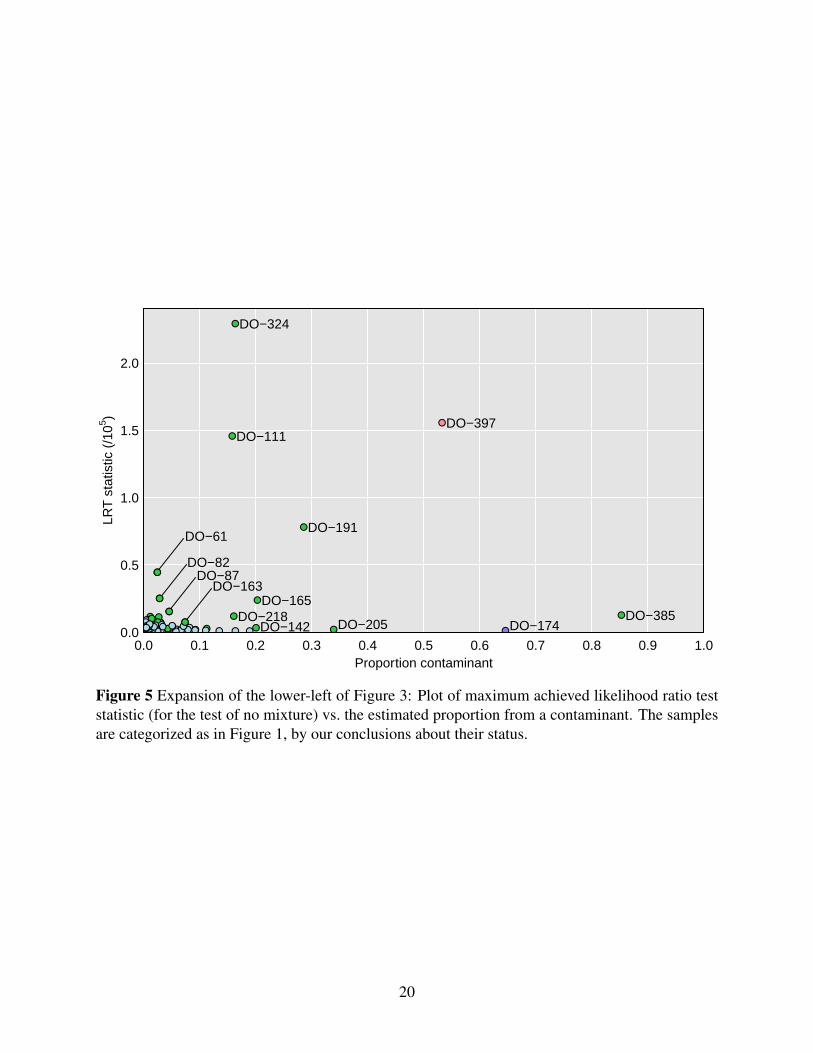
More subtle mixtures
In Figure 5, we expand the lower-left corner of Figure 3. This reveals additional microbiome
samples where the LRT statistic for contamination is a factor of 10 or 100 smaller, but where
there is still compelling evidence for contamination.
The minimum LRT statistic across all samples was 279, which would be nominally significant
evidence for contamination, but which we believe reflects a weakness of our multinomial model.
Before concluding contamination, we consider plots of the LRT statistic vs. the estimated
18
DO−360
Proportion contaminant
LRT
sta
tistic
(/1
06 )
0.0 0.2 0.4 0.6 0.8 1.00
2
4
6
8
10
●●●● ●●
●●●
●● ●●●
●●● ●
●●● ●●●
●●●
●●●● ●● ●●●●
●● ●●
● ●●●●
●●●
●● ●●
●●●● ●●●●
●●
●●● ● ●● ●
●●● ●●●
●●●●●●●
●●●
●● ● ●●●●●● ●
●● ●●● ●●● ●●●
●● ●
●●●●
●●
●●
●
●●
●●
● ●●●
●●● ●● ●●
●●●●
●●
●●● ● ●● ●●
● ●●●●●
●●
● ●●●
● ●●●
●●
● ●● ●
●●●
●●
●●●
● ●● ●●●●
●● ●● ●●
●●●●●
●●● ●● ●●●●
●●
●●
●●
● ●●●●
●●●●●●●
●●●● ●●●●
●●
● ●●● ●
●● ●●
●●●● ●
● ●●
●●●●●●●
●●●●
●●●●●
●●●●●●
●●●
●
●●
●●●● ●
● ●●●
●●
● ●●
●●●
●●
●●
●●●
● ●●●
●●
●●
● ●
●
●●●●
●● ●● ●●●●●●●●●●●● ●
●●
●●● ●●●
●●●●
●●●● ●
●●● ●●
●
●●● ●●● ●● ●●●●
●● ●●●
● ●●●
●●
●●●●
●●●●●●●●●
●● ●
●
●●●●●
●● ●
●
●
● ●●●●
● ●●● ●●●●
● ●●●●
●●●●●
●●●
●●
● ●●
●●
●●●
●●●
●●
●●● ●●
●●● ●
●
●
● ●●●●●●● ●
●
●● ●●
●
●●●
●●
●●●●
●●
●●●●
●●●●●●
● ●●
●
DO−370
A DO−370
Proportion contaminant
LRT
sta
tistic
(/1
06 )
0.0 0.2 0.4 0.6 0.8 1.00
2
4
6
8
10
●●●● ●● ●● ●● ● ●● ●●●●● ● ●● ●●● ●●● ● ●●● ●●●● ●●●●●● ●●●● ●● ●●● ● ● ●● ●● ● ●●● ●●●● ●●● ●● ●●● ●●●●● ●●●● ●● ● ●●● ● ● ●●●●● ● ●●● ●● ●● ●● ●●●●● ●● ● ●●● ●●● ● ●●● ● ●●●● ●●● ●● ●●●●● ●● ●● ●● ● ●● ●●●●● ●●●
●●● ●● ●● ●● ● ●●● ●● ●●● ●●●●● ●● ●● ●● ●● ●● ●● ●● ●●●● ●●●●●● ●●●● ● ●●● ●●● ●● ● ●●●● ●●● ● ●●● ●●●●●●●● ●●● ●●● ●●● ●●● ●● ●● ●● ●●●●● ●● ●●●● ● ●●●● ●●● ●●● ●● ●●● ● ●● ●●● ●●●● ●●● ●● ●●● ●●●●●●
●●● ●●●●● ●● ●●●●● ●● ●● ●● ●●
●
● ●● ● ●● ●● ●● ●● ●●●● ●● ● ●● ●● ● ● ●●●●● ●●● ●●●●● ●●● ●● ● ●●● ●●●● ● ●●●●● ●● ●●● ● ●●● ●●●● ●●●● ●●● ●● ●● ●●●●● ●●●● ●● ● ●●● ●●●●● ●●●●● ●●●●● ●●● ● ●● ●● ●● ●●● ●●●●● ●●●● ●●● ● ●●●●●●● ●●● ●●● ● ●●● ● ●● ●●● ●●●●●●● ●●● ●●
DO−360
B
DO−346
Proportion contaminant
LRT
sta
tistic
(/1
06 )
0.0 0.2 0.4 0.6 0.8 1.00
2
4
6
8
10
●●●●●● ●● ●●●● ●●●●●● ● ●● ●● ●●●● ● ●●● ●● ●●● ●●● ●●●●●●●●● ●● ●●●●●●●
●●● ●● ●● ●●●●●●●● ●●● ●● ●●● ● ●● ●●● ●●●●●●● ●●●●●●● ●●●● ●●●● ●●
● ● ●●●●●●● ●●● ●● ●●● ●●●●● ●●●●●● ● ●● ●●●● ●●●●● ●●●● ●●● ●●●●●● ● ●● ● ●● ●●●● ●●●●● ●●● ●● ●● ●● ●● ●● ● ●●● ●●●● ●● ●●●● ● ●●● ● ●●●● ●●●●● ●●●●●●● ●●●●●●● ●●● ● ●● ●●●● ●●● ●● ●● ●●● ●●● ●●● ●●●●● ●● ●●● ●●● ●●●● ●●●● ●●●●● ●●●● ●●● ●●●● ●●●●● ●● ●●● ●●●●● ●● ●● ●●● ●●●●●● ●● ●●●● ● ●● ●● ●● ●● ●●●●●● ● ●●●●
●●●●●● ●●●● ●●●●● ●● ●●● ●●●●●●●● ●
●
●●● ●●●● ●●● ●●● ●●●● ●● ●●● ●●
●● ●● ●● ●● ●● ●●● ●● ●●●●● ●●●● ●● ●●●●●● ●●●●● ● ●
● ● ●●● ●●● ●●●●●●●●● ●●●● ●●●●●●● ●●● ●●●●●●● ●● ●● ●● ●●●● ●●● ●●●● ●
DO−331
C DO−358
Proportion contaminant
LRT
sta
tistic
(/1
06 )
0.0 0.2 0.4 0.6 0.8 1.00
2
4
6
8
10
●●●●●●●● ●●●●●●●●● ●●● ●●●●● ●●● ●●● ●●●●● ●●●●●●● ●●●●● ●●● ●●●●●●●●● ●●●●●● ●●●●●●●●● ●● ●●●● ●●● ●● ●●● ●●● ●● ●●●●●●● ●●●●●●●●●●●● ●●●●●● ●●●● ●●●●●●●●●●●●●●●● ●●●●●● ●●●● ●● ●●●●●●●●●●●● ●●●● ●●●●●●●●●●●●● ●●●●●●● ●●●●●●●●●●●● ●●●●●●●●●●● ●●●●●●●●●●●●●●●● ●●●●●●●●●● ● ●●●● ●●●●● ●● ●● ●●●●●● ●●● ●●●● ●●●●● ●●●● ●●● ●●●●●●● ●●●●●●●●●●●●●●● ●●●●●● ●●● ●●●● ●●●●●●●●●●●●●● ●●●●●● ●●● ●●●● ●●●● ●●●●●●●●●●●●●●● ●●●●●●●●●●●● ●●●●●●● ●●●●●●● ●● ●●●●
●
●●●●●● ●●●●●●●●●●● ●● ●●●●●●●●●●●●●●●●●●●●●●●●●● ●●●● ●●● ●●●●●●● ●●●●●●●●●●● ●●●●●●●●●●●●●●● ●●● ●●●●●●● ●●● ●●●●●●●●●●●●
DO−344
D
DO−362
Proportion contaminant
LRT
sta
tistic
(/1
06 )
0.0 0.2 0.4 0.6 0.8 1.00
2
4
6
8
10
●●●● ●● ●●●● ●●●●●●●● ● ●●●●●● ●● ●●●● ●●●● ●●●● ●●●● ●●●●● ●●●● ●●●● ● ●●● ●●● ●●●●●●●●●●●● ●● ●●● ●●● ●●● ●●●● ●●●● ●● ●● ●● ●● ●● ●●● ●●●●● ● ●●●● ●● ●●●● ● ●●●● ●●●●●● ●●●●●● ●●●●●●●● ●●● ●●● ● ●●● ●●●●● ●●● ● ●● ●●●●●●●●●●● ●●●●● ●●● ●●●● ●●● ●●● ●● ●● ●●● ●●●● ● ●● ● ●●●●● ●●●●● ●●● ● ●●● ●● ●●●● ● ●● ●● ●●●●●● ●●● ●●●●●● ●●● ●●● ●● ●●● ●● ●●●●●● ●●●●● ●● ●● ●●●● ●●●●● ●●●●●●● ●●● ●●● ●●●●●●● ●●●● ●●●● ●●●●●●● ●● ●● ●● ●
●
● ● ●●●● ●●● ●●●●●● ●●● ●●● ●●● ●● ●●●●●●● ●●●●● ●●● ●●● ●●●● ●●● ●●●● ●● ●●● ● ●●●●● ●●●●●●●●●●●● ●●● ●●●● ●●●● ●● ● ●●●●● ●●●● ●●●● ●●●●● ●● ● ●● ● ●●● ● ●●●● ●●●●● ●●●● ●●●●● ●●●● ●●● ●●● ● ●●●●● ●●●●●● ●●●
DO−361
E DO−329
Proportion contaminant
LRT
sta
tistic
(/1
06 )
0.0 0.2 0.4 0.6 0.8 1.00
2
4
6
8
10
●●● ●●● ● ●●
●●●●●●●●●
●●●● ●●●●● ●●●● ●●●● ●●●● ●●●●●●●●●●
●●● ●● ●● ●● ●●
●●●●
●●●●● ●●● ●●● ●● ●●●●●●●●● ●●●●●●●●● ●●● ●●●●●●●●● ●● ●●●
●●● ●●●● ●●●● ●●● ●●●●●● ● ●●
●● ●●●●●● ●
●●●●
● ●●●●●●●● ● ●●●●● ●●
●● ●●● ●●●●● ●●●●
●● ●●●● ●●●● ●● ● ●● ● ●●●● ●●●●●● ●●●● ●●● ● ●●
●● ●● ●●● ●●●●●●●● ●
●●● ●● ● ●●●
●●● ●● ●●●●●●●●●●●
●●●● ●●●●●●●●● ●● ●● ●●● ●●● ●●● ●
●● ●●● ●●●●● ●● ●● ● ●●●
●● ●●●●●● ●●
●●
●●●●●● ●● ●●●●●●●●●●
●●●●●●● ●●●●●●
●●●● ●●● ● ●● ●●
●
●●●●● ●●● ● ●●● ●●●● ● ●● ●
● ●●●●●
●●● ● ●
●●
● ●● ●●● ●●●●●● ●
●●● ●●●●●●●●●●●● ●●● ●●●● ●● ●●●●
●●●●●● ●● ●●●●●●●●● ●●●●●●●● ●●● ●●●●● ●●● ●
● ●●●●● ●●●● ●●●●●●●●● ●●●●●
● ●●●●●●
DO−328
F
Figure 4 For selected microbiome samples, plots of the likelihood ratio test statistic vs. the esti-mated proportion contaminated, when considered with each of the genomic DNA samples, one ata time, with the assumption that the microbiome sample is a mixture of the correct sample and thatparticular contaminant.
19
Proportion contaminant
LRT
sta
tistic
(/1
05 )
0.0 0.1 0.2 0.3 0.4 0.5 0.6 0.7 0.8 0.9 1.00.0
0.5
1.0
1.5
2.0
●●●●● ●
●●●●●
●
●●●● ●●●●● ●●●●● ●●● ●● ●●●●
●● ●●● ●● ●● ●● ●●●● ●●● ● ●● ●● ●●●●●
●
●
●● ●●●●●● ●●● ● ● ●●●● ●● ●●●● ●
●
●●●● ●● ●● ●●●● ●● ●●● ●●
●●● ●●●
●●
● ●●●●●●●●●●●●●●●
●
●●●●● ●●●●●●●● ●●●●●●
●●●●
●●
●●●●●●●●●●●●
●●●●●●●●●●●●●●●
●
●●●●●●●●●●●●
●
●●●●●●●●●●●●●●●●●●
●
●●● ●●●●●●●
●●●●●●●●●●●●
●
●●●●●●●●●● ●
●● ●●●● ●●●
●
●●
●
● ●●●●●●●●●●
DO−111
DO−163
●
DO−165
DO−191
DO−218
DO−324
DO−385
DO−397
DO−61
●DO−82
●
DO−87
●
DO−174DO−205DO−142
Figure 5 Expansion of the lower-left of Figure 3: Plot of maximum achieved likelihood ratio teststatistic (for the test of no mixture) vs. the estimated proportion from a contaminant. The samplesare categorized as in Figure 1, by our conclusions about their status.
20
contaminant proportion. Figure S4 displays these plots for 20 selected samples: 17 show clear
separation of one potential contaminant from the others, while the other 3 show no such outlier.
We consider these 17 samples to be likely contaminated, whereas the other 3 are not.
Among these more subtle sample mixtures is DO-385, which we had previously ruled out as
simply having insufficient reads, and DO-205, which showed a high self-distance in Figure 1.
Both of these samples have high estimated sequencing error rates (5.7% and 3.6%, respectively).
Many of these subtle mixtures have low estimated rates of contamination, including 10 with
estimated contamination proportion < 5%, and with many approaching the estimated sequencing
error rate of about 0.6%.
21
Discussion
We have described a method for identifying sample mix-ups in metagenomic data for which
there are sufficient sequence reads from the host, as well as corresponding SNP genotypes on the
hosts. In our study of 500 Diversity Outbred mice, with metagenomic data on 297 of the mice, we
identified three sets of sample mix-ups (two pairs and one trio). In a separate aspect of the project
(Keller et al. 2018), we had generated RNA-Seq data on 300 of the 500 mice, but only 200 were
in common with 297 mice for which we have metagenomic data. One of the three sets of sample
mix-ups we identified was also seen when the RNA-Seq and SNP data were compared, and so we
conclude that the sample mix-up concerned the genomic DNA. For the other two sets of sample
mix-ups we identified, the mice were not assayed for mRNA expression, and so we cannot know
whether the mix-ups were in the genomic DNA samples or in the microbiome samples.
In the analysis to identify possible mix-ups, we identified a number of microbiome samples
that were similar to a pair of genomic DNA samples. We suspected that these were mixtures of a
pair of samples (one correct and one contaminant). We derived a method for analyzing such
mixtures, which provides an estimate of the proportion of the microbiome sample that comes
from the contaminant sample. Among the 297 microbiome samples, 15 had strong evidence of
being mixtures of two samples, with estimated contaminant proportions of 16–95% (and with 10
having > 50% from the contaminant sample). An additional 17 samples showed more subtle but
still compelling evidence of being mixtures. Many of these had low estimated rates of
contamination, including 10 with estimated contamination proportion < 5%.
The basis of our analysis is to identify reads that overlap an informative SNP, and to compare
the SNP allele in the read to what would be expected, given the SNP genotype for a particular
22
genomic DNA sample. Our approach thus relies on deep shotgun sequencing of the microbiome
samples as well as dense SNP genotypes on the genomic DNA samples. For the latter, we used
high-density SNP arrays in the DO mice, in conjunction with a database of SNP genotypes on the
eight founder strains, to produce very-high density SNP genotype information in the DO mice.
Metagenomic data on microbiome samples provides a more rich understanding of the
bacterial functions in the diverse population in the samples, relative to what may be learned from
single-locus 16S ribosomal RNA sequencing. It also provides the ability to identify and
potentially correct sample mix-ups and mixtures in the microbiome samples, which can further
strengthen a project’s results.
Samples that appear to be mixtures with high proportions of contamination should likely be
excluded from further analyses. But samples with more subtle contamination, say < 5%, may still
provide useful data and need not be excluded. The contamination adds to the phenotypic noise for
such traits as the abundance of individual bacterial species, or for measures of bacterial diversity.
But the contamination, if at a low rate, may be swamped by other sources of variation.
23
Acknowledgments
The authors thank the University of Wisconsin Biotechnology Center DNA Sequencing
Facility for providing sequencing and support services. They also thank the University of
Wisconsin Center for High Throughput Computing in the Department of Computer Sciences for
providing computational resources and support. This work was supported in part by National
Institutes of Health grants R01GM070683 (to K.W.B.), R01DK101573 (to A.D.A.), and
R01DK108259 (to F.E.R.), and Postdoctoral Fellowship T15LM0075359 (to L.L.T.).
24
Literature Cited
Broman, K. W., D. M. Gatti, P. Simecek, N. A. Furlotte, P. Prins et al., 2019 R/qtl2: Software
for mapping quantitative trait loci with high-dimensional data and multi-parent populations.
Genetics 211: 495–502.
Broman, K. W., M. P. Keller, A. T. Broman, C. Kendziorski, B. S. Yandell et al., 2015 Identification
and correction of sample mix-ups in expression genetic data: A case study. G3 5: 2177–2186.
Churchill, G. A., D. C. Airey, H. Allayee, J. M. Angel, A. D. Attie et al., 2004 The Collaborative
Cross, a community resource for the genetic analysis of complex traits. Nat Genet 36: 1133–
1137.
Churchill, G. A., D. M. Gatti, S. C. Munger, and K. L. Svenson, 2012 The Diversity Outbred
mouse population. Mamm Genome 23: 713–718.
Eastwood, G. L., 1977 Gastrointestinal epithelial renewal. Gastroenterology 72: 962–975.
Hannon, G. J., 2010 Fastx-toolkit, http://hannonlab.cshl.edu/fastx_toolkit.
Keller, M. P., D. M. Gatti, K. L. Schueler, M. E. Rabaglia, D. S. Stapleton et al., 2018 Genetic
drivers of pancreatic islet function. Genetics 209: 335–356.
Kreznar, J. H., M. P. Keller, L. L. Traeger, M. E. Rabaglia, K. L. Schueler et al., 2017 Host geno-
type and gut microbiome modulate insulin secretion and diet-induced metabolic phenotypes.
Cell Reports 18: 1739–1750.
Langmead, B., and S. L. Salzberg, 2012 Fast gapped-read alignment with bowtie 2. Nat Methods
9: 357–359.
25
Li, H., B. Handsaker, A. Wysoker, T. Fennell, J. Ruan et al., 2009 The sequence alignment/map
format and SAMtools. Bioinformatics 25: 2078–2079.
Lynch, A. G., S.-F. Chin, M. J. Dunning, C. Caldas, S. Tavare et al., 2012 Calling sample mix-ups
in cancer population studies. PLoS One 7: e41815.
McNulty, N. P., T. Yatsunenko, A. Hsiao, J. J. Faith, B. D. Muegge et al., 2011 The impact of a con-
sortium of fermented milk strains on the gut microbiome of gnotobiotic mice and monozygotic
twins. Sci Transl Med 3: 106ra106.
Morgan, A. P., C.-P. Fu, C.-Y. Kao, C. E. Welsh, J. P. Didion et al., 2016 The Mouse Universal
Genotyping Array: from substrains to subspecies. G3 : 263–279.
R Core Team, 2018 R: A language and environment for statistical computing. R Foundation for
Statistical Computing, Vienna, Austria.
Svenson, K. L., D. M. Gatti, W. Valdar, C. E. Welsh, R. Cheng et al., 2012 High-resolution genetic
mapping using the mouse Diversity Outbred population. Genetics 190: 437–447.
Turnbaugh, P. J., M. Hamady, T. Yatsunenko, B. L. Cantarel, A. Duncan et al., 2009 A core gut
microbiome in obese and lean twins. Nature 457: 480.
Westra, H.-J., R. C. Jansen, R. S. N. Fehrmann, G. J. te Meerman, D. Van Heel et al., 2011
MixupMapper: correcting sample mix-ups in genome-wide datasets increases power to detect
small genetic effects. Bioinformatics 27: 2104–2111.
26
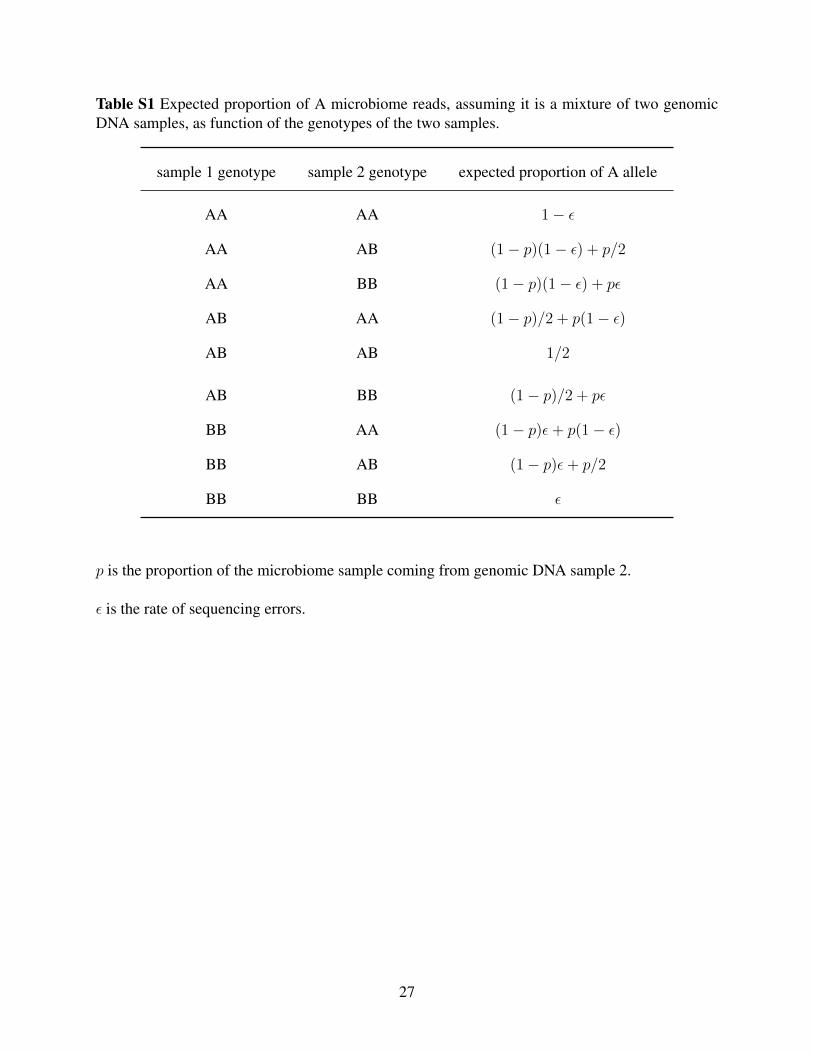
Table S1 Expected proportion of A microbiome reads, assuming it is a mixture of two genomicDNA samples, as function of the genotypes of the two samples.
sample 1 genotype sample 2 genotype expected proportion of A allele
AA AA 1− ε
AA AB (1− p)(1− ε) + p/2
AA BB (1− p)(1− ε) + pε
AB AA (1− p)/2 + p(1− ε)
AB AB 1/2
AB BB (1− p)/2 + pε
BB AA (1− p)ε+ p(1− ε)
BB AB (1− p)ε+ p/2
BB BB ε
p is the proportion of the microbiome sample coming from genomic DNA sample 2.
ε is the rate of sequencing errors.
27
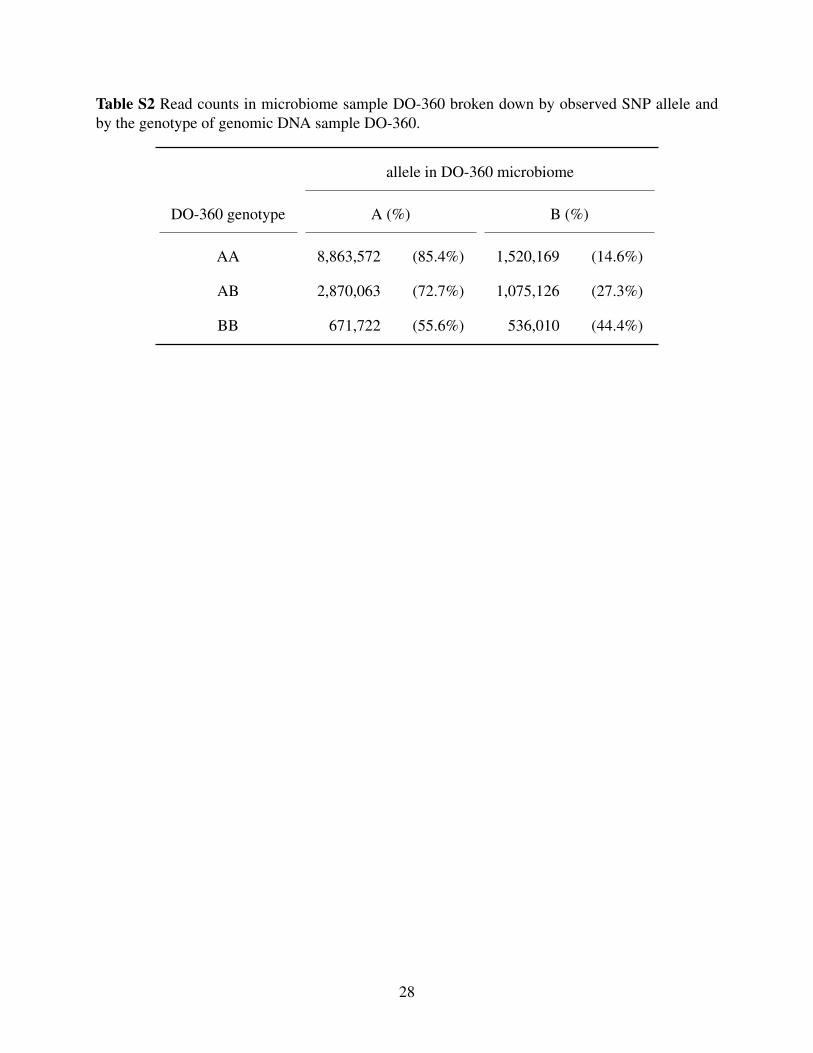
Table S2 Read counts in microbiome sample DO-360 broken down by observed SNP allele andby the genotype of genomic DNA sample DO-360.
allele in DO-360 microbiome
DO-360 genotype A (%) B (%)
AA 8,863,572 (85.4%) 1,520,169 (14.6%)
AB 2,870,063 (72.7%) 1,075,126 (27.3%)
BB 671,722 (55.6%) 536,010 (44.4%)
28
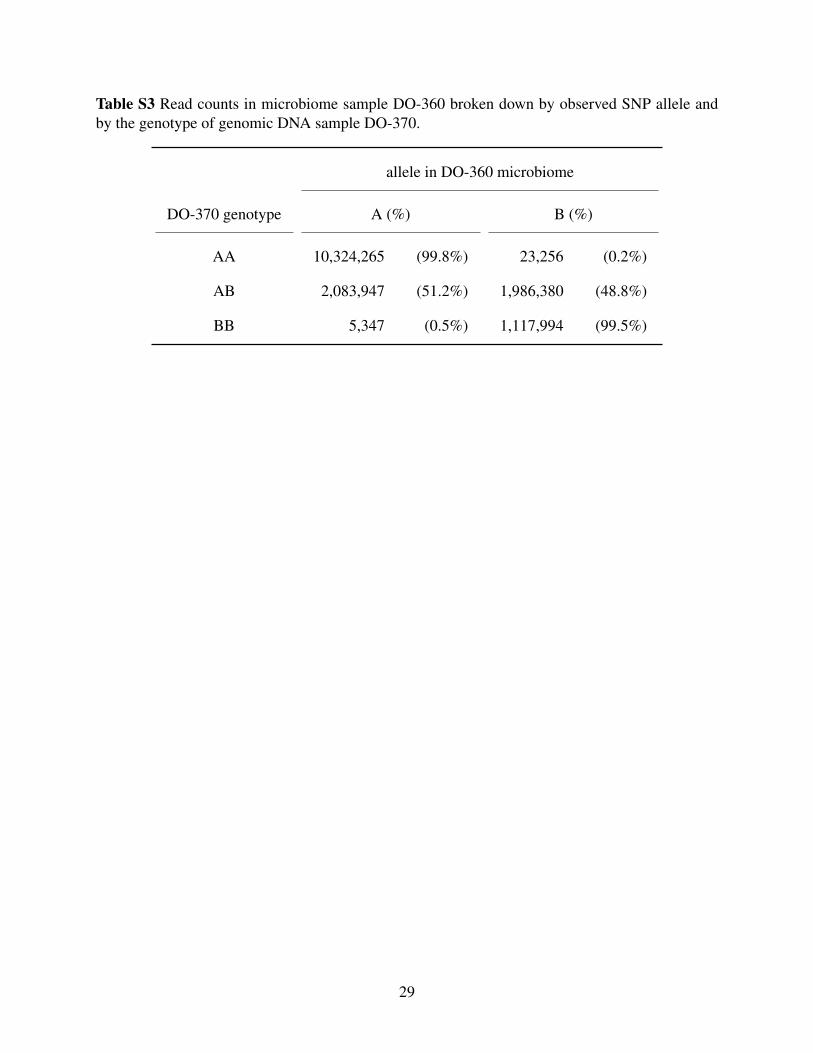
Table S3 Read counts in microbiome sample DO-360 broken down by observed SNP allele andby the genotype of genomic DNA sample DO-370.
allele in DO-360 microbiome
DO-370 genotype A (%) B (%)
AA 10,324,265 (99.8%) 23,256 (0.2%)
AB 2,083,947 (51.2%) 1,986,380 (48.8%)
BB 5,347 (0.5%) 1,117,994 (99.5%)
29
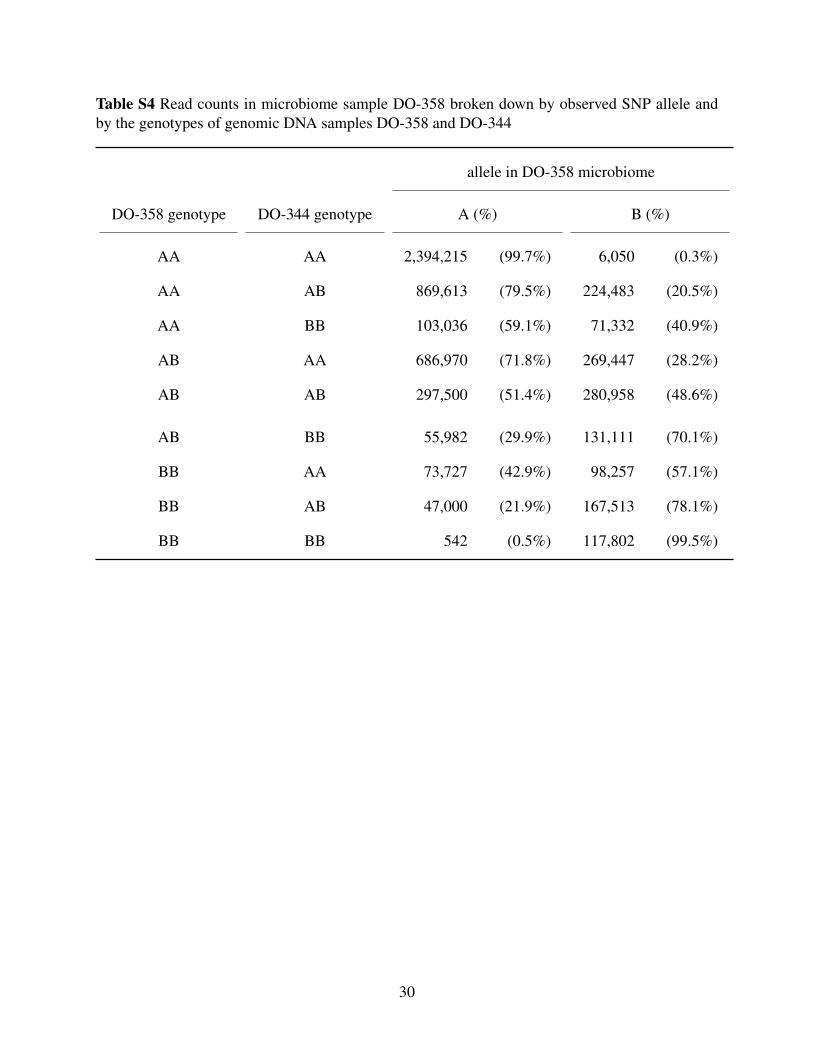
Table S4 Read counts in microbiome sample DO-358 broken down by observed SNP allele andby the genotypes of genomic DNA samples DO-358 and DO-344
allele in DO-358 microbiome
DO-358 genotype DO-344 genotype A (%) B (%)
AA AA 2,394,215 (99.7%) 6,050 (0.3%)
AA AB 869,613 (79.5%) 224,483 (20.5%)
AA BB 103,036 (59.1%) 71,332 (40.9%)
AB AA 686,970 (71.8%) 269,447 (28.2%)
AB AB 297,500 (51.4%) 280,958 (48.6%)
AB BB 55,982 (29.9%) 131,111 (70.1%)
BB AA 73,727 (42.9%) 98,257 (57.1%)
BB AB 47,000 (21.9%) 167,513 (78.1%)
BB BB 542 (0.5%) 117,802 (99.5%)
30
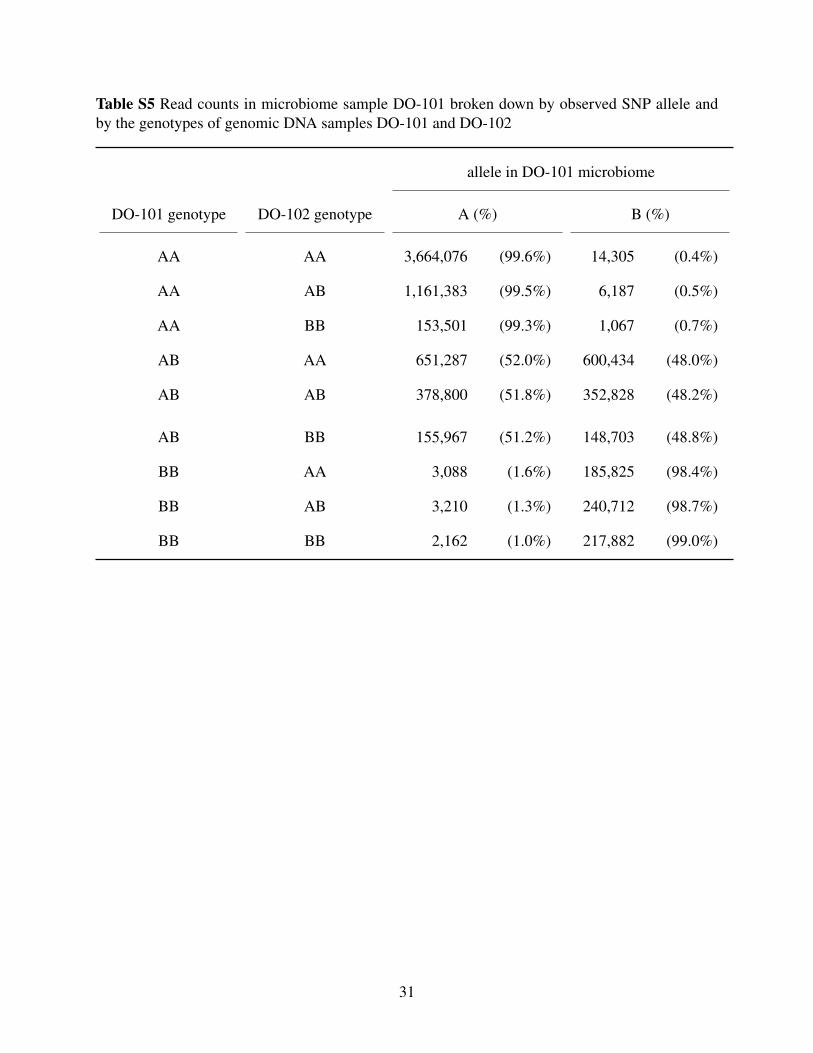
Table S5 Read counts in microbiome sample DO-101 broken down by observed SNP allele andby the genotypes of genomic DNA samples DO-101 and DO-102
allele in DO-101 microbiome
DO-101 genotype DO-102 genotype A (%) B (%)
AA AA 3,664,076 (99.6%) 14,305 (0.4%)
AA AB 1,161,383 (99.5%) 6,187 (0.5%)
AA BB 153,501 (99.3%) 1,067 (0.7%)
AB AA 651,287 (52.0%) 600,434 (48.0%)
AB AB 378,800 (51.8%) 352,828 (48.2%)
AB BB 155,967 (51.2%) 148,703 (48.8%)
BB AA 3,088 (1.6%) 185,825 (98.4%)
BB AB 3,210 (1.3%) 240,712 (98.7%)
BB BB 2,162 (1.0%) 217,882 (99.0%)
31

Table S6 Read counts in microbiome sample DO-111 broken down by observed SNP allele andby the genotypes of genomic DNA samples DO-111 and DO-112
allele in DO-111 microbiome
DO-111 genotype DO-112 genotype A (%) B (%)
AA AA 1,378,006 (99.6%) 5,121 (0.4%)
AA AB 352,914 (92.7%) 27,682 (7.3%)
AA BB 25,268 (85.8%) 4,180 (14.2%)
AB AA 337,647 (59.3%) 231,369 (40.7%)
AB AB 202,368 (52.2%) 185,606 (47.8%)
AB BB 33,524 (44.3%) 42,090 (55.7%)
BB AA 21,171 (17.0%) 103,638 (83.0%)
BB AB 9,266 (8.8%) 96,292 (91.2%)
BB BB 768 (1.0%) 77,959 (99.0%)
32
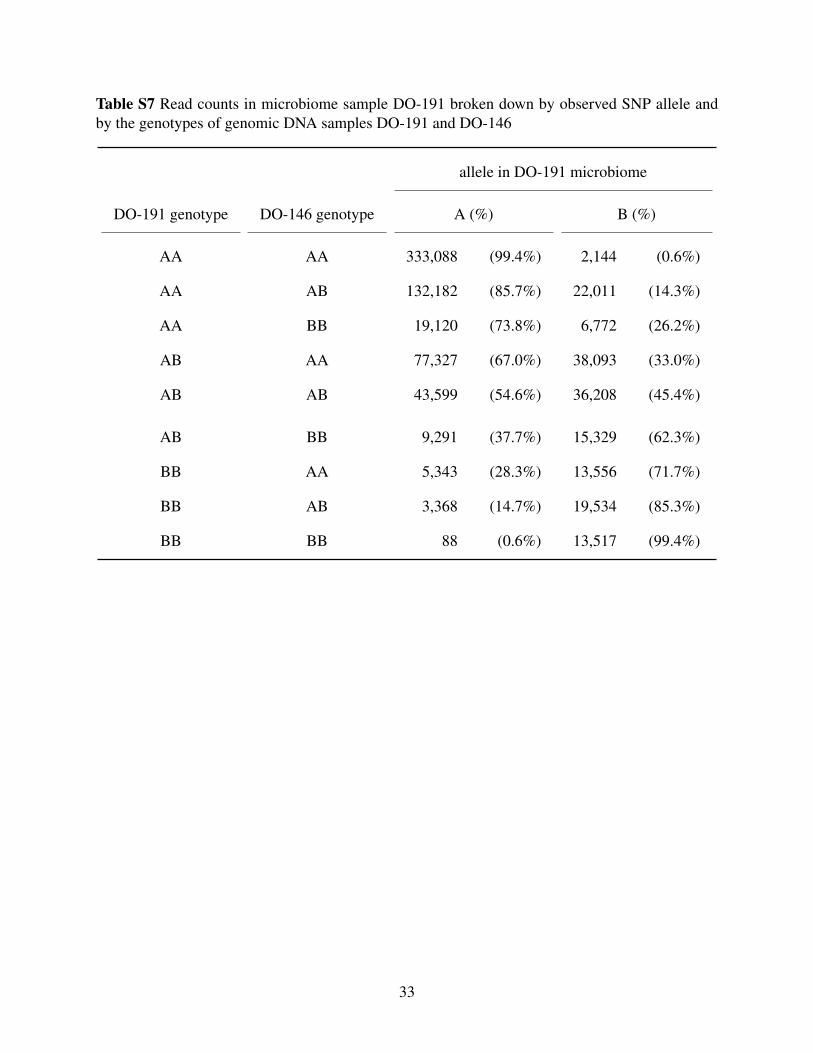
Table S7 Read counts in microbiome sample DO-191 broken down by observed SNP allele andby the genotypes of genomic DNA samples DO-191 and DO-146
allele in DO-191 microbiome
DO-191 genotype DO-146 genotype A (%) B (%)
AA AA 333,088 (99.4%) 2,144 (0.6%)
AA AB 132,182 (85.7%) 22,011 (14.3%)
AA BB 19,120 (73.8%) 6,772 (26.2%)
AB AA 77,327 (67.0%) 38,093 (33.0%)
AB AB 43,599 (54.6%) 36,208 (45.4%)
AB BB 9,291 (37.7%) 15,329 (62.3%)
BB AA 5,343 (28.3%) 13,556 (71.7%)
BB AB 3,368 (14.7%) 19,534 (85.3%)
BB BB 88 (0.6%) 13,517 (99.4%)
33
1 3 5 7 9 11 13 15 17 192 4 6 8 10 12 14 16 18 X200
150
100
50
0
Chromosome
Pos
ition
(M
bp)
A
AJB6
129NOD
NZOCAST
PWKWSB
20 40 60 80GHCHGGFGEGCGBGEFEEDEBEAEBDCCBCACBBAB
Chr 16 position (Mbp)
Dip
loty
pe
B
Figure S1 Illustration of genome reconstruction. A: Inferred diplotype across the genome formouse DO-359, with an arbitrary choice of phase. (For example, if there is a region of homozy-gosity, the haplotypes above can be swapped relative to the haplotypes below.) White indicates un-known (no diplotype had probability >0.5). B: Heat map of the diplotype probabilities for mouseDO-359 along chromosome 16. Only diplotypes that achieved probability > 0.25 are shown.
34
DO−83
Genomic DNA sample
Pro
port
ion
conc
orda
nt
0 100 200 300 400 5000.00
0.05
0.10
0.15
0.20
0.25
0.30
●●
●
●●●
●●
●●
●
●●
●●●●●●●●●●●●●●
●●
●
●●●
●●●●●●
●
●●●
●●●●
●
●
●●
●
●
●
●●●●
●
●●
●●●●●●
●
●●●●●●●●
●
●●●●
●
●●●
●●●●
●●●
●
●
●●●●●●
●
●
●
●●●
●
●●●●
●●●
●
●
●
●●
●
●
●
●
●
●
●●
●●●●●
●
●●●
●●●●●●
●●●●●
●
●
●●
●●●●●●●●●●
●
●●●
●
●●
●
●
●●●●●●●●●●●●●●●●●
●
●
●●
●
●●
●●●●●●●●●●●●●●●●●
●●
●●
●
●●
●
●●
●●
●●●●●●●
●●●●●●●●
●
●
●
●●●●●●
●●●
●●
●
●
●●●
●●●●●●●●●●●●●●●●●●●●●●●●●
●●●●●
●
●●●●
●
●●
●
●●
●●●●●●
●
●●●●●●●
●●
●●●●●
●
●●●●●●●
●
●●
●
●●
●●●
●
●
●
●●●●●●●●
●
●
●●●●●
●
●
●●●
●
●●●●●●●●●●●●●
●●●
●
●●●●
●
●●●●●
●●●●●●
●●●●●●●●●
●
●
●●●●●●
●
●
●
●●●●
●●●●●●●●●●●●●
●
●
●
●●●●
●
●●●●
●
●●●●●●●
●
●●
●●
●
●
●
●●●●●
●
●●●●●
●
●
●
●●●●●●●
●●●●●●●
●
●●●
●●
●●●●
●●●
●●
DO−88
A DO−85
Genomic DNA sample
Pro
port
ion
conc
orda
nt
0 100 200 300 400 5000.00
0.05
0.10
0.15
0.20
0.25
0.30
●●
●
●
●●●●
●●
●
●
●
●
●●●
●
●
●
●●●●
●
●
●
●
●●●●●●
●●●●●●●
●●
●●●●●●●●
●
●●
●
●●
●
●
●●
●
●
●
●●●●●
●●●
●●●
●●
●●
●
●●●●●●●●
●
●●●●●●
●●
●
●
●
●●●
●●
●
●●●●●●●
●
●●
●●
●●
●
●
●
●
●
●●
●●
●
●
●
●
●
●
●●●●●●
●●●●
●●
●
●
●●●●
●
●
●●
●
●●●●
●●
●
●
●●
●
●●
●●●●
●
●●●●
●●●
●●●
●
●
●
●
●
●
●●
●●●●●
●●●●●
●
●●●●●●●
●
●
●●●●
●
●●●
●●●●●●●
●●
●●●
●
●
●●●●
●●
●
●●●●●●●●●
●
●●●
●●
●●●
●●
●●
●●●
●●●
●●
●
●
●●●●●●●●●●●●
●
●
●●●●
●●●
●●
●●
●●●●●●●●●●●●●
●●●●
●
●
●
●
●●●●
●
●●●
●
●
●●●
●●
●
●
●●●●●●●●●●●●
●
●●●●●●
●
●
●●●●●
●
●●●●
●
●
●●
●●●
●
●
●
●●●
●●●
●
●●
●
●●●●●●●
●
●
●●●●●●
●●●
●●
●●
●
●
●
●●
●
●
●
●●●●●
●●●●●●●●
●
●●
●
●●●●●●
●
●
●●●
●
●●●●●●
●●●
●●●
●●●●●
●
●
●●●
●
●●●●●
●●
●
●●
●
●●●●
●
●●●
●●
●
●
●●●
●●●
●
DO−83
B DO−88
Genomic DNA sample
Pro
port
ion
conc
orda
nt
0 100 200 300 400 5000.00
0.05
0.10
0.15
0.20
0.25
0.30
●●
●
●
●●
●●●
●
●
●●
●●●●
●
●●●●●●
●●●
●
●
●
●
●
●●●●●●
●
●
●●●●
●
●
●
●●
●●●●●●
●
●●●●●●●●
●
●
●●
●●
●●●●●●●●
●●●
●
●
●
●●
●
●●
●●
●●●●
●●
●●
●●●●
●
●●●●●●
●●
●
●
●
●●●
●
●
●
●●
●●
●●
●●
●
●●●
●●
●●●
●●
●●●
●●●●
●
●
●●●●●●●●
●
●●●
●
●●
●●●
●
●
●
●
●
●●
●●●●●●
●
●●●●●●●
●
●
●
●
●
●●●
●●
●
●●●
●●●
●
●●●●
●●
●
●
●
●
●●●●●●●
●●●
●●●●
●●
●●●●●●●●
●●●●
●●●
●
●
●●●●
●●●●●●●●●
●
●
●●
●
●●●
●●
●
●●●●●
●
●
●●●●●●
●
●
●
●●●●●
●●●●
●
●●●
●●
●
●●●●●●●●●●
●
●●●
●
●●●
●
●
●●
●●●
●
●●●
●
●●●●●
●●●●●
●
●●●●●●●●
●
●
●●
●
●
●●
●●●●●●●●●●●
●●●
●
●●
●●●
●
●
●●●●
●
●●
●●
●
●●●
●●●●
●●●●●●
●
●●●●
●
●
●
●●
●
●●●
●●
●
●●●●●●●●●●●●●
●
●
●●●
●
●
●●●●
●
●●
●●●
●
●●
●
●●●
●
●
●
●●●●●
●
●
●
●●
●●●
●
●
●●●●●●●●●●●
●
●●●●●●●●
●
●
DO−85
C DO−385
Genomic DNA sample
Pro
port
ion
conc
orda
nt
0 100 200 300 400 5000.00
0.05
0.10
0.15
0.20
0.25
0.30
●●
●
●
●
●
●
●
●●
●
●
●
●
●
●●●●●●●●●●
●●●●●●
●●
●
●
●
●
●
●●
●●
●
●
●
●●●●
●
●●●●
●
●
●
●●●●
●●●
●
●●●
●●
●
●●●●●●
●
●
●
●
●
●
●
●●
●
●
●
●
●
●●
●●
●●
●
●
●
●●
●●
●
●
●
●●
●
●●
●
●●
●●●●●●
●●
●
●
●●●
●●●
●●
●●
●
●●
●●
●
●
●
●
●●
●
●
●●●
●
●
●
●●
●
●
●●●
●
●
●
●
●●●●
●●●●●
●
●●●
●●●●
●
●●
●
●
●
●●
●
●
●
●●●
●
●●
●
●
●
●●●
●●●
●
●
●●
●
●
●
●
●
●
●
●
●
●
●
●
●
●
●●●●
●●
●●●
●●
●●●●●●●
●●
●●●
●●
●
●
●●●●●●●
●
●
●●●●●
●●●
●●
●
●
●
●●●
●●●●
●
●●
●
●
●
●●
●
●●
●
●
●●●
●
●●
●
●
●
●●
●●
●
●●
●●
●
●●●
●●
●
●
●●●●●●●
●
●
●
●●
●
●●
●●
●●●●●
●
●●●●●●
●●●●●●●●●●●●●●●
●
●
●
●●●
●●
●
●
●
●
●●●
●●
●●
●
●
●
●
●
●●●
●
●
●
●●●●●●
●
●●
●
●●●
●●
●●
●
●
●●
●
●●●●●
●
●●
●●
●
●
●●
●
●●●●●●●●●●●
●●●●
●●●●
●●●●●●
●●
●
●
●●●●
●
●●
●
●
●
●●●
●
●●●●●●●●●
●
●
●
●
●
●
●
●●●●●●●
●
●
●
DO−322
D
DO−53
Genomic DNA sample
Pro
port
ion
conc
orda
nt
0 100 200 300 400 5000.00
0.05
0.10
0.15
0.20
0.25
0.30
●●●●
●
●
●●●●
●●
●
●●●●●●●
●
●●
●●●●●●●●●●
●
●●●
●
●
●●
●
●
●●●●
●●●●●
●
●●●●●●●●
●●
●●
●●●●●●
●●
●
●●
●
●
●●●●
●
●
●●●●●
●
●
●●●
●●●●●
●
●●
●●●
●●●●●●●●●
●
●●●●●●●
●
●
●●
●
●●●
●●●●●●●●●
●●
●●●●
●
●●●●
●●●
●●●●
●
●
●●●●●●
●
●●●●
●●●
●
●●●●
●●●●●
●
●●
●
●●●●●●●
●
●
●●●●
●
●
●●
●
●
●●●●●
●●●●
●
●●●●●
●●
●●●●
●
●●
●
●●●●●●●
●
●●
●●●●
●●●●●●●
●
●●●●●●
●
●●●●●●●
●●●●●●●●●●●●●
●●
●
●●●
●
●
●●
●●●●●●●●
●
●●●●●
●
●
●●●●●●●●●●●●
●
●
●
●●
●
●
●●
●
●●●●
●
●
●
●
●●
●●●
●●●●●●●
●●●●●●●●
●●
●●
●
●●●
●●
●
●
●
●●●
●●●●
●
●
●●●●●
●●●●
●
●●●
●
●●●
●●
●●
●
●
●●●●●●●●
●
●●
●
●
●●●●●●●●
●
●●●
●●●●●●
●
●
●
●●●●●●●●●●●●●●●●
●●●●
●
●
●●
●
●●●
●
●●●
●●●●
●●●●●●●●●●●●●●●●●●●
●
●●●●●●●●●●
DO−54
E DO−54
Genomic DNA sample
Pro
port
ion
conc
orda
nt
0 100 200 300 400 5000.00
0.05
0.10
0.15
0.20
0.25
0.30
●●●●●●
●●
●●●
●
●●●●●
●●
●
●●●
●●●●●●●
●●
●
●●●●●●●●
●
●●
●●
●●●
●●●
●●
●
●●●
●
●●●●●●●●●●
●
●●●●●●●
●
●
●●●
●●●●
●●
●
●
●
●●●●●●●●
●
●
●●●●
●
●
●
●●●●●
●
●●●●●●●●●●
●●
●●
●
●●●●●●●●
●●●
●●●
●
●●●
●●
●●●●
●●●
●
●●●●
●
●
●●●●●●●●
●●●
●●●●●
●
●●●
●●●●
●●●●●
●●●●●
●●●●●●●●●●●●
●
●●●●●●●●●●●●●
●
●●●●
●●●●●●
●
●●●
●●
●
●●●●●
●●
●●●
●
●●●●●●●
●
●●
●
●●●
●●
●
●
●
●
●
●
●●●●●●●●●●●●
●
●
●●
●
●●●●
●
●
●
●
●
●●●●
●
●●●●
●●●
●●
●
●
●
●●
●
●●●
●
●●
●●●
●
●
●
●●●●
●
●●●●●●●
●●●●●●●●
●●
●●
●
●●
●●
●●●●●●●●
●
●●●
●●●
●
●
●●●
●
●●●●●●●●●●●●●
●
●●●●
●●●●
●●●●●
●
●
●
●●
●●
●●
●●●●●●●●●●●●●●●
●
●
●
●●●
●●●
●●
●●●●●●●●
●●●●
●●●●●●●●●●
●
●●●●●●●●●
●●●●●●●●●●●●●●
●●●
●
●
●
●
●
●
●●
DO−53
F DO−174
Genomic DNA sample
Pro
port
ion
conc
orda
nt
0 100 200 300 400 5000.00
0.05
0.10
0.15
0.20
0.25
0.30
●
●●
●●●
●
●●●
●
●
●
●
●
●
●
●
●
●
●●●
●
●
●
●
●
●
●
●
●
●
●
●
●
●
●
●
●
●
●●●
●
●
●●
●
●
●●
●
●●
●
●●
●
●
●
●●
●
●●
●●
●
●●
●●●
●●●
●●●
●
●
●●
●
●
●
●
●
●
●
●
●
●●
●●
●
●
●
●
●
●
●●●
●
●
●
●
●
●
●
●
●
●
●●●
●
●
●
●
●
●
●
●
●
●
●●
●
●
●
●
●●
●●●
●
●
●
●
●
●
●
●●
●
●
●
●
●
●
●
●
●
●●
●
●●
●
●
●●
●
●●●
●
●
●
●
●●
●
●
●
●●
●
●●
●
●●
●●●
●
●
●
●
●●
●
●
●
●
●●●
●●
●
●●
●●
●●
●
●
●
●
●
●
●
●
●
●
●
●
●
●
●
●
●
●●
●
●
●
●
●
●
●
●
●●
●
●●●
●
●
●●
●
●●
●
●
●
●
●
●
●
●
●●●
●
●
●●●
●
●●●●●
●
●
●●
●●
●●●
●●
●●
●
●
●●
●
●
●
●
●
●●●
●●
●
●●
●
●
●
●
●
●
●●
●
●
●
●
●
●
●
●●
●●●
●●
●●●
●
●●
●
●
●
●●
●
●
●
●●
●
●
●
●
●
●●
●●
●●●●●●
●●
●
●
●
●●●
●
●
●
●
●
●
●
●●●
●
●
●
●
●●
●●
●
●●
●
●
●
●
●
●
●
●●
●
●
●
●
●
●
●
●
●●
●●●
●
●
●
●
●
●
●
●
●
●
●
●
●
●
●
●
●
●
●
●●
●
●
●●
●●
●
●
●●
●
●
●
●
●
●●
●●
●
●
●●
●●
●
●
●
●
●
●
●
●
●●
●
●
●●
●
●
●
●●
●
●
●●
●
●
●
●●
●
●
●
●
●
●
●
●
●
●
●
●
●●
●●
●
●
DO−340
G DO−205
Genomic DNA sample
Pro
port
ion
conc
orda
nt
0 100 200 300 400 5000.00
0.05
0.10
0.15
0.20
0.25
0.30
●●●
●
●
●●●
●
●●
●
●
●●●
●
●
●
●
●
●●
●●
●
●●●
●
●●●●●
●●●●
●●●●●●●●
●●
●
●
●●●●
●
●●●●●
●●●●●
●
●●
●●●●
●●●●
●
●●
●
●●●●
●
●
●●●●
●
●●
●●●●
●
●●●●●
●
●
●
●●
●●●●
●
●
●
●●●
●
●●
●●●●
●
●●●
●●●
●●●●
●●
●
●
●●●
●
●
●
●
●●●
●
●
●
●
●●●
●●
●●●●●●
●●●
●●●●●●●●●●●●●
●●
●
●
●
●
●
●●
●
●●●
●
●●●●●
●
●
●●●●●
●
●●
●
●●●●●●●
●
●
●
●
●●●●
●
●●
●●
●●
●
●●●●●●●
●
●
●
●
●
●●
●
●
●
●
●●
●
●
●
●●●●●●
●●●
●●●●●●●●
●●
●
●●
●●●●
●●
●
●
●●●
●
●●
●●●
●●●●
●●
●
●●
●●●
●
●
●●●●●
●
●●
●
●
●●
●
●
●
●
●●
●●
●
●●●●●
●●●●●●●●●
●●●
●
●●●
●
●●
●●
●
●●●●
●
●●●
●
●
●●
●
●
●
●●
●
●●●
●●●●
●
●●
●
●
●
●
●
●●●
●●
●
●
●
●●
●
●
●
●●
●
●
●●
●
●
●●
●
●
●●●
●
●●●●
●
●●
●
●
●
●
●
●
●
●●●●●●
●
●●●
●
●
●
●
●
●●●
●
●
●
●
●
●●●
●●
●
●
●
●
●●●
●
●
●
●●●●
●●
●●●
●●●
●
●●●
●●
●
●
●
●●●
●●●
● DO−205
H
DO−360
Genomic DNA sample
Pro
port
ion
conc
orda
nt
0 100 200 300 400 5000.00
0.05
0.10
0.15
0.20
0.25
0.30
●
●●
●
●
●
●
●
●●
●
●●
●
●
●●
●●●●●
●
●●
●
●●●●●●●
●
●●●●
●
●●●
●●
●
●●
●●
●
●
●
●
●●
●
●
●●●●●●●●●●●●
●●
●●●
●●●
●●●
●●●●●●
●
●
●
●●
●●●
●
●●
●
●●
●●●●
●
●
●
●
●
●●●
●●
●
●●●
●●
●●●●
●
●●
●●●●●
●
●
●●●
●●
●●
●●●●●
●●
●●
●●●
●●
●●
●●
●
●
●●
●
●●●
●●
●
●●●●●●●●
●
●●●●
●●●
●●●●
●●
●●●
●●●●●
●
●
●●●
●
●●●
●●●
●●
●●
●●●●●
●●
●●●●●●●●
●
●
●
●
●●●●
●●●
●●●●●
●●
●●●
●●●●●
●●
●
●●●●
●●
●●●
●
●
●●●●●●●
●●●●●●
●●
●
●
●●●●●●
●●
●●
●●
●●●●●●●
●
●●●●
●
●
●●
●●
●
●
●●
●
●
●
●●
●
●
●●●●
●
●●●
●
●●
●
●●
●●●●
●●
●
●●●●
●●●●
●
●●●
●●
●
●●●●
●
●
●●●●●
●
●●●●●●
●●
●
●
●
●
●
●
●
●●●●●●
●●●●
●●●●●●●●
●
●
●●●
●
●
●
●●●●●
●
●
●●●●●●●●●●●●●●●
●●●
●
●●●●●
●●
●●
●
●●
●●
●
●●●●
●
●●●●
●
●●
●●
●●
●
●●
●
●
●
●
●●
●●●●
●●●
●●●●
●
●
●
●●●
DO−370
I DO−370
Genomic DNA sample
Pro
port
ion
conc
orda
nt
0 100 200 300 400 5000.00
0.05
0.10
0.15
0.20
0.25
0.30
●●
●
●
●●
●●
●●●
●●
●●●●●●
●
●●●●
●●
●
●
●●●
●
●●
●
●●
●
●
●●●
●●●●●
●●
●
●
●●●●●●●●●
●●
●●
●
●
●●●●
●
●●●●●
●
●
●●●
●●●●●●●●●
●
●●●●
●
●
●●●
●
●●●●
●
●
●●●●●
●
●
●●●
●
●
●●●
●
●
●
●●●
●●●●●●●●
●
●●●●
●●●●●
●●
●●
●●●●
●●●
●●
●●●
●●●
●
●
●
●●●●●●●
●
●●●
●
●
●
●●●
●
●
●●
●●
●
●
●
●
●●●●●●
●
●
●
●
●
●●
●●●
●●
●
●
●●●●●●●●
●●●●
●
●●
●
●
●
●
●
●●●●
●
●
●
●●●●
●●●●
●
●
●
●
●
●●●●
●
●●●●●●●●●●●
●
●●●●
●
●●●●●
●●
●
●
●
●
●
●●
●
●●●
●
●●
●
●●●
●
●●●●●●
●●●
●●●
●●●●
●
●
●●
●●●●
●●●●●
●
●●●
●
●●
●
●●
●
●
●●
●●
●
●●●●●
●
●
●●
●●
●●
●●
●
●
●
●
●
●
●
●
●●●●
●
●
●
●●●●
●●
●
●●
●
●●
●●●
●●●●●
●●●●●●●
●●
●●
●
●
●
●
●●●●
●
●
●●
●
●●●●●
●●●●●
●
●●●●●●●●
●●
●●●●●●
●●●
●
●
●
●
●●
●●●●
●
●●●●
●●
●
●●●●●●●●●
●●●
●
●●
●
●●●●●●
●●●
●●●
●
●
DO−360
J DO−358
Genomic DNA sample
Pro
port
ion
conc
orda
nt
0 100 200 300 400 5000.00
0.05
0.10
0.15
0.20
0.25
0.30
●●
●●
●●●●
●
●
●
●●
●●●●●●●●●●●●●●●
●●●●
●
●
●●●●●
●●
●●
●●●●●
●
●●●
●●
●●●●●●●●●●●●●●●●●●●●●
●
●
●
●●●
●●●●
●●
●
●●●
●●●
●●●●●●
●●
●
●●●●●●
●●●●●
●
●●
●●
●●●
●
●
●●
●●
●●●●●●●●●●●●●
●●●●●●
●●●
●●
●
●●●●●●●●●
●●●●●●●●●
●●●●●●
●●●●●●●●
●
●
●●●●
●
●●
●
●
●●●●●●
●●●
●●
●●
●●●●
●●
●
●●●●●●●
●●
●●●●●
●●●●●●
●●
●●
●
●●●●●
●●●●●●
●
●●
●
●●●
●
●●●
●
●●●●●●●●
●●●●●●●●●●●●●●●
●
●●●●●●
●
●●●
●
●
●●●●●●●
●●●●●●
●
●●
●
●●
●
●●●
●
●
●●●
●●
●●●
●●●
●
●
●●●●●●●●●
●
●
●●
●●●●●●●
●●
●●
●●●
●●●●
●●●
●
●
●
●
●
●●●●●●●●●●
●
●●●
●
●●●●●●●●●●●●●●
●
●●●●
●
●
●
●●●●●●●●●
●●●●●
●●●●●
●
●●●●●●●●●●
●
●
●●
●
●●●●●●●●
●●●●●●●
●
●●
●●
●
●
●●
●●●●●●●●
●
●●●●●
●●●
●
●●
●●●●●●●
● DO−358
K DO−343
Genomic DNA sample
Pro
port
ion
conc
orda
nt
0 100 200 300 400 5000.00
0.05
0.10
0.15
0.20
0.25
0.30
●●●
●
●●●
●
●●
●
●●
●●
●
●●●●●●●●
●
●●●
●●●●
●
●
●●●●●
●●●
●●●●
●●●
●●
●
●●●●●●●●●
●
●●●●●●
●
●●●●●●●●●●●
●●●●
●●●●●●
●
●●●●
●
●
●●●
●●●
●●●●●●●●●●●
●●●●●●
●●●
●
●
●●
●●●●●●●●●●●●●●
●●●●
●
●●
●
●●●
●
●●●●
●●●●●
●●
●●●●
●
●●●●●●●●●●●●
●●
●●●●
●
●●●
●
●●●●
●●●●●
●
●
●●
●●●
●
●
●●●
●
●
●●
●
●●●●●●●
●●●●●
●
●
●●●●●●
●●
●●
●●●●●●●●●●
●
●
●
●●●●
●
●●●●
●●●●●●●
●
●●●●●
●
●●●●●
●
●●
●
●
●●●●
●●●
●●●
●●●●●●●●
●●●●●●●●●●●●
●
●
●
●●
●
●
●●
●●●●●
●
●
●●
●
●●●●●●●●●●●
●
●●●●●
●
●●●
●
●
●●●●●●●●●●
●
●●
●
●●
●
●●●
●●●●●●●●●●●●●●●●
●●●●●
●
●●●●●●●●●●
●●●●●
●
●●●●●
●●●●●●●
●●●
●
●●●
●●●●●●●●●●●
●
●●●●●
●●
●
●●
●●●●●
●●●●●●
●
●●●●●●●●
●●
●
●●●●●●●●
●
●
●●●●●●
●
●
● DO−342
L
DO−354
Genomic DNA sample
Pro
port
ion
conc
orda
nt
0 100 200 300 400 5000.00
0.05
0.10
0.15
0.20
0.25
0.30
●●
●
●
●●●●
●●
●
●●●
●●●
●
●●●●●
●●●●●●●●●●●●●
●●●
●●●●●●
●●●●●●
●●●●●●●●●●
●
●
●●●●●
●●●
●●●●●●●●
●
●●●●
●●●●●●●●●●●
●●
●●●●●●●●
●●●●●
●
●●
●
●●●●●
●●●●●
●
●●
●●●●●●●●●●●●●●●
●●●
●●
●
●●
●●●●●
●
●
●●●●●
●●●
●●●●
●●●●●●●●●●●
●
●
●●●
●●●●
●●
●
●
●
●
●●
●●●●●●●●●●●●●●●●●●●
●●●●●●●
●●●
●●●●●●●●●●●●
●●
●●●●
●●●●●
●
●●
●●●●
●●●●●●●●●
●
●
●
●●●●●●●●●●●●●●●●●●●
●
●●●●●●●
●●●
●●●●
●●
●●●●●●●●●●●●●●●
●
●●●
●
●
●●●
●●
●
●
●
●
●●
●
●●●
●●
●●●●●●●●●●●●●●●●
●
●●●●●●●●●●
●
●●●
●
●
●
●
●●
●
●●●●●●
●●●●●
●
●●●
●
●●●●
●
●
●●●●●●
●●
●
●
●
●●
●
●●●●●●●
●●●●●●●●●●●●
●●●●●●●●●●●●●●●●●●●●●●
●●●
●●●●
●●
●
●
●●●●●●●●●●●●●●●●●●●●●●
●●●
●●●●
●
●●
●
DO−353
M DO−359
Genomic DNA sample
Pro
port
ion
conc
orda
nt
0 100 200 300 400 5000.00
0.05
0.10
0.15
0.20
0.25
0.30
●●●●●●●●
●●
●●
●
●●●●●●●●●
●●
●
●●●
●●
●●
●●●●●●●●
●
●●●●●
●●●
●●●
●●
●●●
●
●●●●
●●●●●●●●●●●
●
●●●
●●●●●●●●●●●
●●
●
●●●●
●●
●
●●●●●●●●●●●●●●●●●●●●
●●●●
●●●
●●●
●
●●●
●●●●●●●
●●
●●●●
●●
●
●●●●●●●●●●●●●●●●●
●
●
●●●●●
●
●●●●●●●
●
●●
●●
●●●●●●
●
●
●●●
●●●
●
●
●
●●●●●
●●●●●●
●●●●●●●●●●
●
●●●●
●●●
●●●
●
●●●
●●
●●●●
●●●●●
●●●
●●●●●●●
●
●●●
●
●
●●●●●●
●●●●●
●●●●●●●
●●●●
●
●
●
●●●●●●●
●
●●●
●●●●●●●●●
●
●●●●●●●●
●
●●●●
●
●●●
●●
●●●
●
●●
●
●
●
●●●●●●●●●●●
●●●●●●●●●●●●●●●●
●
●●●
●
●●●●●
●
●●●●●●●●●
●●●●
●●●●
●
●
●●●●●●●●●●●●●●●
●
●
●
●●●●
●●●●●●●●●●●●●●●●●●●●●●
●
●●●●●●●
●
●●●●●●●●●●●●●●●●
●
●●●●●●●●●●
●●●●●
●●●●●●
●
●●
●
●●
●
●●
●
●●●
●
DO−345
N DO−362
Genomic DNA sample
Pro
port
ion
conc
orda
nt
0 100 200 300 400 5000.00
0.05
0.10
0.15
0.20
0.25
0.30
●●●
●
●●●●
●
●
●●●
●●●●●●●●●
●●●●●
●
●●●
●●●●●●●●
●●●
●
●
●●●●●●●●
●●
●●●●
●●●
●
●●●●●●●●●●●●●●
●
●
●●
●●●●●●●●
●
●
●
●●●
●●●●●●●●
●
●●
●●●●●
●●●
●●●●
●●●●●●
●●●●
●●●●●
●
●
●●●●●●●●●●●●●●●●●
●●●●●
●●●●●●
●●●●●●
●
●●●●●●●●●●●
●●●
●●●●●●●●
●
●●●
●●●
●
●
●
●●●●●
●●●●
●●
●
●
●●
●●●●●●●●●●●●●●●●●●●
●
●●
●
●●
●●●●
●●●●●●●
●
●
●
●
●●●●●●●●●
●●●
●
●
●
●●●●●●●●●●
●●●
●●●
●
●●●●●●
●●●●
●●●●●●●●●●●●●●
●●●●●●●
●
●●●●●
●●●
●●
●
●●
●
●●●
●●●
●
●
●
●●●●
●
●●
●
●
●●●
●
●
●●
●
●
●
●
●●●●●●●
●
●
●
●●●
●
●●
●
●●●●
●●
●●●
●●●●●●●●●
●●●●●●●●
●
●●●●
●
●
●●●●●●
●
●●●●●●
●●●●●
●●
●
●
●●●●●●●
●●
●●●
●●●●●
●●●●●
●●
●
●●●
●
●●
●●
●●
●●●●
●
●
●
●●●●
●
●●●●●●●●●●●●●
●●
●
●●
●
DO−361
O DO−344
Genomic DNA sample
Pro
port
ion
conc
orda
nt
0 100 200 300 400 5000.00
0.05
0.10
0.15
0.20
0.25
0.30
●●●
●
●
●
●
●
●
●
●
●●
●●●●●●●●●
●●●●●●
●●●●
●
●
●●●●●
●●●●●●
●
●●●
●●
●
●●●●●●●●●
●
●●●●●●●
●●●●●●●●●
●●
●●●●
●●●
●
●●
●
●●●
●
●
●●●●
●●●
●●●●●●●●●●●
●●●●●●●●●
●
●
●●
●●●●●●●●●●●●●●
●●●●
●
●●
●●●●●
●●●
●
●●
●●●●●
●●●●
●
●●
●●●●
●●●●●●●●●●●●
●●●
●
●
●●●
●
●●●●
●
●
●
●●
●
●●
●
●
●●●
●
●
●
●●
●●●●●
●●
●●●●●
●
●
●●●●
●●
●●
●●
●●
●●●●●
●
●●
●●
●
●
●●●
●
●●●●
●●
●●●●●●●●
●●●
●
●●●●●●
●●●
●
●
●●●
●●●●
●●
●●●●●●●●●●●●●●
●●●●●
●
●
●
●
●
●
●
●
●●●
●●
●●●●●●
●
●●●●●●●●●●●
●●●●●●●
●●●
●
●●●
●●
●
●
●●●
●
●●●
●
●
●
●
●●●
●
●●●●●●
●
●●●●●●
●●●●
●
●●
●
●●●●
●●●●●●●●●●●
●
●●●●●●●●●●●●●●●
●
●●●●●●●●
●●
●●●●
●●●●●●●●●
●●
●●●●
●
●●●●
●●
●
●●●●●●●●●●
●
●●●●●
●●●●
●●●●●●●
●
●
●
DO−343
P
DO−329
Genomic DNA sample
Pro
port
ion
conc
orda
nt
0 100 200 300 400 5000.00
0.05
0.10
0.15
0.20
0.25
0.30
●●
●●●●●
●
●●
●
●●
●●
●●●●
●
●●●●●●●
●
●●●●●
●●●●
●●●●●●●●●
●●●
●
●
●
●
●
●●●●●●●
●
●●●●
●●
●●●●
●●●●●
●
●●●
●
●●●●●
●●
●●●●●●●●
●●●●●●
●●●
●
●●●
●●●
●
●●●
●
●●
●
●●●●
●●●●●●●●●●●●●
●●
●
●●●●●●●
●●
●●
●●●●●
●
●●●●
●●●●●●●
●●
●●●●●●
●●●●●●
●●●●
●
●●●
●
●●●
●●●●●●●
●
●●●●
●
●
●●●●
●
●●●●
●
●●●●
●●●●●●●
●●
●
●
●
●●●●●●●●●
●
●●●●●
●●
●
●
●●●●
●●
●●●●
●
●●
●
●●
●●●●●●●●
●
●●●●
●
●
●
●
●
●
●●
●●●●●●●●●
●
●
●●●
●
●
●
●
●
●
●
●●●●●●●
●
●●
●
●
●
●
●
●●●
●
●●●
●●●
●●●●●●●●●●
●
●●
●●●
●
●
●
●
●
●
●●●
●
●●
●●
●
●●●●●
●
●●
●
●
●●
●
●●
●
●●●
●
●●●●
●
●●●●●
●●●●
●●
●
●
●●●●
●●
●
●●●
●●●
●●
●●●●●●
●●●●●
●
●
●●●
●
●●●●
●
●●●●●●●●●●●●●●
●●
●●
●●
●
●●●●●●
●
●●●●●
●●
●●●
●
●●●●●●●●●
●●●●●●●●●
●
DO−328
Q DO−346
Genomic DNA sample
Pro
port
ion
conc
orda
nt
0 100 200 300 400 5000.00
0.05
0.10
0.15
0.20
0.25
0.30
●●
●
●
●●●●●●
●
●●
●●●●●●●●●
●
●●●●●
●●●
●●●●
●●●●●●
●●●●
●
●
●
●
●●●
●●
●
●
●●●●●●●●●
●
●●●
●●●●●●●●●●●●●●●●●●
●
●●
●
●●●●
●●
●●●
●
●●●
●
●●●●●
●
●●●
●●
●
●●●
●●●
●
●
●●●●●●
●
●●●●●●●●●●●●●
●
●
●
●●●
●●●
●
●
●
●●●●●
●
●●●●●●●●●
●●●●●
●
●●●●
●●●●●●●●●
●
●●●●●●●●●
●●●●●
●●●●
●
●●
●●●●●●●●●
●●●●●●●●●
●●●●●●●
●●
●●●●●
●●●
●
●●
●
●
●
●
●●●●
●
●●●●●●●●●●●●
●●●●●●●●
●
●●●
●
●●
●
●●
●●
●●●●●●
●
●
●
●
●●
●●●
●●
●
●
●●●●●●
●
●
●
●
●●●●
●
●●
●●
●
●●●●●
●
●●●
●●
●●●●
●●●●●●●●●
●
●●●●●●●●●●●●●●●●
●●●●
●
●●●●●
●
●
●●●●●
●●●
●●●●●●
●
●●●●
●
●●●
●●●●
●
●
●●●●●
●●●●●
●
●●●●●●●
●●
●
●●●●●●
●●
●●●●
●●●●●●●●
●
●
●
●
●●●●●●●●●●●●●●●●
●●●
●
●●
●●●●●●●●●●●●
●
●●●●●●●
●
DO−331
R DO−41
Genomic DNA sample
Pro
port
ion
conc
orda
nt
0 100 200 300 400 5000.00
0.05
0.10
0.15
0.20
0.25
0.30
●●●●●●●●
●●●
●
●●●
●
●●●●
●
●●●●●●●●●
●●
●
●●●
●
●●●
●
●
●
●
●●
●
●●
●●●
●●
●
●
●
●
●●●●●●●●●●●●●●●●●●●●
●●
●
●
●
●●●●●
●
●
●
●●●●●●●●●●●
●●
●●●●●●●●●●●●●●
●
●
●●
●
●
●
●
●●
●●●●
●●
●●●●●
●
●●●●
●●●●
●●●●
●
●●●●
●
●
●●●●●●
●
●●●●●●
●●●●●●●●
●●●
●●●●
●●
●●
●
●●●
●●
●
●●●
●
●
●
●
●●●●
●
●●●
●
●●●●●●●●●
●●●●●●●
●●
●●
●
●●●
●●
●●●●●●●●●
●●
●
●
●●●●●●
●
●●●●●●●●●
●●●●●
●●●●●●●●●●●●●
●
●
●●●
●●
●
●
●
●
●
●
●●
●●
●●●●
●●●●●●●
●●●●
●
●
●●●
●
●
●
●
●●
●●
●
●
●●
●●●●●●●●●●●●●●●●●●
●●●
●
●
●●●●●●
●●●●●●●●
●
●●
●
●
●●●●●●●●●
●
●
●●●●●●
●●
●●●
●
●●●
●
●●
●●
●●
●
●
●●
●●
●●●●●
●●●●●●●●
●●●
●
●●
●
●●●●●●●
●●●●●
●
●●
●●
●●●
●
●●●●●●
●●
●
●
●●●
●
●●●●●●●●
●●●●
●●●●●●
●
●●●●●
●
●●
●
●
DO−32
S DO−340
Genomic DNA sample
Pro
port
ion
conc
orda
nt
0 100 200 300 400 5000.00
0.05
0.10
0.15
0.20
0.25
0.30
●●
●●
●●
●
●
●
●●●
●
●●●
●●
●
●●
●
●
●●
●
●
●
●
●
●●●
●
●●●
●
●
●
●●●●●●●●●
●●●
●
●●
●
●
●
●●●
●
●
●●●
●●
●
●●
●
●●
●
●
●●
●●●
●
●
●
●●●
●
●
●
●
●●●●
●
●
●
●
●
●
●
●
●●●●
●
●●
●●
●
●
●
●
●
●●
●●
●
●
●●●●
●
●
●●●
●
●
●
●
●
●●
●
●●
●
●
●●
●
●
●●
●
●●●●
●
●●
●●
●●
●
●
●
●
●
●●●●●●●●
●●●●
●●●●●
●
●
●●
●●●●●
●●●
●
●
●
●●
●●
●
●●●●
●
●
●●●
●●
●
●●●
●●●
●●●●●
●
●
●
●●●
●
●
●●
●
●●
●
●●
●
●
●●
●
●●●
●●
●
●
●
●●●●●
●
●●
●
●
●●
●
●
●
●●●●
●
●
●●
●
●●●●
●
●●
●
●
●●●●●
●
●●●
●
●
●
●●
●●
●
●
●
●●
●●●●
●
●●●
●
●
●●●●●●●●
●
●●
●●
●
●
●
●●●●●●
●
●
●
●
●●
●
●●●●
●
●
●
●●●●●
●
●
●
●●●
●
●
●●●
●
●
●●
●
●
●
●●
●●
●
●
●
●●●
●
●
●●●●
●
●
●
●●●
●
●●
●
●
●
●●
●●●●●●
●
●●
●●
●
●
●
●●●●
●●
●
●●●●●
●
●
●
●
●
●
●●
●
●
●●●
●
●
●●
●
●
●
●
●
●●●●
●
●●
●●
●
●●
●
●●
●
●●●●
●
●●●●●
●
●●
●
●●
●
●●
●
●●●
●●●
●
●
DO−339
T
DO−336
Genomic DNA sample
Pro
port
ion
conc
orda
nt
0 100 200 300 400 5000.00
0.05
0.10
0.15
0.20
0.25
0.30
●●●●●●●●
●●
●
●●●●●●●●●●●●●●●●
●
●●
●
●●
●●●●●
●
●●●●●
●●●
●●
●●
●●●
●●●●●
●
●
●●
●●●●●●●●
●●●●●●
●
●●
●●●●●
●●
●
●●
●
●
●
●
●●●
●●●●●●
●●●●
●
●●●●●●●●
●●●●
●●
●
●●●●
●●●●
●●●●
●●●●
●●●●●●
●
●●
●●●●
●
●●●●
●●
●●●
●●●
●●
●
●●●●●
●
●●●●●●
●
●●
●●●●
●
●●
●
●
●●
●
●
●●●●●
●
●
●●●●●●●●●●●●●●●●●●●●
●●
●●●●●
●●●
●
●
●
●●
●●●●●●●
●●●
●
●
●●
●●●●●●●●
●●
●●
●
●●●●●●
●
●●●●●
●●●
●
●
●●
●
●●
●
●●●●●●●
●●●
●
●●
●
●●
●●●●●●●●
●●●
●
●●
●
●
●●●
●
●
●●●
●
●
●●●●
●
●
●
●●●●●
●●●●●●
●●●
●●
●●
●●●
●
●●●●●●●●●●
●
●
●
●
●
●●
●
●
●
●
●●●●●●●●●●●●
●
●
●●●●●●●●●●●●●●●●
●
●
●
●●●●●●●●
●●●●●●●●
●
●●●
●
●
●
●
●
●●●●●●
●●●●●●●
●●●
●●
●
●●●●●●
●
●●●●●
●
●●
●●●
●●●●
●
●
●●●
●
●
●●●
●
●
●●●
●
●●
●
●
●
●
DO−349
U DO−327
Genomic DNA sample
Pro
port
ion
conc
orda
nt
0 100 200 300 400 5000.00
0.05
0.10
0.15
0.20
0.25
0.30
●●
●
●●●●●
●●
●
●
●
●
●●●●●●●●●●●●
●
●
●●●
●●●●●●●
●
●●●●●●●●
●●
●●●
●●●●
●●●●●
●
●●●●●
●●●●●
●
●●●
●
●●●●●●
●●●●●●●
●
●●●●●●
●●●
●
●
●
●●
●
●
●●
●
●●●●●●
●●
●
●
●●●●
●●
●●●●●●●●●●●
●●●
●●●●●
●●
●
●●●●●●●●●●●●●●
●●●●●
●●●●
●●
●
●●●●●●
●
●●●●●●
●●●●
●
●
●
●
●●●●●
●
●
●
●●●●●●●●●
●●●●●●●●●●●●●
●●●●●
●
●●●
●
●
●●
●●
●●●
●●●●●●●●
●
●●●●●●●●●●●●●
●●
●
●●●●●
●
●
●
●●●●●●●
●
●
●
●
●
●
●●●
●
●●●
●●
●●●
●●
●●
●
●
●●●●●
●●●●
●●
●
●
●●●●●●●●
●●
●●●●●●
●
●
●●●●●●●●●●
●●
●
●
●●
●
●
●●
●
●●●●●●●●●●●
●●●●
●●
●
●●●●●●●
●●
●●
●
●
●●●●●●●
●
●●●●
●●●●●●●
●●●
●
●
●●●●●●
●●●●●●
●
●●
●
●●●
●
●
●
●●●●●●
●●
●●●●●●●●●●
●
●
●
●●
●●●
●●
●●●●●●●
●
●●●●
●●●●
●
●●●●●●
●●
●●●●
●●●●
●
●●
●
DO−326
V
Figure S2 For selected microbiome samples, plots of their distance to each genomic sample, withdistance measured by taking, among reads that overlapped a SNP where the genotyped sample washomozygous, the proportion with an allele that was discordant with the inferred SNP genotype.The sample with what should be the correct label is highlighted in dark pink. A set of low-qualityDNA samples are highlighted in pale pink.
35
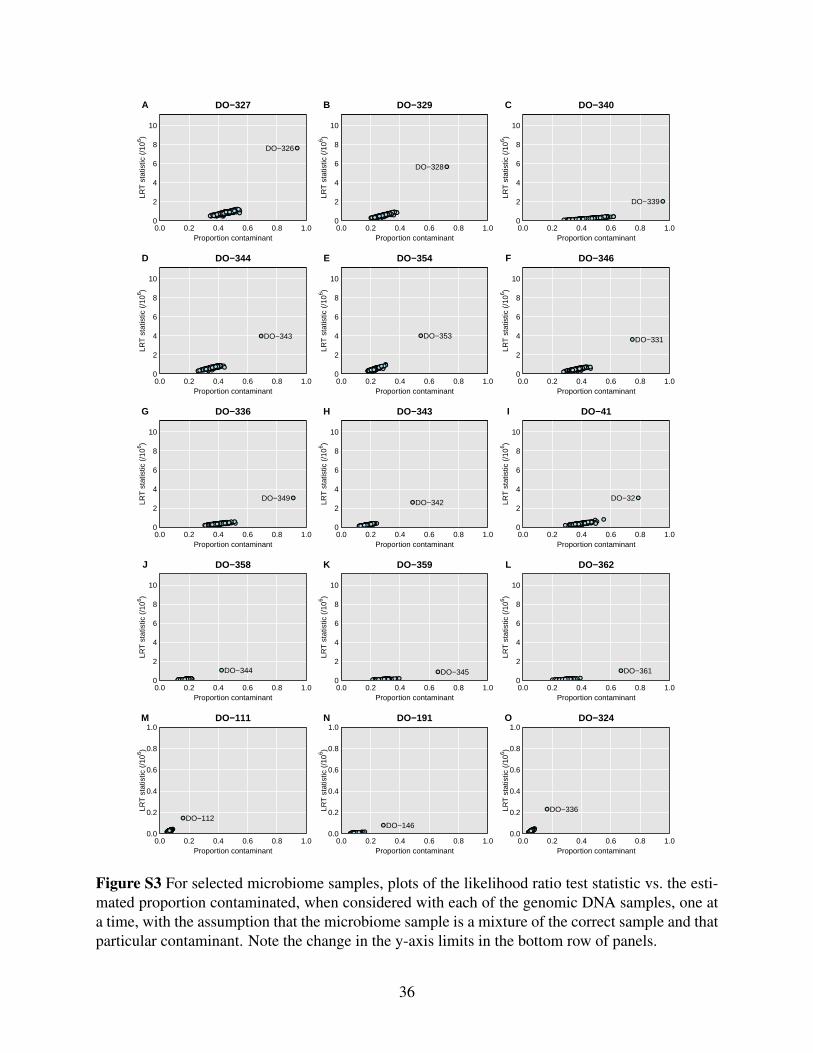
DO−327
Proportion contaminant
LRT
sta
tistic
(/1
06 )
0.0 0.2 0.4 0.6 0.8 1.00
2
4
6
8
10
●●●●●
● ●●●●●●●●
●●●● ●●
●●●●● ●● ● ●●●●●●●●●
● ●●●● ●●●●●● ●●●
●●●●
●●● ●●●●● ● ●●● ●●●●●●
●●●● ●●●●●
●●●●●● ●●●●
●●
●●●● ●
● ● ●●●●●● ●
●●●●●●● ●
●●●●●
●●●
●●●
●●●●●●●●●●● ●●●●●●●●●●●●● ●● ●●●●
●● ●●
●● ●
●●●●● ●●●
●●
● ●●●● ●●●●●● ●● ●●●
● ●●●●●●●●●
●●●●
● ●●● ●● ●●
●●● ●●●●●●●●
●●●●●●
●●
●●●●● ● ●●●●●●●●
●●●●●●●● ●●●●●
●●●●●● ●●● ●●●● ●●
●● ●●● ●●●● ●●●●●●●● ●● ●
●●●● ●●●
●●●
●●●●●●●●
●●
●●●● ●●●● ● ●●●●●● ●● ●●●● ●●●● ●●
●
●●●●● ●
●
●●●●
●● ●●●●●
● ● ●●●●●●●●●●●●●●●●●●●●●●●
●●● ●●●●●
● ●●●●
● ●●●●●●● ●●● ●● ●● ●
●● ●●
●● ●●●●●●●●●
●●●●●●●●● ●●●●
●●● ●●●●●●●
●●●●● ●●●●
●●●● ●●
●●
●●
●●
●● ●●●● ●●● ●●● ●●●●●
●●●●● ●●●●●
DO−326
A DO−329
Proportion contaminant
LRT
sta
tistic
(/1
06 )
0.0 0.2 0.4 0.6 0.8 1.00
2
4
6
8
10
●●●●●●
● ●●●
●●●●●●●●●●●● ●●●●●
●●●● ●●●● ●●●● ●●●●●●●●●●
●●●●●●● ●●●●
●●●●
●●●●●●●●●●●●● ●●●●●●●●● ●●●●●●●●● ●●● ●●●●●●●●● ●● ●●●
●●● ●●●● ●●●● ●●●●●●●●● ●●
●●
● ●●●●●●●●●●
●● ●●●●●●●● ● ●●●●● ●
●●● ●
●● ●●●●● ●●●●●● ●●●●●●●● ●● ● ●
● ● ●●●● ●●●●●● ●●●● ●●● ●●●●●●● ●●●●●●●●●●●●
●●● ●● ● ●●●
●●●●● ●●●●●●●●●●●●
●●●●●●●●●●●● ●● ●● ●●●●●● ●●●●●● ●●●
●●●●● ●●●● ● ●●
●●● ●●●●●● ●
●●
●●●
●●●●●●●●●●●●●●●●
●●●●●●● ●●●●●●
●●●● ●●● ● ●●●●
●
●●●●● ●●● ●●●● ●
●●●● ●● ●●●●
●●●●
●● ● ●●
●● ●● ●●●●
●●●●● ●●●● ●●●●●●●●●●●●●●● ●●●
● ●●●●●●●
●●●●● ●●●●●●●●●●●●●●●●●●● ●●● ●●
●●●●●● ●
● ●●●●● ●●●● ●●●●●●●●● ●●●●●
●●●●●●●
DO−328
B DO−340
Proportion contaminant
LRT
sta
tistic
(/1
06 )
0.0 0.2 0.4 0.6 0.8 1.00
2
4
6
8
10
● ●●● ●● ●● ●●●●● ● ●●●● ●● ●●● ●● ● ●●●● ●●●●●● ● ●● ●●● ●●● ● ●● ●● ●● ● ●● ● ●●●● ●●●●●● ● ●●●●● ●● ● ●●● ●●●● ●●●● ●● ● ●● ●●●●● ●● ●● ●● ●● ●●● ●● ●●● ●●●●●● ●●● ● ●● ●●● ●● ●● ●● ● ●●● ●● ●●●●● ●● ●● ●●●●●●●●●● ●
● ●●●● ●● ●● ●● ●●● ●●● ●●●● ●● ●●●●● ●● ● ● ● ●● ● ●●●●● ●●● ●● ●●●● ●●●●● ● ●●● ● ●●● ● ●●● ●●● ●●● ●● ●● ● ●●● ●●● ● ●●●● ●● ● ● ●● ●●●●● ●●●●●●● ● ●● ●●● ● ●●● ●●● ●● ● ●●● ●●●●●● ●● ●● ● ●● ●●● ●● ●●● ●
● ●●● ●● ●● ●●●●●● ●●●●● ● ●●● ●● ●●● ●● ●●●● ● ●●● ●●●●
●
●●●●● ●● ●●●● ●●●● ●● ●●●●●●● ●●● ●●● ●●●●● ●●●●● ●●●● ●●● ● ●●●●● ●●● ●● ●● ●● ●●● ●●● ● ●● ●● ●● ●● ●● ●●● ●● ●●● ● ●●●● ●●●● ●● ●● ●● ●●● ●●●●●●●●●●● ●●●● ● ●● ●●● ●●● ●●● ●● ● ●●● ●●●●●● ●●● ● ●
DO−339
C
DO−344
Proportion contaminant
LRT
sta
tistic
(/1
06 )
0.0 0.2 0.4 0.6 0.8 1.00
2
4
6
8
10
●●●●●●●
● ●●● ●●●●●●●
●●●●●● ●●●●●●● ●● ●●●●●●●●●●●●●●●● ●●●●●●●●●●
●●
●●●●● ●●●●●
●●●● ●● ●●● ●●● ●●●● ●● ●●●● ●●●●●●●● ●●●●●●●●
●● ●●●●●●●● ●●● ●●
●● ● ●●●●● ●●●●●●● ●● ●● ●●●●●● ●●●●●
●●●●●●●●● ●●●● ●
● ●●●● ●● ●●●●●●●●●●●● ●●●● ● ●● ● ●●●● ●●●●●● ●● ●● ● ●●●● ●●●●● ●●●● ●●●●●●●●●
●●●●● ●●●●●●●●●●●●● ●● ●● ●●●
●● ●●●●●●●●● ●●●●●● ●●●●● ●●●●●● ●
●●●●●●● ●●●●●●●●●●
●●●●●●●●
● ●●●
●●●●●●●●●●●● ●●●●●●● ●● ●● ●●●●●●●●●●●●●● ●●● ●●
●●●● ●●●●● ●●●●●●●●●●●●●●●
●
●●● ●●●●●● ●● ●●●● ●●●●●●●●● ●● ●●●●●●●● ●●● ●●●●● ●●●● ●●●●●●●●●● ●●● ●●●●●●● ●●● ●●●●●●●● ● ●● ●● ●●● ●
●●●●●● ●● ●
● ●●●●●● ●●●● ●● ●●●●●●●●●
DO−343
D DO−354
Proportion contaminant
LRT
sta
tistic
(/1
06 )
0.0 0.2 0.4 0.6 0.8 1.00
2
4
6
8
10
●●●●●●●● ●●●●●●●●●●●●●●●●●●●●●●●●●●●●●●●●●●●●●●●●● ●●● ●●●●●●●● ●●●●● ●●●●●●●●●●●●● ●●●●● ●●● ●●● ●
● ●● ●●●●●●
●●● ●●●●●●● ●● ● ●●●●●●● ●●●●●●●●●●●●●●● ●●● ●●●●●●●●●●● ●●● ●●● ●●●●●●● ●●●● ●●●● ●●● ●●●●● ●●●●●●●●●●●● ●● ●●●●
●●●● ●●●●●●●●●●●
●● ●●●●●●●●●●● ●●●●●●●●●
●●●●●●●●●●●● ●●●●●●● ●●
● ●●●●●●●●●●●
●●●
●●●●●●●● ●●●●●● ●●●●●●●●●●●●● ●● ●● ●●●● ●●●●●●●●●●●●●●●●●●●●●●●●
●●●●●●● ●●●● ●●●●●●●●●●●●●●●● ●●
●●●●●● ●●●●
●
●●●●●●●●●● ●●●●●●●●●●●● ●●●●●●
●●●●●
●●●●●● ●● ●●●● ●●●●
●●● ●●●●●● ●●● ●●●● ●●●●●●●●● ●●●●●
●● ●●● ●●●●● ●●●●●●●●●●●●●●●
●●●●●●●●●●●●●● ●●●●●●●●●●●●●
●
DO−353
E DO−346
Proportion contaminant
LRT
sta
tistic
(/1
06 )
0.0 0.2 0.4 0.6 0.8 1.00
2
4
6
8
10
●●●●●● ●● ●●●● ●●●●●● ● ●● ●●●●●● ● ●●●
●● ●●● ●●● ●●●●●●●●● ●● ●●●●●●●●●● ●●●● ●●●●●●●●●●● ●● ●●● ● ●● ●●●●●●●●●● ●●●●●●● ●●●● ●●●●●●
●● ●●●●●●● ●●● ●● ●●●●●●●● ●●●●●● ●●
● ●●●● ●●●●● ●●●● ●●● ●●●●●● ●●●● ●● ●●●● ●●●●● ●●● ●● ●●●● ●● ●● ●●●●●●●● ●● ●●●● ●●●● ● ●●●●●●●●● ●●●●●●● ●●●●●●● ●●● ● ●● ●●●● ●●●●● ●● ●●● ●●● ●●●●●●●● ●● ●●●●●● ●●●●●●●● ●●●●● ●●●● ●●● ●●●● ●●●●● ●● ●●● ●●●●●●● ●● ●●●●●●●●● ●● ●●●● ● ●● ●● ●● ●● ●●
●●●● ● ●●●●●●●●●● ●●●● ●●●●● ●● ●●● ●●●●●●●● ●
●
●●● ●●●●●●● ●●● ●●●●●
●●●● ●●●
● ●● ●●●●●● ●●● ●● ●●●●● ●●●●●● ●●●●●● ●●●●●● ●● ● ●●●●●● ●●●●●●●●●
●●●● ●●●●●●●●●● ●●●●●●● ●● ●● ●● ●●●● ●●● ●●●● ●
DO−331
F
DO−336
Proportion contaminant
LRT
sta
tistic
(/1
06 )
0.0 0.2 0.4 0.6 0.8 1.00
2
4
6
8
10
●●●● ●● ●● ●●●● ●●●●●● ● ●●●●● ●● ● ●●●● ●● ●●●●● ● ●●● ●●●● ●●●●● ●●●●●● ●●● ●●● ●● ● ● ●●●●● ●●● ●●●●●●●● ●●●●●● ●●●●● ●●●●●●●●● ●●●● ●●●● ●●●● ●●●● ●●●● ●●●●● ●●●● ●●●●● ●●●● ●● ●●●●●●●●●●● ●●● ●● ●● ● ●● ●●● ●● ●●●● ●●●●●● ●●●●●●●● ●● ●● ●●
● ● ●●●●●●● ●● ● ●●● ●●●● ●● ●●●●● ●●●●●●● ●●●● ●●●● ●●● ●● ●●●● ●●●● ●●●● ●●● ●●● ●● ●●●●●●●●●●● ● ●●●● ●●● ●●●● ●● ●● ●●●●●●●●●●● ●●● ●● ● ●●●●●●●● ● ●●● ●●●●●●●● ●● ●●●●●●●●
●
●●● ●●●●●● ●●● ●●●● ● ●●●●●● ●●● ●●● ●● ●●●●●●●●● ● ●●● ●●● ●●● ●●● ●●●●●● ●●●●●●●●● ●●●● ●● ●●●●● ●● ●●●● ●● ●●●● ●●● ●●●●●●●●●●●●● ●●● ●●●
●●●● ●●●●● ●●●● ●●●● ●● ●●●●● ●●● ●●●●●● ● ●●● ●●●●●● ●● ●●●● ●●●
DO−349
G DO−343
Proportion contaminant
LRT
sta
tistic
(/1
06 )
0.0 0.2 0.4 0.6 0.8 1.00
2
4
6
8
10
●●●● ●● ●●●●●●●●●● ●●●●●● ●● ●●●● ●●● ●● ●●●●● ●●●● ●●●● ●●●●●●●●●●●●●● ●●●●●●●●● ●●●●●●●● ●●●●●●●●●●●● ●●●●●●●●●●●●●●● ●●●●●●●●●●● ●●●●●●●●●●● ●●●●●●●●●● ●●●●● ●●● ●●●●●●●●●●●●●●●●●●●● ●●●●● ●●●● ●●●●●● ●●●●●●●●●●●●●●●● ●●●●●●● ●●●●●●●●●● ●●● ●●●● ●●●●●●●● ●●●●●●● ●● ●●●●●●●●●●●●●● ●●●●●●●●●●●●●●●●●●●●● ●●●●●●●●●●● ●● ●●●●●●●●●●●●●●● ●●●● ●●●●●●●●●●●●●●●● ●●●●●●●●●●●●●●●●●●●●●●●●●●●● ●●●●● ●●●●● ●●●●●●●●●●●● ● ●●●
●
● ●●●●●●●●● ●●●●●●●●●● ●●●● ●●●●●●●● ●● ●●●●●● ●●●●●●●●●●●●●●●●●●●●●● ●●●●●●●●●● ●●●●● ●●●●● ●●●● ●●●●● ●● ●●●● ●●●●●●● ●●● ●●●●●●●●●●●●●●●●● ●
DO−342
H DO−41
Proportion contaminant
LRT
sta
tistic
(/1
06 )
0.0 0.2 0.4 0.6 0.8 1.00
2
4
6
8
10
●●●● ●● ●● ●●●●●●● ●●● ●●●●● ●●● ●● ● ●●●● ●●●●●● ●●●●
●●●●● ●●●●●●●●●● ●●
●●●●● ● ●●●●
● ●●●●●● ●●●
● ●●●●●●● ●● ●
●
● ● ●●● ●● ●● ●●●●●●●●●●●●● ●● ●● ●● ●●●●●●● ●●●● ●●●●● ●● ●● ●● ●●●●●● ●●●● ●●●●●●●●●● ●●● ●●●● ●●●●● ● ●●● ●● ●●●● ●●●●●● ●●●● ●●●● ●● ●●●● ●●● ●●●●●●● ●●●● ●●● ●● ●● ●●●●●
●●●●●● ●● ●●●●● ●●● ●●●● ●●●●●● ●● ●●●●● ●● ●●●●● ●●●● ●●●● ●●●● ●●●●● ●●●●●
●●●● ●●●●● ● ●●● ●●●●● ●●●● ●● ●●●●● ●●●● ●● ●● ● ●●● ●●●● ●● ●● ●●● ●●●● ●● ● ●●● ●●●●●●●●●●●●●● ●●●●●● ●●●●●●●●●● ●●● ●●●●●●● ●●●●● ●● ●●●●● ●● ●●●● ● ●●● ●●● ●●●● ●● ●● ●●●●● ●●●●●●●●●● ●●●● ●●●●● ● ●●●● ●●●● ●● ●● ● ● ●●● ●●●●● ●● ● ●●● ●● ●● ●●● ●●
● ●●● ●●● ●● ●
DO−32
I
DO−358
Proportion contaminant
LRT
sta
tistic
(/1
06 )
0.0 0.2 0.4 0.6 0.8 1.00
2
4
6
8
10
●●●●●●●● ●●●●●●●●●●●●●●●●● ●●● ●●● ●●●●● ●●●●●●● ●●●●● ●●● ●●●●●●●●● ●●●●●●●●●●●●●●● ●● ●●●●●●● ●● ●●●●●● ●●●●●●●●●●●●●●●●●●●●● ●●●●●● ●●●●●●●●●●●●●●●●●●●● ●●●●●● ●●●● ●●●●●●●●●●●●●● ●●●● ●●●●●●●●●●●●● ●●●●●●● ●●●●●●●●●●●●●●●●●●●●●●● ●●●●●●●●●●●●●●●●●●●●●●●●●●● ●●●●●●●●●●● ●● ●●●●●● ●●● ●●●● ●●●●● ●●●● ●●● ●●●●●●●●●●●●●●●●●●●●●● ●●●●●● ●●● ●●●● ●●●●●●●●●●●●●● ●●●●●●●●● ●●●● ●●●● ●●●●●●●●●●●●●●● ●●●●●●●●●●●●●●●●●●● ●●●●●●● ●●●●●●
●
●●●●●●●●●●●●●●●●● ●●●●●●●●●●●●●●●●●●●●●●●●●●●● ●●●● ●●● ●●●●●●● ●●●●●●●●●●●●●●●●●●●●●●●●●● ●●● ●●●●●●● ●●● ●●●●●●●●●●●●
DO−344
J DO−359
Proportion contaminant
LRT
sta
tistic
(/1
06 )
0.0 0.2 0.4 0.6 0.8 1.00
2
4
6
8
10
● ●●● ●● ●● ●●●●● ●●●●● ●●●●●●●●●●●●●●● ●●● ●●● ●●●●●●● ●● ●●● ●●●●●● ●●● ●●●●●●● ●●● ●● ●●● ●● ●●● ●●●●●● ● ●●●●● ●●●●●●●● ●●●●●●● ●●●● ●●●●●●●● ●●●●●●●●●●●● ●● ●●●● ● ●●●●● ● ●●●●● ●●●●●●●● ●●●●●●●●●●●● ●●●● ●●●●●●●●●●● ●●●●●●● ●●●● ●●●● ●● ●●●● ●●● ●● ●●●●● ●●● ●●●●● ●●●●●●●●●●●●●● ●● ●●●●● ●●●●●●●●●●●●● ●●●●● ●● ●● ●●●●● ●●●● ●●●●●●●●●● ●●●●●●●●●●●● ●●●●●
●
●●● ●●●●● ●●●●●●●●●●●●●●●● ●● ●●●●●●●● ●●●● ●●●●●●●●●●● ●●●●●●● ●●●● ●●●●●●●●●●●●●●● ●●●●● ●●●●●●● ●●● ●●●●● ●●●●●● ●● ●● ●●●●●●●●●●● ●●●● ●●●●●●●●●●● ●●● ●●●● ●●●●●●●●●●●●●●● ●●●● ●●●● ●● ●●● ●●● ●●● ●●●●● ●●●●●●● ●●●●●● ●●●●● ●
DO−345
K DO−362
Proportion contaminant
LRT
sta
tistic
(/1
06 )
0.0 0.2 0.4 0.6 0.8 1.00
2
4
6
8
10
●●●● ●● ●●●● ●●●●●●●● ● ●●●●●● ●● ●●●● ●●●● ●●●● ●●●●●●●●●●●●● ●●●●● ●●● ●●● ●●●●●●●●●●●● ●● ●●● ●●● ●●● ●●●● ●●●● ●●●● ●● ●● ●● ●●● ●●●●● ● ●●●● ●● ●●●●● ●●●● ●●●●●● ●●●●●● ●●●●●●●● ●●● ●●●● ●●● ●●●●● ●●●● ●● ●●●●●●●●●●● ●●●●●●●● ●●●●●●● ●●●●● ●● ●●● ●●●● ● ●●● ●●●●● ●●●●● ●●● ● ●●●●●●●●● ● ●●●● ●●●●●● ●●● ●●●●●● ●●● ●●● ●●●●●●● ●●●●●● ●●●●● ●● ●●●●●● ●●●●● ●●●●●●●●●● ●●● ●●●●●●● ●●●● ●●●● ●●●●●●● ●●●● ●● ●
●
● ● ●●●●●●● ●●●●●● ●●●●●● ●●● ●● ●●●●●●● ●●●●● ●●● ●●●●●●● ●●● ●●●● ●● ●●● ●●●●●●●●●●●●●●●●●● ●●● ●●●● ●●●● ●●● ●●●●● ●●●● ●●●● ●●●●● ●● ● ●● ● ●●● ● ●●●● ●●●●● ●●●● ●●●●● ●●●● ●●●●●● ●●●●●● ●●●●●● ●●●
DO−361
L
DO−111
Proportion contaminant
LRT
sta
tistic
(/1
06 )
0.0 0.2 0.4 0.6 0.8 1.00.0
0.2
0.4
0.6
0.8
1.0
●●●●●●●●●●●●●●●●●●●●●●●●●●●●●●●●●●●●●●●●●●●●●●●●●●●●●●●●●●●●
●●●●●●
●
●●●●●●●●●●●●●●●●●●●●●●●●●●●●●●●●●●●●●●●●●●●●●●●●●●●●●●●●●●●●●●●●●●●●●●●●●●●●●●●●●●●●●●●●●●●●●●●●●●●●●●●●●●●●●●●●●●●●●●●●●●●●●●●●●●●●●●●●●●●●●●●●●●●●●●●●●●●●●●●●●●●●●●●●●●●●●●●●●●●●●●●●●●●●●●●●●●●●●●●●●●●●●●●●●●●●●●●●●●●●●●●●●●●●●●●●●●●●●●●●●●●●●●●●●●●●●●●●●●●●●●●●●●●●●●●●●●●●●●●●●●●●●●●●●●●●●●●●●●●●●●●●●●●●●●●●●●●●●●●●●●●●●●●●●●●●●●●●●●●●●●●●●●●●●●●●●●●●●●●●●●●●●●●●●●●●●●●●●●●●●●●●●●●●●●●●●●●●●●●●●●●●●●●●●●●●●●●●●●●●●●●●●●●●●●●●
DO−112
M DO−191
Proportion contaminant
LRT
sta
tistic
(/1
06 )
0.0 0.2 0.4 0.6 0.8 1.00.0
0.2
0.4
0.6
0.8
1.0
●●●●●●●●● ●●●●●●●●●●●●●●●●●●● ●●●●●●●●●●●●●● ●●●● ●●●●● ●●● ●●●●●●●●●●●●● ●●● ●●●●●●●● ●●●●● ●●●●●●●●●●●●●●●●●●● ●●●●●●● ●
●
●●●●●●●●●●●●●●●●●●●●● ●●●●●●●●●●●●●●●●●● ●●●●●●●●●●●●●●●●●●● ●●●●●●●●●●●●●●●●●●●●●●●●●●●●●●● ●●●● ●●●●●●●●●●●●●● ●●●●●●● ●●●● ●●●●●●●●● ●●●●●●●●●●●●●●●●●●●●●●●●●●●●● ●●●●●●●●●●●●●●●● ●●●●●● ●●●●●●●● ●●●●●●●● ●●●●●●●●●●●●●●●●● ●● ●●●●●● ●●●●●●●●● ●● ●●●●●●●●●●●●●●●●●●●●●●●●●●●●●●●● ●●●●●●●●● ●●●●●●●●●●● ●●●● ●●●●●●●●●●●●●●●●●●●●●●● ●●●●● ●●●●●●●●●●●●●●●●●●● ●●●●●●● ●●●●●●●●●●●●●●●●●●●● ●●● ●●● ●●●●●●●●●● ●●●●●●●●●●●●
DO−146
N DO−324
Proportion contaminant
LRT
sta
tistic
(/1
06 )
0.0 0.2 0.4 0.6 0.8 1.00.0
0.2
0.4
0.6
0.8
1.0
●●●●●●●●●●●●●●●●●●●●●●●●●●●●●●●●●●●●●●●●●●●●●●●●●●●●●●●●●●●●●●●●●●●●●●●●●●●●●●●●●●●
●●●●●●●●●●●●●●●●●●●●●●●●●●●●●●●●●●●●●●●●●●●●●●●●●●●●●●●●●●●●●●●●●●●●●●●●●●●●●●●●●●●●●●●●●●●●●●●●●●●●●●●●●●●●●●●●●●●●●●●●●●●●●●●●●●●●●●●●●●●●●●●●●●●●●●●●●●●●●●●●●●●●●●●●●●●●●●●●●●●●●●●●●●●●●●●●●●●●●●●●●●●●●●●●●●●●●●●●●●●●●●●●●●●●●●●●●●●●●●●●●
●
●●●●●●●●●●●●●●●●●●●●●●●●●●●●●●●●●●●●●●●●●●●●●●●●●●●●●●●●●●●●●●●●●●●●●●●●●●●●●●●●●●●●●●●●●●●●●●●●●●●●●●●●●●●●●●●●●●●●●●●●●●●●●●●●●●●●●●●●●●●●●●●●●●●●●●●●●●●●●●●●●●●●●●●●●●●●●●
DO−336
O
Figure S3 For selected microbiome samples, plots of the likelihood ratio test statistic vs. the esti-mated proportion contaminated, when considered with each of the genomic DNA samples, one ata time, with the assumption that the microbiome sample is a mixture of the correct sample and thatparticular contaminant. Note the change in the y-axis limits in the bottom row of panels.
36
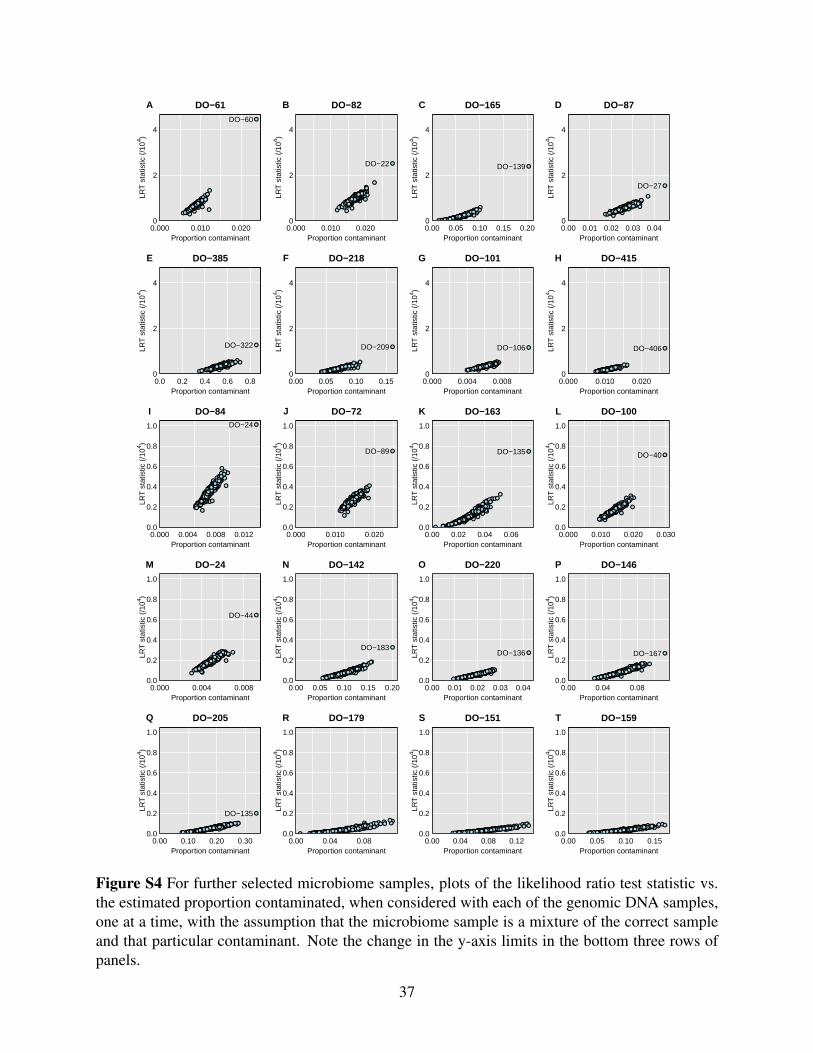
DO−61
Proportion contaminant
LRT
sta
tistic
(/1
04 )
0.000 0.010 0.0200
2
4
●●●●●
●
●●●●●●
●●
●●●●●●●●
●
●
●
●●
●●
●●
●
●●●
●●●●●
●●●●
●
●●
●●●
●●
●●
●
●●●
●
●
●●●
●●
●
●●
●●●●●●
●
●●
●
●● ●●
●●
●●
●● ●
●
●●
●●●●
●●●
●●●●
●
●●●
●
●
●●●●
●●
●
●
●
●
●●●●●
●
●
●●●●
●●●●●●●
●●●●
●●●●●
●●●
●●●
●●●
● ●●
●
●●●●
●
●●
●
●
●●●
●
●●●●●●●●●●
●●●●●●
●● ●●●●●
●●
●●●
●
●●●
●●●
●●
●
●
●●●●●
●
●
●●●
●
●●
●●
●●●
●
●●
●●
●●
●●●●●●●●
●●●
●●●
●●
●
●● ●●
●●●
●●●●
●●
●
●●
●
●●●●
●●●●●
●
●
●
●●
●●●
●●
●●●●●●●●●●●●
●●●●
●●●
●●
●●●●
●●●
●●
●●
●●
●
●●
●●●●
●●● ●●●●
●●●●●
●●
●● ●●●●●
●
●●●
●●
●●
●●
●●●●●●●●●
●
●
●●●●●
●●●●●●●●●●●●●●
●●
●●
●●●●●●
●●●
●●
●●
●●●
●●
●●●
●●●
●
●
●●●
●●●●
●●
●
●●●●●●
●●●●
●●●
●●●
●●
●●●
●●●●
●
●
●●
●●●
●
●●●
●● ●
●
●
●●●●●
●
●●●●●●●●
●
●●
●●●
●●
●●●●
●
DO−60
A DO−82
Proportion contaminant
LRT
sta
tistic
(/1
04 )
0.000 0.010 0.0200
2
4
●
●●
●●
●●●
●●
●
●
●
●
●●
●●
●
● ●●●
●●
●●
●●
●
●
●●●
●●
●●●●
●
●●●●●●
●●●●
●
●●
●●●
●●
●●●●
●
●●
●●●
●●●●●
●
●
●●●●●
●●
●●●●●
●●●
●
●●
●●●●●●
●●●
●
●●●●
●
●●
● ●●
●●●
●
●●
●●
●●●
●
●●●●
●
● ●●●
●●
●●
●
●
●● ● ●●●●●
●●
●●
●
●●●●●
●●
●
●●
● ●●
●
●●●●●
●●
●●●
●●● ●●
●●●●●
●●
●●●
● ●●●
●●●●●
●●
●●
●●●●
●
●●●
●●●●●●●● ●
●
●
●●
●●●
●
●●●●
● ●
●
●●●●●●●●●●● ●●●●
●●
●●
●●●
●●
●
●●●
●●●●
●
●●●●
●
●●●
●● ●●●●
●●
●●●●●
●●
●●
●●●
●
●●●●
●●
●
●●
●●
●●
●●●●
●
●● ●●●
●
●
●●●
●●●●
●●
●●● ●●●
● ●●●
●●
●●
●●
●●●●●●
●
●●
●●
●●
●
●●●●●
●●●
●●●●●
●
●●●●
●●
●●●
●
●
●●
●
●
●●●●●●●
●●
●●●●
●●
●
●●●●
●●●●●
●●●
●●●●
●●● ●
●
●●
●●●●
●● ●●●
●●
●
●●●
● ●●
●
●●
●●●
●
●●
●
●●
●●
●●●
●
●●
●●●●
●
●
●●
●
●●●●
●●●●●
●●
●●●●●●●
●●
DO−22
B DO−165
Proportion contaminant
LRT
sta
tistic
(/1
04 )
0.00 0.05 0.10 0.15 0.200
2
4
●●●●●●
●●●
●●●●●●
●●●●
●
●
●●●●● ●●●
●●
●● ●●●●●
●●●●
●
●●
●● ●●●●●●●●
●●●
●
●●
●
● ●●● ●●●●●
●●
●●●●●●●●●
●● ●
●●
●●●●●●
●●●●●●●●●
●● ●●●●●
●● ●
●●●
●●●● ● ●●●●●●●●●● ●
●●● ●●
●●●●●
●●●●●●●
●
●●●●●●●●●●●● ●
●● ●● ●●●●●
●●●
●●●
●●●●
●●
●●●●
●●●
●
●
●● ●
●●● ●●
●
●
●●● ●●
●●●●●
●●●●●●●●●●●
● ● ●● ● ●●●●●●
●●●
●●●●
●
●●●●●● ●●●●
●●●●●● ●
●●● ●
●●
● ●●●●●● ●●● ●●●●
●
●●●●
●● ●●●
●●
●●●
●●
●●●
●●
●●●
●
●●●●
● ● ●●●●
●●
●●●●●
●●●●●
●● ●
●●●●●●●●●●
●●
●●●●●● ●●
●
●●● ●
● ●●●●
●●
●●● ●●
●
●●●
●●● ●●●●●●
●●
●●●●
●●● ●●
●
● ●●● ●●
●●●
●●●
●●●● ●●
●●●●●
●●
●● ●●●●●●●●●●●
● ●●●● ●●●●●●●●●●●●●
●●●●●●●●●
●●
●●●
●●●
●●
●
●
●●●
●●●●
●●●●●
●●
●
●●● ●●
●
●
●
●● ●● ●
●●
DO−139
C DO−87
Proportion contaminant
LRT
sta
tistic
(/1
04 )
0.00 0.01 0.02 0.03 0.040
2
4
●●●●
●●
●● ●●
●●
●●
●●●●●
●●●●●
●
● ● ●●●
●
●
●●●●●●●●●●●●●●
●●
●●●●
●
●
●●
●●●
●
●●●
●●●
●
● ●●●
●●
●
●
●●●● ●●●●
●●●●●
●●●
● ●●●
●●●
●
●●
●●●●●●● ●
●●●
●● ●
●●
●
●●●●●●●●
●●●
●●●
●●●●●●●●●
●●
●●●●●●●
●●●
●●●
●●●
●●●●
●●●●
●
●●●
● ●
●●
●●●●
●●●
●●●● ●●●●
●●
●●
●●
●
●●●●●
● ●●●
●●●●
●●●● ●●
●
● ●●●● ●
●
●●
●
●●
●
●
●● ●●●
●●●●●
●●●●●●
●●
●●●●●●
●●
●●●●
●●●
●●
●●●● ●●●
●●●●●● ●●●
●●●● ●●
●●
●● ●
●●●●●●●
●●●●
●●
●
●●
● ●●●●●
●●●
●●●●●●
●● ●●
● ● ●●●●
●●● ●● ●●●
●●
●●● ●
●● ●
●
●●●●
●●
●●● ●● ●● ●
●●●●● ●●● ●●●
●●●●
●●● ●●●●
●●●●● ●●●●●●●●●●● ●
● ●● ●●●●●
● ●●●
●●●●●●●●●
●
●
●●●
●●●●●
●●●●●
●●●
●●
●
● ●
●
●
●●●
● ● ●●
●●
●●●
●●●
●●
●●●
●●●●●
●●
●●
●●●●●●●
●●● ●●
●●●●
●●●
DO−27
D
DO−385
Proportion contaminant
LRT
sta
tistic
(/1
04 )
0.0 0.2 0.4 0.6 0.80
2
4
●●●
●●
●●●
●●● ●●●●●● ●
● ●●
● ●●
●● ●●
●●●●●●●●
●●● ●●●●
●● ●●●●●
●●●
●●●
●●●●
●● ●● ●● ●●●●●●●●●
●●
● ●●●●●●
●●
●●● ●●●●
●●●
●●●
●●●●●●●● ●
●●●●●●●
●● ●
●●●
●●●●●● ●●●
●●
●●●
●●●●
●● ●●
●●
●●●●
●● ●●●
●●
●●●
●●●●●
●● ●
●●● ●● ●●●● ●●●●●●●●●●
●
●●●●
●●●
● ●●●
● ●●●●●● ●●
●●
●●● ●●● ●●●
●●
●●
●●●
● ●●
●●●
●
●●●●●
●●●
●●
●●●● ●● ●●●●
●● ●●● ●●
●●●●●●●●●●●●●
●●
●
●●●●
●●●●●● ●● ●● ●
●●●
●●●● ●●●●●●
●●●●●
●
●● ●●●
●
●●●● ●● ●●
●●●●●● ●●●
●● ●●● ●
●●
●●●
● ●●●●
●● ●●●
●●●●
● ●●●
●●●● ●●●●●
●●●●●
●●●●
●●●●●● ●●● ●● ●●● ●
●●●●●●●●●●
●●●
●●●●●●●●●
●●●
●●●●●
● ●●●●●●
●●
●●●●● ●
●● ●●●●●
●●●●
●●●●
● ●●●
●●●●●●
●● ●●
● ●●●●● ●●●
●●●●● ●●●●●
●● ● ●●
●●●
●●●●
DO−322
E DO−218
Proportion contaminant
LRT
sta
tistic
(/1
04 )
0.00 0.05 0.10 0.150
2
4
●●●●●● ●
●●●●
●●●●
●●●● ●●●●
● ●●●
●●
●●
●● ● ●●●●
●●●
●● ●●●●
●●●●●● ●●● ●
●●● ●●●●●●● ●
● ● ●●● ●● ●
● ● ●● ●●●
●●●●●●
●●●●●●●●●●●●● ●●
●●● ●●●●●● ●
● ●●
●● ●●●● ●●●●
●●●●
●● ●● ●
●●
●
● ●●●●● ●
●●
●●● ● ●●●
●●● ●●●●
●● ●●●
●●●●
●●●●● ●●●●●●●● ●
●● ●●●●
●●●●
●●●●
●●●●●●●●
●●●●● ● ●
● ●●●●
●●
●●●●●
●●●
● ●● ● ●●● ●●●●● ● ●●●● ●●
●●●●
● ●● ● ●●●
●
●●● ●●●● ●●●●● ● ●● ●●
●●●● ●●●●● ●●
● ●●●● ● ●●●●●●●● ●●●
●●
●●●
● ●●●●●●● ●●●●●●●●●●●●●●●●
● ●●
●●
●●●●●●● ●
●●●●●●● ●●●●●●●●●●●●●●●
● ●●●
● ●●● ●●●●●●●●●● ●●●● ●
● ●●●
●●●●
●●●●●
●●●
●●●●
●●●● ● ● ●●● ●●●●●●●
●●●● ●● ●●●●● ● ●
●●●●
●●●
●●●●●●
●●●
● ●●●●●●●●● ●● ● ●●●●
●●●●●●● ●●●●●● ●●●
●●
●●●
●●●●
DO−209
F DO−101
Proportion contaminant
LRT
sta
tistic
(/1
04 )
0.000 0.004 0.0080
2
4
●●●● ●●
●● ●●● ●●●●●●●●
●
●●●●●●● ●●●●
●●●● ●●● ●●●● ●●●●●●●●●
● ●● ●●●●●
●●●
● ●● ● ●●●
●●
●●●●●
●●●●● ●●●●●●● ●●● ●●●●●●●● ● ●●●
●●●●●●●●
●●● ●●●●
●●●●●●●●●●● ●
●●● ●●●● ● ●● ●●●
●●● ●●●● ●● ●●
●●●●●● ●● ●
●●● ●● ●●●●●●●●●●●●●
●●●●●●● ●●
●●●●●
●●●●●●
●●●● ●●● ● ●●
●●●●
●●
● ●●
● ●●●●
●●●●●
●●● ●●
● ●●●●●●●●●●●●●●●● ●●● ●
●● ●●● ●●● ●● ●●●●
●●●●●●●●●
●● ●●● ●●● ●●
●●●●●●●
●●●●●
●●●
● ●●●●● ●
●●●
●●●●●●●●●●
●● ● ●●●● ●
●●●●● ●●●
●●●●●●
●●●●● ●●●●●
●●●●
●●●●●●●●●●● ●●● ●●●●
●● ● ●●●●●●●●●● ●● ●●●
●●● ●●●●●● ● ●● ●●●● ●●●●●●●●●●●●●●●●
●●●●●●●●●●●● ●●●● ●●●●●
●●
●●●●● ●●● ● ●●●●●●● ●
●●●●●●●●
●● ●●● ●●
● ●●●●●●●●●●●●●●●
DO−106
G DO−415
Proportion contaminant
LRT
sta
tistic
(/1
04 )
0.000 0.010 0.0200
2
4
●●●● ●●●●●●●●●●●●● ● ●●●●●● ● ●●●●●● ●●●●●●●●●● ●
● ●●●●●●●● ●●●●●●●●●●●
● ● ●●●●●●●● ●●● ●● ●●●●● ●● ●● ●●● ●●●● ●●●●●●●● ●●● ●●●●● ●● ●●●●●●● ● ●●●
●●●●● ●●●●●● ●●●●● ● ●● ●● ●●●●●● ●●●●● ●●●● ●●●●● ●
●● ● ●●●●●● ●●
●●●● ●●●●●●●● ●● ●● ●●● ●●●●● ●●
● ●●●●●●● ● ●● ●● ●●●● ● ●●● ● ●●●● ●●●●●●● ●●●
●●●● ●● ●●●●●● ●●●●●●●● ●●
●●●●● ●●● ●●●● ●●●● ●●●●● ●●●●●●●●● ●●
●● ●
● ●●● ●● ●●● ●●● ●●●●
●●●●
●
●
●●●●●●● ●● ●●●● ●●● ●●●●● ● ●● ●●●●●●●● ●●●●
●●●●
●●
●●●●●●●●●● ●
●● ●●●● ●●●● ●● ●
●●● ●●
●●●● ●● ●●●●●●●●●●●●●●● ●● ●●● ●●●● ●●●● ●●●●
●● ●●●●● ●●●●● ●●●●● ●● ●● ●● ●●●
●●●●●●●●●●
●● ●● ●●●●
●● ●●●●●●● ●● ●● ●●
●●● ●●●●●● ● ●●●●
●
DO−406
H
DO−84
Proportion contaminant
LRT
sta
tistic
(/1
04 )
0.000 0.004 0.008 0.0120.0
0.2
0.4
0.6
0.8
1.0
●●
●●
●
●
●
●
●●●
●●
●●●
●●
●●
●●
●●●
●
●
●
●
●
●
●●
●
●
●●
●●●
●
●
●●●
●●●●
●●●●●
●
●●
●●
●
●
●
●
●
●●
●
●●
●
●●●●
●
●
●●●●
●
●●●●
●●●
●
●
●●●
●●
●
●
●
●
●●
●●
●
●●●●
●
●
●●
●●
●
●
●●
●
●
●●●●
●
●●
●
●●●
●●
●
●
●
●
●●
●
●
●
●●
●
●●●
●
●
●●
●
●
●
●
●
●
●
●
●
●
●●
●
●
●
●
●●●●
●●●
●●
●●●
●●●
●●
●
●
●●●
●●
●
●
●●
●
●●●
●
●
●● ●
●
●
●
●
●
●
●●●●
●●●
●●
●
●
●
●
●●
●
●●
●
●
●●●
●
●
●● ●
●
●
●
●
●●●● ●
●●
●●●
●
●
●●●
●
●●
●
●
●
●
●
●
●●●
●●●●
●
●
●●
●●
●
●●
●●●●
●
●●
●●
●●●●●
●
●●●●
●●
●●
●●
●
●
●
●
●
●
●●●
●
●
●●
●
●
●
●●
●●●
●●●● ●
●●●
●
●
●●●
●●
●
●
●●●
●
●
●
●●●●
●
●
●●●
●●
●●
●
●
●●
●●
●●
●
●●●
●
●
●
●
●
●
●
●●●
●●
●
●●
●
●
●
●●●
●●●
●
●
●●
●●●
●
●●
●●●
●●
●
●
●●
●●
●●●
●●●
●
●●●
●●●
●●
●
●
●
●
●
●
●
●
●●
●
●
●●
●●
●
●●
●●
●
●
●
●
●●●
●
●
●
●
●●●●●
●●
●●
●●
●
●●
●●●●
●
●
●
●●
●
●●
●
●●●
DO−24
I DO−72
Proportion contaminant
LRT
sta
tistic
(/1
04 )
0.000 0.010 0.0200.0
0.2
0.4
0.6
0.8
1.0
●
●●●
●
●●●
●●
●
●●●
●●●●
●●●●●
●
●●
●● ●●
●
●●●●
●
●●
●●
●
●●●
●●
●
●●
●●
●
●●●
●●●
●
●
●●
●●●● ●
●●●●●
●
●
●●●
●
●
●
● ●●●
●●
●●
●
●●●●●
●●●●
●●
●
●
●●●
●●
●
●
●
●●●●
●
●●●
●●
●●
● ●●
●●
●
●
●
●●
●●
●
●●
●●
●
●
●
●●
●●●●●●
●
●●
●●●●
●●●
●●●
●
●●
●
●●●
●
●
●
●
●●
●
●
●
●●●●
●●
●●
●●●
●●
●●●●●● ●
●●●
●●●
●
●
●● ●
●●●●●
●
●
● ●
●●●●
●
●●●●
●●
●
●●
●
●
●
●
●
●●●
●●●
●●
●●●
●
●●●●●
●
●
●
●●
●
●●●
●●●
●
●●●●
●
●●●
●
●
●
●
●●
●●●
●●
●●
●●●
●
●●●
●●●●●●
●
●
●●●●●
●
●●●
●●
●●
●●●●
●
●●●●●
●
●●●●
●
●
●●●
●●●
●
●●
●●●
●●●
●
●●●●●●
●
●●●●
●●●●
●●●
●●
●●●
●●●
●
●●●●
●●
●●●
●●●
●
●●
●●●●
●
●●●●
●●●●
●
●● ●●●
●●●
●
●●
●
●
●●
●●
●●●●
●●
● ●●●●●
●
●●
●●●
●
●●●
●●●●
●
●
●
●
●
●●
●●
●●
●●
●●
●●●●●●●
●
●
● ●●●
●●
●●
●●
●●
●●
●●
● ●●●●●
●
●●
●
DO−89
J DO−163
Proportion contaminant
LRT
sta
tistic
(/1
04 )
0.00 0.02 0.04 0.060.0
0.2
0.4
0.6
0.8
1.0
●●●●
●●●
●●
●
●●
●●●●
●
●
●
●
●
●
● ●●
●●
●
●
●●
●●●
●
● ●●●
●●●
●●●
●
●●●
●●
●●●●
● ●●
●
●
●
●●●
●●
●●
● ●●
●●●
●●
●●
●●
●●
●
●
●●
●
●●
●
●●●
●
●●●
● ●
●
●●●●
●●
●
●●●●●●
●
●
●●
●
●●
●●
●●
●●
●●
●●
●
●●●
●
●
●
●
●●
●
●
●
●
●
●
●
●
●●
●
●●
●●● ●
●
●●●
●●●●●
●●●
●
●●
●●
●
●
●●●
●
●●●
●●
●●
●
●●
●
●●
●
●●
●
●
●
●
● ●●
●
●●
●●●
●
●●
●●
●●●
●●
●
●
●●
●●
●
●
●●●
●
●●
●
●●●●
●
●●
●●●
●
●●
●●●
●●
●
● ●●
●●
●●●●
●●●●
●● ●
●
●●
●●
●
●
●●
●●●●
●
●●
●●
●●
●
●●
●
●●
●
●●
●●
●●●●●
● ●●●●●
●●
●●●
●●●
●
●
●●●
●
●●
●●
●●●● ●●●
●
●●
●
●
●
●●● ●●
●
●●
● ●
●●
●
●
●
●●●●
●●●●
●
●
●●
●
●
●
●● ●
●
●●
●●
●
●
●●
●
●●●
●
●
●●●
●●●●
●●
●●●
●
●●
●●●
●
●●
●●
●
●●
●●
●●●
●●●
●
●
●●●
●
●●●
●
●●
●
●
●●●●●
●
●
●●
●●●●
●
●●
●●
●●
●
●●●●
●●
●●●
●●●
●●
●
●●●●
●●●●●
●●
●●
●
●
●
●●
●
●●
●●●
●
DO−135
K DO−100
Proportion contaminantLR
T s
tatis
tic (
/104 )
0.000 0.010 0.020 0.0300.0
0.2
0.4
0.6
0.8
1.0
●
●●●
●●●
●●●●●●
●●
●●
●●●●
●●
●
●●
●
●
●
●●
●●
●●●●
●●●
●
●●
●
●●●●
●●●
●●
●
●
●
●●
●
●
●
●
●●
●●
●●
●
●●
●
●●●
●
●●●
●●●●●●
●●
●
●
●
●
●
●●●●
●●●
●●●
●●●
●●
●
●
●●
●●
●
●●
●
●●
●●●
●●
●
●●●●
●●
●
●
●●
●●●
●●
●●●●
●●●
●●
●
●●
●
●
●●●
●
●●
●
●
●●●
●●
●●
●●●
●
●●
●
●
●●●●
●
●●●●●●
●● ●●●●●
●●
●●
●
●●●●●
●
●●●●
● ●
●●●
●●●
●●●●●●●
●
●
●●
●●
●
●●●
●
●●
●●●●
●●●
●●●
●●●●
●●
●
● ●
●
●●●●● ●●
●
●●●●
●
●●●●●●●
●
●●
●●●
●
●●
●●●●●●
●●●●●
●
●
●●
●●
●
●●
●
●●
●●●
●●●
●●●●
●
●
●
●●
●●
●●●●
●
●●
●●●
●●●
●●
●●
●●●
●●
● ● ●●
●●● ●●●●●
●●
●●
●●●
●●●
●
●●●
●
●●●●●●●
●●●
●●
●
●●
●
●●
●●
●●●●●●●●
●●
●●
●
●●
●●
●
●●●●
●●
●
●●●●●
●●●
●●
●
●●
●●
●
●
●●●●●
●
●
●
●●
●●●
●
●
●●●
●●
●●
●●●
●
●●●●
●
●
●●
●●●●
●●●●
●●●●
●
●●●●●
●●
●
●
●●●●●
DO−40
L
DO−24
Proportion contaminant
LRT
sta
tistic
(/1
04 )
0.000 0.004 0.0080.0
0.2
0.4
0.6
0.8
1.0
●●●
●●●
●●
●●●●
●●
●●●●
●
●
●●
●●
●
●
●●
●●
●
●
●●●
●●
●●
●●
●●
●●●●
●●
●●●
●
●●●●●
●
●
●●●●●●
●
●●●●●
●●
●
●
●●
● ●●●●●
●●●
● ●●●●
●
●●
●●●
●●●●
●●●●●
●●●
●●
●● ●
●●
●
●●
●● ●●
●●
●
●●●
●
●●
●●
●●
●●
●●
● ●
●●
●
●
●
●
●
●●
●●
●●
●
●
●
●●
●●
●
●
●●● ●
●
●●●●●
●
●
●●●●●●
●●
●
●
●
●●
●●
●●
●●●
●
●●
●●
●●
●●
●●
●
●
●
●
●●
●●●●
●
●●●
●●
● ●●
●
●●
●
●●●
●
●
●
●
●
●●
●
●●
●●●●●
●●
●●
●
●●
●●●●
●
●
●
●●●
●●●● ●
●●
●●●●●
●
●
●●●
●
●●●
●●●●
●●
●●●
●●●
●●
●
●●
●●
●●●
●●
●●
●●
●
●
● ●●●
●●●●● ●
●●●●●●
●
●●●
●●●
●●●
●●●
●●●●
●●
●●
●●
●
●●
●●
●●●●●
●●●
●●
●
●●
●●
●
●
●●●●
●
●●●●
●●●●
●
●
●●
●●
●
●
●
●●
●●●●
●
●
●
●●●
●
●
●●
●
●
●●
●●
●
●●
●
●
●●
●●●●
●
●●
●●
●●●
●●●
●●
●
●
●●●
●●
●
●●
●
●●
●
●●●
●
●●●●
●
●
●
●●●●●
●
● ●●●●
●●● ●●
●●
●●
●●●
●
●●●
●
DO−44
M DO−142
Proportion contaminant
LRT
sta
tistic
(/1
04 )
0.00 0.05 0.10 0.15 0.200.0
0.2
0.4
0.6
0.8
1.0
●●●●●●●●
●●●
●
● ●●●
● ● ●●●●●●●
●●
●
●●● ●
● ●●
●
● ●●
●
●● ● ●●●●●●●●
●●
●●● ●● ●
●● ●
●●●●
●●●● ●
●●●●●
● ●●
●
●●●●●
● ●●
●
●●● ● ●
● ●
●● ●●●
●●●● ●
●●
●●
●●●
●●●
●●●
●
●
●
●● ●●
●●
●●●●
●● ●●
●●●
●●
●
●
●●●●
●
●●●●●
●●●
●
●●
●● ●●● ●
●●●●
●●●
●●●
● ●●●●●
●●●●●● ●●
●●
●●
●
●●
●●●● ●●●
● ● ●●●●
●● ●●
●●
●● ●
● ●●●●
●● ●●
●
●
●
●●●
●●●●
●●
●
●●
●
●
●●● ●
●●●●●
●●●
●●●●
●● ●●●
●
●
●●● ●●
● ● ●●●
●●●●● ●●
●
● ●●●
●●●●●
● ●●
●●●●●
●●●
●●●●●●●
●● ●
●
●●
● ●●●
●●●●●●●
●● ●●
●
●●●●●
●
●●
●●●● ●
●
● ●●
●●
●●
●
●●
●●
●●●●●
●●● ●●●
●●●
●●
●●● ●●●●●
●●●●
●●● ●●●●
●●
●●● ●●●●●●
●●●
●●
●●●
●●● ●
●●
●
●●● ●
●●●
●●●
● ●
●●●
●●
●●
●●
●●●
●●
●●●●
●
●●●●●●
●●●●
●●● ● ●●
● ●● ●●●
●●●
● ●●●●●●
●●●●●
●●●
●●
●● ●
●●
DO−183
N DO−220
Proportion contaminant
LRT
sta
tistic
(/1
04 )
0.00 0.01 0.02 0.03 0.040.0
0.2
0.4
0.6
0.8
1.0
●● ●●●●●●●
●●
●●●●●
●● ●●
●● ●● ●●●●●●● ●● ●●
●●●
●●●●
●●● ●●
●●●
●● ●●
●
●●● ●●●●● ● ●●
●
●● ●
●●●●
●●●
●●● ●●●●
●● ●
●●●
●● ●
●●●●●
●●●●●● ●
●●●● ●●●
●●● ●●
●●● ●
●●● ●
●
● ●● ●●● ●●
●●● ●● ●
● ●●●● ●●● ●●●●●●●●● ●
● ●● ●●●●
●● ●●
●●●●
●●●
●●● ●●●
●●● ●●
● ●●● ● ●●●
●●●●●●●
●●●●● ●● ●●●● ●●●● ●●●
●●●
●● ●●●●●
●●●●●● ●●
●● ●
● ●●●
●
●●●●● ●
●
●●
●●
●●●●● ●
●●●● ●● ●●
●● ●●●
●● ●●●● ● ●●
●●●●●●
●●
●●● ●
●●
●●● ●●●
●●
●●●●●
●●● ●● ●
●●
●●●●
●●
●●●●
●●
●●
●●●●
●●● ●●●● ●●●●●
●●●●● ●●● ●●●●●●
●
●●● ● ●
●●●●●●●●
●
●● ●●● ●●● ●
● ●●
●●● ●● ● ●●●● ● ●●●
● ●● ●● ●●
●●● ●●●● ●
●●●●
●
●● ●●● ●
● ●●●●●● ●●●●●●●●●●●●●
●●●●●
●●●
●●●
●●● ●●●●
●
●●●● ●
●● ●●●●
●●●●
●● ●●●●
● ●●●●●●●
DO−136
O DO−146
Proportion contaminant
LRT
sta
tistic
(/1
04 )
0.00 0.04 0.080.0
0.2
0.4
0.6
0.8
1.0
●
●●●●
● ●●●
●●●
●●●
●●●
● ●●
● ● ●
●●●●●
●
●●
●
●●● ●
●●●
●●
●
●●●
●●●●
●
●
●●●●
●●●●
●
●●●●
● ●
●
●●
●●● ●●
●
● ●
●● ●
●●●
●●
●●
●●●
●
●●
●●
●●●
● ●●●●
●●●●
●● ●●●●●●●
●●●●
●●●
●●●●●
●●
●●●
●●
●●
●●
●● ● ●●●●●●●
●
●●
●●●●●
●●
●
●●●
● ●●
●●
●
●●●
●
●
●
●
●
●
●
●●●●
●●
●● ●●
●●
●
●●
●
●
● ● ●●●
●●●●●●●●
●
●●
●●
●●
●
●● ●●
● ●
●●
●●●
● ●
●
●●●●
●
●●
●●● ●●
●●●●
●●●●
●
●●
●●
●●●●●
●●●●
●●
●●● ●
●●
●●●
●●●
● ●●●
●●
●
●●●
● ●●●●
● ●●
●●
●●
●●●●
●●●●●●●
●●
●
● ● ●●●●●●
●●●
●●●
●●
●
●
● ●●
●●●
●●
●●●●●●
●
●●●●
●●●
●
●●●
● ●●●●
●
●
●●
●
● ●
●●
●●●
●●
● ●●●
●●●●
● ●●
●●
●●
●●
●●
●●●
●●
●
●●
●
●
●●
●●●
●●●●
●
●●
●●●●●
●●●
●●●
●●● ●
●●
●●
● ●●●
●
●●
●
●
●●●
●●●
●●
●
●
●●●●
●
● ●●●
●●
●● ● ●
●
●
●
●
●
●●●
●
●●
●●●● ●●●●●●●
● ●●●
DO−167
P
DO−205
Proportion contaminant
LRT
sta
tistic
(/1
04 )
0.00 0.10 0.20 0.300.0
0.2
0.4
0.6
0.8
1.0
●●
●●
●●●● ●
●●●
●●●●
● ●●●●●●●●●● ● ●
●●● ●● ●●
●●● ● ●●●
●●●●●●●● ●●
● ●● ●●●●
●●●●●● ●●● ●
● ● ●●● ●
●●●●● ●
●●●●
● ●●● ●● ● ● ● ●●●●●●●●● ●
●●●●● ●
● ●●●
●
●
● ●●
● ●●● ●● ●
●● ●
● ●●
●●●
●● ●● ●●●● ●● ●●
●● ●●● ●●●
●●●
●●
● ● ●●
●●●● ● ●● ●●
●● ●●
●●● ●●●●●●●●●●●●
●
●●●
● ●●
●●●
●●●
●●● ●●
● ● ●●●●●●
●●●● ●●●●●●
●●●●●
● ●●●● ●●● ●●● ●● ●
●● ●●
●●●
● ●● ●●●●
●● ●●
●● ● ●●
● ●●●●
●●●
●●●● ●● ●●
●●●●
●●●●
●●
●● ●●●
●●
●●●●●
●●●
●●●●●● ●●●●
● ●● ●●●● ● ●●● ●●● ●●●
●●
●●●●
●●
●
● ● ● ●●● ●
●●●●
●●
● ●●
●●● ●
●●●●●●●●●
●●●
●●●●
● ●●●●
●●●● ● ●●
●●●
●● ●●●●●●● ●
●● ●●●●●●
●● ●
● ● ●●
●●
●●●
● ●●●●
● ●● ●●●●●●
●●● ●
●●●● ●●
●●●
● ●●
●●● ●●●
●● ●●
●●● ●● ●●●
● ●●●●●●●
● ●●
●● ●●●●●●●●●
DO−135
Q DO−179
Proportion contaminant
LRT
sta
tistic
(/1
04 )
0.00 0.04 0.080.0
0.2
0.4
0.6
0.8
1.0
●●● ●●
●
●
●●● ● ●●
●
●●●●
●●
● ●
●●
●● ● ●
●●● ●●● ●● ●● ●
●●●●●
●●●
●●
●
● ●●● ●●●●
●● ●● ●●●●
●
●● ●●●●●●● ●●
●●
●●
●●
● ●●● ●●
●● ●●
●●
● ●
●
●●● ●●●●●
●●
●●● ●● ●●●●●
●●●● ●●● ●● ●●●
● ●●● ●●
●
● ● ●● ●●
●●●
●●
●●●● ●●
●●
●●●●●
●●
●● ●●●●
●●
●● ●
●● ●● ●
●●
●
●●●
●
●
● ●●● ● ● ● ●●● ● ●
●
●●
●●
●●●
●●●
●●● ●●●●
● ●● ●●
● ●●●
●●
●
●● ● ●
●
● ● ●●●● ●●
●●
●● ●● ●
●●
●● ●●
●●
●
●
●●●●
●●●●
●●● ● ●● ● ●
●●
●●
● ●●●●●
●●●
●●●
● ●●
●●
●● ●●
●●
● ●●●
● ●●●●
●●● ●
●●●
●●●
●●
● ●●
●
● ●●●● ●
●
●● ●●●● ● ●●●●
●
● ●●
●●●●
●●
●● ●●● ●●●●●●●
●● ●●
●●● ●●
●●●
●●●● ●●● ● ●●
●●
●● ● ●●●●
●●● ●●●
●●
● ●●●●
●●
● ●● ●●●●
●●●
●●●
●●●●
●
●●●
● ●●●●●●●● ●● ● ●● ● ●
●●●●● ●●●●●
●● ●● ●● ●
● ●●
●● ● ●●● ● ●
● ●●●● ●
●●●●●●●● ●● ●
●● ●
R DO−151
Proportion contaminant
LRT
sta
tistic
(/1
04 )
0.00 0.04 0.08 0.120.0
0.2
0.4
0.6
0.8
1.0
●●● ● ●●●●● ●
●●●●● ●
●● ●● ● ●● ●● ● ●●●
●●
●●●● ●●●● ●●●●● ●●● ●● ●● ● ●
● ● ● ● ●●●●
● ●● ●● ●●●●
●●●●●● ●●● ●● ●●●●● ●
●● ●●● ●●●●●
● ●● ●●●
●●●● ●●●● ●●●
●●●●●●
●●
●● ● ●● ●
●● ●
●● ●●●●
● ● ● ● ●●● ●●●
●●● ●●●● ●●● ●●
●●●●
●●● ●● ● ●●● ●● ●●
●● ●
●●●●●●● ●● ●● ● ●● ●●●
●
●●● ●
●●●
●●●● ●
●● ●●
● ●●● ● ●●●● ●● ●●● ●
●●
● ●● ●●●●●●●●●
●●●●●
●●● ●●
●● ●● ●
●●
●●
●●
●●●
●●●
●● ●● ●● ●●●●
● ●● ●● ●● ●● ●●●
●●● ●●●
●● ●●●●●
●●●
●●
●●●
●
● ●● ●● ● ●●
● ●●●
●●●●● ● ●●
●●●
● ●● ● ●●●●●
●●●●
● ● ● ●● ●
●● ●●● ●● ●● ●●●● ●
●
●● ●●●●●
●●
● ●●●
● ●● ● ●● ●● ●
●● ●● ● ●● ●●● ●●●
●●
● ●● ●●●
●● ●●●●
●●● ●●● ●● ●
●●●●●●●●●
●●
●●●
●● ●●●
●●●● ●●●
● ● ●●●●●●●
●●● ●●● ●●
●●●●●● ●● ●
●●● ● ●● ●●●●
●● ●● ●
●●● ●
S DO−159
Proportion contaminant
LRT
sta
tistic
(/1
04 )
0.00 0.05 0.10 0.150.0
0.2
0.4
0.6
0.8
1.0
●●
●●
●● ●●
●●● ●●●●● ●●● ●●● ● ●
●●●●
●●● ●●●●●● ●●
●●●●
●
●●● ●
●● ●●
●● ●
●●● ●
●●●
●● ●●
● ●●●●●●
●●●●●●●
●● ● ●●
●●● ●●●● ●
● ●● ●●
●●●
●● ●●●●
●● ●●
● ●● ●●● ●● ●
●●● ●
●●
● ●●● ●●● ●● ●● ● ●
●●●●●
●●● ● ●●
● ●●
●●●
●● ●●●● ●●● ● ●
● ●●
●●● ●●●
●●
●
●
●●● ● ●●●●● ●● ●●
●● ●● ●
●● ●● ●●●
●● ●● ●
●●●●
●●● ●●●● ●●
●
●●
●●●●●●● ●
●●● ● ●
● ●● ●●●●
● ●● ●● ●
●● ●●
●● ●●●●●● ●●● ● ● ●
● ●● ●●
●● ●●●● ●
●●●
●
●●●●● ● ●
● ● ● ●●●● ●●
●●
●●
●●●● ●●●●
●● ●●●
●●●
●●
●●
●●●●
● ●● ●●●● ●●●
●●●●
● ●●
●●● ●●● ● ●
●● ●●● ●●
●●●● ●●●●●●● ●
●● ● ●●
● ●●●● ●●●●● ●●●
●●●●● ● ●●●● ●●●
●●●
●● ●● ●
●
●●●●
●●
●●● ●●
●●●●●
●●●● ●● ●●● ●●●●●●●●
●●●● ●●
●●● ●●●● ● ●●● ●●●● ● ●●● ●
●●
● ● ● ●● ● ● ●
●●●● ●●●
●● ●●
●●● ●
●
T
Figure S4 For further selected microbiome samples, plots of the likelihood ratio test statistic vs.the estimated proportion contaminated, when considered with each of the genomic DNA samples,one at a time, with the assumption that the microbiome sample is a mixture of the correct sampleand that particular contaminant. Note the change in the y-axis limits in the bottom three rows ofpanels.
37