Embed Size (px)
Citation preview
Identification of Defense Compounds in Barbareavulgaris against the Herbivore Phyllotreta nemorum by anEcometabolomic Approach1[W]
Vera Kuzina, Claus Thorn Ekstrøm, Sven Bode Andersen, Jens Kvist Nielsen,Carl Erik Olsen, and Søren Bak*
Center for Molecular Plant Physiology (V.K., C.E.O., S.B.) and VKR Research Centre “Pro-Active Plants”(V.K., C.E.O., S.B.), Department of Plant Biology and Biotechnology, Faculty of Life Sciences, University ofCopenhagen, DK–1871 Frederiksberg C, Denmark; Department of Agriculture and Ecology, Faculty of LifeSciences, University of Copenhagen, DK–1871 Frederiksberg C, Denmark (S.B.A.); Department of BasicSciences and Environment, Faculty of Life Sciences, University of Copenhagen, DK–1871 Frederiksberg C,Denmark (C.T.E., J.K.N., C.E.O.); and Center for Applied Bioinformatics, Faculty of Life Sciences, Universityof Copenhagen, DK–1871 Frederiksberg C, Denmark (V.K., C.T.E., S.B.)
Winter cress (Barbarea vulgaris) is resistant to a range of insect species. Some B. vulgaris genotypes are resistant, whereas othersare susceptible, to herbivory by flea beetle larvae (Phyllotreta nemorum). Metabolites involved in resistance to herbivory by fleabeetles were identified using an ecometabolomic approach. An F2 population representing the whole range from fullsusceptibility to full resistance to flea beetle larvae was generated by a cross between a susceptible and a resistant B. vulgarisplant. This F2 offspring was evaluated with a bioassay measuring the ability of susceptible flea beetle larvae to survive on eachplant. Metabolites that correlated negatively with larvae survival were identified through correlation, cluster, and principalcomponent analyses. Two main clusters of metabolites that correlate negatively with larvae survival were identified. Principalcomponent analysis grouped resistant and susceptible plants as well as correlated metabolites. Known saponins, such ashederagenin cellobioside and oleanolic acid cellobioside, as well as two other saponins correlated significantly with plantresistance. This study shows the potential of metabolomics to identify bioactive compounds involved in plant defense.
Plants are sessile organisms that have developedvarious strategies to adapt to or counteract abiotic andbiotic stress. The ability to accumulate low-molecular-weight bioactive compounds, often referred to asallelochemicals, secondary metabolites, or bioactivenatural products, provides a chemical defense againstherbivorous insects used by plants. As a result ofnatural selection, insects often develop mechanisms toadapt to such compounds and eventually manage tobreak the resistance.The interaction between Barbarea vulgaris (Brassica-
ceae) and the flea beetle Phyllotreta nemorum (Coleop-tera: Chrysomelidae) is a unique model system tostudy chemical defenses in plants and counteradapta-tions in insects (Nielsen, 1997a; de Jong et al., 2000;Agerbirk et al., 2001, 2003b; Nielsen and de Jong,
2005). B. vulgaris, a biennial or short-lived perennialwild crucifer (MacDonald and Cavers, 1991), is poly-morphic with respect to insect resistance: the pubes-cent P-type is susceptible to all known flea beetlegenotypes, whereas the glabrous G-type is resistant tomost common genotypes of the insect (Nielsen, 1997a,1997b; Agerbirk et al., 2003a). In contrast, P. nemorum ispolymorphic with respect to plant defenses (Breukeret al., 2005; Nielsen and de Jong, 2005).
B. vulgaris has a potential as an oil crop for use atnorthern latitudes (Borjesdotter, 1999) and is consid-ered to be an important genetic resource for food andagriculture (International Treaty on Plant Genetic Re-sources for Food and Agriculture; ftp://ftp.fao.org/ag/cgrfa/it/ITPGRe.pdf). It has been used for saladsand garnishes as well as a medicinal plant (Senatoreet al., 2000). B. vulgaris has a wide native distributionarea (Eurasia) and is furthermore naturalized in NorthAmerica, Africa, Australia, New Zealand, and Japanas a weed (Hegi, 1958; MacDonald and Cavers, 1991;Tachibana et al., 2002). The subspecies arcuata is by farthe most common Barbarea taxon in Denmark andcomprises two morphologically, biochemically, andcytologically deviating genotypes, P and G, whichdiffer by glucosinolate profiles, flea beetle resistance,and leaf pubescence (Agerbirk et al., 2003b; Fig. 1). B.vulgaris is a diploid; the G-type has 2n = 16 chromo-
1 This work was supported by the Danish Agency for Science,Technology, and Innovation (grant no. 274–06–0370) and by theVillum Kann Rasmussen Foundation to “Pro-Active Plants.”
* Corresponding author; e-mail [email protected] author responsible for distribution of materials integral to the
findings presented in this article in accordance with the policydescribed in the Instructions for Authors (www.plantphysiol.org) is:Søren Bak ([email protected]).
[W] The online version of this article contains Web-only data.www.plantphysiol.org/cgi/doi/10.1104/pp.109.136952
Plant Physiology�, December 2009, Vol. 151, pp. 1977–1990, www.plantphysiol.org � 2009 American Society of Plant Biologists 1977 www.plantphysiol.orgon August 26, 2018 - Published by Downloaded from
Copyright © 2009 American Society of Plant Biologists. All rights reserved.
somes, while the P-type has 2n = 16 or 2n = 18chromosomes (Ørgaard and Linde-Laursen, 2008). B.vulgaris is phylogenetically positioned between Arabi-dopsis (Arabidopsis thaliana) and allopolyploid oil seedrape (Brassica napus; Bailey et al., 2006). Accordingly,research on plant-insect interaction in B. vulgaris maybe applied to B. napus.
Glucosinolates constitute a group of defense com-pounds present in crucifers and play a key role in hostselection by crucifer specialists (Renwick, 2002). Thesecompounds are feeding and oviposition stimulants fora number of specialist insects, which have becomeadapted to such compounds as an outcome of long-standing coevolutionary interactions with host plantscontaining them (Renwick, 2002; Thompson, 2005).Therefore, glucosinolates no longer offer efficientprotection against many specialist insects, and therelationship between glucosinolate profiles of plantsand their suitability as food for insects is not simple(Nielsen et al., 2001; Poelman et al., 2008; van Leuret al., 2008). The P-type B. vulgaris contains theR-isomer of 2-hydroxy-2-phenylethylglucosinolate,whereas the G-type contains the S-isomer. However,the differences in glucosinolate profiles between theP- and G-types are not related to resistance to fleabeetles (Agerbirk et al., 2003b).
As a putative response to renewed selection pres-sure from herbivorous insects, a number of crucifershave evolved a second generation of defense second-ary compounds (e.g. cucurbitacins in Iberis species,cardenolides in Cheirantus and Erysimum species, andsaponins in B. vulgaris). These compounds are feedingdeterrents for a number of insect species (Nielsen,1978; Renwick, 2002; Shinoda et al., 2002; Agerbirket al., 2003a). Until now, Barbarea is the only cruciferknown to contain saponins. Two saponins, oleanolicacid cellobioside (3-O-b-cellobiosyloleanolic acid) andhederagenin cellobioside (3-O-b-cellobiosylhederage-nin), have been identified in B. vulgaris (Shinoda et al.,2002; Agerbirk et al., 2003a). The restricted distribution
of such saponins in crucifers suggests that they orig-inated later than the glucosinolates, which have amuch wider distribution in the family.
Saponins are triterpenoid glycosides widely distrib-uted in higher plants (Hostettmann and Marston,1995; Sparg et al., 2004; Vincken et al., 2007). Theyare constituents of many plant drugs and folk medi-cines and possess a wide range of biological activities,including antifungal, antibacterial, molluscicidal, andinsecticidal activities (Hostettmann and Marston,1995; Sparg et al., 2004; Chwalek et al., 2006; Guclu-Ustundag and Mazza, 2007; Gauthier et al., 2009). Thetoxicity of saponins to fungi and insects is thought tobe a result of their ability to form complexes withsterols in the plasma membrane, thus destroying thecellular semipermeability and leading to cell death.Although saponins are toxic to cold-blooded animals,their oral toxicity to mammals is low (for review, seeHostettmann and Marston, 1995; Sparg et al., 2004;Guclu-Ustundag and Mazza, 2007).
Hederagenin cellobioside has been identified as anactive defense compound of B. vulgaris against theworld-wide pest diamondback moth (Shinoda et al.,2002), which has become resistant to most insecticides.Oleanolic acid cellobioside concentration has beenshown to correlate with resistance of B. vulgaris tothe diamondback moth (Agerbirk et al., 2003a). Thiscompound is present in the resistant G-type plant, andits concentration declines in autumn at the same timeas the decline in resistance toward diamondback moth(Agerbirk et al., 2001, 2003b). The impact of the twosaponins on defense against flea beetles, a major pestin oil seed rape, has not been reported previously.
The objective of this study was to develop an unbi-ased strategy to identify metabolites that correlatewith resistance to flea beetle larvae in B. vulgaris and toprovide knowledge that may facilitate more efficientand sustainable breeding for resistance toward insectpests. The results presented in this study are signifi-cant for understanding chemical plant defense againstinsects and may be utilized in future crop protectionbreeding by screening for the presence of similarbioactive compounds, biosynthetic enzymes, and ge-netic markers or transfer of resistance components tocrop plants.
RESULTS
Crossing of P- and G-Type Plants
The P-type plants are susceptible to flea beetles,while the G-type plants are resistant. To generate asegregating hybrid population, independent recipro-cal crosses between 11 different G-type and eightP-type parent plants resulted in 21 different F1 com-binations. F1 plants from all hybrid combinations wereselfed by bud pollination to obtain F2 seeds. Whilemost F1 plants produced only a few seeds upon budpollination of 25 to 30 flower buds, one hybrid com-
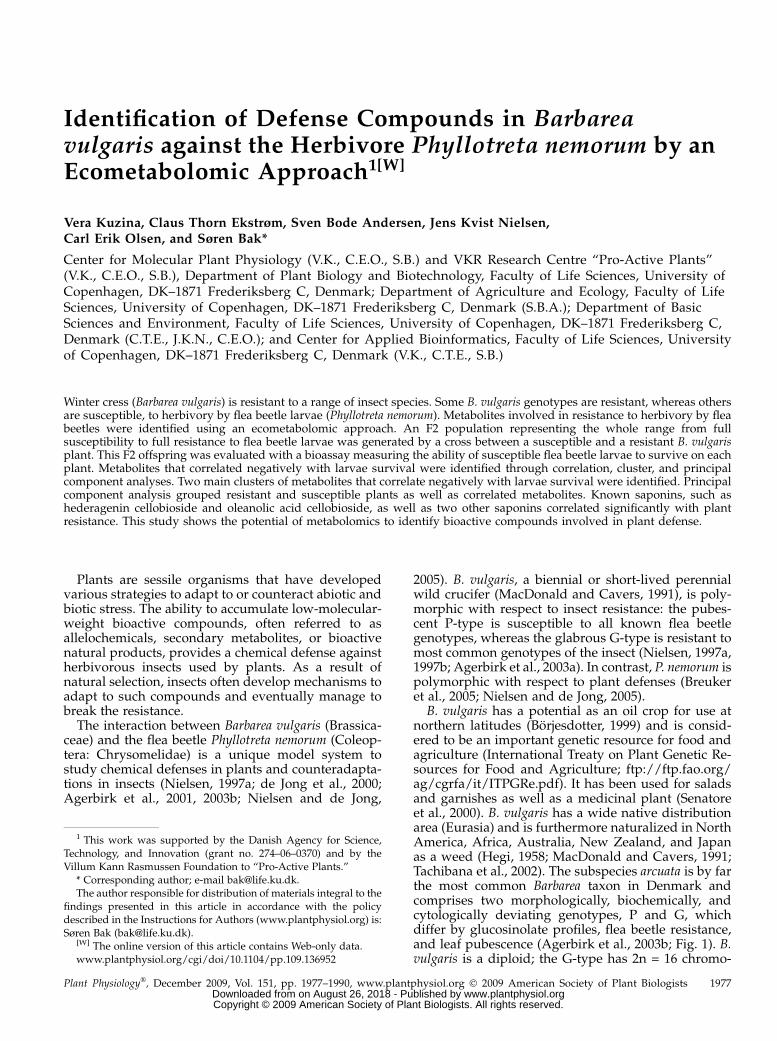
Figure 1. Rosette leaves of P- and G-types of B. vulgaris subspeciesarcuata. The P-type has hairs, while the G-type does not.
Kuzina et al.
1978 Plant Physiol. Vol. 151, 2009 www.plantphysiol.orgon August 26, 2018 - Published by Downloaded from
Copyright © 2009 American Society of Plant Biologists. All rights reserved.
bination (female3male) produced approximately 160F2 seeds. This F2 population was used for bioassaysand untargeted metabolite profiling. Accordingly, theF2 plant segregating population was derived from asingle F1 plant.
Flea Beetle Larvae Survival
The parental P- and G-type B. vulgaris plants, the F1,and the segregating F2 hybrids were tested for resis-tance to flea beetle larvae. Five larvae were placedtogether with one leaf, and the number of larvae thatsurvived was determined after 72 h.None of the flea beetle larvae survived on the
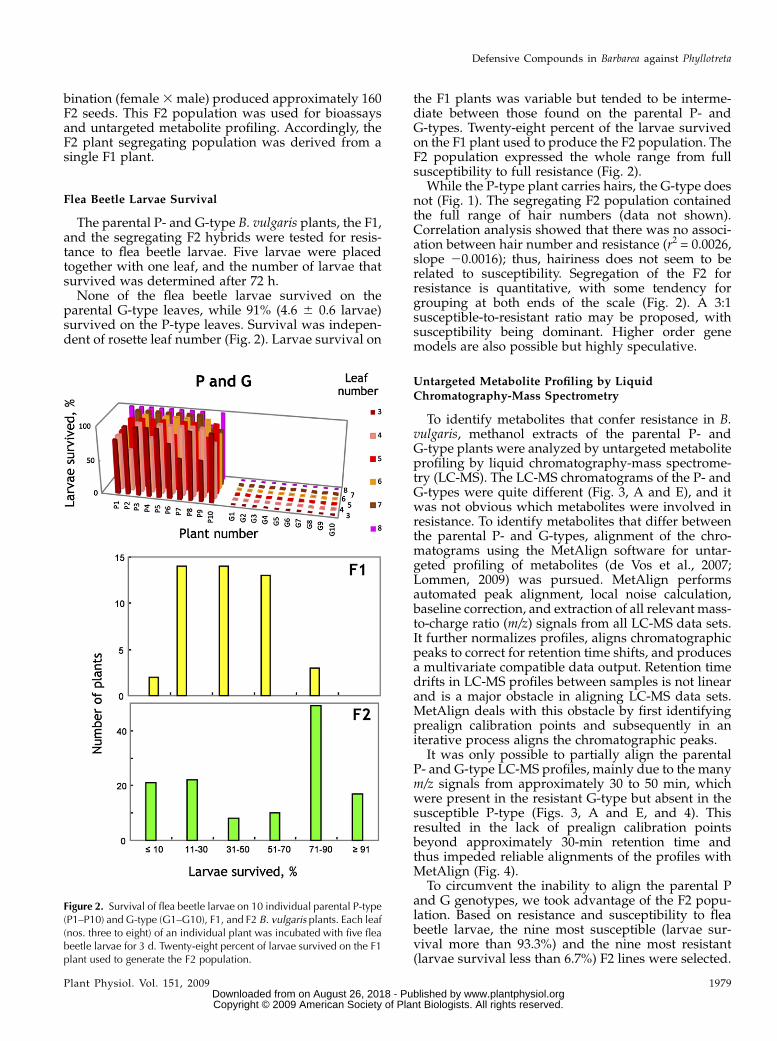
parental G-type leaves, while 91% (4.6 6 0.6 larvae)survived on the P-type leaves. Survival was indepen-dent of rosette leaf number (Fig. 2). Larvae survival on
the F1 plants was variable but tended to be interme-diate between those found on the parental P- andG-types. Twenty-eight percent of the larvae survivedon the F1 plant used to produce the F2 population. TheF2 population expressed the whole range from fullsusceptibility to full resistance (Fig. 2).
While the P-type plant carries hairs, the G-type doesnot (Fig. 1). The segregating F2 population containedthe full range of hair numbers (data not shown).Correlation analysis showed that there was no associ-ation between hair number and resistance (r2 = 0.0026,slope 20.0016); thus, hairiness does not seem to berelated to susceptibility. Segregation of the F2 forresistance is quantitative, with some tendency forgrouping at both ends of the scale (Fig. 2). A 3:1susceptible-to-resistant ratio may be proposed, withsusceptibility being dominant. Higher order genemodels are also possible but highly speculative.
Untargeted Metabolite Profiling by LiquidChromatography-Mass Spectrometry
To identify metabolites that confer resistance in B.vulgaris, methanol extracts of the parental P- andG-type plants were analyzed by untargeted metaboliteprofiling by liquid chromatography-mass spectrome-try (LC-MS). The LC-MS chromatograms of the P- andG-types were quite different (Fig. 3, A and E), and itwas not obvious which metabolites were involved inresistance. To identify metabolites that differ betweenthe parental P- and G-types, alignment of the chro-matograms using the MetAlign software for untar-geted profiling of metabolites (de Vos et al., 2007;Lommen, 2009) was pursued. MetAlign performsautomated peak alignment, local noise calculation,baseline correction, and extraction of all relevant mass-to-charge ratio (m/z) signals from all LC-MS data sets.It further normalizes profiles, aligns chromatographicpeaks to correct for retention time shifts, and producesa multivariate compatible data output. Retention timedrifts in LC-MS profiles between samples is not linearand is a major obstacle in aligning LC-MS data sets.MetAlign deals with this obstacle by first identifyingprealign calibration points and subsequently in aniterative process aligns the chromatographic peaks.
It was only possible to partially align the parentalP- and G-type LC-MS profiles, mainly due to the manym/z signals from approximately 30 to 50 min, whichwere present in the resistant G-type but absent in thesusceptible P-type (Figs. 3, A and E, and 4). Thisresulted in the lack of prealign calibration pointsbeyond approximately 30-min retention time andthus impeded reliable alignments of the profiles withMetAlign (Fig. 4).
To circumvent the inability to align the parental Pand G genotypes, we took advantage of the F2 popu-lation. Based on resistance and susceptibility to fleabeetle larvae, the nine most susceptible (larvae sur-vival more than 93.3%) and the nine most resistant(larvae survival less than 6.7%) F2 lines were selected.
Figure 2. Survival of flea beetle larvae on 10 individual parental P-type(P1–P10) and G-type (G1–G10), F1, and F2 B. vulgaris plants. Each leaf(nos. three to eight) of an individual plant was incubated with five fleabeetle larvae for 3 d. Twenty-eight percent of larvae survived on the F1plant used to generate the F2 population.
Defensive Compounds in Barbarea against Phyllotreta
Plant Physiol. Vol. 151, 2009 1979 www.plantphysiol.orgon August 26, 2018 - Published by Downloaded from
Copyright © 2009 American Society of Plant Biologists. All rights reserved.
These plant lines were designated as the most extremelines. As a result of recombination between the twoparental genomes, the genetic background in the seg-regating F2 population was randomized, and accord-ingly this reduced the diversity of LC-MS profiles (Fig.3, D and F). This enabled reliable alignment of the LC-MS profiles of the most extreme F2 lines. Conse-quently, we used the t test function of MetAlign topoint out metabolites that are significantly differentbetween the extreme lines (Supplemental Table S1).The analysis of these 18 extreme lines showed that therandomization of the genetic background enabledreliable alignment and normalization of the F2 popu-lation. For the subsequent metabolite profiling of theentire F2 population consisting of 127 plants, the F2lines were randomly divided into two groups: groupAconsisting of 58 F2 offspring, and group B consisting of69 F2 offspring. These two groups represented twobiological replicates and were analyzed by two sepa-rate LC-MS runs. Subsequently, MetAlign was used toalign the LC-MS profiles of the group A and group BF2 lines (Fig. 4). The number of prealign calibrationpoints within the first approximately 50 min showthat it indeed was possible to align the two data sets(Fig. 4).
Each metabolite in the LC-MS chromatograms wasrepresented by one chromatographic peak, which wasrepresented by several m/z signals, including intactmolecule ions, fragmentation products, and differentadduct ions, as well as isotope ions thereof. The LC-MS profiles of the group A and B F2 plants were
deconvoluted by MetAlign into approximately 7,000m/z signals each. As many of these m/z signals repre-sented isotope ions, various adduct ions, and frag-ments of the most intense peaks in the spectrum, thedata sets were reduced by removing m/z signals thatcorresponded to isotope ions ([M + 1], [M + 2]) andm/zsignals aligned inconsistently by MetAlign. This con-servative approach reduced the B data set to 306 m/zsignals for each of the 69 plants and the A data set to319 m/z signals for each of the 58 plants.
Targeted Profiling for Saponins
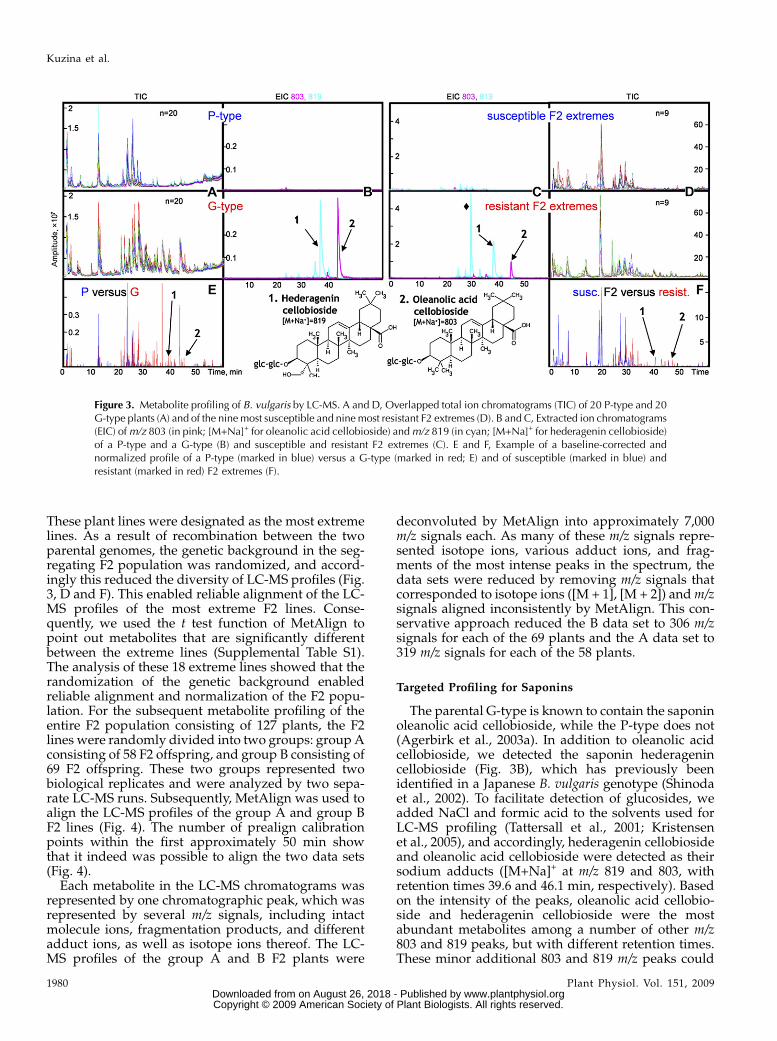
The parental G-type is known to contain the saponinoleanolic acid cellobioside, while the P-type does not(Agerbirk et al., 2003a). In addition to oleanolic acidcellobioside, we detected the saponin hederagenincellobioside (Fig. 3B), which has previously beenidentified in a Japanese B. vulgaris genotype (Shinodaet al., 2002). To facilitate detection of glucosides, weadded NaCl and formic acid to the solvents used forLC-MS profiling (Tattersall et al., 2001; Kristensenet al., 2005), and accordingly, hederagenin cellobiosideand oleanolic acid cellobioside were detected as theirsodium adducts ([M+Na]+ at m/z 819 and 803, withretention times 39.6 and 46.1 min, respectively). Basedon the intensity of the peaks, oleanolic acid cellobio-side and hederagenin cellobioside were the mostabundant metabolites among a number of other m/z803 and 819 peaks, but with different retention times.These minor additional 803 and 819 m/z peaks could
Figure 3. Metabolite profiling of B. vulgaris by LC-MS. A and D, Overlapped total ion chromatograms (TIC) of 20 P-type and 20G-type plants (A) and of the nine most susceptible and nine most resistant F2 extremes (D). B and C, Extracted ion chromatograms(EIC) ofm/z 803 (in pink; [M+Na]+ for oleanolic acid cellobioside) andm/z 819 (in cyan; [M+Na]+ for hederagenin cellobioside)of a P-type and a G-type (B) and susceptible and resistant F2 extremes (C). E and F, Example of a baseline-corrected andnormalized profile of a P-type (marked in blue) versus a G-type (marked in red; E) and of susceptible (marked in blue) andresistant (marked in red) F2 extremes (F).
Kuzina et al.
1980 Plant Physiol. Vol. 151, 2009 www.plantphysiol.orgon August 26, 2018 - Published by Downloaded from
Copyright © 2009 American Society of Plant Biologists. All rights reserved.
only be detected in the resistant G-type plants (Fig.3B). The F2 plants differed in their relative content ofhederagenin cellobioside and oleanolic acid cellobio-side. In contrast to the resistant extremes, most of thesusceptible F2 extremes contained hederagenin cello-bioside and oleanolic acid cellobioside in minoramounts (Fig. 5). The ability to align hederagenincellobioside and oleanolic acid cellobioside across theF2 lines also serves to substantiate that the alignmentgenerated by MetAlign was valid. Oleanolic acid cello-bioside were not always the most abundant among the
m/z 803 peaks. Anm/z 819 chromatographic peak at 31.0min was the strongest among m/z 819 peaks in manyresistant and susceptible F2 extremes (Fig. 3C). Thiscompound was not detected in the parental G-typeplant; thus, its presence is the result of complementa-tion between the P- andG-types. Therewere severalm/z803 and 819 chromatographic peaks at different reten-tion times in the F2 population, which were notdetected in the parental P- and G-type plants (Fig. 3,B and C). This phenomenon has been observed withArabidopsis recombinant lines (Keurentjes et al., 2006).
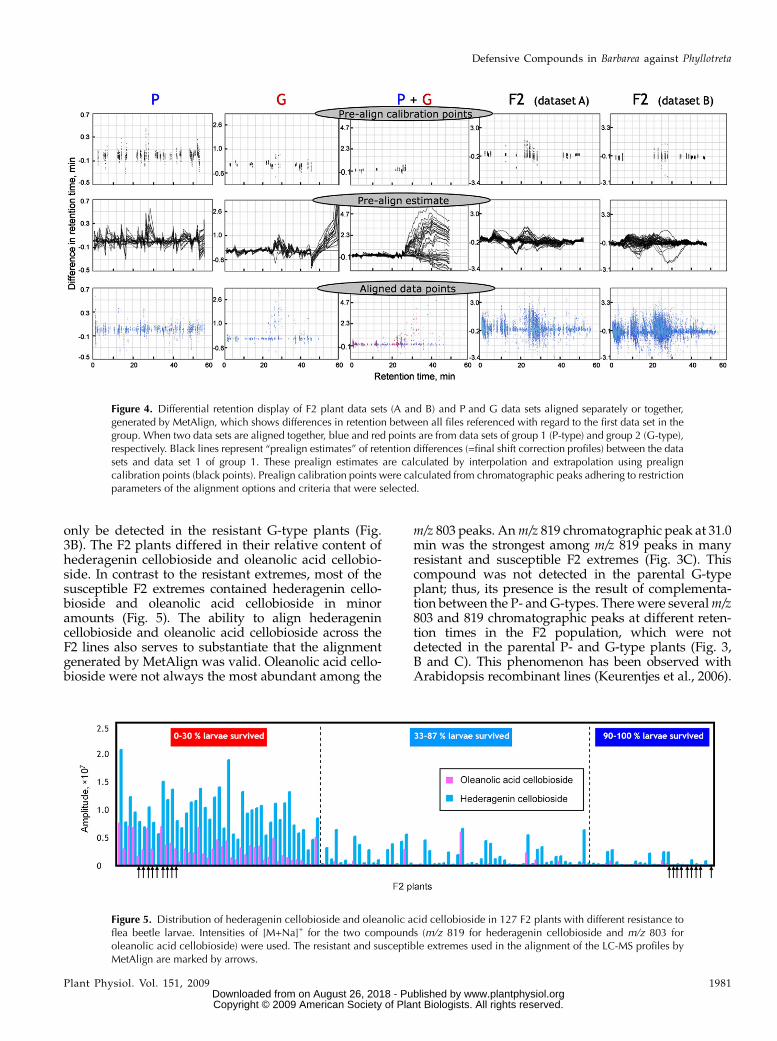
Figure 5. Distribution of hederagenin cellobioside and oleanolic acid cellobioside in 127 F2 plants with different resistance toflea beetle larvae. Intensities of [M+Na]+ for the two compounds (m/z 819 for hederagenin cellobioside and m/z 803 foroleanolic acid cellobioside) were used. The resistant and susceptible extremes used in the alignment of the LC-MS profiles byMetAlign are marked by arrows.
Figure 4. Differential retention display of F2 plant data sets (A and B) and P and G data sets aligned separately or together,generated by MetAlign, which shows differences in retention between all files referenced with regard to the first data set in thegroup. When two data sets are aligned together, blue and red points are from data sets of group 1 (P-type) and group 2 (G-type),respectively. Black lines represent “prealign estimates” of retention differences (=final shift correction profiles) between the datasets and data set 1 of group 1. These prealign estimates are calculated by interpolation and extrapolation using prealigncalibration points (black points). Prealign calibration points were calculated from chromatographic peaks adhering to restrictionparameters of the alignment options and criteria that were selected.
Defensive Compounds in Barbarea against Phyllotreta
Plant Physiol. Vol. 151, 2009 1981 www.plantphysiol.orgon August 26, 2018 - Published by Downloaded from
Copyright © 2009 American Society of Plant Biologists. All rights reserved.
Correlation between Metabolites and Resistance
The original, unbiased data sets A and B containedapproximately 7,000 m/z signals each. We used corre-lation analysis to filter out relevant m/z signals. Thisfurther served to discard m/z signals that alignedinconsistently as well as outliers. The observed ionintensity can be used as a relative measure of metab-olite concentration (Skoog, 1985; Zacarias et al., 2002).Accordingly, we performed correlation and regressionanalysis between ion intensity and larvae survivalwith the aim to identify plant metabolites that corre-late with resistance to flea beetle larvae in the F2population. Permutation analysis with 2,000 permuta-tions of the complete set of m/z signals was used toestimate a 95% significance level for correlation (r2)between relative metabolite level (intensity of m/zsignal) and observed larvae survival on F2 plants.
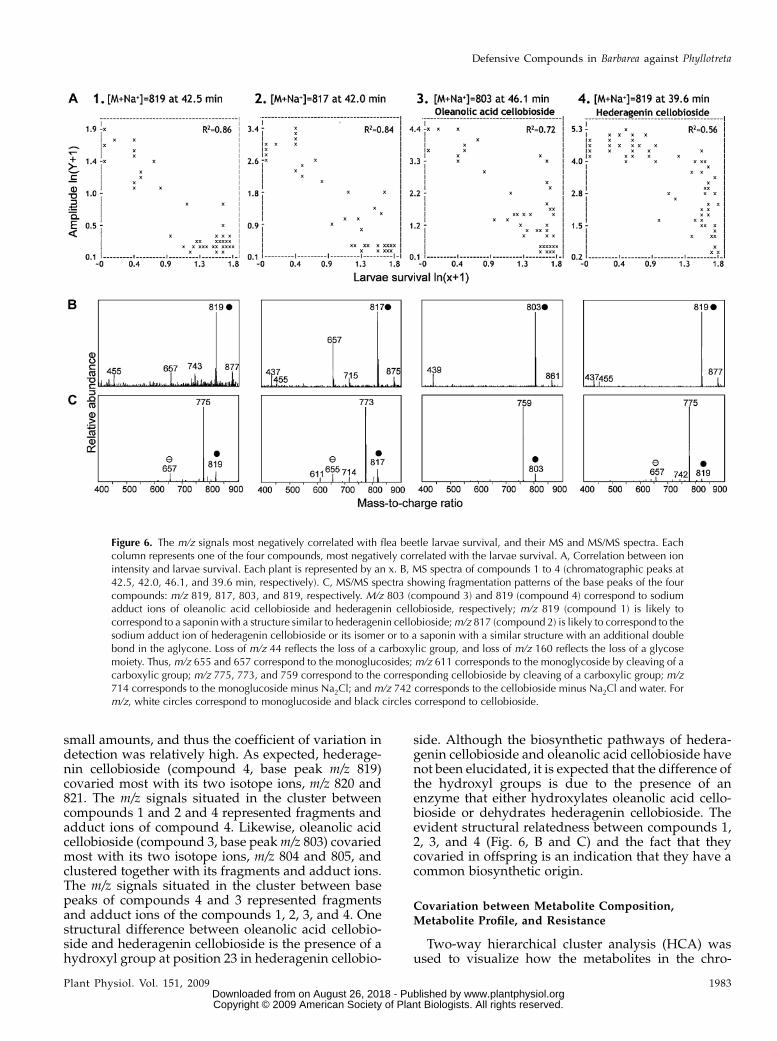
We detected 94 m/z signals in data set A and 51 indata set B that significantly correlated (r2 = 0.86–0.43 inA, r2 = 0.83–0.38 in B) with larvae survival (Supple-mental Table S1). As expected, no m/z signals showedsignificant positive correlations with larvae survival.As many of the m/z signals present in both data setswere identical, the two data sets were manuallymerged to one data set consisting of 117 unique m/zsignals. Two-thirds of the m/z signals representedfragments, various adducts, and isotope ions of thefour compounds represented in Figure 6. The firstcompound most negatively correlated with the larvaesurvival was compound 1, with m/z 819 and r2 of 0.86(data set A) or 0.83 (data set B). The second mostnegatively correlated compound was compound 2,with m/z 817 and r2 of 0.84 (data set A) or 0.77 (data setB). Oleanolic acid cellobioside (m/z 803) was identifiedas compound 3, with an r2 of 0.72 (data set A) or 0.61(data set B). Hederagenin cellobioside (m/z 819) wasidentified as compound 4, with an r2 of 0.56 (data setA) or 0.64 (data set B). In the F2 population, compound4 (hederagenin cellobioside, m/z 819) was the mostabundant among the four compounds most correlatedwith the resistance. In the nine resistant F2 extremes,the average relative proportion of compounds 1 to 4was 5:7:22:66, respectively. Resistant F2 extremes con-tained on average 36, 59, 17, and 11 times more of thecompounds 1 to 4 than the susceptible F2 extremes,respectively. Of the 117 m/z signals, 66 signals could bedirectly related to the four compounds, being variousadduct, fragment, and isotope ions. The remaining 51m/z signals appeared to originate from 12 minor com-pounds, seven of which were probably saponins orsaponin-like compounds, based on their characteristicfragmentation patterns (Supplemental Table S1). Forthe remaining five compounds, it was difficult tocomment on the structure, primarily due to their lowabundance.
To facilitate fragmentation of metabolites, a quad-rupole ion trap was employed. As metabolites that arestructurally related break down in a similar pattern,the fragmentation pattern can be used as a tool to
identify the putative chemical structure of a metabolite(Matsuda et al., 2009). Based on the characteristicfragmentation pattern, compound 1 (m/z of the basepeak 819) has a structure similar to hederagenincellobioside (compound 4), probably with some rear-ranged groups in the skeleton, as its fragments wererepresented by the loss of a carboxylic group (loss ofm/z 44) and a glycose moiety (loss of m/z 160; Fig. 6, Band C). The fact that compound 2 has an m/z that is 2mass units lower than that of hederagenin cellobiosideand has the same fragmentation pattern is stronglyindicative of the presence of a double bond in theaglycone of compound 2. Based on its fragmentationpattern, the m/z 819 compound at retention time 31.0(Fig. 3B) is structurally related to hederagenin cello-bioside but was not within the 150 most correlated m/zsignals (r2 , 0.43 in data set A and r2 , 0.38 in data setB), indicating that this saponin is not related to resis-tance. The fragmentation pattern of this compound issimilar to hederagenin cellobioside, as its fragmentswere represented by the loss of a carboxylic group anda glycose moiety. Accordingly, this compound has thesame overall structure, but the decoration of the agly-cone backbone, the hexose moiety, and linkage differ.
Clustering of Metabolites that Correlate with Resistance
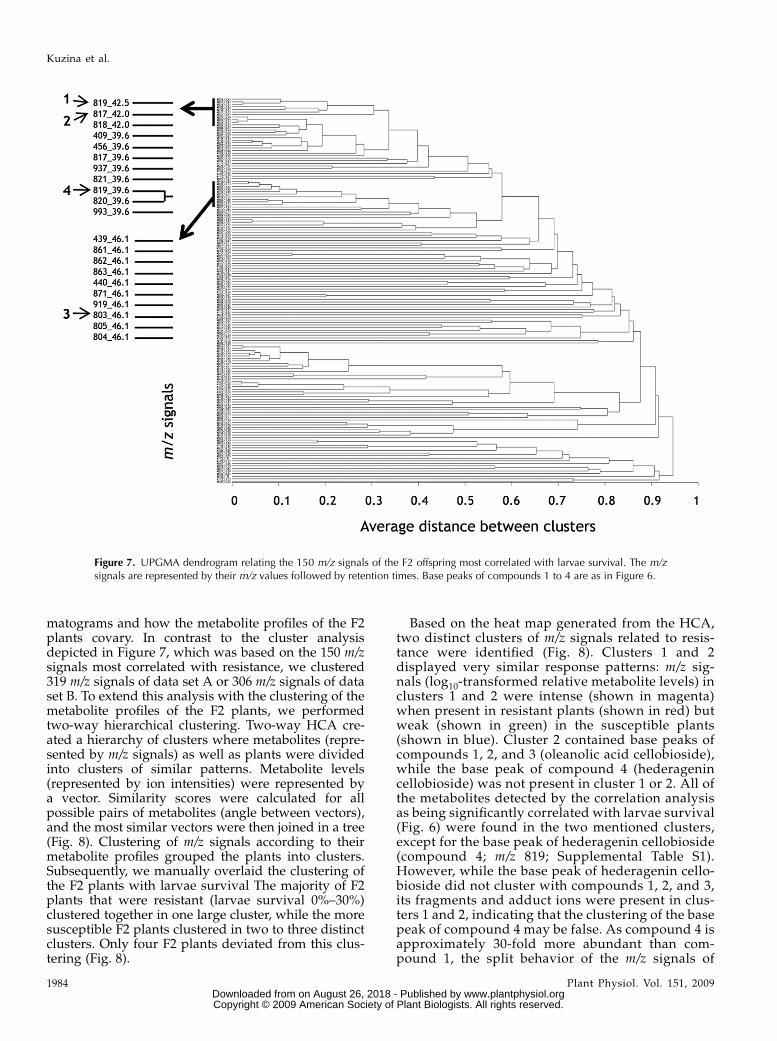
Clustering was used to build groups of metabolites(represented bym/z signals) with related accumulationpatterns. Such groups are expected to contain func-tionally related metabolites, such as metabolites for aspecific pathway or metabolites that are coregulated.Arbitrarily selected, the 150 m/z signals that correlatedmost with larvae survival were visualized in adendrogram (Fig. 7). The dendrogram is based onUPGMA (for unweighted pair group method witharithmetic mean) clustering with distances 1 – r2 andwas used to visualize how the m/z signal intensitiescovary among plants in the F2 population (Fig. 7). Fordata set A, the r2 range of the 150 m/z signals was from0.86 to 0.30 (95% fractile = 0.43), and for data set B, therange was from 0.83 to 0.22 (95% fractile = 0.38). Thedendrogram highlights the obstacle that many m/zsignals correspond to a single metabolite. An exampleof this is the coclustering of m/z of 819, 820, and 821,corresponding to the base peak and two isotope ions([M + 1], [M + 2]) of compound 4 (Fig. 7). The fact thatthe m/z signals corresponding to the same metabolitecovary in offspring serves to substantiate that thecorrelation analysis is applicable.
Compound 2 (m/z 817) from Figure 6, with acorresponding isotope ion m/z 818, and compound1 (m/z 819) from Figure 6 covaried to a high extent (Fig.7), indicating that compounds 1 and 2 co-occurred inthe F2 plants. This, together with the structural sim-ilarity of the two compounds (Fig. 6, B and C), indi-cates that the two compounds belong to the samebiosynthetic pathway. They were not clustered asclosely as their isotope ions and fragments, possiblybecause compounds 1 and 2 were present in relatively
Kuzina et al.
1982 Plant Physiol. Vol. 151, 2009 www.plantphysiol.orgon August 26, 2018 - Published by Downloaded from
Copyright © 2009 American Society of Plant Biologists. All rights reserved.
small amounts, and thus the coefficient of variation indetection was relatively high. As expected, hederage-nin cellobioside (compound 4, base peak m/z 819)covaried most with its two isotope ions, m/z 820 and821. The m/z signals situated in the cluster betweencompounds 1 and 2 and 4 represented fragments andadduct ions of compound 4. Likewise, oleanolic acidcellobioside (compound 3, base peakm/z 803) covariedmost with its two isotope ions, m/z 804 and 805, andclustered together with its fragments and adduct ions.The m/z signals situated in the cluster between basepeaks of compounds 4 and 3 represented fragmentsand adduct ions of the compounds 1, 2, 3, and 4. Onestructural difference between oleanolic acid cellobio-side and hederagenin cellobioside is the presence of ahydroxyl group at position 23 in hederagenin cellobio-
side. Although the biosynthetic pathways of hedera-genin cellobioside and oleanolic acid cellobioside havenot been elucidated, it is expected that the difference ofthe hydroxyl groups is due to the presence of anenzyme that either hydroxylates oleanolic acid cello-bioside or dehydrates hederagenin cellobioside. Theevident structural relatedness between compounds 1,2, 3, and 4 (Fig. 6, B and C) and the fact that theycovaried in offspring is an indication that they have acommon biosynthetic origin.
Covariation between Metabolite Composition,Metabolite Profile, and Resistance
Two-way hierarchical cluster analysis (HCA) wasused to visualize how the metabolites in the chro-
Figure 6. The m/z signals most negatively correlated with flea beetle larvae survival, and their MS and MS/MS spectra. Eachcolumn represents one of the four compounds, most negatively correlated with the larvae survival. A, Correlation between ionintensity and larvae survival. Each plant is represented by an x. B, MS spectra of compounds 1 to 4 (chromatographic peaks at42.5, 42.0, 46.1, and 39.6 min, respectively). C, MS/MS spectra showing fragmentation patterns of the base peaks of the fourcompounds: m/z 819, 817, 803, and 819, respectively. M/z 803 (compound 3) and 819 (compound 4) correspond to sodiumadduct ions of oleanolic acid cellobioside and hederagenin cellobioside, respectively; m/z 819 (compound 1) is likely tocorrespond to a saponin with a structure similar to hederagenin cellobioside;m/z 817 (compound 2) is likely to correspond to thesodium adduct ion of hederagenin cellobioside or its isomer or to a saponin with a similar structure with an additional doublebond in the aglycone. Loss of m/z 44 reflects the loss of a carboxylic group, and loss of m/z 160 reflects the loss of a glycosemoiety. Thus, m/z 655 and 657 correspond to the monoglucosides; m/z 611 corresponds to the monoglycoside by cleaving of acarboxylic group; m/z 775, 773, and 759 correspond to the corresponding cellobioside by cleaving of a carboxylic group; m/z714 corresponds to the monoglucoside minus Na2Cl; and m/z 742 corresponds to the cellobioside minus Na2Cl and water. Form/z, white circles correspond to monoglucoside and black circles correspond to cellobioside.
Defensive Compounds in Barbarea against Phyllotreta
Plant Physiol. Vol. 151, 2009 1983 www.plantphysiol.orgon August 26, 2018 - Published by Downloaded from
Copyright © 2009 American Society of Plant Biologists. All rights reserved.
matograms and how the metabolite profiles of the F2plants covary. In contrast to the cluster analysisdepicted in Figure 7, which was based on the 150 m/zsignals most correlated with resistance, we clustered319 m/z signals of data set A or 306 m/z signals of dataset B. To extend this analysis with the clustering of themetabolite profiles of the F2 plants, we performedtwo-way hierarchical clustering. Two-way HCA cre-ated a hierarchy of clusters where metabolites (repre-sented by m/z signals) as well as plants were dividedinto clusters of similar patterns. Metabolite levels(represented by ion intensities) were represented bya vector. Similarity scores were calculated for allpossible pairs of metabolites (angle between vectors),and the most similar vectors were then joined in a tree(Fig. 8). Clustering of m/z signals according to theirmetabolite profiles grouped the plants into clusters.Subsequently, we manually overlaid the clustering ofthe F2 plants with larvae survival The majority of F2plants that were resistant (larvae survival 0%–30%)clustered together in one large cluster, while the moresusceptible F2 plants clustered in two to three distinctclusters. Only four F2 plants deviated from this clus-tering (Fig. 8).
Based on the heat map generated from the HCA,two distinct clusters of m/z signals related to resis-tance were identified (Fig. 8). Clusters 1 and 2displayed very similar response patterns: m/z sig-nals (log10-transformed relative metabolite levels) inclusters 1 and 2 were intense (shown in magenta)when present in resistant plants (shown in red) butweak (shown in green) in the susceptible plants(shown in blue). Cluster 2 contained base peaks ofcompounds 1, 2, and 3 (oleanolic acid cellobioside),while the base peak of compound 4 (hederagenincellobioside) was not present in cluster 1 or 2. All ofthe metabolites detected by the correlation analysisas being significantly correlated with larvae survival(Fig. 6) were found in the two mentioned clusters,except for the base peak of hederagenin cellobioside(compound 4; m/z 819; Supplemental Table S1).However, while the base peak of hederagenin cello-bioside did not cluster with compounds 1, 2, and 3,its fragments and adduct ions were present in clus-ters 1 and 2, indicating that the clustering of the basepeak of compound 4 may be false. As compound 4 isapproximately 30-fold more abundant than com-pound 1, the split behavior of the m/z signals of
Figure 7. UPGMA dendrogram relating the 150 m/z signals of the F2 offspring most correlated with larvae survival. The m/zsignals are represented by their m/z values followed by retention times. Base peaks of compounds 1 to 4 are as in Figure 6.
Kuzina et al.
1984 Plant Physiol. Vol. 151, 2009 www.plantphysiol.orgon August 26, 2018 - Published by Downloaded from
Copyright © 2009 American Society of Plant Biologists. All rights reserved.
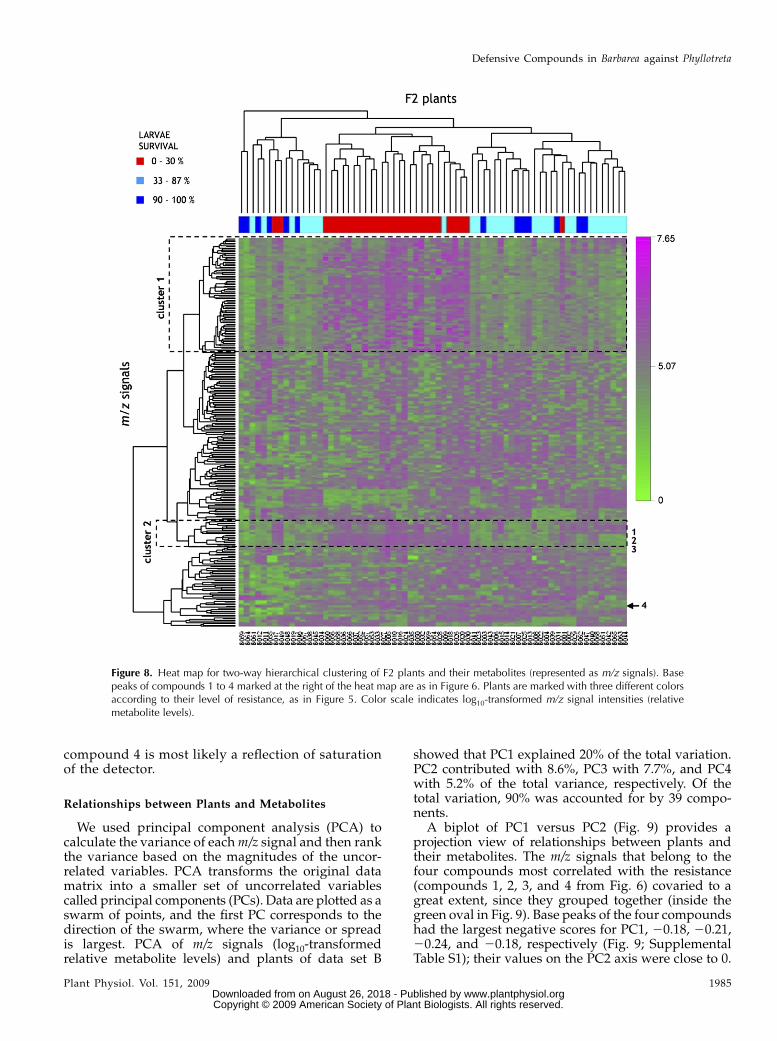
compound 4 is most likely a reflection of saturationof the detector.
Relationships between Plants and Metabolites
We used principal component analysis (PCA) tocalculate the variance of eachm/z signal and then rankthe variance based on the magnitudes of the uncor-related variables. PCA transforms the original datamatrix into a smaller set of uncorrelated variablescalled principal components (PCs). Data are plotted as aswarm of points, and the first PC corresponds to thedirection of the swarm, where the variance or spreadis largest. PCA of m/z signals (log10-transformedrelative metabolite levels) and plants of data set B
showed that PC1 explained 20% of the total variation.PC2 contributed with 8.6%, PC3 with 7.7%, and PC4with 5.2% of the total variance, respectively. Of thetotal variation, 90% was accounted for by 39 compo-nents.
A biplot of PC1 versus PC2 (Fig. 9) provides aprojection view of relationships between plants andtheir metabolites. The m/z signals that belong to thefour compounds most correlated with the resistance(compounds 1, 2, 3, and 4 from Fig. 6) covaried to agreat extent, since they grouped together (inside thegreen oval in Fig. 9). Base peaks of the four compoundshad the largest negative scores for PC1, 20.18, 20.21,20.24, and 20.18, respectively (Fig. 9; SupplementalTable S1); their values on the PC2 axis were close to 0.
Figure 8. Heat map for two-way hierarchical clustering of F2 plants and their metabolites (represented as m/z signals). Basepeaks of compounds 1 to 4 marked at the right of the heat map are as in Figure 6. Plants are marked with three different colorsaccording to their level of resistance, as in Figure 5. Color scale indicates log10-transformed m/z signal intensities (relativemetabolite levels).
Defensive Compounds in Barbarea against Phyllotreta
Plant Physiol. Vol. 151, 2009 1985 www.plantphysiol.orgon August 26, 2018 - Published by Downloaded from
Copyright © 2009 American Society of Plant Biologists. All rights reserved.
Susceptible plants had large positive loadings, whileresistant plants had large negative loadings, on PC1.PC1 was associated with increasing susceptibility (de-creasing resistance) in the plant. Higher PCs did notseem to reveal any further structure in the data set. It isworth noting that the larvae survival data were notincluded in this data matrix.
DISCUSSION
Saponins Confer Resistance to Flea Beetle Larvae
Metabolomics has attracted significant interest overthe last few years (Tikunov et al., 2005; Hall, 2006;Keurentjes et al., 2006; de Vos et al., 2007; Khoo and Al-Rubeai, 2007; Sumner et al., 2007, 2008; Blow, 2008;
Figure 9. Relationships between plants and metabolites (represented asm/z signals) identified by PCA. Red arrows representm/zsignals; the metabolites are represented bym/z values followed by retention times in minutes. Black points represent plants andtheir resistance toward insects; the letter B corresponds to data that are derived from data set B, followed by the plant line, and thelarvae survival number out of 30 larvae is indicated after the underscore. Directions of arrows show the relative loadings of themetabolites on the first and second PCs. Base peaks of compounds 1 to 4 are as in Figure 6.
Kuzina et al.
1986 Plant Physiol. Vol. 151, 2009 www.plantphysiol.orgon August 26, 2018 - Published by Downloaded from
Copyright © 2009 American Society of Plant Biologists. All rights reserved.
Fiehn et al., 2008; Steinfath et al., 2008) and hascontributed significantly to the discovery of bioactivecompounds, improving food quality and catalogingmetabolomes, as a new diagnostic and therapeuticapproach and to study plant-herbivore interactions(Dixon et al., 2006; Ryan and Robards, 2006; Bottcheret al., 2008; Denkert et al., 2008; Jansen et al., 2009).Our study demonstrated the power of untargeted
metabolite profiling for identification of bioactivecompounds involved in plant defense, using B. vulga-ris and flea beetle larvae as a model system. Theapproach detected the two saponins hederagenincellobioside and oleanolic acid cellobioside. Hedera-genin cellobioside is known to confer resistanceagainst diamondback moth (Shinoda et al., 2002),and oleanolic acid cellobioside is believed to have asimilar effect on the diamondback moth (Agerbirket al., 2003a), but the effect on flea beetles has not beenreported. Thus, this work indicates that the two com-pounds are not only defense compounds of B. vulgarisagainst diamondback moth but also against flea bee-tles. In addition to oleanolic acid cellobioside andhederagenin cellobioside, we detected novel com-pounds that are possible defense compounds of B.vulgaris against flea beetles. Based on their character-istic fragmentation patterns, many of the novel com-pounds that relate to resistance appeared to besaponins. Compound 1 (m/z of the base peak 819)has a structure similar to hederagenin cellobioside,probably with some rearranged groups in the skeleton,and compound 2 (m/z of the base peak 817) probablyhas an additional double bond in the aglycone. Ac-cordingly, our data have identified four saponins thatmay be defense compounds of B. vulgaris against avariety of insect species.The F2 population accumulated the two known
saponins hederagenin cellobioside and oleanolic acidcellobioside as well as several compounds likely to besaponins, some of which cosegregated with biologicalactivity toward flea beetle larvae and others that didnot correlate with resistance. Some of the predictedsaponins in the F2 population were not present in theparental types, thus emphasizing the large potentialfor modification of metabolic composition throughclassical breeding.The mode of action of saponins and their function-
ality are generally known to depend on their glyco-sylation pattern and secondary modifications of thesaponin aglycone skeleton. Bidesmosidic saponins(with two sugar chains, often with one attachedthrough a linkage at C-3 and the second attachedthrough an ester linkage at C-28) are known to eitherlack or exhibit attenuated properties of the corre-sponding monodesmosides (with a single sugar, nor-mally attached at C-3; Hostettmann and Marston,1995). Saponin glycosides in monodesmoside formexhibit a broad spectrum of activity against yeast,fungi, mollusks, frogs, and fish, while those in bides-moside form are generally inactive (Parkhurst et al.,1974; Schenkel et al., 1991; Favel et al., 1994; Lee et al.,
2001; Sparg et al., 2004). In addition, the number, kind,and sequence of the sugar residues significantly mod-ify antifungal effects of saponins (Mshvildadze et al.,2000; Zhang et al., 2005).
The compound with m/z 819 detected at 31.0 minwas present in both susceptible and resistant F2 plantsand had a similar fragmentation pattern to that ofhederagenin cellobioside. This compound is verylikely an isomer that does not possess biological ac-tivity against flea beetle larvae, at least at the occurringconcentrations, since it did not correlate with resis-tance (r2 , 0.43 in data set A and r2 , 0.38 in data setB). These results indicate the importance of specificstructural features as mediators of the activity againstflea beetle larvae. It is thus of interest to unravel therelationship between chemical structure and biologicalactivity of the different saponins present in B. vulgaris.
Multivariate Data Analysis
By applying two-way HCA, we identified two mainclusters of metabolites that correlate with resistance toflee beetle larvae. The hederagenin cellobioside (com-pound 4) base peak was in a single distinct cluster,while its fragments, isotope ions, and adduct ionsclustered together in clusters 1 and 2 (Fig. 8). The splitbehavior of the m/z signals of compound 4, and theapparent nonlinear correlation between larvae sur-vival and ion intensity (Fig. 6), are most likely areflection of saturation of the detector. As compound4 is approximately 30-fold more abundant than com-pound 1, detector saturation is not an issue for com-pounds 1, 2, and 3. Hederagenin cellobioside waspresent in most of the F2 plants (Fig. 5), while com-pounds 1 and 2 were not detected in the susceptibleF2 extremes. This is in contrast to the parental P- andG-types, where hederagenin cellobioside could onlybe detected in the G-type (Fig. 3). A different pictureemergedwhenwe applied PCA, in which hederagenincellobioside (compound 4), including its base peakand most of its fragments and adduct ions, formed onegroup together with the three other most correlatedwith the resistance compounds. The base peaks of thefour compounds contributed most to PC1, showingthat they were strongly correlated with the resistance.Resistant and susceptible plants were distinguished byPCA into separate groups.
Efficiency of the Methods Used
Given the complexity of the data set, different dataanalysis tools were explored and correlation analysiswas found to be the most informative. However, thecorrelation analysis did not provide information aboutthe relationship between m/z signals and similaritybetween metabolites, while PCA, UPGMA clusteranalysis, and HCA did. Particularly, HCA facilitatedidentification of patterns for each m/z signal by visu-alizing how m/z signal intensities change according tothe resistance or susceptibility of the F2 plants.
Defensive Compounds in Barbarea against Phyllotreta
Plant Physiol. Vol. 151, 2009 1987 www.plantphysiol.orgon August 26, 2018 - Published by Downloaded from
Copyright © 2009 American Society of Plant Biologists. All rights reserved.
UPGMA clustered m/z signals according to cosegre-gation. It was difficult to see a clear separation of suchclusters, which could indicate that most of the m/zsignals used for the analysis belong to the same groupof compounds and metabolic pathway and thus co-vary to some extent.
Regardless of the four statistical approaches ap-plied, we obtained very similar results with the twobiological replicates, data sets A and B, as the samefour compounds were identified as being the mostsignificant to resistance in B. vulgaris. Based on theirfragmentation patterns, all four compounds were sa-ponins. Most of the other compounds identified withthe different approaches that correlated with resis-tance were saponins or saponin like, based on theirfragmentation patterns, as represented by Supplemen-tal Table S1. A few m/z signals related to resistance, asdetected by PCA and HCA, were not identified assignificantly correlated with resistance. This is proba-bly due to their low abundance and thus relativelyhigh coefficient of variation. The parental plant types,P and G, may differ in many genes that are not relatedto the resistance. Randomization of the background ofgenes and metabolites in the F2 offspring throughmeiotic recombination facilitates the detection ofchemical compounds that truly correlate with resis-tance.
Perspectives
Insects remain the main pests to several major cropsand stored products (Schoonhoven et al., 2005).Knowledge of bioactive plant compounds againstherbivorous insects may be used to introduce naturalresistance to cultivated plants and as an environmen-tally sustainable alternative to synthetic insecticides.Accordingly, there is an obvious need to better under-stand factors affecting interactions between insectsand plants, as such knowledge is fundamental for theamelioration of future crop plants using biologicallysafe control strategies intended to control insect at-tacks.
This study demonstrates that untargeted metaboliteprofiling can be used to identify metabolites associatedwith resistance to flee beetle larvae in B. vulgaris. Ourecometabolomic approach has identified four maincandidates that correlate with resistance. Future workis needed to purify the metabolites and to confirm theactivity of each such candidate compound in bio-assays, because inactive compounds may cosegregatewith truly active compounds if they are metabolicallyor genetically closely linked.
Furthermore, it provides the foundation for futurework focused on the isolation of key metabolites forstructure elucidation by NMR and bioassays to revealrelationships between chemical structure and biolog-ical activity. At the genomic level, these results facil-itate future studies of molecular mechanisms thatconfer resistance in B. vulgaris by demonstrating cor-relations between metabolites and gene expression.
The method developed based on untargeted metab-olite profiling coupled to correlation and cluster stud-ies and PCA can be applied to identify metabolitesactive in other systems, not only with regard to plant-insect interactions.
MATERIALS AND METHODS
Plants and Insects
The resistant G-type Barbarea vulgaris subspecies arcuata used in this work
originated from Herlev, Denmark, whereas the susceptible P-type originated
from Tissø, Denmark (de Jong et al., 2000; Agerbirk et al., 2003a). They were
grown in a growth chamber at 20�C and an 18-h-light/6-h-dark photoperiod
(de Jong et al., 2000). Light was supplied by 400-W HPI/T lamps, which
produced 160 to 200 mmol quanta m22 s21 at the level of the leaf surface.
Parental plants used in crossings were collected at natural growth sites in
March and April 2003. F2 plants were offspring from one individual F1 plant
from a cross between a G-type plant (no. 8) and a P-type plant (no. 6).
A stock of Phyllotreta nemorum from the ST line wasmaintained at 24�C and
an 18-h-light/6-h-dark photoperiod as previously described (Nielsen, 1997a).
The ST line is susceptible: it does not contain R genes that confer resistance to
G-type and is unable to survive on the G-type of B. vulgaris arcuata (Nielsen,
1999).
Crossing of P- and G-Type Plants
Hybridization between G- and P-type B. vulgaris was performed under
glasshouse conditions using manual emasculation of unopened female flower
buds followed by paper bag isolation and pollination from amale 4 to 5 d later.
Both P- and G-types were used as females to produce seeds of 21 different F1
combinations between 11 G-type and eight P-type parent plants. The follow-
ing year, F1 plants from all hybrid combinations were bud pollinated to obtain
F2 seeds. Unopened flower buds were opened with forceps and pollinated
from opened flowers of the same plant. Hybrid combination P number 6 3G number 8 (female 3 male), which produced approximately 160 F2 seeds,
was used subsequently for bioassays and metabolic profiling.
Bioassays
Levels of resistance of individual plants were determined in bioassays
using freshly harvested leaves from 3- to 12-week-old plants grown in a
growth chamber as described above. Leaves were placed in transparent plastic
containers of suitable size (20 or 50 mL, according to the size of the leaf tested)
together with a piece of moist filter paper. Newly emerged flea beetle larvae
(less than 24 h old) were gently placed on the filter paper with a moist paint
brush. Each container contained one leaf and five larvae. Containers were kept
at 24�C for 72 h. After 72 h, larval survival was examined with a stereomi-
croscope. Larvae that were alive were close to their first molt and had
produced a clear leaf mine, whereas dead larvae had not grown and were
found dead either in a tiny leaf mine or on the leaf surface. From each
individual plant, six leaves were tested; that is, survival rates on individual
plants were determined using 30 larvae.
Metabolite Profiling
For the metabolite extraction, 8-mm leaf discs (about 15 mg fresh weight or
4 mg dry weight) from leaf 7 unless otherwise stated were frozen in liquid
nitrogen and kept at 280�C. The samples were boiled with 500 mL of 85%
methanol (60�C270�C) in a water bath for 5 min and then cooled on ice. The
extract was filtered with 45-mm Ultrafree-MC Durapore polyvinylidene
difluoride filters (Millipore) and kept in glass containers at 220�C.LC-MS analysis was carried out using an Agilent 1100 Series liquid
chromatograph (Agilent Technologies) coupled to a Bruker Esquire 3000+
ion trap mass spectrometer (Bruker Daltonics). An XTerra MS C18 column (3.5
mM, 2.1 3 100 mm; Waters) with a flow rate of 0.2 mL min21 was used. The
mobile phases were as follows: A, formic acid (1 mL L21) and NaCl (50 mM); B,
acetonitrile (800 mL L21) and formic acid (1 mL L21). The gradient program
was as follows: 0 to 3 min, isocratic 18% B; 3 to 60 min, linear gradient 18% to
Kuzina et al.
1988 Plant Physiol. Vol. 151, 2009 www.plantphysiol.orgon August 26, 2018 - Published by Downloaded from
Copyright © 2009 American Society of Plant Biologists. All rights reserved.
80% B; 60 to 65 min, linear gradient 80% to 100% B; 65 to 70 min, isocratic 100%
B; 71 to 85 min, isocratic 18% B. The mass spectrometer was run in positive ion
mode. Total ion current and ion traces for specific [M+Na]+ adduct ions were
used for locating compounds. Hederagenin cellobioside and oleanolic acid
cellobioside were identified based on mass spectra and retention times for the
pure compounds kindly provided by Dr. Tetsuro Shinoda (National Institute
of Agrobiological Sciences, Ibaraki, Japan).
Bioinformatics and Statistics
The LC-MS profiles were aligned and normalized usingMetAlign software
(http://www.metalign.wur.nl/UK/). The t test function of MetAlign was
used to reveal m/z signals significantly different between nine resistant and
nine susceptible F2 extremes. Global normalization of the data was performed
by autoscaling on total signal. That is, all amplitudes of m/z signals of the data
set were summed together and used to normalize with regard to the first
data set.
For correlation and regression analysis, a Java program, specifically coded
for this type of data, was used. The data were normalized to adjust for average
effects of each of the F2 plants. Correlation analysis measured r2 from
correlation between the amount of each metabolite in each plant (m/z signal)
and larvae survival on the same plant, both transformed with ln(Y + 1). The
regression model was Y = m + ax + bx 3 x, where Y = transformed amount of
metabolite in plant, x = transformed survival of larvae on plant, and a and b
are estimated regression parameters. Permutation analysis used 2,000 per-
mutations of larvae survival rates to determine 95% significance threshold
level for r2 to enable an argument for how many of the most correlated m/z
signals to study. A binary distance matrix for the 150 m/z signals most highly
correlated with larvae survival was generated. The distance between two m/z
signals was calculated as 1 2 r2, where r is the coefficient of correlation of
levels of the two metabolites (m/z signals) over all F2 plants, with a regression
model containing both a linear and a quadratic term and with both sides
transformed with ln(Y + 1). This distance matrix was used to cluster the 150
selected m/z signals according to their coappearance in the F2 plant offspring
with the SAS procedure proc Cluster using UPGMA (Sneath and Sokal, 1973)
and subsequently draw the dendrogram with the SAS procedure proc Tree.
For PCA, R (R2.6.2; http://www.r-project.org/) was used. For two-way
hierarchical clustering, the BioConductor package of R was used. The MetAlign
output file containing relative metabolite levels (m/z signal intensities) in F2
plants was log10 transformed and used as input file for R.
Supplemental Data
The following materials are available in the online version of this article.
Supplemental Table S1. M/z signals identified with LC-MS, correlation,
HCA, and PCA.
ACKNOWLEDGMENTS
We are grateful to Susanne Bidstrup (Department of Plant Biology and
Biotechnology, Faculty of Life Sciences, University of Copenhagen) for her
help with extractions. We thank Dr. Tetsuro Shinoda (Invertebrate Gene
Function Research Unit, Division of Insect Sciences, National Institute of
Agrobiological Sciences, Ibaraki, Japan) for the kind gift of hederagenin
cellobioside and oleanolic acid cellobioside and discussions and Nikoline
Juul Nielsen (Department of Natural Sciences and Environment, Faculty of
Life Sciences, University of Copenhagen) for discussions.
Received February 10, 2009; accepted October 5, 2009; published October 9,
2009.
LITERATURE CITED
Agerbirk N, Olsen CE, Bibby BM, Frandsen HO, Brown LD, Nielsen JK,
Renwick JAA (2003a) A saponin correlated with variable resistance of
Barbarea vulgaris to diamondback moth Plutella xylostella. J Chem Ecol
29: 1417–1433
Agerbirk N, Olsen CE, Nielsen JK (2001) Seasonal variation in leaf
glucosinolates and insect resistance in two types of Barbarea vulgaris
ssp. arcuata. Phytochemistry 58: 91–100
Agerbirk N, Ørgaard M, Nielsen JK (2003b) Glucosinolates, flea beetle
resistance, and leaf pubescence as taxonomic characters in the genus
Barbarea (Brassicaceae). Phytochemistry 63: 69–80
Bailey CD, Koch MA, Mayer M, Mummenhoff K, O’Kane SL Jr, Warwick
SI, Windham MD, Al-Shehbaz IA (2006) Toward a global phylogeny of
the Brassicaceae. Mol Biol Evol 23: 2142–2160
Blow N (2008) Metabolomics: biochemistry’s new look. Nature 455:
697–700
Borjesdotter D (1999) Potential oil crops: cultivation of Barbarea verna,
Barbarea vulgaris and Lepidium campestre. PhD thesis. Acta Universitatis
Agriculturae Sueciae, Uppsala
Bottcher C, von Roepenack-Lahaye E, Schmidt J, Schmotz C, Neumann S,
Scheel D, Clemens S (2008) Metabolome analysis of biosynthetic
mutants reveals a diversity of metabolic changes and allows identifica-
tion of a large number of new compounds in Arabidopsis. Plant Physiol
147: 2107–2120
Breuker CJ, Victoir K, de Jong PW, van der Meijden E, Brakefield PM,
Vrieling K (2005) AFLP markers for the R-gene in the flea beetle,
Phyllotreta nemorum, conferring resistance to defenses in Barbarea vulga-
ris. J Insect Sci. 5: 38
Chwalek M, Lalun N, Bobichon H, Ple K, Voutquenne-Nazabadioko L
(2006) Structure-activity relationships of some hederagenin diglyco-
sides: haemolysis, cytotoxicity and apoptosis induction. Biochim Bio-
phys Acta 1760: 1418–1427
de Jong PW, Frandsen HO, Rasmussen L, Nielsen JK (2000) Genetics of
resistance against defences of the host plant Barbarea vulgaris in a
Danish flea beetle population. Proc R Soc Lond B Biol Sci 267:
1663–1670
Denkert C, Budczies J, Weichert W, Wohlgemuth G, Scholz M, Kind T,
Niesporek S, Noske A, Buckendahl A, Dietel M, et al (2008) Metabolite
profiling of human colon carcinoma: deregulation of TCA cycle and
amino acid turnover. Mol Cancer 7: 72
de Vos CHR, Moco S, Lommen A, Keurentjes JJB, Bino RJ, Hall RD (2007)
Untargeted large-scale plant metabolomics using liquid chromatogra-
phy coupled to mass spectrometry. Nat Protoc 2: 778–791
Dixon RA, Gang DR, Charlton AJ, Fiehn O, Kuiper HA, Reynolds TL,
Tjeerdema RS, Jeffery EH, German JB, Ridley WP, et al (2006) Appli-
cations of metabolomics in agriculture. J Agric Food Chem 54:
8984–8994
Favel A, Steinmetz MD, Regli P, Vidal-Ollivier E, Elias R, Balansard G
(1994) In vitro antifungal activity of triterpenoid saponins. Planta Med
60: 50–53
Fiehn O, Wohlgemuth G, Scholz M, Kind T, Lee do Y, Lu Y, Moon S,
Nikolau B (2008) Quality control for plant metabolomics: reporting
MSI-compliant studies. Plant J 53: 691–704
Gauthier C, Legault J, Girard-Lalancette K, Mshvildadze V, Pichette A
(2009) Haemolytic activity, cytotoxicity and membrane cell permeabili-
zation of semi-synthetic and natural lupane- and oleanane-type sapo-
nins. Bioorg Med Chem 17: 2002–2008
Guclu-Ustundag O, Mazza G (2007) Saponins: properties, applications
and processing. Crit Rev Food Sci Nutr 47: 231–258
Hall RD (2006) Plant metabolomics: from holistic hope, to hype, to hot
topic. New Phytol 169: 453–468
Hegi G (1958) Illustrierte Flora von Mittel-Europa. Carl Hanser Verlag,
Munich
Hostettmann K, Marston A (1995) Chemistry and Pharmacology of Nat-
ural Products: Saponins. Cambridge University Press, Cambridge, UK
Jansen JJ, Allwood JW, Marsden-Edwards E, van der Putten WH,
Goodacre R, van Dam NM (2009) Metabolomic analysis of the interac-
tion between plants and herbivores. Metabolomics 5: 150–161
Keurentjes JJ, Fu J, de Vos CH, Lommen A, Hall RD, Bino RJ, van der Plas
LH, Jansen RC, Vreugdenhil D, Koornneef M (2006) The genetics of
plant metabolism. Nat Genet 38: 842–849
Khoo SHG, Al-Rubeai M (2007) Metabolomics: an emerging tool for
understanding metabolic systems. In Systems Biology, Vol 5. Springer,
Dordrecht, The Netherlands, pp 237–273
Kristensen C, Morant M, Olsen CE, Ekstrøm CT, Galbraith DW, Møller
BL, Bak S (2005) Metabolic engineering of dhurrin in transgenic
Arabidopsis plants with marginal inadvertent effects on the metabo-
lome and transcriptome. Proc Natl Acad Sci USA 102: 1779–1784
Lee MW, Kim SU, Hahn DR (2001) Antifungal activity of modified
Defensive Compounds in Barbarea against Phyllotreta
Plant Physiol. Vol. 151, 2009 1989 www.plantphysiol.orgon August 26, 2018 - Published by Downloaded from
Copyright © 2009 American Society of Plant Biologists. All rights reserved.
hederagenin glycosides from the leaves of Kalopanax pictum var. chi-
nense. Biol Pharm Bull 24: 718–719
Lommen A (2009) MetAlign: interface-driven, versatile metabolomics tool
for hyphenated full-scan mass spectrometry data preprocessing. Anal
Chem 81: 3079–3086
MacDonald MA, Cavers PB (1991) The biology of Canadian weeds. 97.
Barbarea vulgaris R. Br. Can J Plant Sci 71: 149–166
Matsuda F, Yonekura-Sakakibara K, Niida R, Kuromori T, Shinozaki K,
Saito K (2009) MS/MS spectral tag-based annotation of non-targeted
profile of plant secondary metabolites. Plant J 57: 555–577
Mshvildadze V, Favel A, Delmas F, Elias R, Faure R, Decanosidze G,
Kemertelidze E, Balansard G (2000) Antifungal and antiprotozoal
activities of saponins from Hedera colchica. Pharmazie 55: 325–326
Nielsen JK (1978) Host plant discrimination within Cruciferae: feeding
responses of four leaf beetles (Coleoptera: Chrysomelidae) to glucosi-
nolates, cucurbitacins and cardenolides. Entomol Exp Appl 24: 41–54
Nielsen JK (1997a) Variation in defences of the plant Barbarea vulgaris and
in counteradaptations by the insect Phyllotreta nemorum. Entomol Exp
Appl 82: 25–35
Nielsen JK (1997b) Genetics of the ability of Phyllotreta nemorum to survive in an
atypical host plant Barbarea vulgaris ssp. arcuata. Entomol Exp Appl 82: 37–44
Nielsen JK (1999) Specificity of a Y-linked gene in the flea beetle Phyllotreta
nemorum for defences in Barbarea vulgaris. Entomol Exp Appl 91: 359–368
Nielsen JK, de Jong PW (2005) Temporal and host-related variation in
frequencies of genes that enable Phyllotreta nemorum to utilize a novel
host plant, Barbarea vulgaris. Entomol Exp Appl 115: 265–270
Nielsen JK, Hansen ML, Agerbirk N, Betersen BL, Halkier BA (2001)
Responses of the flea beetles Phyllotreta nemorum and P. cruciferae to
metabolically engineered Arabidopsis thaliana with an altered glucosi-
nolate profile. Chemoecology 11: 75–83
Ørgaard M, Linde-Laursen I (2008) Meiotic analysis of Danish species of
Barbarea (Brassicaceae) using FISH: chromosome numbers and rDNA
sites. Hereditas 145: 215–219
Parkhurst RM, Thomas DW, Skinner WA, Cary LW (1974) Molluscicidal
saponins of Phytolacca dodecandra: lemmatoxin. Can J Chem 52: 702–705
Poelman EH, Galiart RJFH, Raajimakers CE, van Loon JJA, van Dam NM
(2008) Performance of specialist and generalist herbivores feeding on
cabbage cultivars is not explained by glucosinolate profiles. Entomol
Exp Appl 127: 218–228
Renwick JAA (2002) The chemical world of crucivores: lures, treats and
traps. Entomol Exp Appl 104: 35–42
Ryan D, Robards K (2006) Metabolomics: the greatest omics of them all?
Anal Chem 78: 7954–7958
Schenkel EP, Werner W, Schulte KE (1991) Die saponine aus Thinouia
coriacea. Planta Med 57: 463–467
Schoonhoven LM, van Loon JJA, Dicke M (2005) Insect-Plant Biology.
Oxford University Press, Oxford
Senatore F, D’Agostino M, Dini I (2000) Flavonoid glycosides of Barbarea
vulgaris L. (Brassicaceae). J Agric Food Chem 48: 2659–2662
Shinoda T, Nagao T, Nakayama M, Serizawa H, Koshioka M, Okabe H,
Kawai A (2002) Identification of a triterpenoid saponin from a crucifer,
Barbarea vulgaris, as a feeding deterrent to the diamond back moth,
Plutella xylostella. J Chem Ecol 28: 587–599
Skoog DA (1985) Principles of Instrumental Analysis, Ed 3. Saunders
College Publishing, Philadelphia
Sneath PHA, Sokal RR (1973) Numerical Taxonomy. WH Freeman and
Company, San Francisco, pp 230–234
Sparg SG, Light ME, van Staden J (2004) Biological activities and distri-
bution of plant saponins. J Ethnopharmacol 94: 219–243
Steinfath M, Groth D, Lisec J, Selbig J (2008) Metabolite profile analysis:
from raw data to regression and classification. Physiol Plant 132:
150–161
Sumner LW, Amberg A, Barrett D, Beger R, Beale MH, Daykin C, Fan TW,
Fiehn O, Goodacre R, Griffin JL, et al (2007) Proposed minimum
reporting standards for chemical analysis: Chemical Analysis Working
Group (CAWG) Metabolomics Standards Initiative (MSI). Metabolomics
3: 211–221
Sumner LW, Urbanczyk-Wochniak E, Broeckling CD (2008) Metabolomics
data analysis, visualization, and integration. In D Edwards, ed, Plant
Bioinformatics: Methods and Protocols, Vol 406. Humana Press, Totowa,
NJ, pp 409–436
Tachibana M, Watanabe H, Itoh K (2002) Distribution of a naturalized
weed, Barbarea vulgaris R. Br. in the Tohoku area of Japan. Journal of
Weed Science and Technology 47: 235–241
Tattersall DB, Bak S, Jones PR, Olsen CE, Nielsen JK, Hansen ML, Høj
PB, Møller BL (2001) Resistance to an herbivore through engineered
cyanogenic glucoside synthesis. Science 293: 1826–1828
Thompson JN (2005). The Geographic Mosaic of Coevolution. University
of Chicago Press, Chicago
Tikunov Y, Lommen A, de Vos CHR, Verhoeven HA, Bino RJ, Hall RD,
Bovy AG (2005) A novel approach for nontargeted data analysis for
metabolomics: large-scale profiling of tomato fruit volatiles. Plant
Physiol 139: 1125–1137
van Leur H, Vet LEM, van der Putten WH, van Dam NM (2008) Barbarea
vulgaris glucosinolate phenotypes differentially affect performance and
preference of two different species of Lepidopteran herbivores. J Chem
Ecol 34: 121–131
Vincken JP, Heng L, de Groot A, Gruppen H (2007) Saponins, classification
and occurrence in the plant kingdom. Phytochemistry 68: 275–297
Zacarias A, Bolanowski D, Bhatnagar A (2002) Comparative measure-
ments of multicomponent phospholipid mixtures by electrospray mass
spectroscopy: relating ion intensity to concentration. Anal Biochem 308:
152–159
Zhang JD, Cao YB, Xu Z, Sun HH, An MM, Yan L, Chen HS, Gao PH,
Wang Y, Jia XM, et al (2005) In vitro and in vivo antifungal activities of
the eight steroid saponins from Tribulus terrestris L. with potent activity
against fluconazole-resistant fungal pathogens. Biol Pharm Bull 28:
2211–2215
Kuzina et al.
1990 Plant Physiol. Vol. 151, 2009 www.plantphysiol.orgon August 26, 2018 - Published by Downloaded from
Copyright © 2009 American Society of Plant Biologists. All rights reserved.


![Pemphigus Vulgaris [Print] - eMedicine Dermatology Vulgaris .pdf · emedicine.medscape.com eMedicine Specialties > Dermatology > Bullous Diseases Pemphigus Vulgaris Bassam Zeina,](https://img.pdfslide.us/doc/110x75/5c984ab609d3f21c3a8b874e/pemphigus-vulgaris-print-emedicine-vulgaris-pdf-emedicinemedscapecom.jpg)