Embed Size (px)
Citation preview
79
Journal of Mechanical Engineering
ISSN 1823-5514© 2014 Faculty of Mechanical Engineering, Universiti Teknologi MARA (UiTM), Malaysia.
Vol. 11, No. 2, 79-91, 2014
Identifi cation of the Maximum Stress Value that Occur at the Wing-Fuselage
Joints at 1-G Symmetrical Level Flight Condition
Abdul Jalil, A.M.H.Kuntjoro, W.
Department of Mechanical EngineeringUiTM Shah Alam, Selangor, Malaysia
Abdullah, S.Ariffi n, A.K.
Department of Mechanical and Materials EngineeringUKM Bangi, Selangor, Malaysia
ABSTRACT
This paper described the identifi cation of the maximum value of stress that acts at the wing-fuselage joints. The fi nite element models of the wing, the wing lugs and the fuselage lugs were developed. Finite Element Analyses were performed using NASTRAN fi nite element software. CQUAD4 and BAR2 elements were used to represent the individual structures of the wing such as the ribs and stringers are presented in detail in this paper. The applied load was based on 1-g symmetric level fl ight condition that was the load applied at the wing is equal to the net weight of the aircraft. Once the load distribution acting at the wing have been calculated and applied, reaction forces at the nodes representing the wing lugs are obtained and these values are applied to the lug models where the maximum stress value acting at the lugs was obtained. This stress value can be further used for fatigue calculations.
Keywords: Wing-fuselage joints, fi nite element analysis
Artkl V11(6).indd 79Artkl V11(6).indd 79 24/12/2014 15:18:3224/12/2014 15:18:32
80
Journal of Mechanical Engineering
Introduction
The use of fi nite element analysis (FEA) has made its way to a stage where it has widely been used in solving various engineering problems. The usage of FEA keeps improving steadily over the past few decades. There are many references that can be found to better understand the concept of using fi nite element as an analysis tool [1]. It is a form of numerical analysis which can be used for stress prediction and structure optimization [2].
Finite Element Analysis can be used to solve all types of linear and nonlinear stress, dynamics, composite and thermal engineering analysis problem. Its application varies depending on the type of analysis to be performed. The behaviors of different materials under variable conditions are able to be predicted. The application of such an analysis tool in the aircraft industry, such as MSC.NASTRAN [3], which predicts the behavior of structures at component level. It has been used effectively in different types of analysis of aircraft structures. Analysis conducted by Fleming et. al. concentrated on the aircraft fuselage panel [4], while Kuntjoro et. al. performed analysis on the structural design of the wing panel [5] and Buehrle et. al. carried out analysis on aircraft fuselage structures [6]. The Finite Element Analysis tool would also be able to assist engineers in providing valuable data to be used for large experiments, for example the SWISS F/A-18 full scale fatigue test program [7].
The fi nite element tool such as MSC.Nastran can be used as a part of the process of fatigue life prediction (FLEI) of the aircraft. This will involve the monitoring of crack initiation or fatigue life of a component, for example, the wing-fuselage joints (lugs). In order to satisfy this purpose, the maximum stress occurring at the wing-fuselage joints (lugs) at 1-G symmetrical level fl ight condition needs to be obtained. The outcome of this analysis can be used for the stress-spectra generation [8] or to carry out further fatigue analysis [9]. The Finite Element Analysis is employed to determine the maximum stress value of the lugs. The fi nite element model of the wing, the wing lugs and the fuselage lugs was developed in this paper. The load applied to the wing is derived. The reaction forces obtained from the wing analysis will be applied to the wing-side lug and fuselage-side lug respectively. In this analysis, MSC.Nastran is used to predict the maximum stress occurring at the wing fuselage joints (lugs) of an aircraft.
Methodology
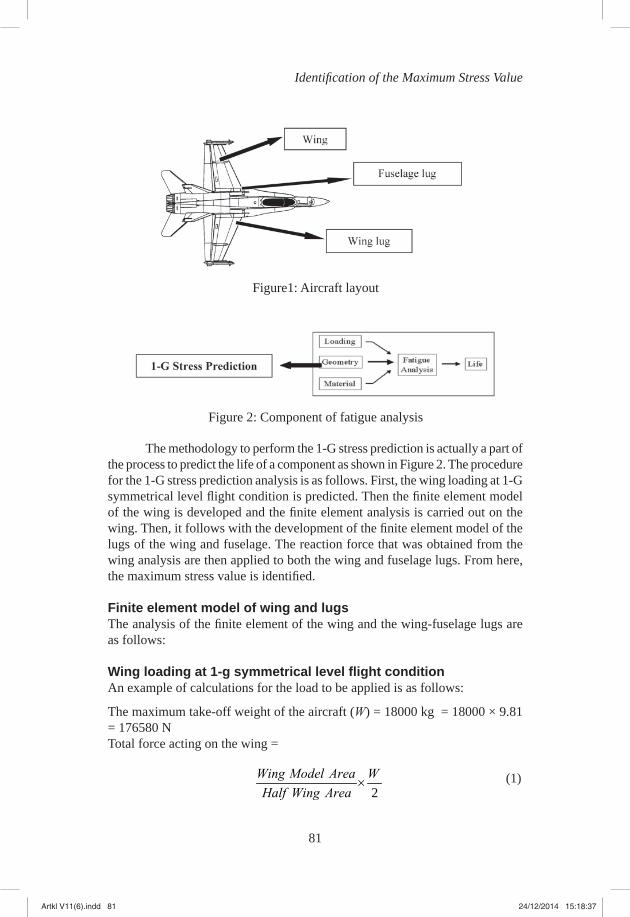
Figure 1 shows the layout of the aircraft which consists of the aircraft wing, the wing-side lug and the fuselage-side lug.
Artkl V11(6).indd 80Artkl V11(6).indd 80 24/12/2014 15:18:3724/12/2014 15:18:37
81
Identifi cation of the Maximum Stress Value
The methodology to perform the 1-G stress prediction is actually a part of the process to predict the life of a component as shown in Figure 2. The procedure for the 1-G stress prediction analysis is as follows. First, the wing loading at 1-G symmetrical level fl ight condition is predicted. Then the fi nite element model of the wing is developed and the fi nite element analysis is carried out on the wing. Then, it follows with the development of the fi nite element model of the lugs of the wing and fuselage. The reaction force that was obtained from the wing analysis are then applied to both the wing and fuselage lugs. From here, the maximum stress value is identifi ed.
Finite element model of wing and lugsThe analysis of the fi nite element of the wing and the wing-fuselage lugs are as follows:
Wing loading at 1-g symmetrical level fl ight conditionAn example of calculations for the load to be applied is as follows:
The maximum take-off weight of the aircraft (W) = 18000 kg = 18000 × 9.81 = 176580 NTotal force acting on the wing =
2
×Wing Model Area W
Half Wing Area (1)
Figure1: Aircraft layout
Figure 2: Component of fatigue analysis
Artkl V11(6).indd 81Artkl V11(6).indd 81 24/12/2014 15:18:3724/12/2014 15:18:37
82
Journal of Mechanical Engineering
a = Net Load acting on wing b = Total force acting on the wing (1) c = The weight of fuel of the plane is assumed to be stored at the wing region being analyzed d = The weight of weapons of the aircraft that are placed at the wing region being analyzed e = The weight of the wing structure
a = b – c – d – e
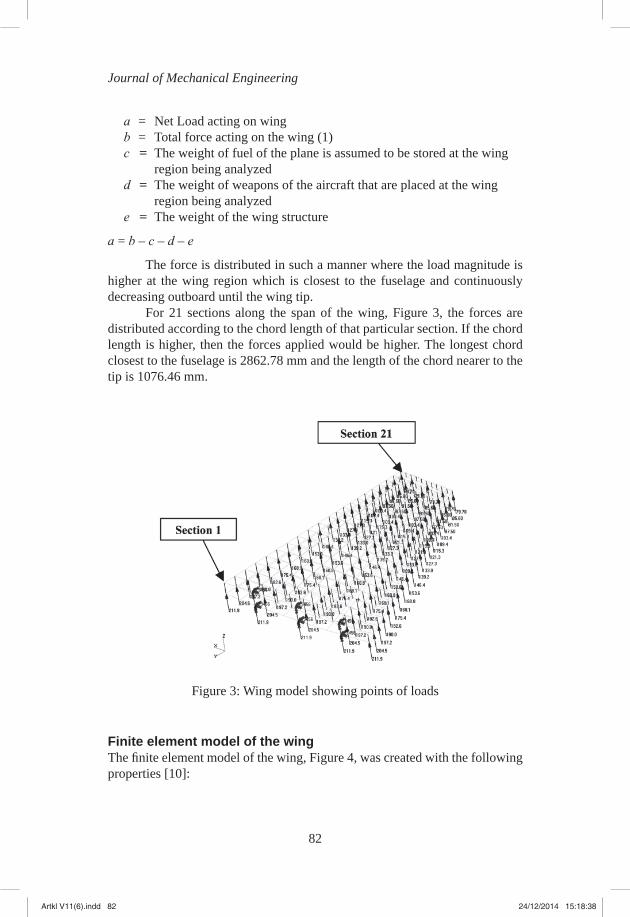
The force is distributed in such a manner where the load magnitude is higher at the wing region which is closest to the fuselage and continuously decreasing outboard until the wing tip.
For 21 sections along the span of the wing, Figure 3, the forces are distributed according to the chord length of that particular section. If the chord length is higher, then the forces applied would be higher. The longest chord closest to the fuselage is 2862.78 mm and the length of the chord nearer to the tip is 1076.46 mm.
Figure 3: Wing model showing points of loads
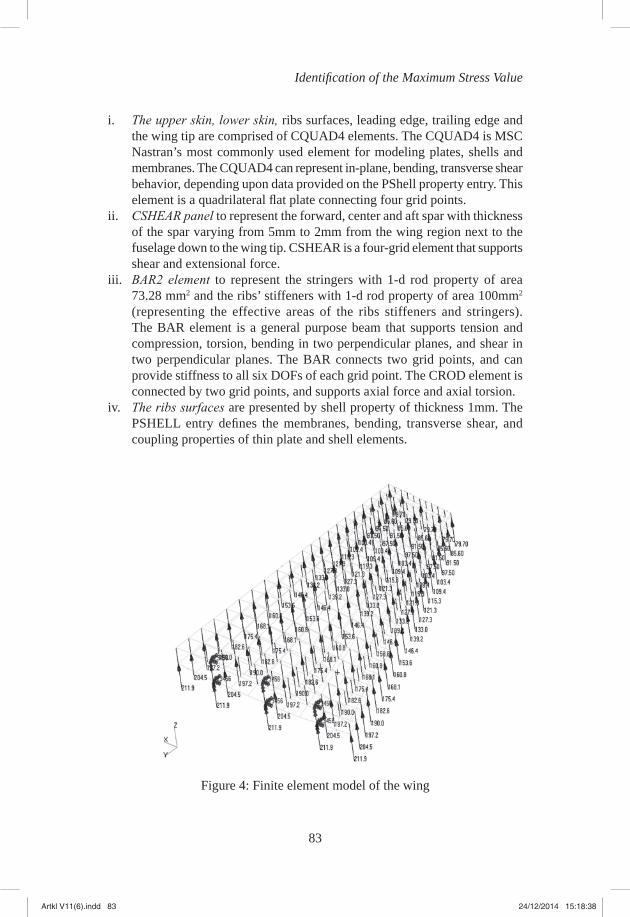
Finite element model of the wingThe fi nite element model of the wing, Figure 4, was created with the following properties [10]:
Artkl V11(6).indd 82Artkl V11(6).indd 82 24/12/2014 15:18:3824/12/2014 15:18:38
83
Identifi cation of the Maximum Stress Value
i. The upper skin, lower skin, ribs surfaces, leading edge, trailing edge and the wing tip are comprised of CQUAD4 elements. The CQUAD4 is MSC Nastran’s most commonly used element for modeling plates, shells and membranes. The CQUAD4 can represent in-plane, bending, transverse shear behavior, depending upon data provided on the PShell property entry. This element is a quadrilateral fl at plate connecting four grid points.
ii. CSHEAR panel to represent the forward, center and aft spar with thickness of the spar varying from 5mm to 2mm from the wing region next to the fuselage down to the wing tip. CSHEAR is a four-grid element that supports shear and extensional force.
iii. BAR2 element to represent the stringers with 1-d rod property of area 73.28 mm2 and the ribs’ stiffeners with 1-d rod property of area 100mm2
(representing the effective areas of the ribs stiffeners and stringers). The BAR element is a general purpose beam that supports tension and compression, torsion, bending in two perpendicular planes, and shear in two perpendicular planes. The BAR connects two grid points, and can provide stiffness to all six DOFs of each grid point. The CROD element is connected by two grid points, and supports axial force and axial torsion.
iv. The ribs surfaces are presented by shell property of thickness 1mm. The PSHELL entry defi nes the membranes, bending, transverse shear, and coupling properties of thin plate and shell elements.
Figure 4: Finite element model of the wing
Artkl V11(6).indd 83Artkl V11(6).indd 83 24/12/2014 15:18:3824/12/2014 15:18:38
84
Journal of Mechanical Engineering
v. The skin, the leading and trailing edge are represented by shell property of thickness 2 mm.
vi. The material used for this analysis is Aluminum Alloy 7000 series with a Young Modulus of 72 GN/m2 and Poisson Ratio of 0.33. It is assumed that there are no changes in the material properties due to changes in atmospheric temperatures and pressures of different altitudes.
vii. The model is fi xed at the points representing the location of the lugs and loads are applied accordingly (at z direction of this model).
Finite Element Analysis is performed on the wing, with the wing-fuselage lug joints are regarded as wing supports. The results of the reaction forces of the supports are obtained. This will be presented more detailed at the Results and Discussion section.
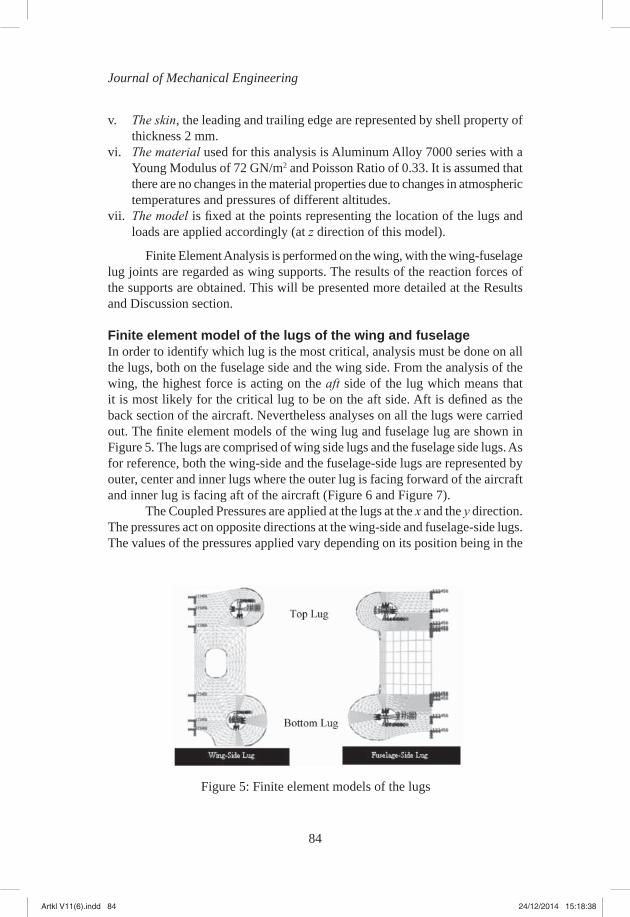
Finite element model of the lugs of the wing and fuselageIn order to identify which lug is the most critical, analysis must be done on all the lugs, both on the fuselage side and the wing side. From the analysis of the wing, the highest force is acting on the aft side of the lug which means that it is most likely for the critical lug to be on the aft side. Aft is defi ned as the back section of the aircraft. Nevertheless analyses on all the lugs were carried out. The fi nite element models of the wing lug and fuselage lug are shown in Figure 5. The lugs are comprised of wing side lugs and the fuselage side lugs. As for reference, both the wing-side and the fuselage-side lugs are represented by outer, center and inner lugs where the outer lug is facing forward of the aircraft and inner lug is facing aft of the aircraft (Figure 6 and Figure 7).
The Coupled Pressures are applied at the lugs at the x and the y direction. The pressures act on opposite directions at the wing-side and fuselage-side lugs. The values of the pressures applied vary depending on its position being in the
Figure 5: Finite element models of the lugs
Artkl V11(6).indd 84Artkl V11(6).indd 84 24/12/2014 15:18:3824/12/2014 15:18:38
85
Identifi cation of the Maximum Stress Value
forward, center or aft. The maximum von Mises stress value is presented. Von Mises is the norm value for stress which is equivalent to a norm of a vector or a tensor.
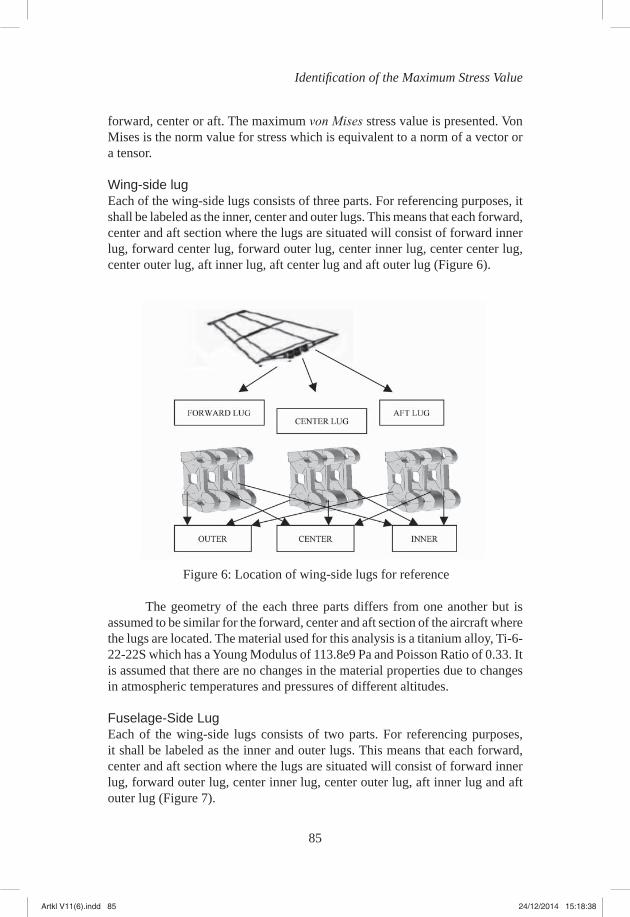
Wing-side lugEach of the wing-side lugs consists of three parts. For referencing purposes, it shall be labeled as the inner, center and outer lugs. This means that each forward, center and aft section where the lugs are situated will consist of forward inner lug, forward center lug, forward outer lug, center inner lug, center center lug, center outer lug, aft inner lug, aft center lug and aft outer lug (Figure 6).
Figure 6: Location of wing-side lugs for reference
The geometry of the each three parts differs from one another but is assumed to be similar for the forward, center and aft section of the aircraft where the lugs are located. The material used for this analysis is a titanium alloy, Ti-6-22-22S which has a Young Modulus of 113.8e9 Pa and Poisson Ratio of 0.33. It is assumed that there are no changes in the material properties due to changes in atmospheric temperatures and pressures of different altitudes.
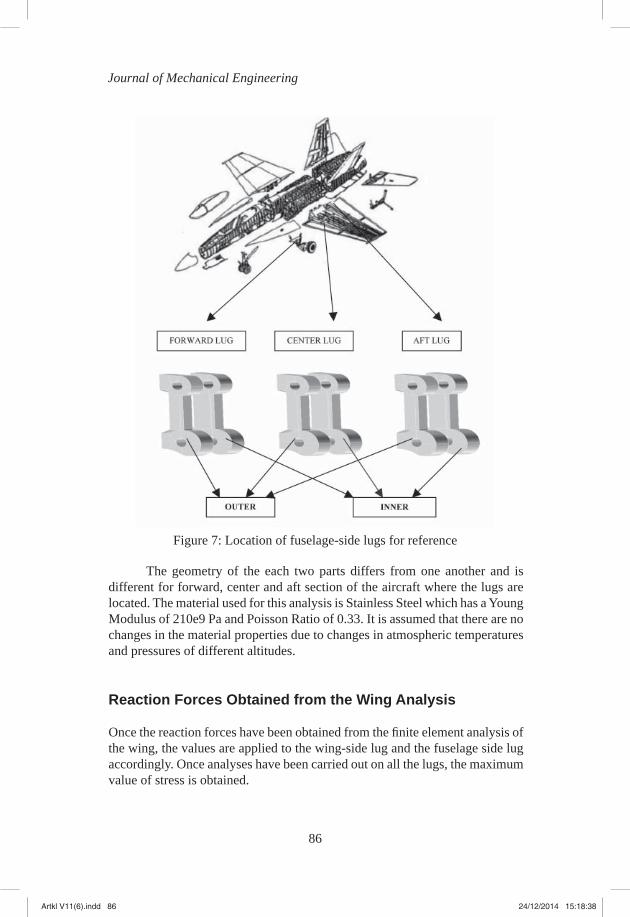
Fuselage-Side LugEach of the wing-side lugs consists of two parts. For referencing purposes, it shall be labeled as the inner and outer lugs. This means that each forward, center and aft section where the lugs are situated will consist of forward inner lug, forward outer lug, center inner lug, center outer lug, aft inner lug and aft outer lug (Figure 7).
Artkl V11(6).indd 85Artkl V11(6).indd 85 24/12/2014 15:18:3824/12/2014 15:18:38
86
Journal of Mechanical Engineering
Figure 7: Location of fuselage-side lugs for reference
The geometry of the each two parts differs from one another and is different for forward, center and aft section of the aircraft where the lugs are located. The material used for this analysis is Stainless Steel which has a Young Modulus of 210e9 Pa and Poisson Ratio of 0.33. It is assumed that there are no changes in the material properties due to changes in atmospheric temperatures and pressures of different altitudes.
Reaction Forces Obtained from the Wing Analysis
Once the reaction forces have been obtained from the fi nite element analysis of the wing, the values are applied to the wing-side lug and the fuselage side lug accordingly. Once analyses have been carried out on all the lugs, the maximum value of stress is obtained.
Artkl V11(6).indd 86Artkl V11(6).indd 86 24/12/2014 15:18:3824/12/2014 15:18:38
87
Identifi cation of the Maximum Stress Value
Results and Discussion
The loads to be applied to the wing are obtained from the calculations in section 3.1. The net Load acting on the wing is equal to 15000 N. Forces Acting at Section 1 to 21 along the wing are tabulated below, Table 1:
Table 1: Forces acted along the wing
Section
Force Section
Force (N/node) (N/node)
1 211.9 12 133 2 204.5 13 127.3 3 197.2 14 121.3 4 190 15 115.3 5 182.6 16 109.4 6 175.4 17 103.4 7 168.1 18 97.5 8 160.8 19 91.5 9 153.6 20 85.6 10 146.4 21 79.7 11 139.2
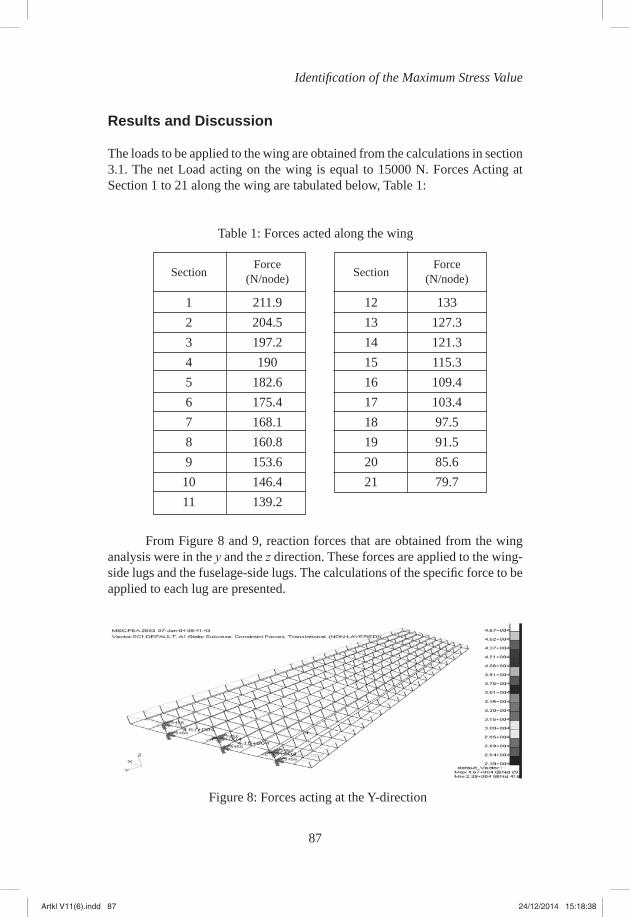
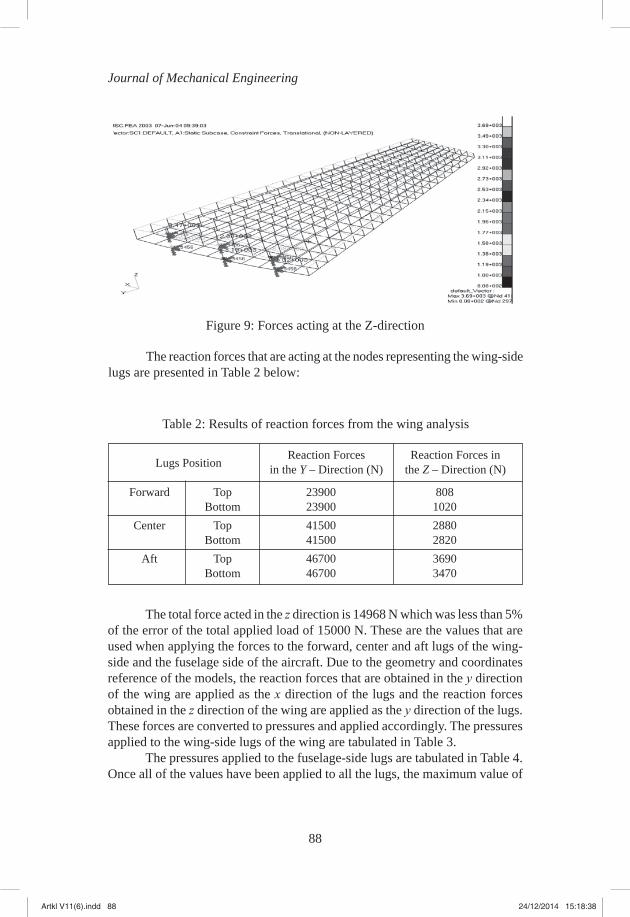
From Figure 8 and 9, reaction forces that are obtained from the wing analysis were in the y and the z direction. These forces are applied to the wing-side lugs and the fuselage-side lugs. The calculations of the specifi c force to be applied to each lug are presented.
Figure 8: Forces acting at the Y-direction
Artkl V11(6).indd 87Artkl V11(6).indd 87 24/12/2014 15:18:3824/12/2014 15:18:38
88
Journal of Mechanical Engineering
Table 2: Results of reaction forces from the wing analysis
Lugs Position
Reaction Forces Reaction Forces in in the Y – Direction (N) the Z – Direction (N)
Forward Top 23900 808 Bottom 23900 1020 Center Top 41500 2880 Bottom 41500 2820 Aft Top 46700 3690 Bottom 46700 3470
Figure 9: Forces acting at the Z-direction
The reaction forces that are acting at the nodes representing the wing-side lugs are presented in Table 2 below:
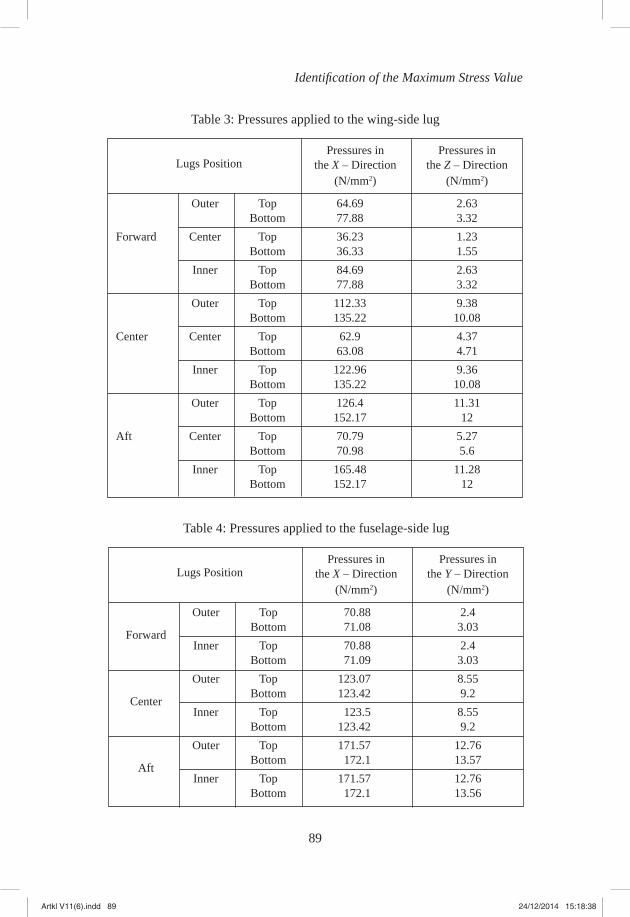
The total force acted in the z direction is 14968 N which was less than 5% of the error of the total applied load of 15000 N. These are the values that are used when applying the forces to the forward, center and aft lugs of the wing-side and the fuselage side of the aircraft. Due to the geometry and coordinates reference of the models, the reaction forces that are obtained in the y direction of the wing are applied as the x direction of the lugs and the reaction forces obtained in the z direction of the wing are applied as the y direction of the lugs. These forces are converted to pressures and applied accordingly. The pressures applied to the wing-side lugs of the wing are tabulated in Table 3.
The pressures applied to the fuselage-side lugs are tabulated in Table 4. Once all of the values have been applied to all the lugs, the maximum value of
Artkl V11(6).indd 88Artkl V11(6).indd 88 24/12/2014 15:18:3824/12/2014 15:18:38
89
Identifi cation of the Maximum Stress Value
Table 3: Pressures applied to the wing-side lug
Lugs Position
Pressures in Pressures in the X – Direction the Z – Direction (N/mm2) (N/mm2)
Outer Top 64.69 2.63 Bottom 77.88 3.32 Forward Center Top 36.23 1.23 Bottom 36.33 1.55 Inner Top 84.69 2.63 Bottom 77.88 3.32 Outer Top 112.33 9.38 Bottom 135.22 10.08Center Center Top 62.9 4.37 Bottom 63.08 4.71 Inner Top 122.96 9.36 Bottom 135.22 10.08 Outer Top 126.4 11.31 Bottom 152.17 12Aft Center Top 70.79 5.27 Bottom 70.98 5.6 Inner Top 165.48 11.28 Bottom 152.17 12
Table 4: Pressures applied to the fuselage-side lug
Lugs Position
Pressures in Pressures in the X – Direction the Y – Direction (N/mm2) (N/mm2)
Outer Top 70.88 2.4 Bottom 71.08 3.03 Forward
Inner Top 70.88 2.4 Bottom 71.09 3.03 Outer Top 123.07 8.55
Center Bottom 123.42 9.2
Inner Top 123.5 8.55 Bottom 123.42 9.2 Outer Top 171.57 12.76
Aft Bottom 172.1 13.57
Inner Top 171.57 12.76 Bottom 172.1 13.56
Artkl V11(6).indd 89Artkl V11(6).indd 89 24/12/2014 15:18:3824/12/2014 15:18:38
90
Journal of Mechanical Engineering
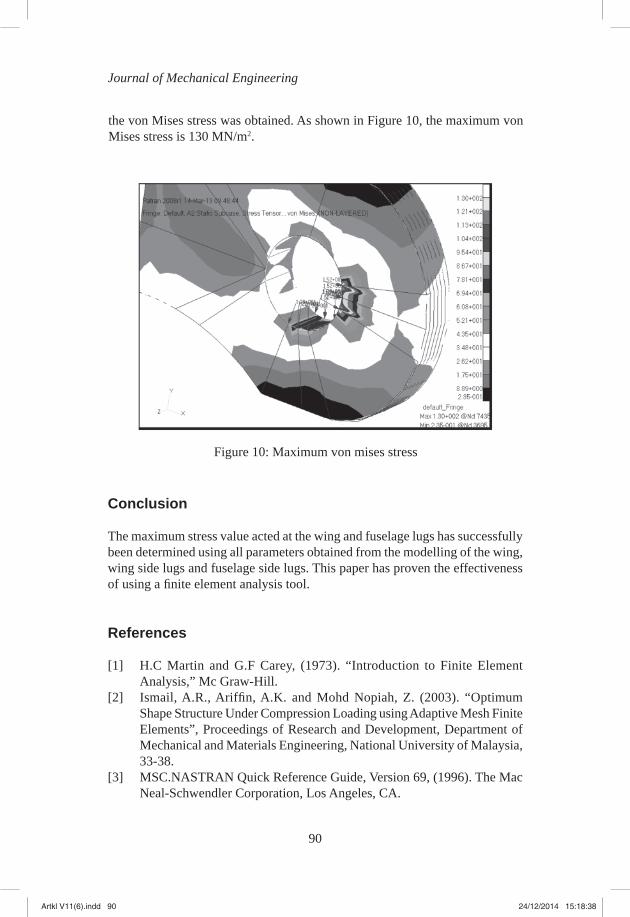
Figure 10: Maximum von mises stress
the von Mises stress was obtained. As shown in Figure 10, the maximum von Mises stress is 130 MN/m2.
Conclusion
The maximum stress value acted at the wing and fuselage lugs has successfully been determined using all parameters obtained from the modelling of the wing, wing side lugs and fuselage side lugs. This paper has proven the effectiveness of using a fi nite element analysis tool.
References
[1] H.C Martin and G.F Carey, (1973). “Introduction to Finite Element Analysis,” Mc Graw-Hill.
[2] Ismail, A.R., Ariffi n, A.K. and Mohd Nopiah, Z. (2003). “Optimum Shape Structure Under Compression Loading using Adaptive Mesh Finite Elements”, Proceedings of Research and Development, Department of Mechanical and Materials Engineering, National University of Malaysia, 33-38.
[3] MSC.NASTRAN Quick Reference Guide, Version 69, (1996). The Mac Neal-Schwendler Corporation, Los Angeles, CA.
Artkl V11(6).indd 90Artkl V11(6).indd 90 24/12/2014 15:18:3824/12/2014 15:18:38
91
Identifi cation of the Maximum Stress Value
[4] Fleming, G.A., Buehrle, R. D. and Storaasli, O.L. (1998). “Modal Analysis of An Aircraft Fuselage Panel Using Experimental and Finite Element Techniques,” Proceedings of the 3rd International Conference on Vibration Measurements by Laser Techniques, Ancona, Italy.
[5] Wahyu Kuntjoro, Sulaeman Kamil and Hanafi K. Mochajan. (2002). “Investigation of Practical Analysis for the Purpose of Structural Design of Wing Panel.”, Journal of Institution of Engineers, Malaysia, 63(2).
[6] Buehrle, R.D., Fleming, G. A., Prappa, R.S. and Groveld, F.W. (2000). “Finite Element Model Development and Validation for Aircraft Fuselage Structures,” Proceedings of the 18th International Modal Analysis Conference, San Antonio, Texas, February 7-10.
[7] Guillaume, M., Hawkins, J., Godinat, M., Bucher, B., Pfi ffner, I. and Weiss, J. (2002). “Swiss F/A-18 Full Scale Fatigue Test Program,” ICAF 2002, Country Review: Switzerland.
[8] Idrus, D., Abdul Jalil, A.M.H, Kuntjoro, W., Bahari, I. and Ujang, A.G. (2004). “Fatigue Life Prediction of the Royal Malaysian Air-Force (RMAF) Mig-29 Fighter Aircraft”, Caidmark Sdn. Bhd.
[9] MSC. Fatigue. (2001). Quick Start Guide.[10] Miller, M.P. (1996). “MSC Nastran, Getting Started User’s Guide,” 2nd
Edition.
Artkl V11(6).indd 91Artkl V11(6).indd 91 24/12/2014 15:18:3924/12/2014 15:18:39

Artkl V11(6).indd 92Artkl V11(6).indd 92 24/12/2014 15:18:3924/12/2014 15:18:39