Embed Size (px)
Citation preview
www.usask.ca
Ideally balanced amino acid levels influence egg performance, feed efficiency, egg
quality, feathering, hen weight and body composition
D. Kumar*, C. Raginski, K. Schwean-Lardner, and H. L. Classen
______________________________________
Department of Animal and Poultry Science
University of Saskatchewan
www.usask.ca
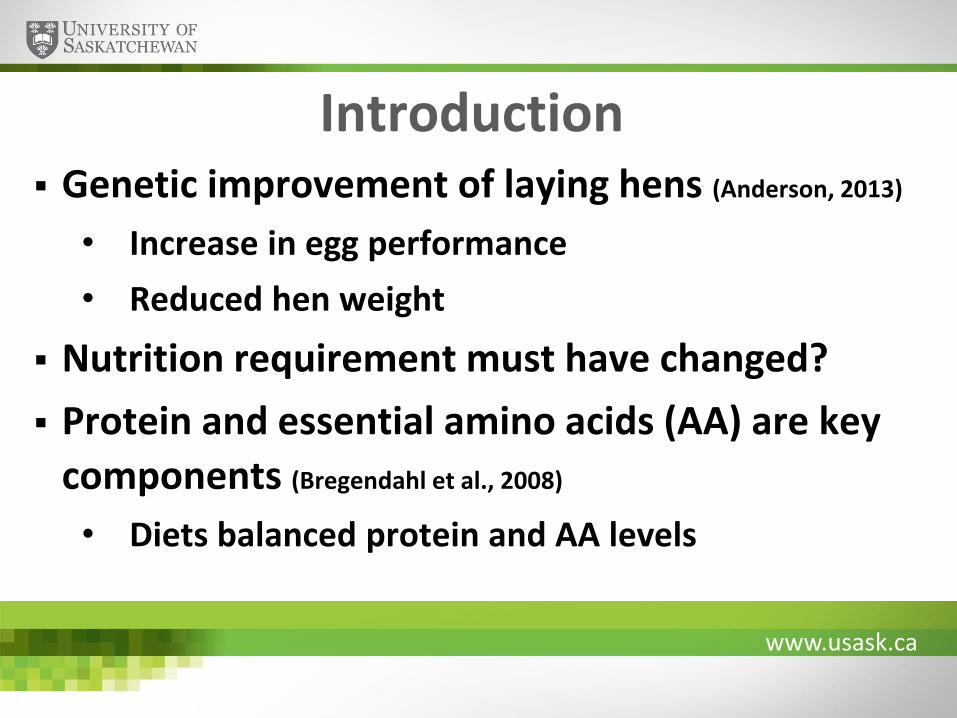
Introduction Genetic improvement of laying hens (Anderson, 2013)
• Increase in egg performance
• Reduced hen weight
Nutrition requirement must have changed?
Protein and essential amino acids (AA) are key
components (Bregendahl et al., 2008)
• Diets balanced protein and AA levels
www.usask.ca
Introduction contd. Inadequate protein:
• Lost production, reduced revenue
Excess protein:
• Metabolic cost of eliminating excess AA (Sklan and Plavnic, 2010)
• High protein diets cause nitrogen pollution (Keshavarz and Austic, 2004)
Dietary protein level influences egg quality (Figueiredo et al., 2012), feathering (Ambrosen and Petersen, 1997)
www.usask.ca
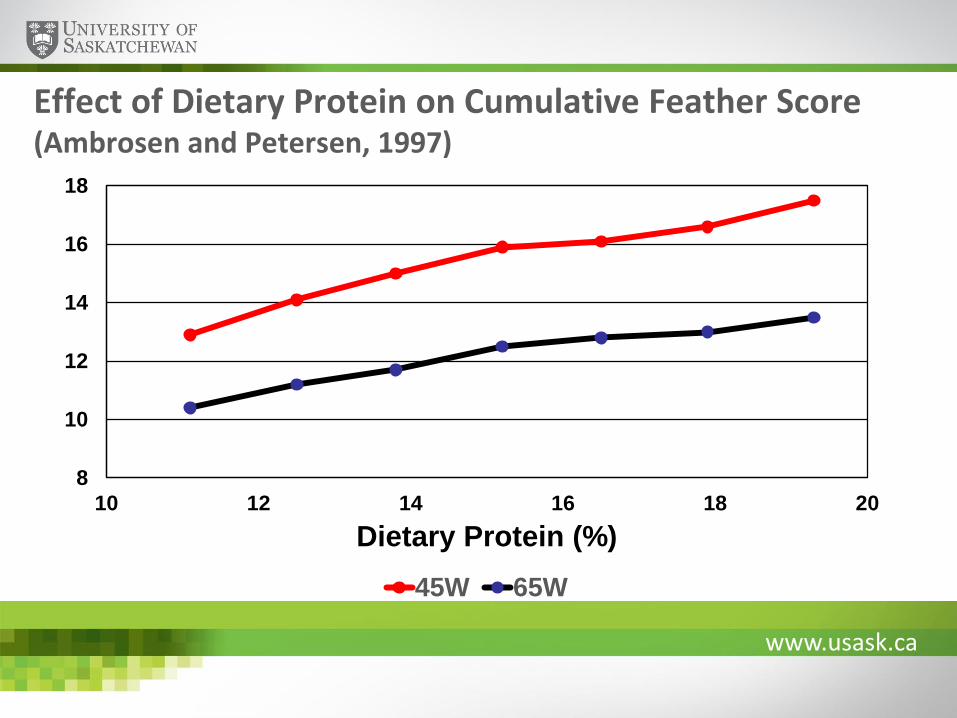
Effect of Dietary Protein on Cumulative Feather Score (Ambrosen and Petersen, 1997)
8
10
12
14
16
18
10 12 14 16 18 20
Dietary Protein (%)
45W 65W
www.usask.ca
Introduction contd. Most early work failed to use digestible AA and an
ideal AA ratio in diet formulations (Ishibashi et al., 1998; Scheideler et al., 2004)
Often research amino acid levels did not result in a maximum response for all response criteria
Research AA levels did not study impact on feathering and body composition
Recommendations may be extrapolated from existing research
www.usask.ca
Research Objective To assess laying hens response to graded levels
of balanced amino acid intake from 27 to 66 wk of age on egg performance, feed efficiency, hen weight, body composition, feathering and egg quality
www.usask.ca
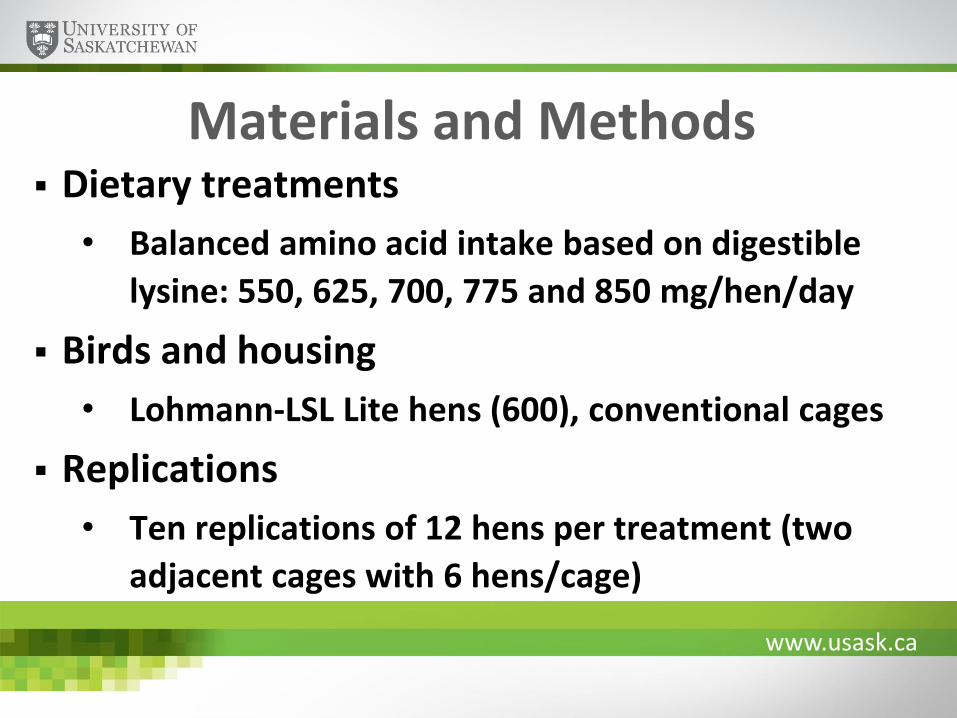
Materials and Methods Dietary treatments
• Balanced amino acid intake based on digestible
lysine: 550, 625, 700, 775 and 850 mg/hen/day
Birds and housing
• Lohmann-LSL Lite hens (600), conventional cages
Replications
• Ten replications of 12 hens per treatment (two
adjacent cages with 6 hens/cage)
www.usask.ca
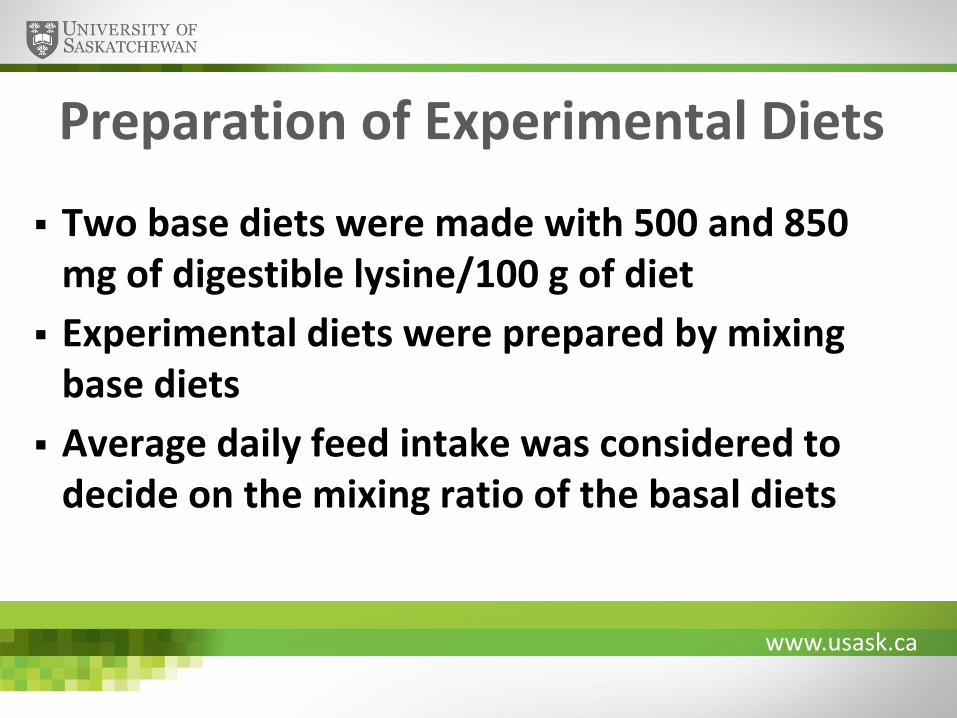
Preparation of Experimental Diets
Two base diets were made with 500 and 850 mg of digestible lysine/100 g of diet
Experimental diets were prepared by mixing base diets
Average daily feed intake was considered to decide on the mixing ratio of the basal diets
www.usask.ca
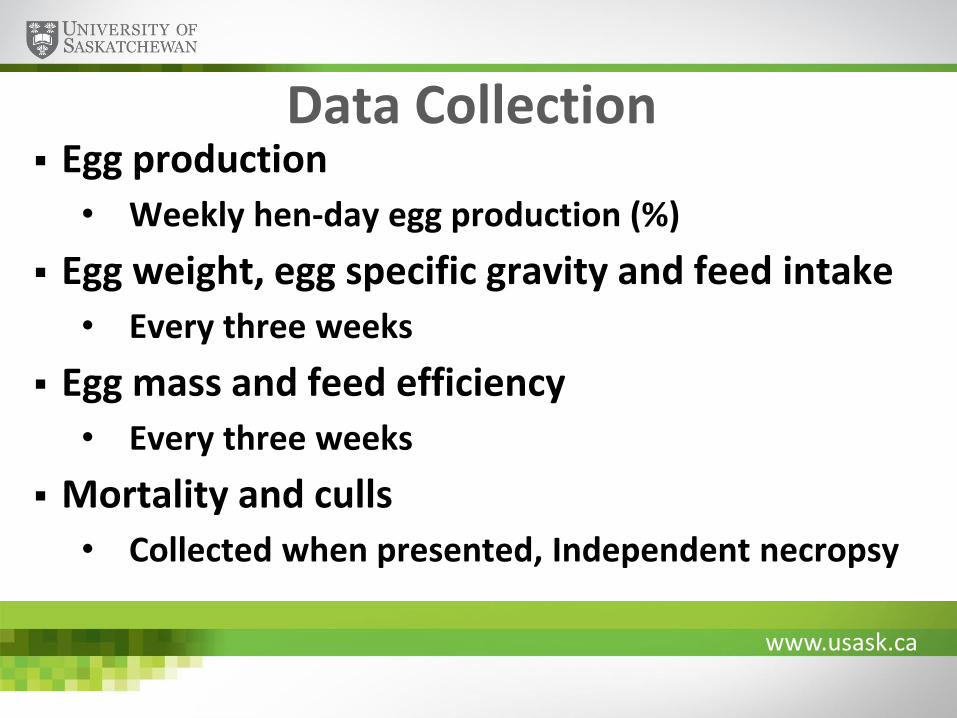
Data Collection Egg production
• Weekly hen-day egg production (%)
Egg weight, egg specific gravity and feed intake
• Every three weeks
Egg mass and feed efficiency
• Every three weeks
Mortality and culls
• Collected when presented, Independent necropsy
www.usask.ca
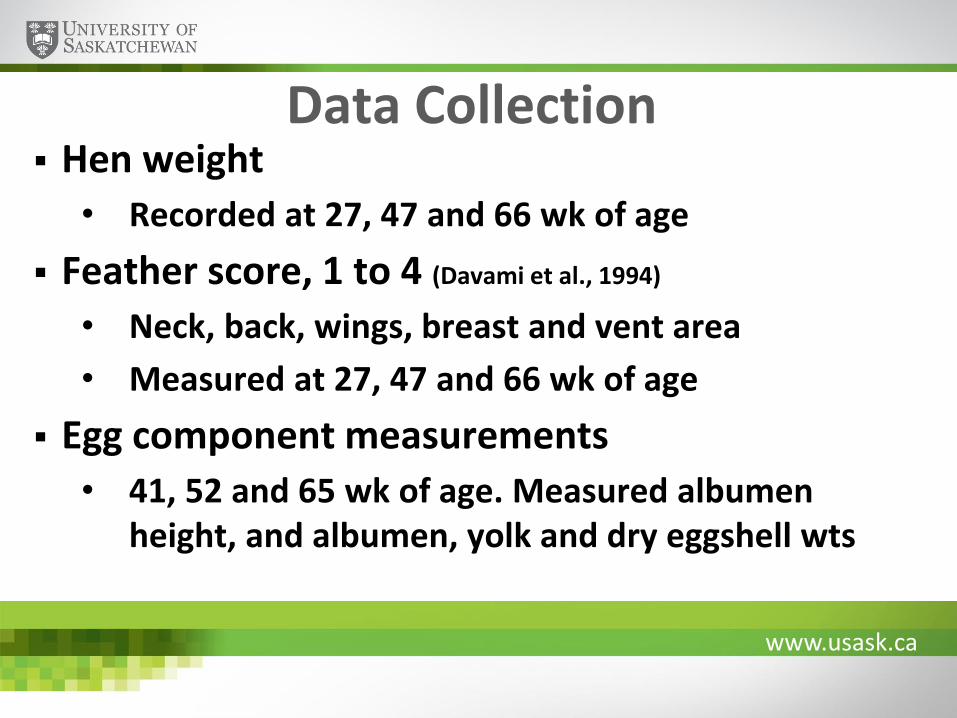
Data Collection Hen weight
• Recorded at 27, 47 and 66 wk of age
Feather score, 1 to 4 (Davami et al., 1994)
• Neck, back, wings, breast and vent area
• Measured at 27, 47 and 66 wk of age
Egg component measurements
• 41, 52 and 65 wk of age. Measured albumen height, and albumen, yolk and dry eggshell wts
www.usask.ca
Data Collection
Body tissues and organs (66 wk of age)
• Breast muscles (major and minor), abdominal fat pad, heart, liver and kidneys weights
www.usask.ca
Statistical Analysis
Completely randomized design (CRD)
Data were checked for normality and transformed (log + 1) when appropriate
Data were analyzed using PROC MIXED, PROC REG and PROC RSREG of SAS 9.3 (2003)
The level of significance was fixed at P ≤ 0.05
www.usask.ca
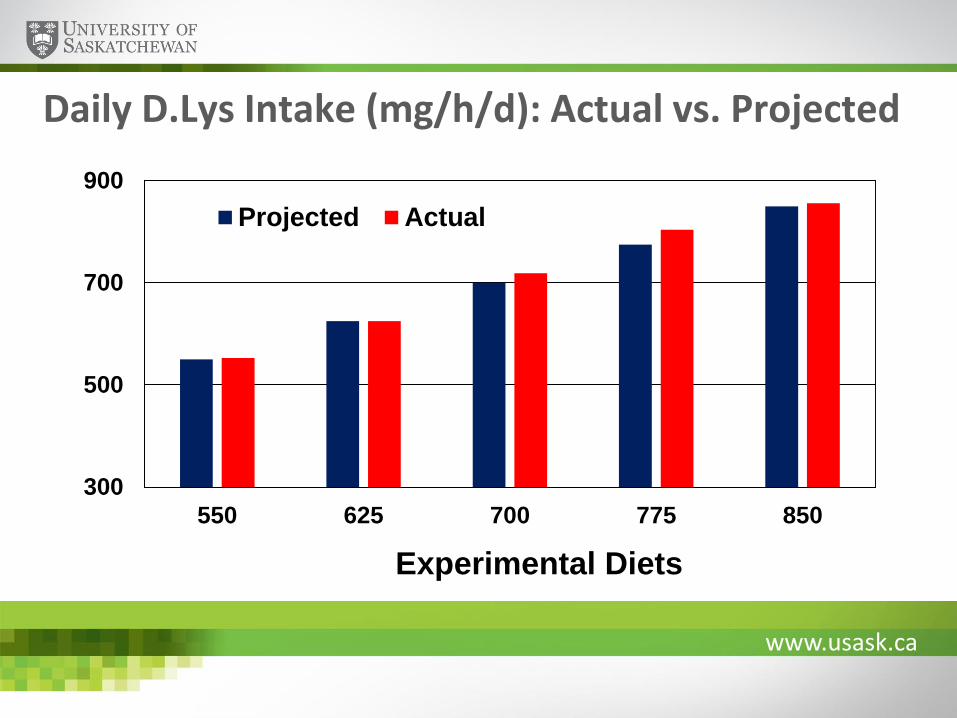
Daily D.Lys Intake (mg/h/d): Actual vs. Projected
300
500
700
900
550 625 700 775 850
Experimental Diets
Projected Actual

www.usask.ca
Results
www.usask.ca
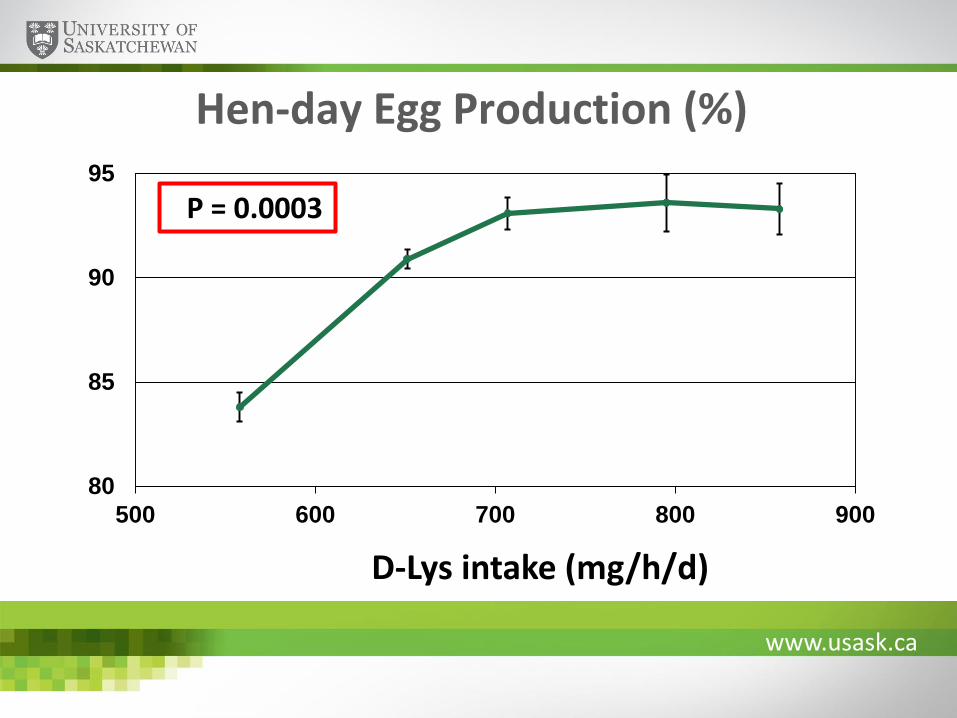
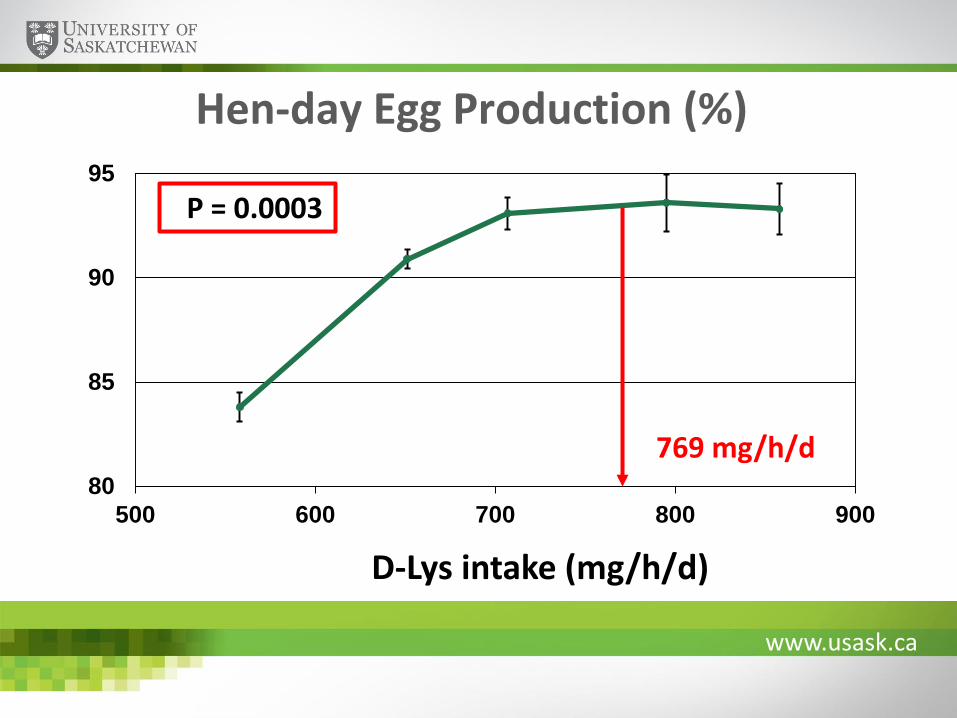
Hen-day Egg Production (%)
80
85
90
95
500 600 700 800 900
D-Lys intake (mg/h/d)
P = 0.0003
www.usask.ca
Hen-day Egg Production (%)
80
85
90
95
500 600 700 800 900
D-Lys intake (mg/h/d)
P = 0.0003
769 mg/h/d
www.usask.ca
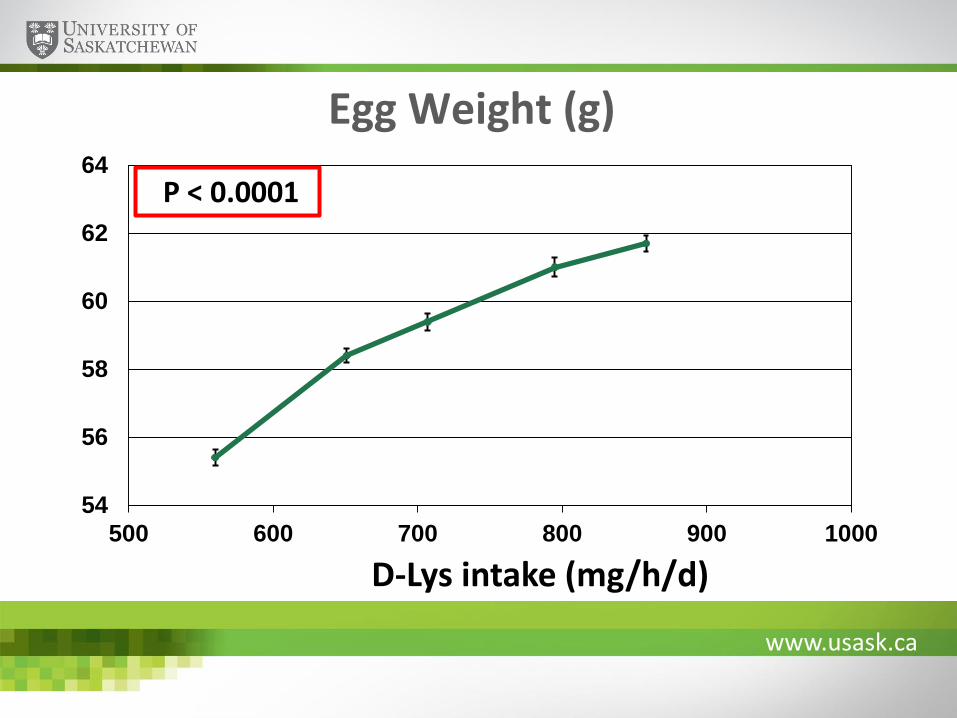
Egg Weight (g)
54
56
58
60
62
64
500 600 700 800 900 1000
D-Lys intake (mg/h/d)
P < 0.0001
www.usask.ca
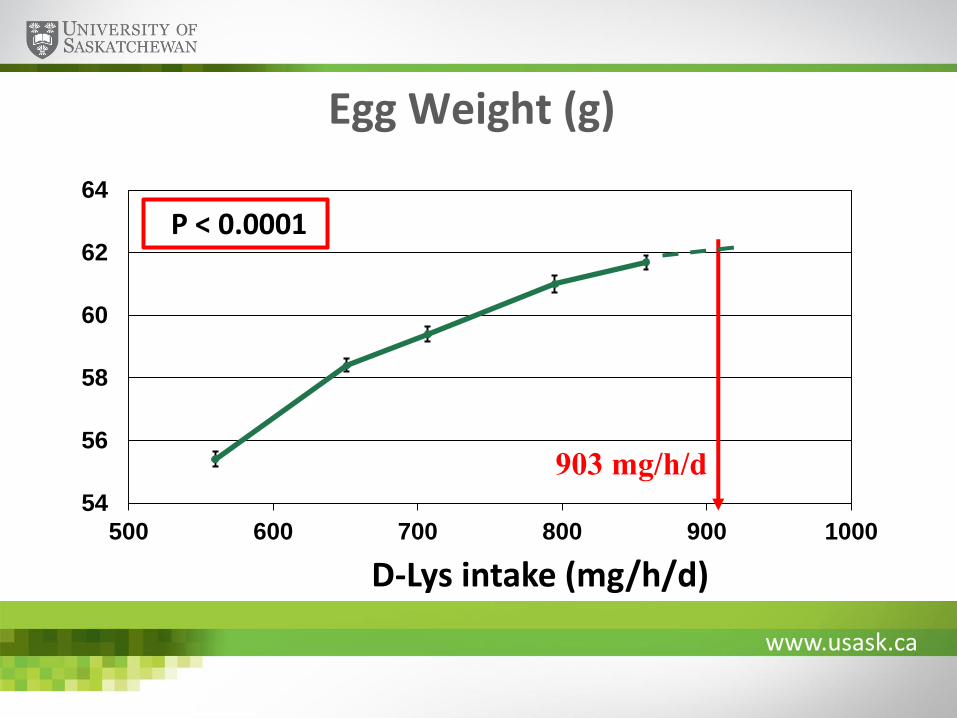
Egg Weight (g)
54
56
58
60
62
64
500 600 700 800 900 1000
D-Lys intake (mg/h/d)
P < 0.0001
903 mg/h/d
www.usask.ca
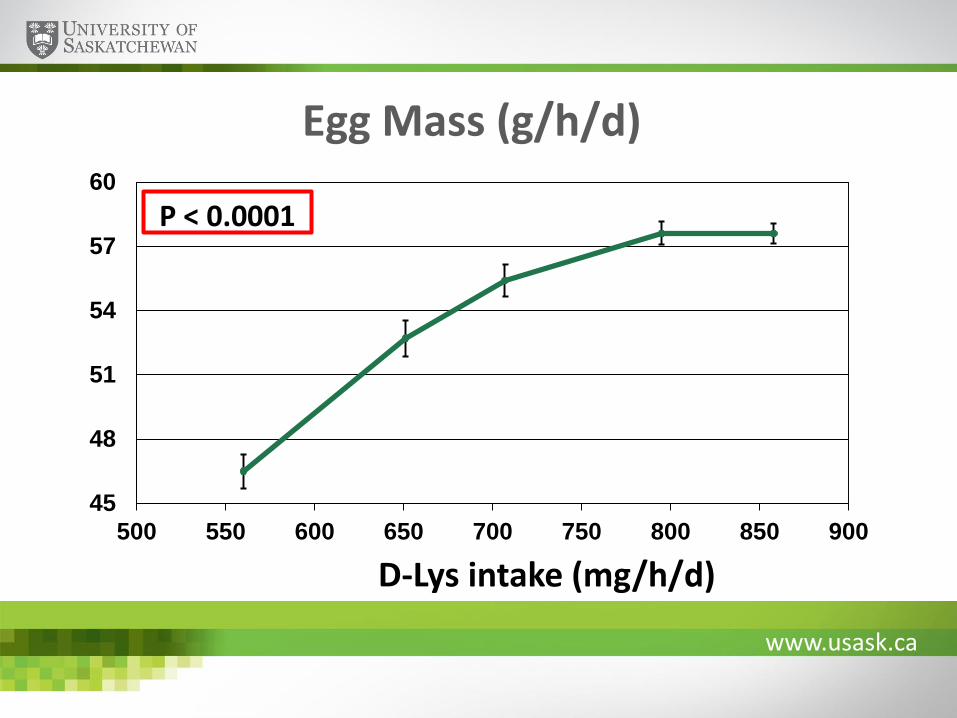
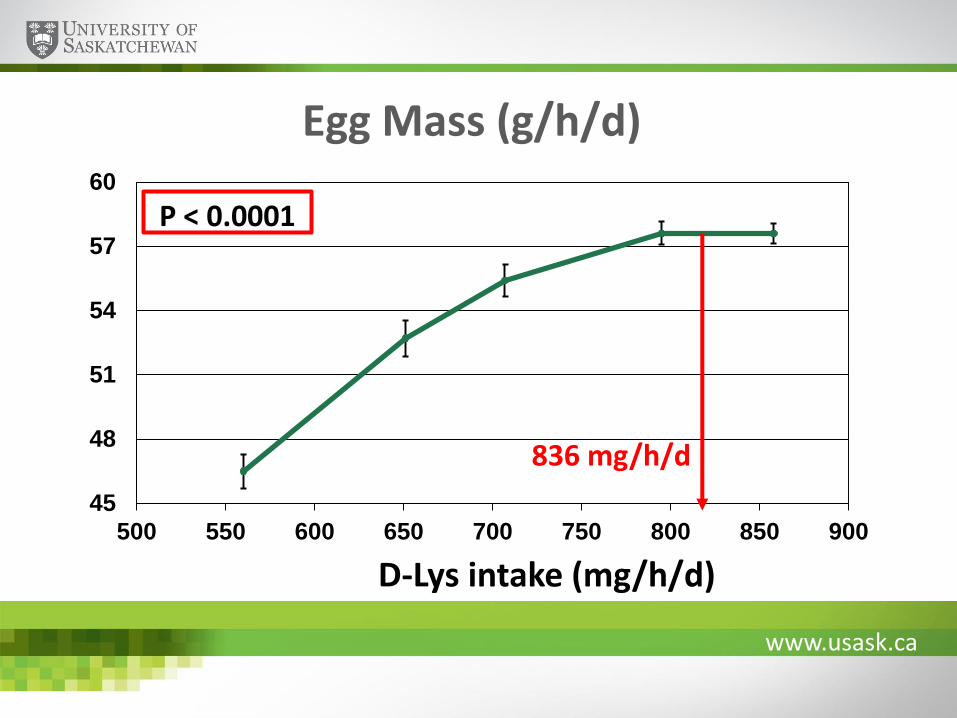
Egg Mass (g/h/d)
45
48
51
54
57
60
500 550 600 650 700 750 800 850 900
D-Lys intake (mg/h/d)
P < 0.0001
www.usask.ca
Egg Mass (g/h/d)
45
48
51
54
57
60
500 550 600 650 700 750 800 850 900
D-Lys intake (mg/h/d)
P < 0.0001
836 mg/h/d
www.usask.ca
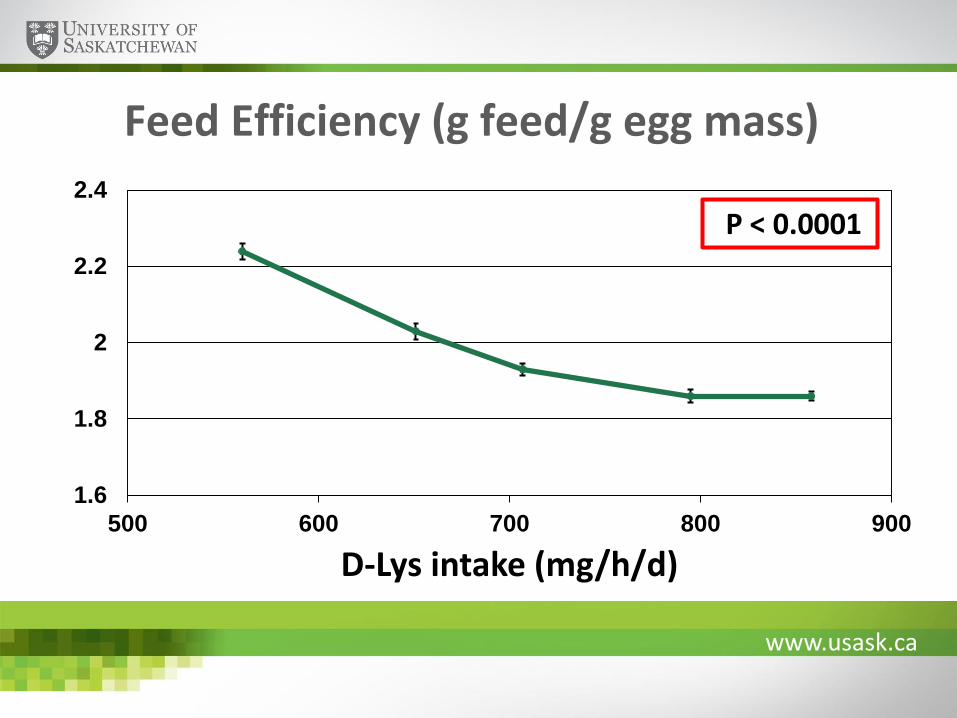
Feed Efficiency (g feed/g egg mass)
1.6
1.8
2
2.2
2.4
500 600 700 800 900
D-Lys intake (mg/h/d)
P < 0.0001
www.usask.ca
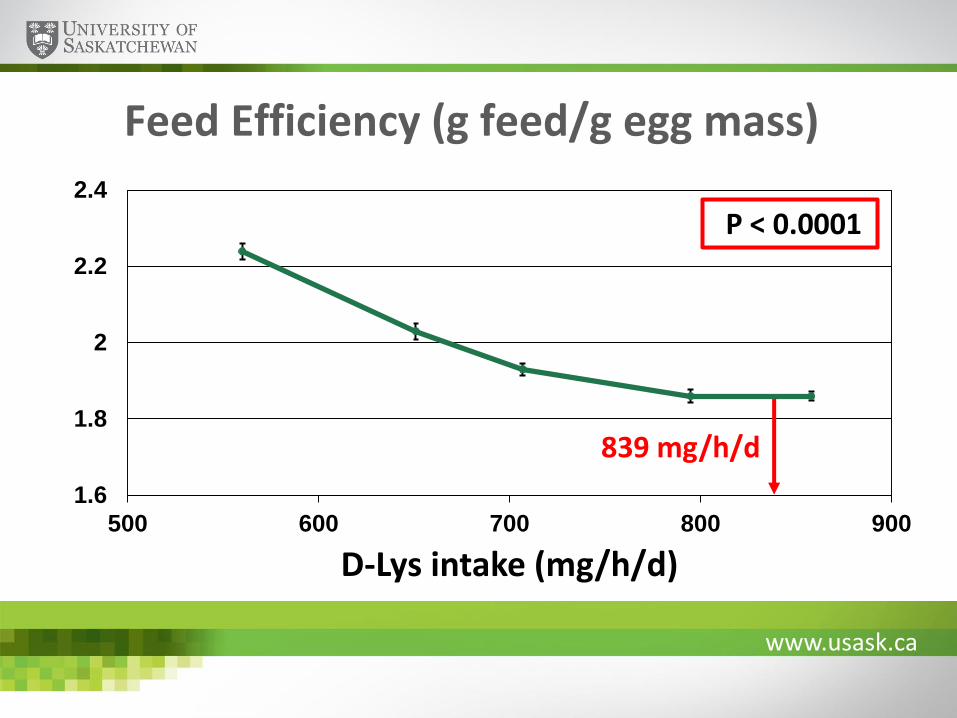
Feed Efficiency (g feed/g egg mass)
1.6
1.8
2
2.2
2.4
500 600 700 800 900
D-Lys intake (mg/h/d)
P < 0.0001
839 mg/h/d
www.usask.ca
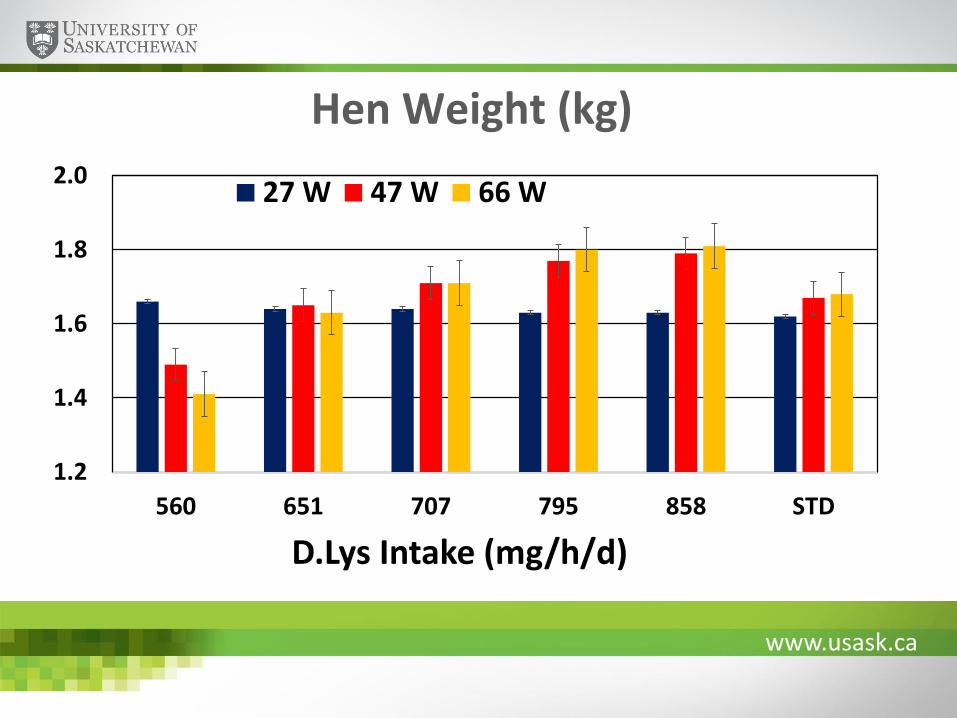
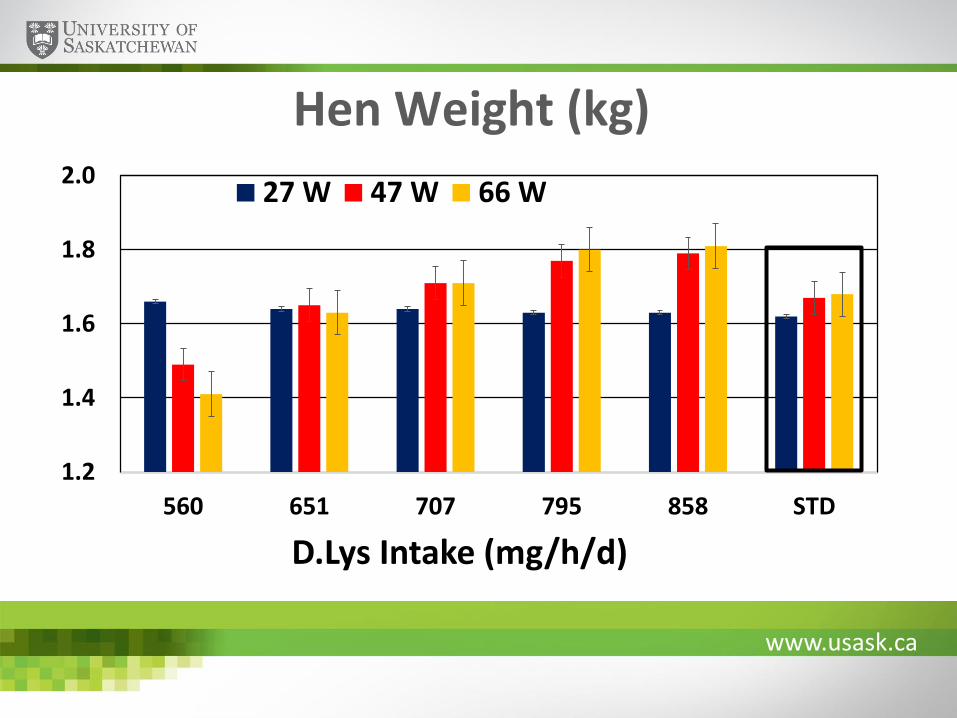
Hen Weight (kg)
1.2
1.4
1.6
1.8
2.0
560 651 707 795 858 STD
D.Lys Intake (mg/h/d)
27 W 47 W 66 W
www.usask.ca
Hen Weight (kg)
1.2
1.4
1.6
1.8
2.0
560 651 707 795 858 STD
D.Lys Intake (mg/h/d)
27 W 47 W 66 W
www.usask.ca
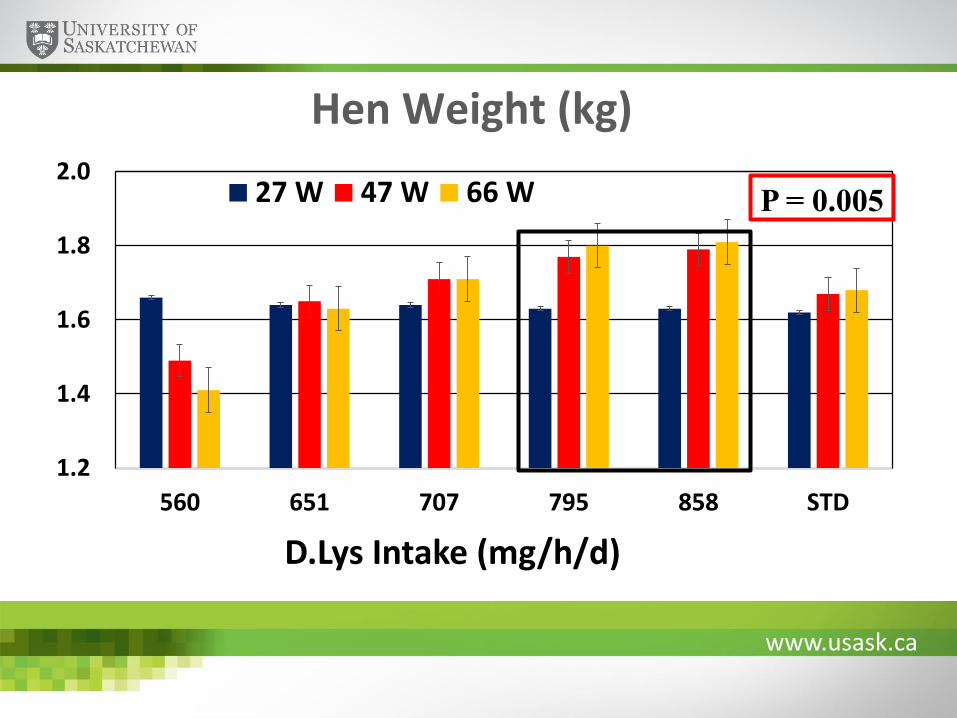
Hen Weight (kg)
1.2
1.4
1.6
1.8
2.0
560 651 707 795 858 STD
D.Lys Intake (mg/h/d)
27 W 47 W 66 W P = 0.005
www.usask.ca
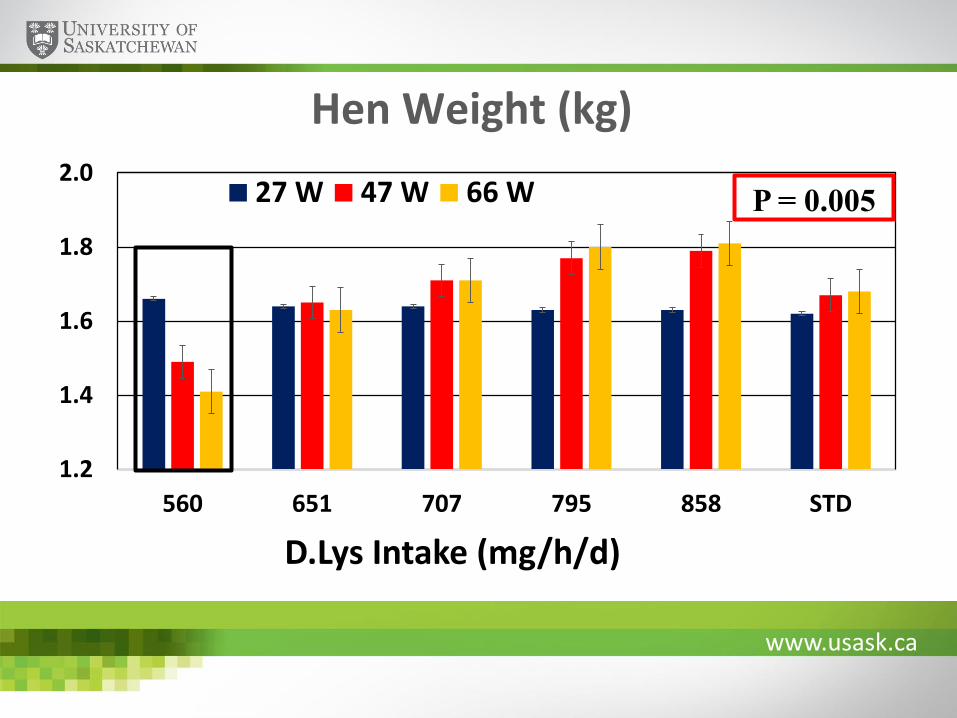
Hen Weight (kg)
1.2
1.4
1.6
1.8
2.0
560 651 707 795 858 STD
D.Lys Intake (mg/h/d)
27 W 47 W 66 W P = 0.005
www.usask.ca
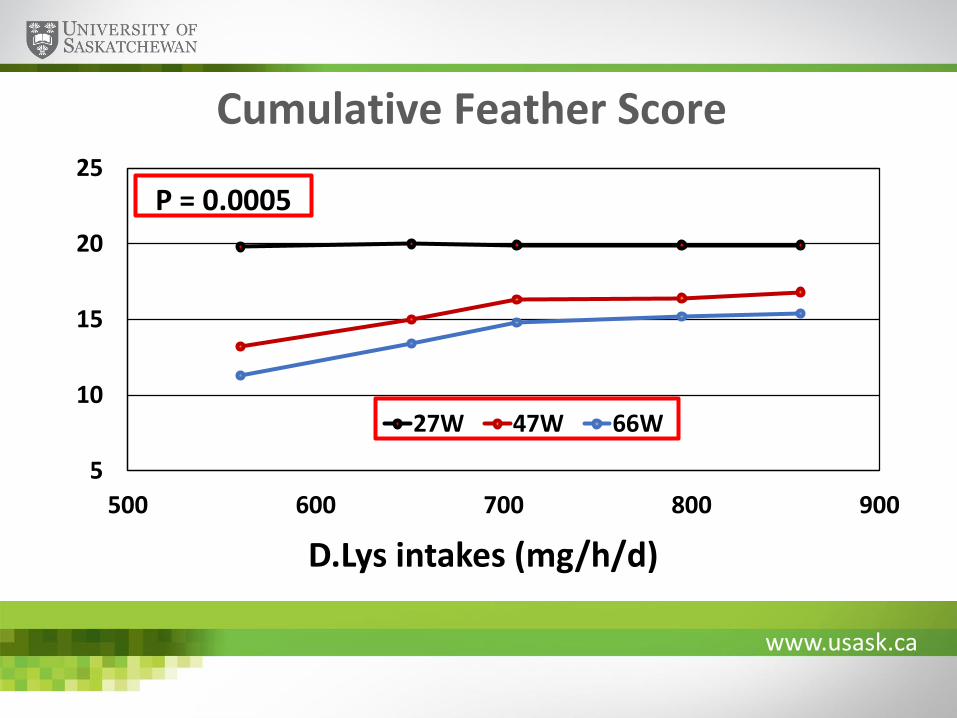
Cumulative Feather Score
5
10
15
20
25
500 600 700 800 900
D.Lys intakes (mg/h/d)
27W 47W 66W
P = 0.0005
www.usask.ca
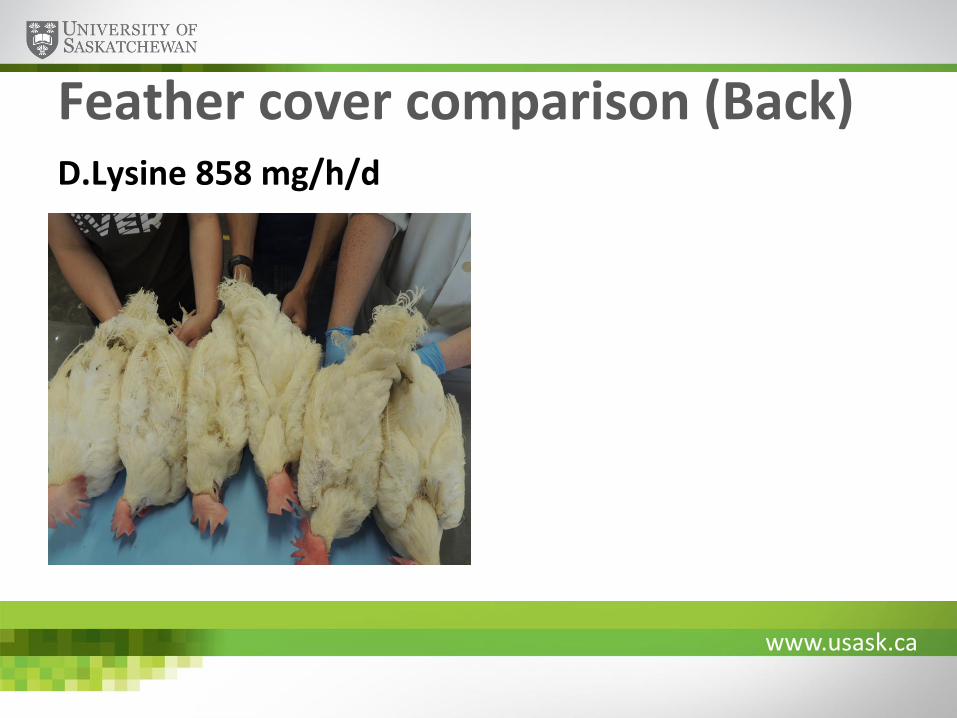
Feather cover comparison (Back)D.Lysine 858 mg/h/d
www.usask.ca
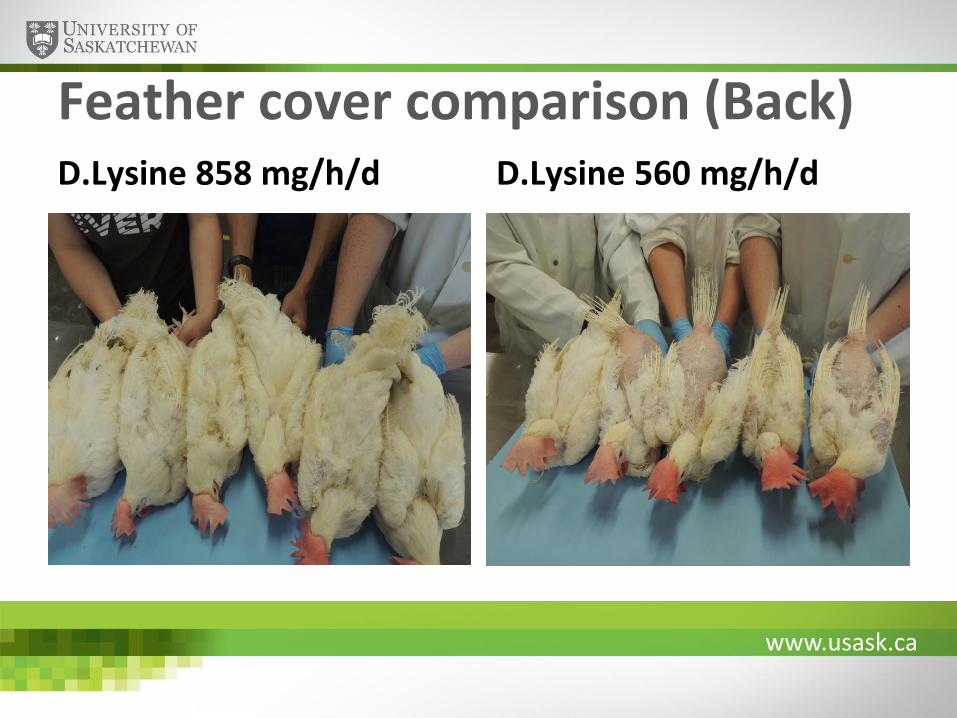
Feather cover comparison (Back)D.Lysine 858 mg/h/d D.Lysine 560 mg/h/d
www.usask.ca
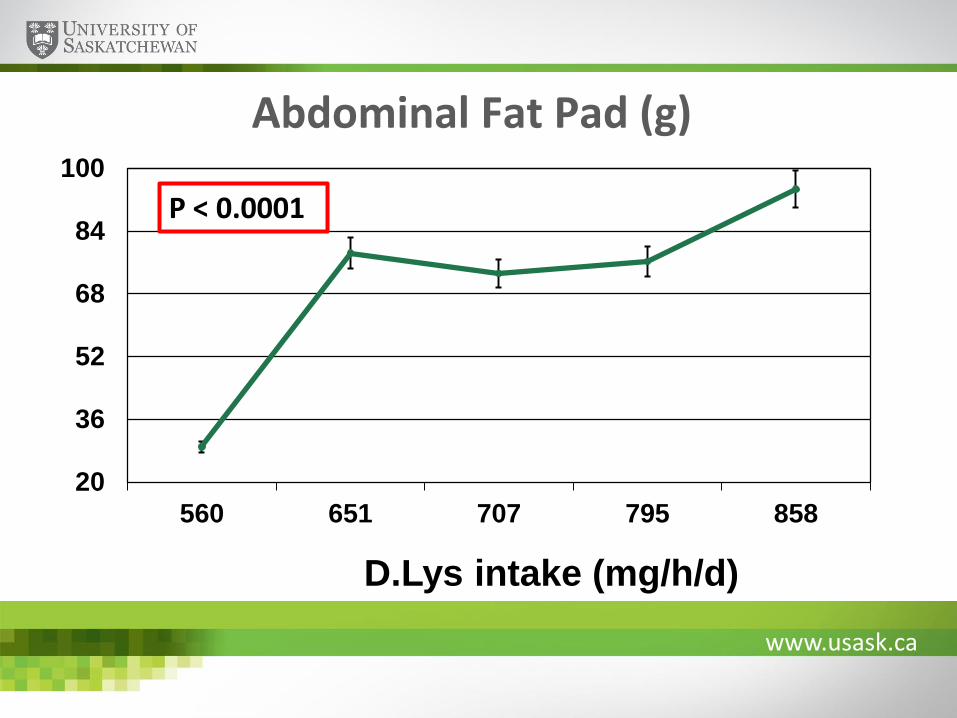
Abdominal Fat Pad (g)
20
36
52
68
84
100
560 651 707 795 858
D.Lys intake (mg/h/d)
P < 0.0001
www.usask.ca
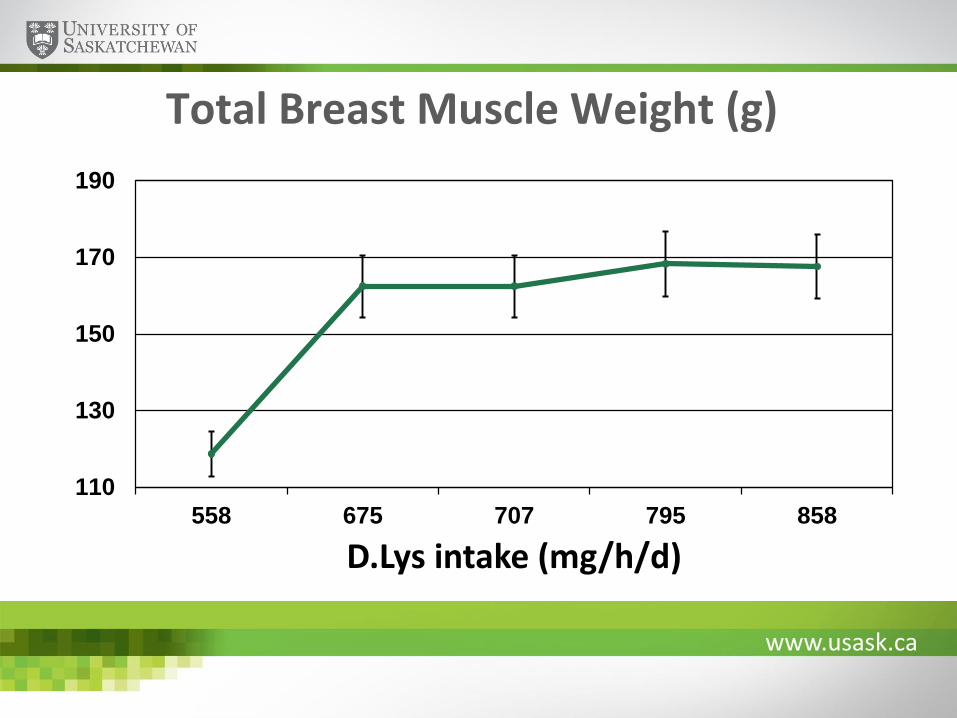
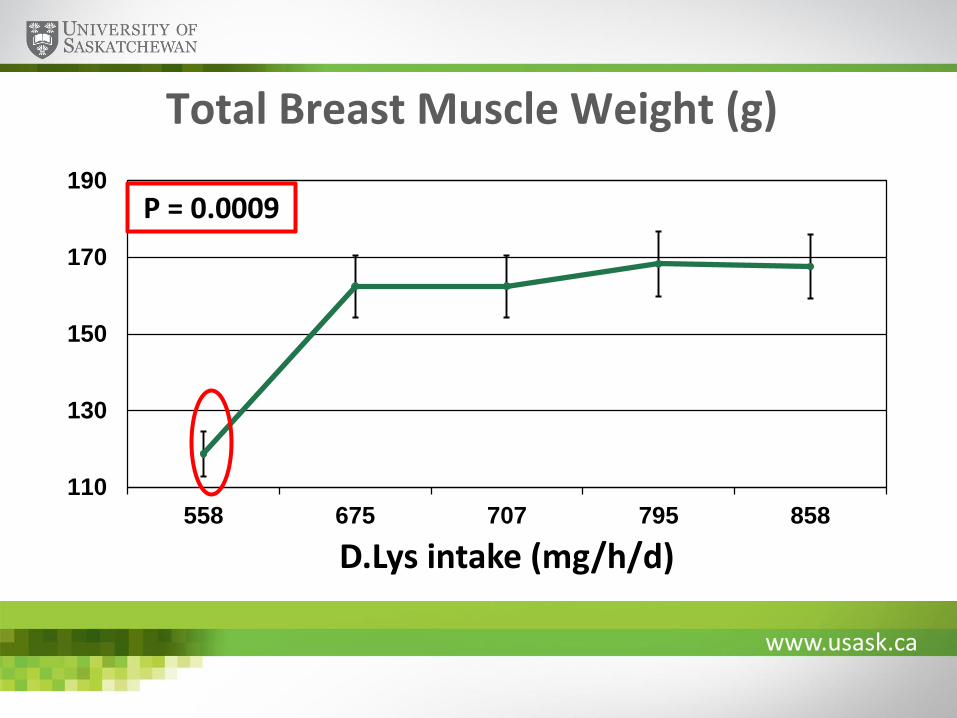
Total Breast Muscle Weight (g)
110
130
150
170
190
558 675 707 795 858
D.Lys intake (mg/h/d)
www.usask.ca
Total Breast Muscle Weight (g)
110
130
150
170
190
558 675 707 795 858
D.Lys intake (mg/h/d)
P = 0.0009
www.usask.ca
Effect on Other Internal Organ Weights
No significant effect on heart, liver and kidney weights
No significant effect on ovaries for:
• Ovary weight
• Number of ovarian follicles (yellow and white)
• Size of large yellow follicles
www.usask.ca
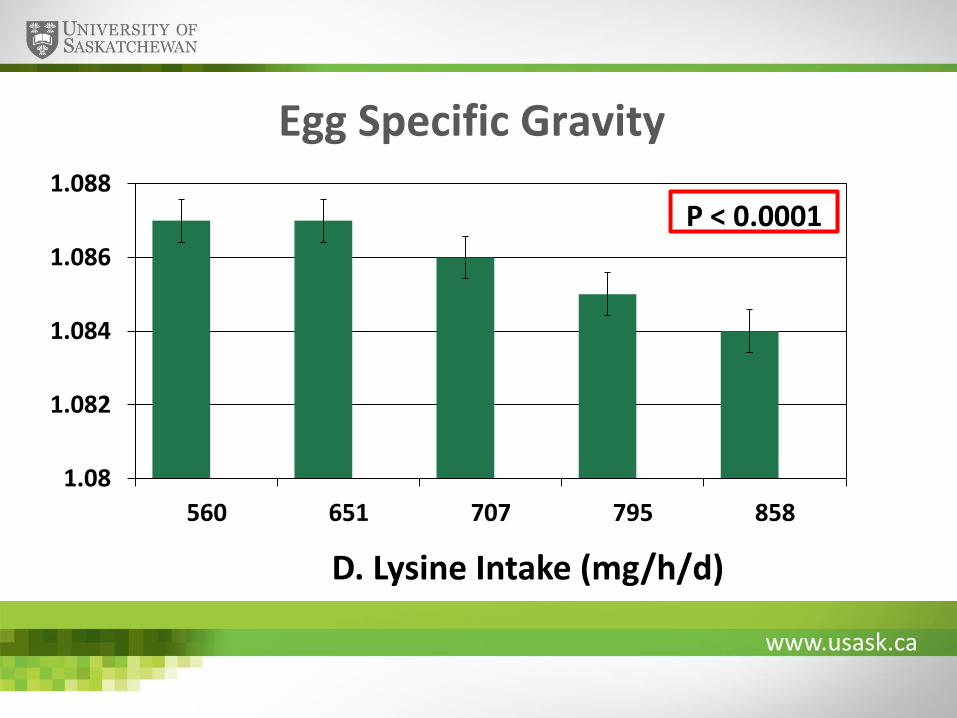
Egg Specific Gravity
1.08
1.082
1.084
1.086
1.088
560 651 707 795 858
D. Lysine Intake (mg/h/d)
P < 0.0001

www.usask.ca
Eggshell Weight (%)
9
9.5
10
10.5
560 651 707 795 858
D. Lysine Intake (mg/h/d)
P < 0.0001
www.usask.ca
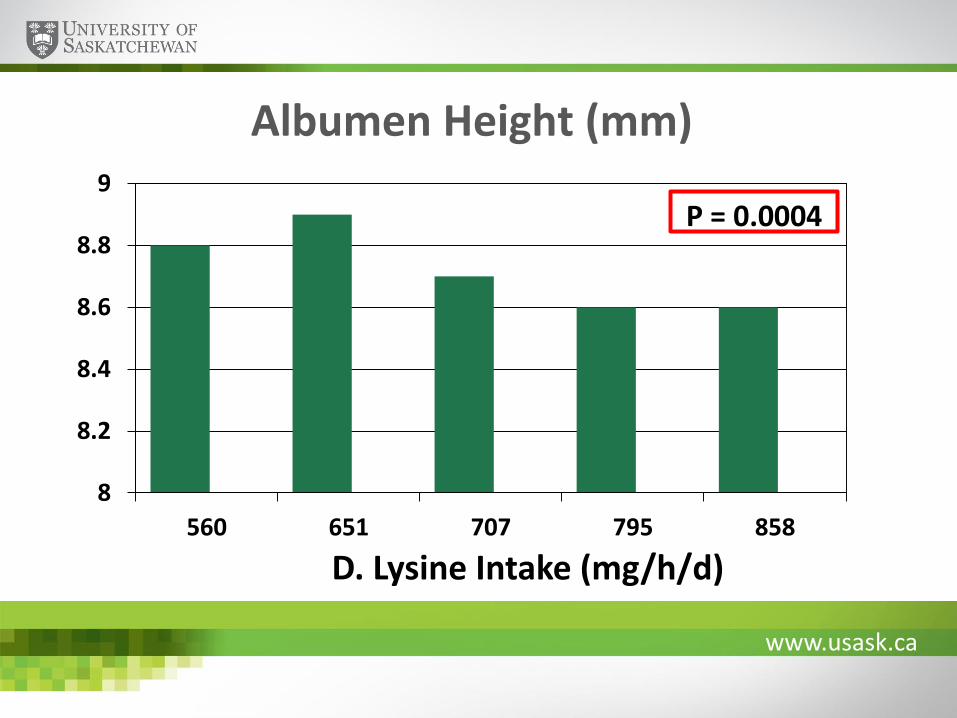
Albumen Height (mm)
8
8.2
8.4
8.6
8.8
9
560 651 707 795 858
D. Lysine Intake (mg/h/d)
P = 0.0004
www.usask.ca
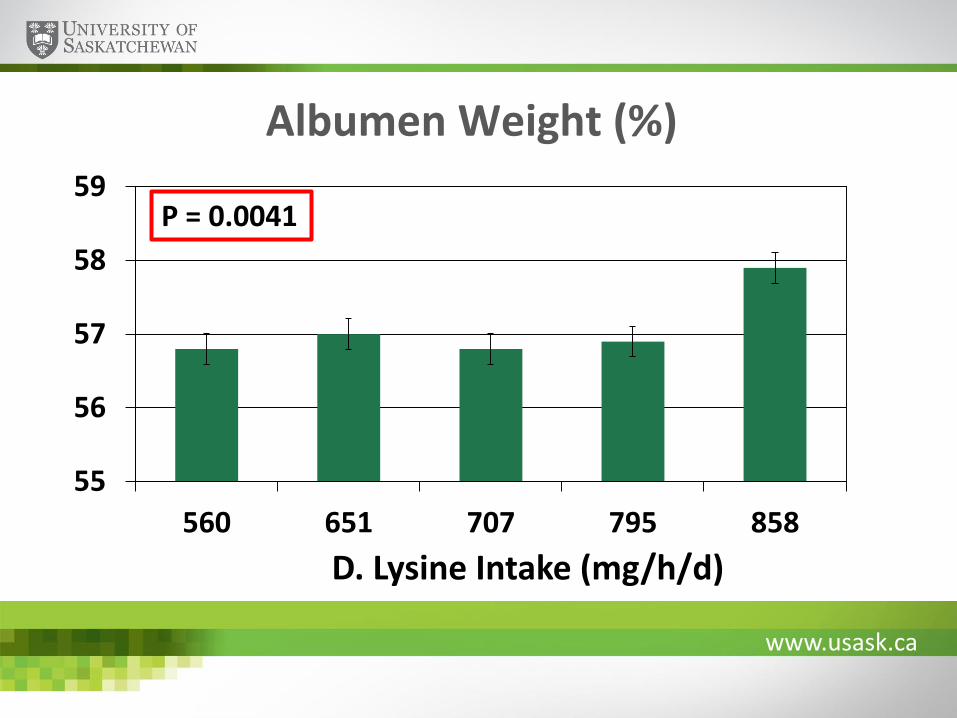
Albumen Weight (%)
55
56
57
58
59
560 651 707 795 858
D. Lysine Intake (mg/h/d)
P = 0.0041
www.usask.ca
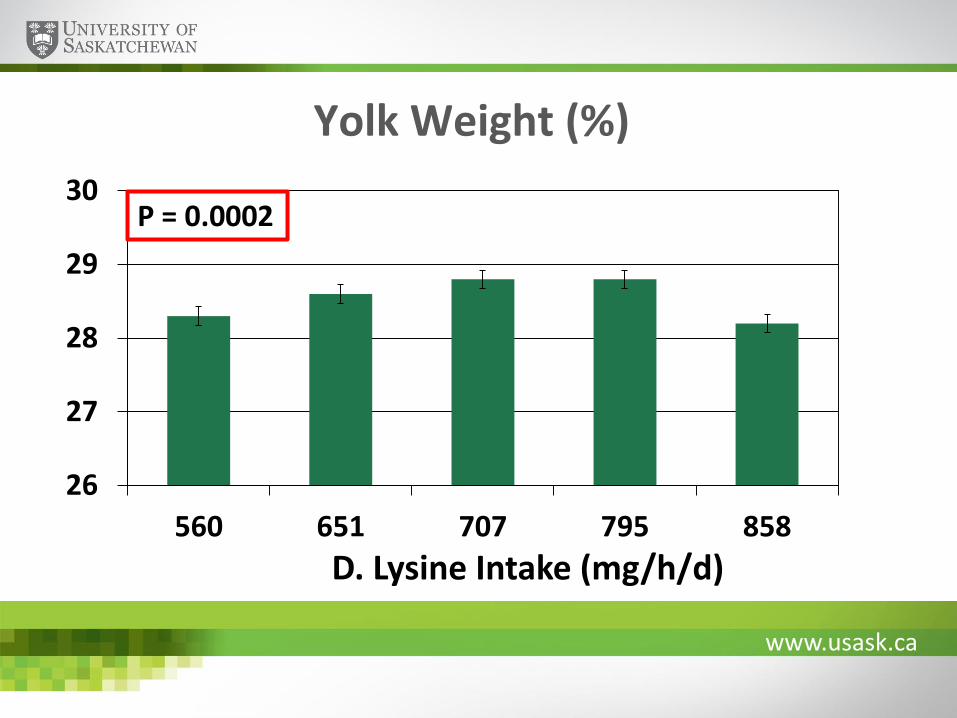
Yolk Weight (%)
26
27
28
29
30
560 651 707 795 858
D. Lysine Intake (mg/h/d)
P = 0.0002
www.usask.ca
Conclusions
Egg production, egg weight, egg mass and feed efficiency improved quadratically
Hen weight and feather scores improved
Proportion of internal egg components increased but eggshell proportion decreased
D-Lys required for a maximum response varies with response criteria
www.usask.ca
Research implications
Data will provide egg and feed industries with an improved ability to reach production goals
Data may also be used for nutritional information on hen welfare characteristics (feathering and body composition)
www.usask.ca
NSERC Industrial Research Chair in Poultry Nutrition
www.usask.ca
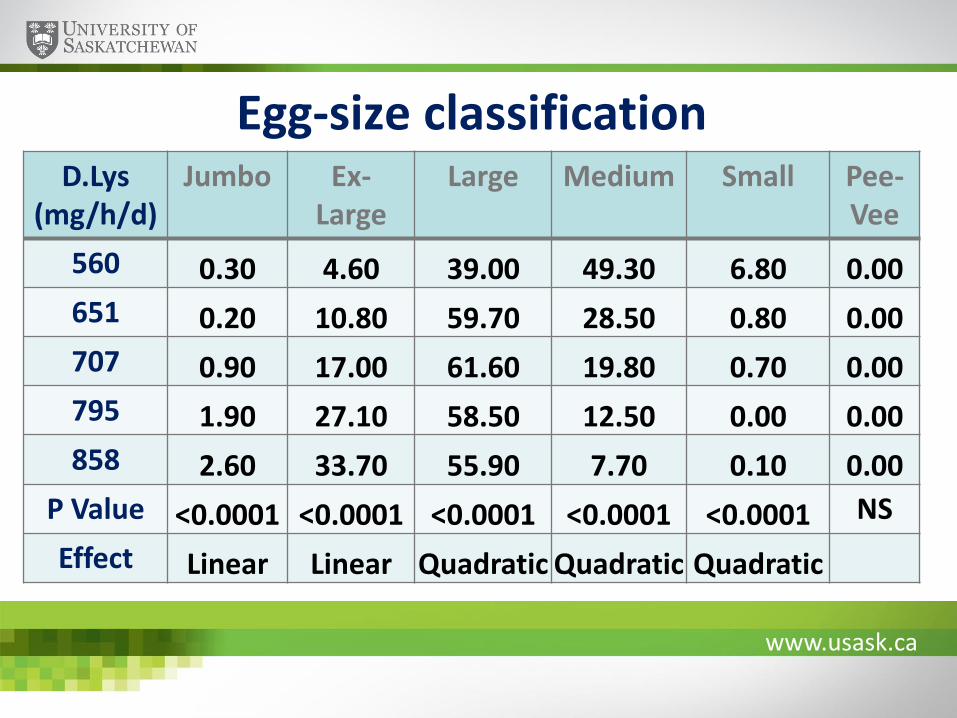
Egg-size classificationD.Lys
(mg/h/d)Jumbo Ex-
LargeLarge Medium Small Pee-
Vee
560 0.30 4.60 39.00 49.30 6.80 0.00
651 0.20 10.80 59.70 28.50 0.80 0.00
707 0.90 17.00 61.60 19.80 0.70 0.00
795 1.90 27.10 58.50 12.50 0.00 0.00
858 2.60 33.70 55.90 7.70 0.10 0.00
P Value <0.0001 <0.0001 <0.0001 <0.0001 <0.0001 NS
Effect Linear Linear Quadratic Quadratic Quadratic
www.usask.ca
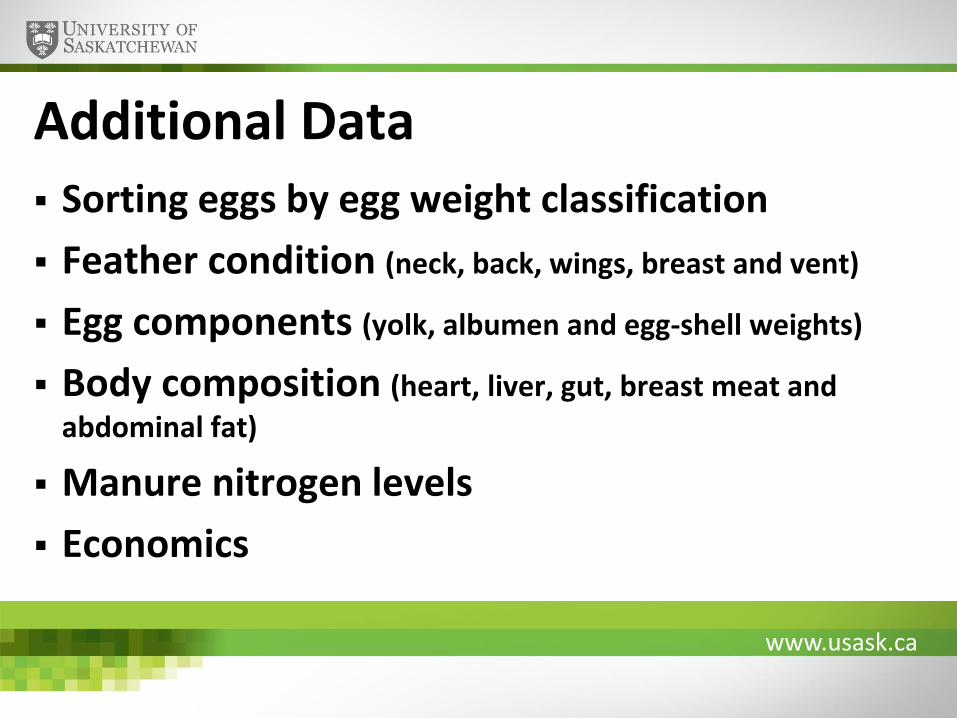
Additional Data Sorting eggs by egg weight classification
Feather condition (neck, back, wings, breast and vent)
Egg components (yolk, albumen and egg-shell weights)
Body composition (heart, liver, gut, breast meat and
abdominal fat)
Manure nitrogen levels
Economics
www.usask.ca
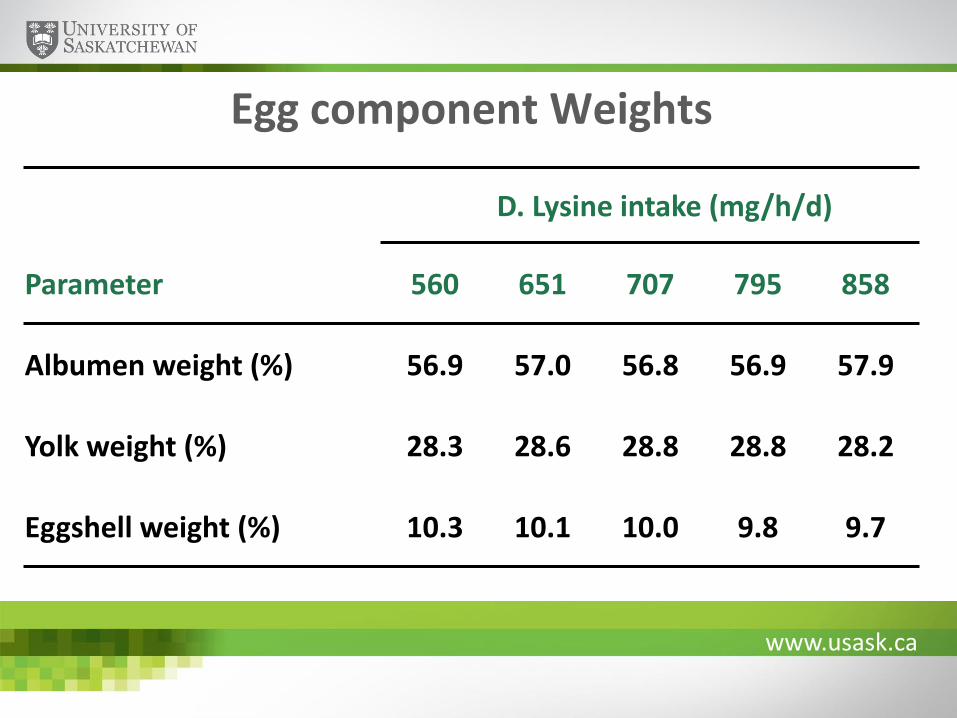
Egg component Weights
D. Lysine intake (mg/h/d)
Parameter 560 651 707 795 858
Albumen weight (%) 56.9 57.0 56.8 56.9 57.9
Yolk weight (%) 28.3 28.6 28.8 28.8 28.2
Eggshell weight (%) 10.3 10.1 10.0 9.8 9.7
www.usask.ca
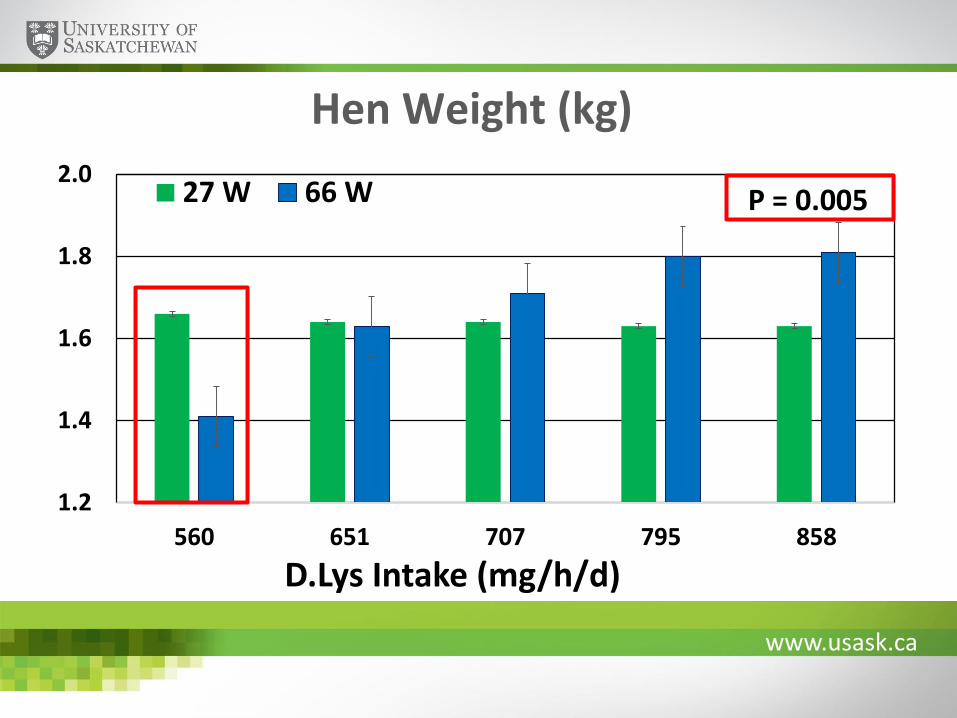
Hen Weight (kg)
1.2
1.4
1.6
1.8
2.0
560 651 707 795 858
D.Lys Intake (mg/h/d)
27 W 66 W P = 0.005
www.usask.ca
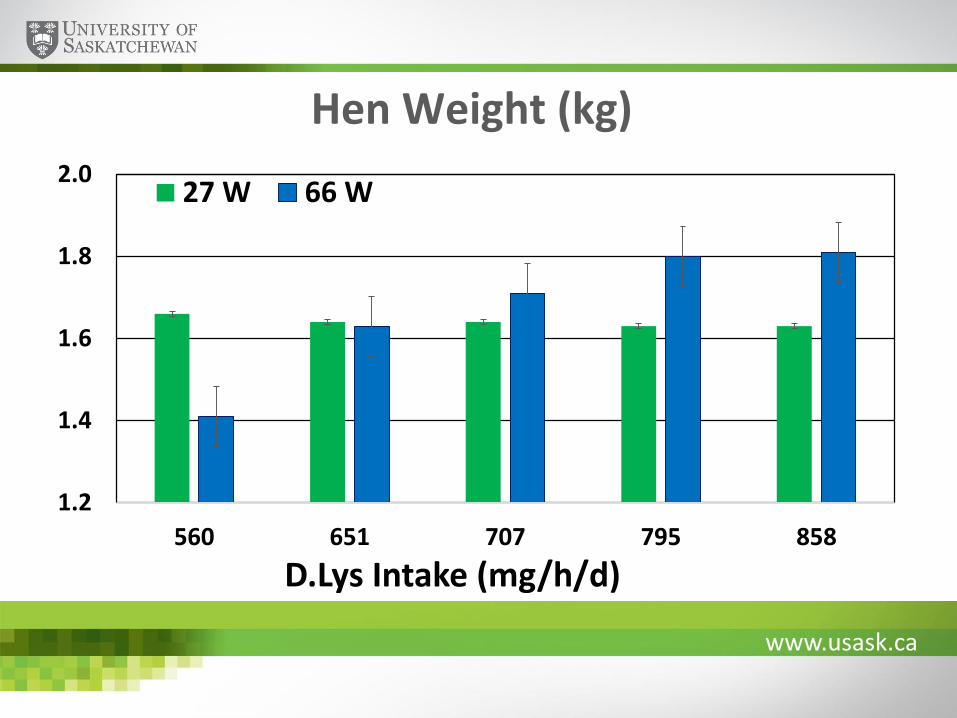
Hen Weight (kg)
1.2
1.4
1.6
1.8
2.0
560 651 707 795 858
D.Lys Intake (mg/h/d)
27 W 66 W