Embed Size (px)
Citation preview
September 30, 2019 1
IDEA RESEARCH APL Apollo Tubes – The Pipe(d) Piper
Rating BUY
Price Rs 1375
Target Price Rs 1792
Implied Upside 30.3%
Sensex 38,822
Nifty 11,512
Bloomberg Code APAT:IN
Reuters Code APLA.NS
(Prices as on September 27, 2019)
Tracking Data
Market Cap (Rs bn) 33.4
Shares O/s (m) 24.3
3M Avg. Daily Value (Rs m) 86.0
Major Shareholders
Promoters 37.1%
Domestic Inst. 12.6%
Public & Others 50.3%
Stock Performance
(%) 1M 6M 12M
Absolute 4.2 (5.3) 1.7
Relative 0.0 (6.4) (3.7)
How we differ from Consensus
EPS (Rs) PL Cons. % Diff.
2020E 106.7 95.6 11.6
2021E 149.3 130.6 14.3
Company Initiation
Monday, September 30, 2019
Shailee Parekh
+91-22-66322302
Heet Vora
+91-22-66322274
APL Apollo Tubes (APAT) is the largest producer of Electric Resistance Welded
(ERW) Steel Pipes and Sections in India with a manufacturing capacity of 2.55 mn
MTPA. With pan India manufacturing capacities and extensive distribution
network, they are able to cater to customers effectively and efficiently (95% of
the revenues come from the dealer-distributor network). APAT has always been a
pioneer in new technologies & innovative products which has helped it grow
faster than its peers. They also invest continuously in enhancing brand awareness
and develop the brand which in turn is creating entry barriers for new entrants.
Demand for ERW pipes is expected to grow at 8-10% CAGR on back of 1)
substitution of wood by steel, 2) government push to boost consumption,
infrastructure development, construction & agriculture, 3) shift of market share
from unorganized to organised players and 4) development of new age
applications such as agricultural implements, solar tracking systems, gym/sports
equipments, construction equipment and automobile applications.
Coupled with enhanced capacities through in house expansion and acquisitions of
Shankara and Apollo Tricoat plants, we expect volumes to grow at 2 – year CAGR
of 19%. These acquisitions will help will help it to move up the value chain in
existing high margin pre-galvanised (GP) and galvanised (GI) pipes segments and
also foray into new, value added segments such as doors & designer pipes which
will result in per ton EBITDA to improve from Rs 3,245- FY19 to Rs 3,500-FY21E.
Over the next 2 years, 1) we expect earnings CAGR of 56.3%, 2) comfortable
debt-equity ratio of 0.3x, 3) robust RoE/RoCE of 26.9%/32.7% and 4) high free
cash generation of Rs2,638m which not only makes it attractively valued at PER
of 12.9x FY20E and 9.2x FY21E earnings but also justifies a premium valuation. We
initiate coverage with a BUY and TP of Rs 1792 (12x FY21E EPS).
Key financials (Y/e March) 2018 2019 2020E 2021E
Revenues (Rs m) 53,348 71,523 83,574 100,124
Growth (%) 17.4 34.1 16.8 19.8
EBITDA (Rs m) 3,710 3,928 5,257 6,648
PAT (Rs m) 1,581 1,482 2,587 3,621
EPS (Rs) 66.3 62.2 106.7 149.3
Growth (%) 8.4 (6.2) 71.7 39.9
CEPS (Rs) 88.7 89.1 142.7 186.7
Net DPS (Rs) 12.0 14.0 13.8 13.8
Profitability & Valuation 2018 2019 2020E 2021E
EBITDA margin (%) 7.0 5.5 6.3 6.6
RoE (%) 20.5 16.5 24.1 26.9
RoCE (%) 32.5 27.7 30.4 32.7
EV / sales (x) 0.7 0.6 0.5 0.4
EV / EBITDA (x) 10.6 10.4 7.5 5.7
PE (x) 20.7 22.1 12.9 9.2
P / BV (x) 3.9 3.4 2.8 2.2
Net dividend yield (%) 0.9 1.0 1.0 1.0
Source: Company Data, PL Research
September 30, 2019 2
APL Apollo Tubes
IDEA RESEARCH
Investment Highlights
ERW pipes – growth through new age applications
The domestic markets size is 7.4mn TPA and valued at Rs 400bn. It is expected to grow
at 8-10% on back of increasing demand from infrastructure construction, automobile
and refining sectors. Within ERW pipes, the segment witnessing the highest growth is
pre galvanised (GP) pipes primarily used in the coastal and hilly regions due to its non
corrosive properties and as a replacement of wood in roofing structures. Other
conventional areas of infrastructure development like metros and airports, building
construction (prefab structures) are also adding to the demand.
Further new age applications such as agricultural implements, solar tracking systems,
gym/sports equipments, construction equipment and automobile applications like truck
and bus body and heavy vehicle axles are the other drivers of growth.
APL is also tapping the building material space through developing products for fencing,
hand holding, railings, scaffolding, ducting, furniture, fire fighting, windows and door
frames. Also substitution of wood with ERW pipes in products like door and window
frames, tables, benches, railings etc is another factor driving growth.
Galvanised pipes (GI pipes) on the other hand are witnessing a slowdown as they are
being replaced by PVC pipes in traditional applications such as irrigation, plumbing and
agriculture. Black pipes are also gradually being replaced by structural pipes.
Pioneers in new technologies and creating process and cost efficiency
APAT has been a leader in adopting the latest technology from around the globe. It was
the first company to offer pre - galvanized and colour coated pipes and then the first to
bring Direct forming Technology (DFT) to India in 2016, which allows it to offer
customized products at lower cost with shorter lead times as unlike traditional
technology, where round pipes were formed first and then converted to square or
rectangular, DFT enables direct formation of hollow pipes of various size and shapes.
The technology will play a major role, given the fast growing construction and
infrastructure sectors in the country.
September 30, 2019 3
APL Apollo Tubes
IDEA RESEARCH
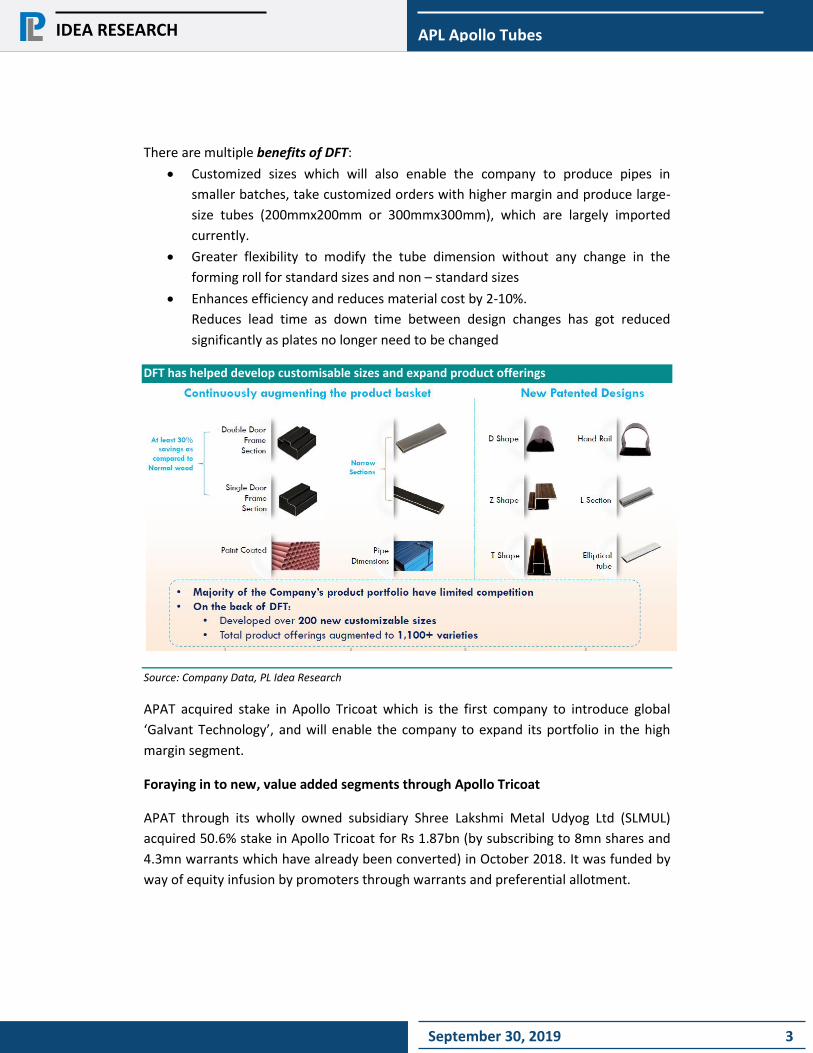
There are multiple benefits of DFT:
Customized sizes which will also enable the company to produce pipes in
smaller batches, take customized orders with higher margin and produce large-
size tubes (200mmx200mm or 300mmx300mm), which are largely imported
currently.
Greater flexibility to modify the tube dimension without any change in the
forming roll for standard sizes and non – standard sizes
Enhances efficiency and reduces material cost by 2-10%.
Reduces lead time as down time between design changes has got reduced
significantly as plates no longer need to be changed
DFT has helped develop customisable sizes and expand product offerings
Source: Company Data, PL Idea Research
APAT acquired stake in Apollo Tricoat which is the first company to introduce global
‘Galvant Technology’, and will enable the company to expand its portfolio in the high
margin segment.
Foraying in to new, value added segments through Apollo Tricoat
APAT through its wholly owned subsidiary Shree Lakshmi Metal Udyog Ltd (SLMUL)
acquired 50.6% stake in Apollo Tricoat for Rs 1.87bn (by subscribing to 8mn shares and
4.3mn warrants which have already been converted) in October 2018. It was funded by
way of equity infusion by promoters through warrants and preferential allotment.
September 30, 2019 4
APL Apollo Tubes
IDEA RESEARCH
Tricoat has a production capacity of ~2,50,000 MTPA which includes ~50,000 MTPA of
In-line Galvanised pipes (ILG), 100,000 MTPA of designer pipes, ~50,000 MTPA of Door
Frames and balance 50,000 MTPA of narrow sections. Per ton EBITDA on ILG and
designer pipes is ~Rs 6000-7000, while that on door frames and narrow sections is lower
at ~Rs 4000-5000.
During Q1FY20, this plant was operational for a period of 14 days and reported
revenues of Rs 117m and volumes of 10,000 MTPA which translates into realisations of
Rs 50,000/ton. The management has guided that Apollo Tricoat will fetch an EBITDA/ton
of Rs 7500 based on their product mix. Going forward, they will sell ~100,000 MTPA in
FY20E, 150,000 MTPA in FY21E and 200,000 MTPA in FY22E of Tricoat products.
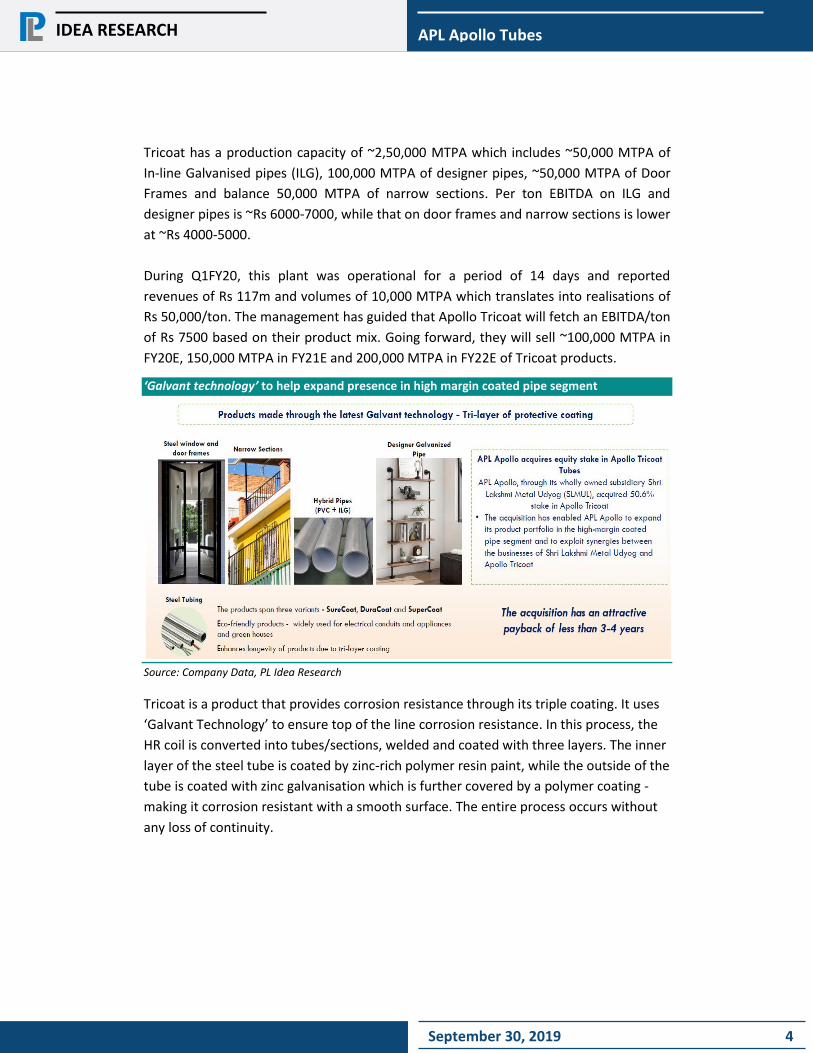
‘Galvant technology’ to help expand presence in high margin coated pipe segment
Source: Company Data, PL Idea Research
Tricoat is a product that provides corrosion resistance through its triple coating. It uses
‘Galvant Technology’ to ensure top of the line corrosion resistance. In this process, the
HR coil is converted into tubes/sections, welded and coated with three layers. The inner
layer of the steel tube is coated by zinc-rich polymer resin paint, while the outside of the
tube is coated with zinc galvanisation which is further covered by a polymer coating -
making it corrosion resistant with a smooth surface. The entire process occurs without
any loss of continuity.
September 30, 2019 5
APL Apollo Tubes
IDEA RESEARCH
Acquisition of Taurus to help garner market share in the South
APAT recently concluded the acquisition of a production unit located at Hyderabad
owned by Taurus Value Steel and Pipes (subsidiary of Shankara Building Products) in the
month of May for Rs 700m. Commercial production began in the month of June. The
acquisition has added production capacity of ~200,000 MTPA which includes black pipes
(45,000 MTPA), GI pipes (30,000 MTPA) and GP pipes (125,000 MTPA). The capacity is
currently operating at a monthly run rate of 10,000 tons and will gradually be ramped
up to a peak of 15,000 TPM over the next two years. GP and GI pipe capacities will be
operational by December-19.
The Raipur and Hosur plants are operating at peak utilisation and hence some of the
production will be shifted to this plant in to order to ease out the pressure. This will
result in cost savings on account of lower raw material cost as well as freight. Previously,
at Hosur they procured steel from JSW where as at Hyderabad, they will buy from Tata
Steel which will be cheaper by Rs 200-300/ton. There will also be freight cost saving of
Rs 700/ton. The total benefit of ~Rs 1000/ton will be passed on to the customer in
order to capture the market. At present there is no organised player in Hyderabad. Both
Vijaywada and Hyderabad are developing markets. While initially this plant is likely to
fetch EBITDA/ton of Rs 1600-1900/ton it can potentially go up to Rs 3,000/ton once
operating leverage flows in. Shankara will be buying ~150,000 tons in FY20 from APL.
The MoU states that they will buy 250,000 tons from APL in FY20.
Focus on cost management to help sustain margins
Pan – India presence of APAT has ensured proximity to the consuming markets,
optimised logistic costs. Management has said that being the market leader APAT enjoys
a discount of Rs 500-1,000 over its competitor in raw material procurement. APAT has
set up a cold-rolling mill in Uttar Pradesh with a capacity of almost 2 lakh MTPA for
enhancing the availability of low-thickness material (up to 1 mm). This will facilitate in
significant raw material cost-savings for the company. Increased usage of renewable
energy will reduce electricity and maintenance cost. On account of these cost saving
strategies the company has emerged as the lowest cost producer in India.
September 30, 2019 6
APL Apollo Tubes
IDEA RESEARCH
Entry barriers created through extensive distribution network and branding
Amongst its peers, APL Apollo is the only company which has a pan India dealer
distributor network of roughly 790 distributors, 27 warehouses and 50,000 retailers
ensuring proximity to its end customers and localizing supply thereby fast tracking its
growth. They contribute to ~92% of the business, balance being direct sales to OEMs.
APAT has introduced innovative incentive schemes for dealers such as multi-day
international Cruise. They also have tie ups with SBI, Axis, ICICI and HDFC Bank for
channel financing. Dealers get 45-60 days credit at competitive rates of interest.
A focused branding strategy has helped APAT to create awareness and visibility of its
brand. The company participates in trade expos, fabricator meetings and its brand
engagement programmes (rural brand van activation programmes) has helped in better
sales growth in tier II and III cities.
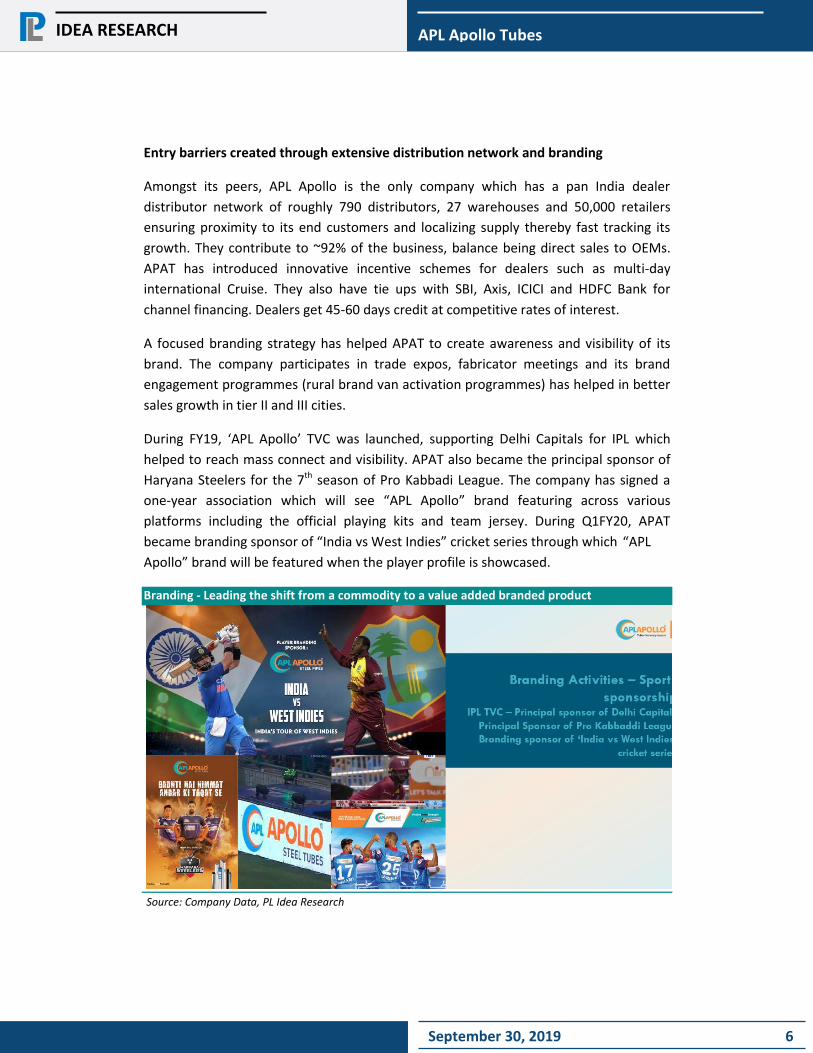
During FY19, ‘APL Apollo’ TVC was launched, supporting Delhi Capitals for IPL which
helped to reach mass connect and visibility. APAT also became the principal sponsor of
Haryana Steelers for the 7th season of Pro Kabbadi League. The company has signed a
one-year association which will see “APL Apollo” brand featuring across various
platforms including the official playing kits and team jersey. During Q1FY20, APAT
became branding sponsor of “India vs West Indies” cricket series through which “APL
Apollo” brand will be featured when the player profile is showcased.
Branding - Leading the shift from a commodity to a value added branded product
Source: Company Data, PL Idea Research
September 30, 2019 7
APL Apollo Tubes
IDEA RESEARCH
Better access to global markets and OEMs due to implementation of DFT
Previously, the company was exporting only galvanized pipes. Currently, there is a lot of
demand for square and rectangular sections particularly in Middle East and Europe. DFT
helps cater to this demand due to economies of scale, mainly reduction of roll-over
time, less storage space and production of pipes with greater accuracy in terms of
breadth and height. The new product manufactured using DFT has been well accepted
in Dubai, Abu Dhabi, and other parts of Middle East. Hence the company has set up its
first international warehouse in Dubai. It will help to serve customers more effectively
as well as strengthen brand awareness in global markets.
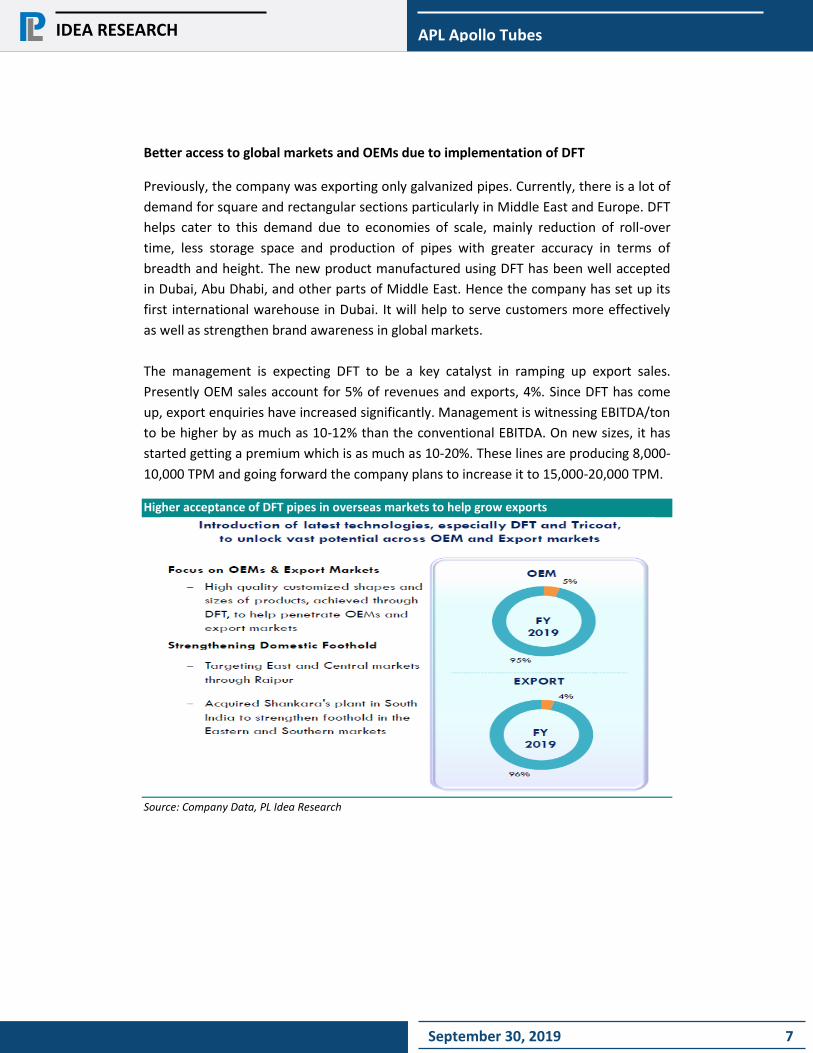
The management is expecting DFT to be a key catalyst in ramping up export sales.
Presently OEM sales account for 5% of revenues and exports, 4%. Since DFT has come
up, export enquiries have increased significantly. Management is witnessing EBITDA/ton
to be higher by as much as 10-12% than the conventional EBITDA. On new sizes, it has
started getting a premium which is as much as 10-20%. These lines are producing 8,000-
10,000 TPM and going forward the company plans to increase it to 15,000-20,000 TPM.
Higher acceptance of DFT pipes in overseas markets to help grow exports
Source: Company Data, PL Idea Research
September 30, 2019 8
APL Apollo Tubes
IDEA RESEARCH
Indian Steel Pipe Industry to grow at a healthy pace
The steel demand in India is expected to grow around 6-8% by FY21, of which, steel pipe
accounts for 10-12%. This proportion indicates the significant opportunity for steel pipe
consumption in the years to come.
Steel pipes have traditionally been used for transporting water, oil, other liquids and
gases. But today they have found application as hollow structures in other industries like
building materials, automobile and daily utility items such as umbrellas, chairs etc. Also,
replacement of wood by steel is driving demand. Further, strong Government impetus,
increasing purchasing power, improving lifestyle dynamics, among others, are likely to
catalyse the demand for steel pipe products from the infrastructure, construction and
building materials sectors, energy, engineering, automobile and agricultural segments.
India is the global manufacturing hub for steel pipes with a capacity of 8mn MTPA which
is expected to grow 10% annually for the next 5 years. APL Apollo is a leading player of
Steel Pipes and Tubes with a capacity of 2.55mn MTPA and market share of 18%.
Historically the company has grown faster than its peers due to its branded, pan India
presence through a strong distributor network, technological edge which helps it to
deliver superior products at cost effective rates.
Further room for organised players to grow
The ERW pipes industry is characterised by low operating margins hence logistics,
purchasing of raw materials at competitive prices, working capital management and
technological edge play an important role. Even now ~40% of the steel pipes industry is
controlled by the unorganized segment.
Organised players can purchase inputs in bulk quantities for ~Rs500-1000/ton cheaper
as compared to the unorganised players which can be passed on to the customer to gain
market share or retained by the company which will better margins or the savings can
be deployed for other purposes. The smaller unorganised players suffer from constant
stress in working capital due to non availability of credit for procurement of raw
materials. They are also unable to invest in brand building. The organised players on the
other hand face lower stress on working capital and are hence able to invest in brand
building exercises.
September 30, 2019 9
APL Apollo Tubes
IDEA RESEARCH
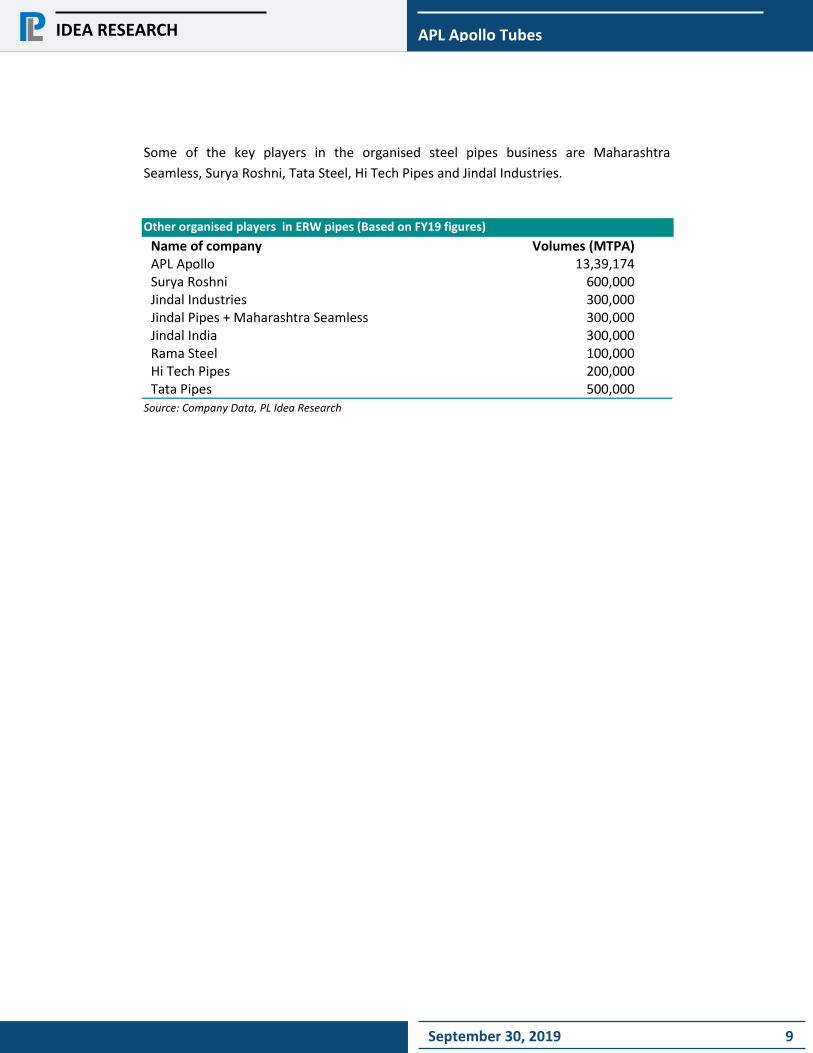
Some of the key players in the organised steel pipes business are Maharashtra
Seamless, Surya Roshni, Tata Steel, Hi Tech Pipes and Jindal Industries.
Other organised players in ERW pipes (Based on FY19 figures)
Name of company Volumes (MTPA) APL Apollo 13,39,174 Surya Roshni 600,000 Jindal Industries 300,000 Jindal Pipes + Maharashtra Seamless 300,000 Jindal India 300,000 Rama Steel 100,000 Hi Tech Pipes 200,000 Tata Pipes 500,000
Source: Company Data, PL Idea Research
September 30, 2019 10
APL Apollo Tubes
IDEA RESEARCH
Key Risks
Economic downturn to effect infrastructure spending
An economic downturn, if any, will have a direct bearing on capital allocation for future
projects and release of funds for on-going project, any drop in key economic ratios
curtails the demand for key infrastructure items pipes and also stretches the gap
between demand and supply.
Volatility in steel prices
Since APAT is largely a converter, the focus is on EBITDA/ton. Any increase or decrease
in steel prices is passed on to the customer but with a lag of a month. However, as it
procures these raw materials from few suppliers, any disruption in supply of raw
materials or unfavourable procurement terms could adversely affect the company.
During Q1FY20 steel prices dropped Rs 1,500/ton resulting in an inventory loss of Rs
230m and the management expects a further fall of Rs 2000-2500/ton in Q2FY20.
The availability and cost of the required grade of raw material (iron, ore, coal & gas) are
affected by the movement and parity of landed cost, price, freight and demand-supply
gap and tariff and exchange rates. Any increase/decrease in price is directly passed on
to the consumers.
India is expected to add about 15m TPA HR products capacity in the next 12-18 months
and Bhushan Steel and Essar issues are expected to be evened out. Hence, the raw
material supply is expected to become more stable which could help reduce the volatility
in steel prices.
Dependence on Dealers and Distributors
Significant proportion of the sale is done through Dealers and Distributors. The business
growth depends on the ability to attract additional dealerships/ distributorships to the
network. Inability to maintain network may result in loss of market share.
September 30, 2019 11
APL Apollo Tubes
IDEA RESEARCH
Financial Overview & Valuations
Strong revenue growth led by capacity expansion
Over the last two years, capacities have been doubles from 1.3mn MTPA to 2.55mn
MTPA through a series of organic and inorganic expansions. No further capex (other
than maintenance capex) is planned in the immediate future or until existing capacities
achieve optimal utilisation. APAT grew volumes 29% YoY in Q1FY20 and is expecting to
sustain 18-20% volume growth going ahead. We expect volumes to grow by 18.9% in
FY20E and 19.3% in FY21E. Revenues/EBITDA/PAT are expected to grow at CAGR
18.3%/30.1%/56.3% over the same period to Rs 100,124mn/Rs 6,648mn/Rs 3,621mn.
Richer product mix to aid margin expansion
The management is of the view that EBITDAM and PATM will improve over the next 2-3
years as the company is currently focusing on volume growth, which will result in better
fixed cost absorption. Also, implementation of DFT will result in cost savings as well as
higher margins due to product customization.
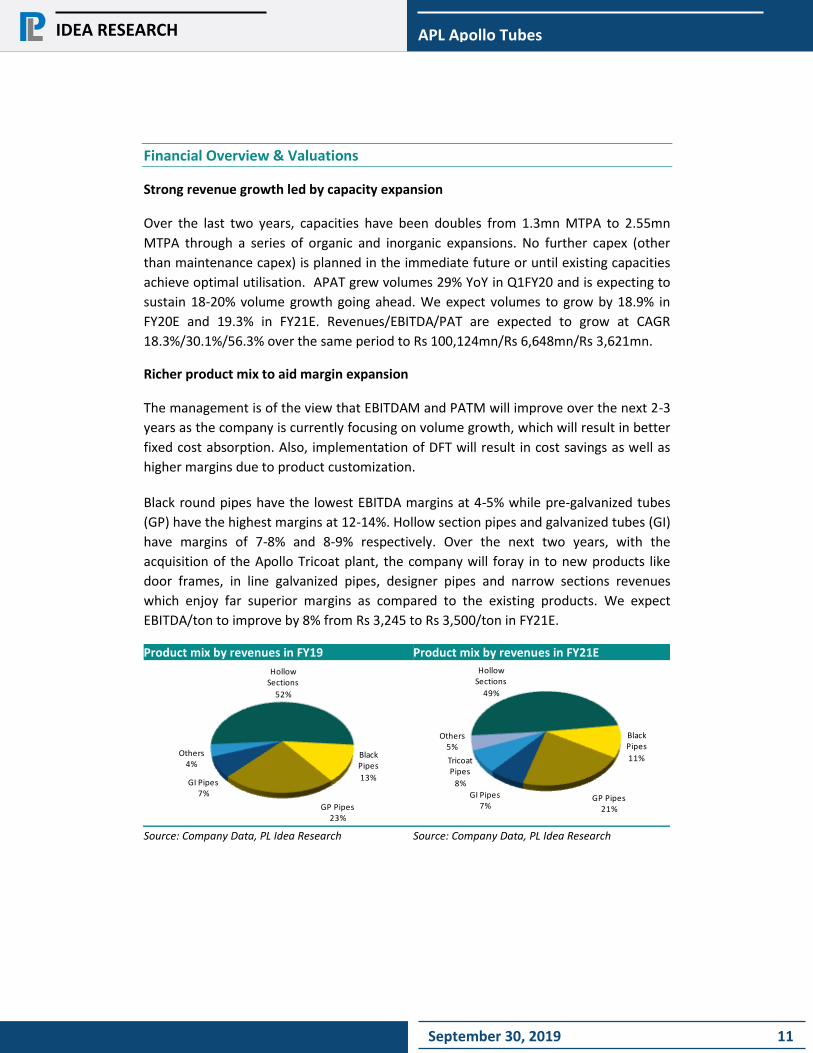
Black round pipes have the lowest EBITDA margins at 4-5% while pre-galvanized tubes
(GP) have the highest margins at 12-14%. Hollow section pipes and galvanized tubes (GI)
have margins of 7-8% and 8-9% respectively. Over the next two years, with the
acquisition of the Apollo Tricoat plant, the company will foray in to new products like
door frames, in line galvanized pipes, designer pipes and narrow sections revenues
which enjoy far superior margins as compared to the existing products. We expect
EBITDA/ton to improve by 8% from Rs 3,245 to Rs 3,500/ton in FY21E.
Product mix by revenues in FY19
Source: Company Data, PL Idea Research
Product mix by revenues in FY21E
Source: Company Data, PL Idea Research
Hollow Sections
52%
Black Pipes
13%
GP Pipes23%
GI Pipes7%
Others4%
Hollow Sections
49%
Black Pipes
11%
GP Pipes21%
GI Pipes7%
Tricoat Pipes
8%
Others5%
September 30, 2019 12
APL Apollo Tubes
IDEA RESEARCH
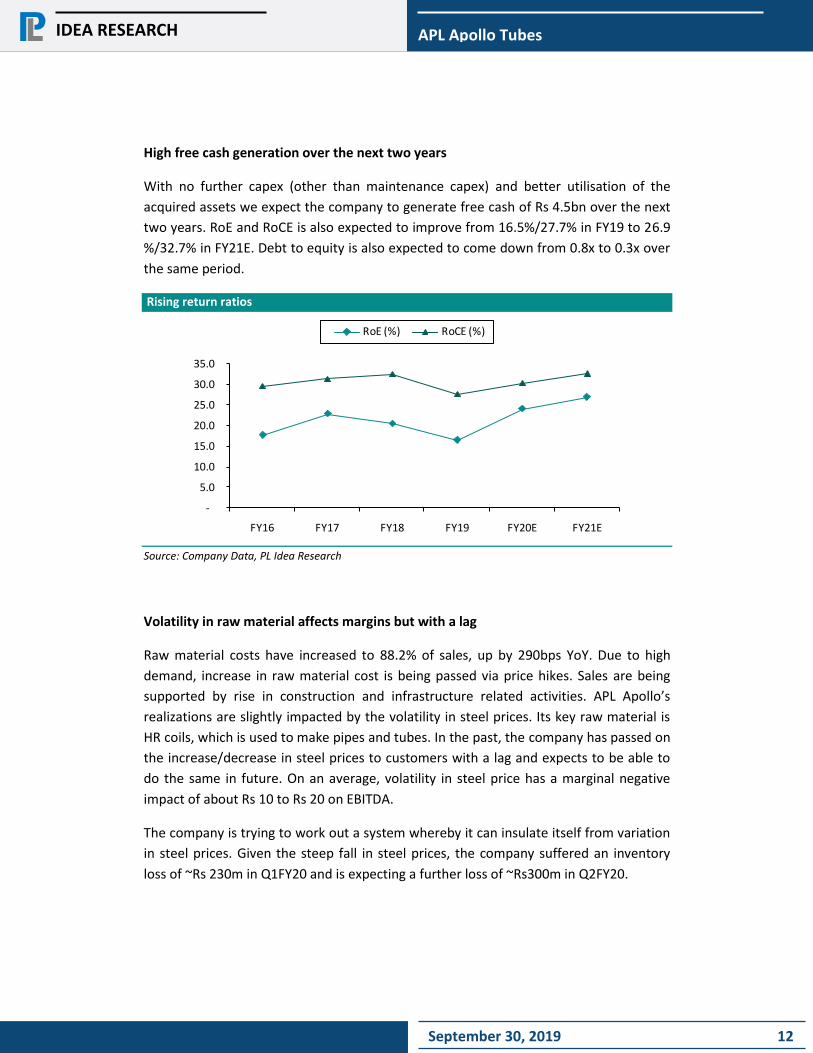
High free cash generation over the next two years
With no further capex (other than maintenance capex) and better utilisation of the
acquired assets we expect the company to generate free cash of Rs 4.5bn over the next
two years. RoE and RoCE is also expected to improve from 16.5%/27.7% in FY19 to 26.9
%/32.7% in FY21E. Debt to equity is also expected to come down from 0.8x to 0.3x over
the same period.
Rising return ratios
-
5.0
10.0
15.0
20.0
25.0
30.0
35.0
FY16 FY17 FY18 FY19 FY20E FY21E
RoE (%) RoCE (%)
Source: Company Data, PL Idea Research
Volatility in raw material affects margins but with a lag
Raw material costs have increased to 88.2% of sales, up by 290bps YoY. Due to high
demand, increase in raw material cost is being passed via price hikes. Sales are being
supported by rise in construction and infrastructure related activities. APL Apollo’s
realizations are slightly impacted by the volatility in steel prices. Its key raw material is
HR coils, which is used to make pipes and tubes. In the past, the company has passed on
the increase/decrease in steel prices to customers with a lag and expects to be able to
do the same in future. On an average, volatility in steel price has a marginal negative
impact of about Rs 10 to Rs 20 on EBITDA.
The company is trying to work out a system whereby it can insulate itself from variation
in steel prices. Given the steep fall in steel prices, the company suffered an inventory
loss of ~Rs 230m in Q1FY20 and is expecting a further loss of ~Rs300m in Q2FY20.
September 30, 2019 13
APL Apollo Tubes
IDEA RESEARCH
Valuations
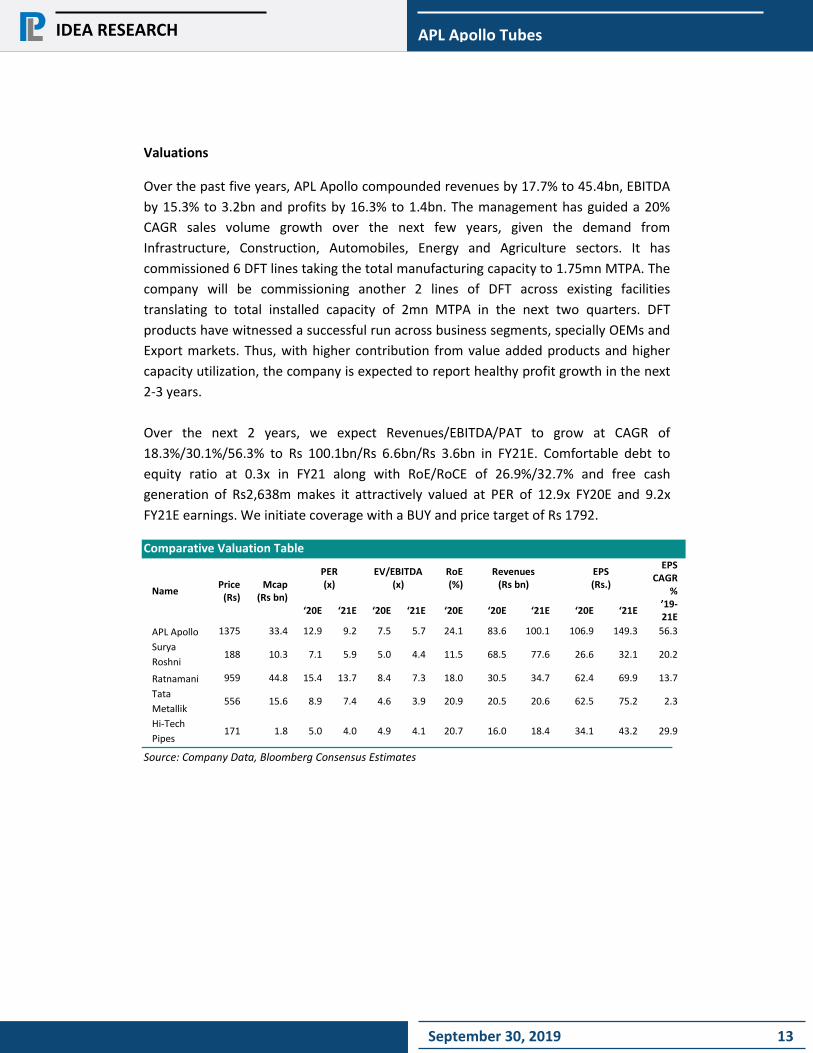
Over the past five years, APL Apollo compounded revenues by 17.7% to 45.4bn, EBITDA
by 15.3% to 3.2bn and profits by 16.3% to 1.4bn. The management has guided a 20%
CAGR sales volume growth over the next few years, given the demand from
Infrastructure, Construction, Automobiles, Energy and Agriculture sectors. It has
commissioned 6 DFT lines taking the total manufacturing capacity to 1.75mn MTPA. The
company will be commissioning another 2 lines of DFT across existing facilities
translating to total installed capacity of 2mn MTPA in the next two quarters. DFT
products have witnessed a successful run across business segments, specially OEMs and
Export markets. Thus, with higher contribution from value added products and higher
capacity utilization, the company is expected to report healthy profit growth in the next
2-3 years.
Over the next 2 years, we expect Revenues/EBITDA/PAT to grow at CAGR of
18.3%/30.1%/56.3% to Rs 100.1bn/Rs 6.6bn/Rs 3.6bn in FY21E. Comfortable debt to
equity ratio at 0.3x in FY21 along with RoE/RoCE of 26.9%/32.7% and free cash
generation of Rs2,638m makes it attractively valued at PER of 12.9x FY20E and 9.2x
FY21E earnings. We initiate coverage with a BUY and price target of Rs 1792.
Comparative Valuation Table
Name Price
(Rs) Mcap
(Rs bn)
PER (x)
EV/EBITDA (x)
RoE (%)
Revenues (Rs bn)
EPS (Rs.)
EPS CAGR
%
‘20E ‘21E ‘20E ‘21E ‘20E ‘20E ‘21E ‘20E ‘21E ’19-21E
APL Apollo 1375 33.4 12.9 9.2 7.5 5.7 24.1 83.6 100.1 106.9 149.3 56.3
Surya
Roshni 188 10.3 7.1 5.9 5.0 4.4 11.5 68.5 77.6 26.6 32.1 20.2
Ratnamani 959 44.8 15.4 13.7 8.4 7.3 18.0 30.5 34.7 62.4 69.9 13.7
Tata
Metallik 556 15.6 8.9 7.4 4.6 3.9 20.9 20.5 20.6 62.5 75.2 2.3
Hi-Tech
Pipes 171 1.8 5.0 4.0 4.9 4.1 20.7 16.0 18.4 34.1 43.2 29.9
Source: Company Data, Bloomberg Consensus Estimates
September 30, 2019 14
APL Apollo Tubes
IDEA RESEARCH
Company and Management Background
APL Apollo tubes (APAT) is the leading manufacturer of ERW steel pipes with a current
capacity of 2.55 m MTPA after the acquisition of a production unit which belonged to
(subsidiary of) Shankara Building. APAT has emerged as a ‘one-stop shop’ for a large
spectrum of steel tubes catering to an array of industry applications such as urban
infrastructures, housing, irrigation, solar plants, greenhouses, engineering and
agricultural appliances. It has more than 790 dealers, 27 warehouses and 50,000
retailers located across the breadth and width of the country. 95% of the revenues are
from distributors, balance 5% through OEMs. Exports accounts for barely 4% of
revenues but is likely to be a thrust area going forward.
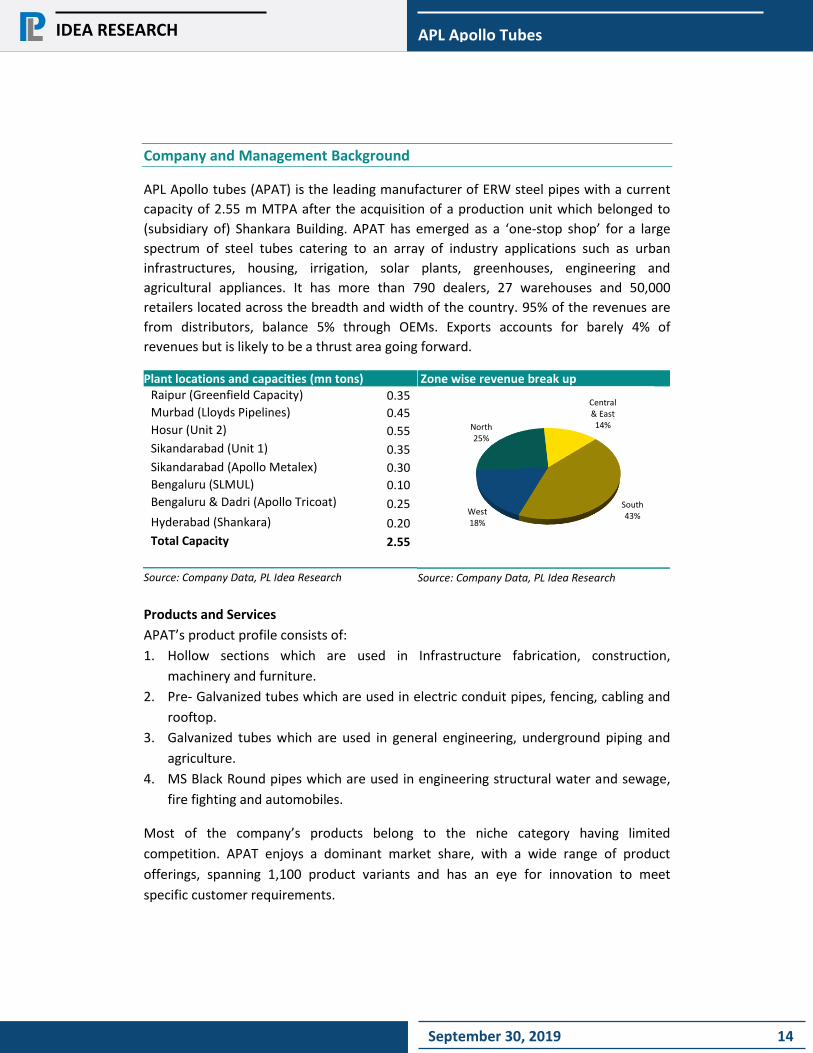
Plant locations and capacities (mn tons) Raipur (Greenfield Capacity) 0.35
Murbad (Lloyds Pipelines) 0.45
Hosur (Unit 2) 0.55
Sikandarabad (Unit 1) 0.35
Sikandarabad (Apollo Metalex) 0.30
Bengaluru (SLMUL) 0.10
Bengaluru & Dadri (Apollo Tricoat) 0.25
Hyderabad (Shankara) 0.20
Total Capacity 2.55
Source: Company Data, PL Idea Research
Zone wise revenue break up
Source: Company Data, PL Idea Research
Products and Services
APAT’s product profile consists of:
1. Hollow sections which are used in Infrastructure fabrication, construction,
machinery and furniture.
2. Pre- Galvanized tubes which are used in electric conduit pipes, fencing, cabling and
rooftop.
3. Galvanized tubes which are used in general engineering, underground piping and
agriculture.
4. MS Black Round pipes which are used in engineering structural water and sewage,
fire fighting and automobiles.
Most of the company’s products belong to the niche category having limited
competition. APAT enjoys a dominant market share, with a wide range of product
offerings, spanning 1,100 product variants and has an eye for innovation to meet
specific customer requirements.
North25%
Central & East14%
South43%West
18%
September 30, 2019 15
APL Apollo Tubes
IDEA RESEARCH
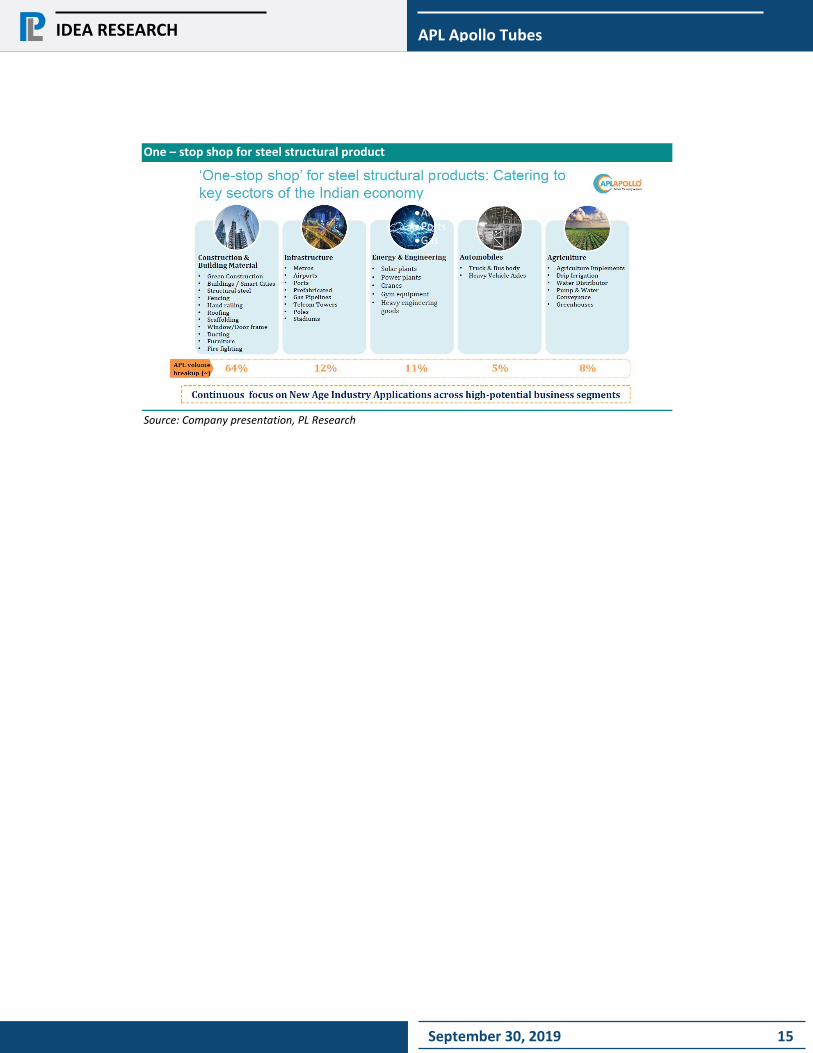
One – stop shop for steel structural product
Source: Company presentation, PL Research
Stadiums Airports Ports Gas
Telecom Poles
Power Plants Gym Equipments
Water Distributor
September 30, 2019 16
APL Apollo Tubes
IDEA RESEARCH
Industry Overview
Global Industry Global steel pipes production has grown marginally since 2015. In 2016, output dropped
by 164 MT. Drop in output was caused due to reluctance of energy industry to invest
across the world. Global steel tubes market is expected to grow at a CAGR of over 6% by
2020 on the back of demand from construction, transmission and distribution sectors.
The consumption of steel pipes has also increased in the Oil & Gas segment due to
continuous innovation in drilling technologies.
North America, the Commonwealth of Independent States, China witnessed moderate
growth while European Steel producers outperformed with a growth of 4%.
Stability in the prices of raw materials as well as increased investment in the energy
sector has improved the outlook for the steel pipe industry.
Domestic Pipe Industry
Steel pipes and tube manufacturing is among the fastest growing industries primarily
due to increased consumption in housing, infrastructure construction, automobile and
energy sectors.
India is among the leading ERW steel tubes manufacturing hubs in the world due to rich
raw material contents, lower cost, superior quality and geographical advantage. India
has a domestic demand of ~7.5mn MTPA which is expected to grow by ~8-9% every
year.
With the growing awareness about environmental conservation, there has been an
increase in the frequency of use of pipes. Pipes, in many ways, are replacing wood,
concrete and other building materials. Steel pipes are also finding utility in areas
dominated by wood such as furniture and door frames. There is also a limited
availability of wood in the market due to strict environmental norms which will improve
demand for products made of steel tubes. There are a very few organized players in the
domain with APAT being the largest.
Government has, in the annual budget, proposed to allocate ~Rs 100tn over the next
five years towards infrastructure; it has also stated that 19.5m houses will be provided
under the PM Awaas Yojna by FY22 which shall boost infrastructure development. The
budget also focuses on the model of One Nation, One Grid, which will result in robust
September 30, 2019 17
APL Apollo Tubes
IDEA RESEARCH
addition of transmission lines. This would further boost the demand for steel and
related products in the country.
Government also intends to invest US$110 bn for improving ports and shipbuilding
industry by 2020 as well as establish about 100 airports in the next 15 years at an
estimated cost of Rs 4,000bn. 70 airports will be at new locations while the rest will be
second airports or expansion of existing airports. These high-ticket projects are
expected to drive demand for steel tubes and pipes.
Nal se Jal campaign will require large diameter ERW pipes for distribution of water and
smaller diameter pipes for last mile connections and intercity connections. This
campaign will therefore be beneficial for the steel pipe industry as a whole.
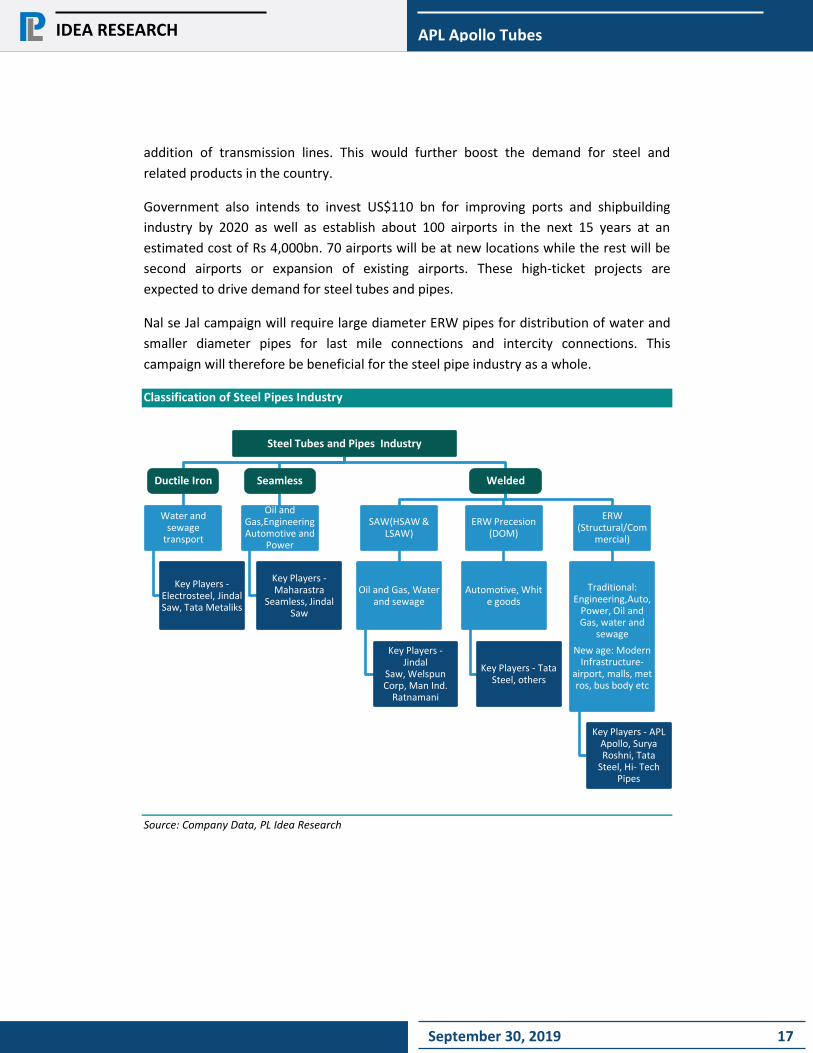
Classification of Steel Pipes Industry
Source: Company Data, PL Idea Research
Steel Tubes and Pipes Industry
Ductile Iron
Water and sewage
transport
Key Players -Electrosteel, Jindal Saw, Tata Metaliks
Seamless
Oil and Gas,Engineering Automotive and
Power
Key Players -Maharastra
Seamless, Jindal Saw
Welded
SAW(HSAW & LSAW)
Oil and Gas, Water and sewage
Key Players -Jindal
Saw, Welspun Corp, Man Ind.
Ratnamani
ERW Precesion (DOM)
Automotive, White goods
Key Players - Tata Steel, others
ERW (Structural/Com
mercial)
Traditional: Engineering,Auto,
Power, Oil and Gas, water and
sewage
New age: Modern Infrastructure-
airport, malls, metros, bus body etc
Key Players - APL Apollo, Surya Roshni, Tata
Steel, Hi- Tech Pipes
September 30, 2019 18
APL Apollo Tubes
IDEA RESEARCH
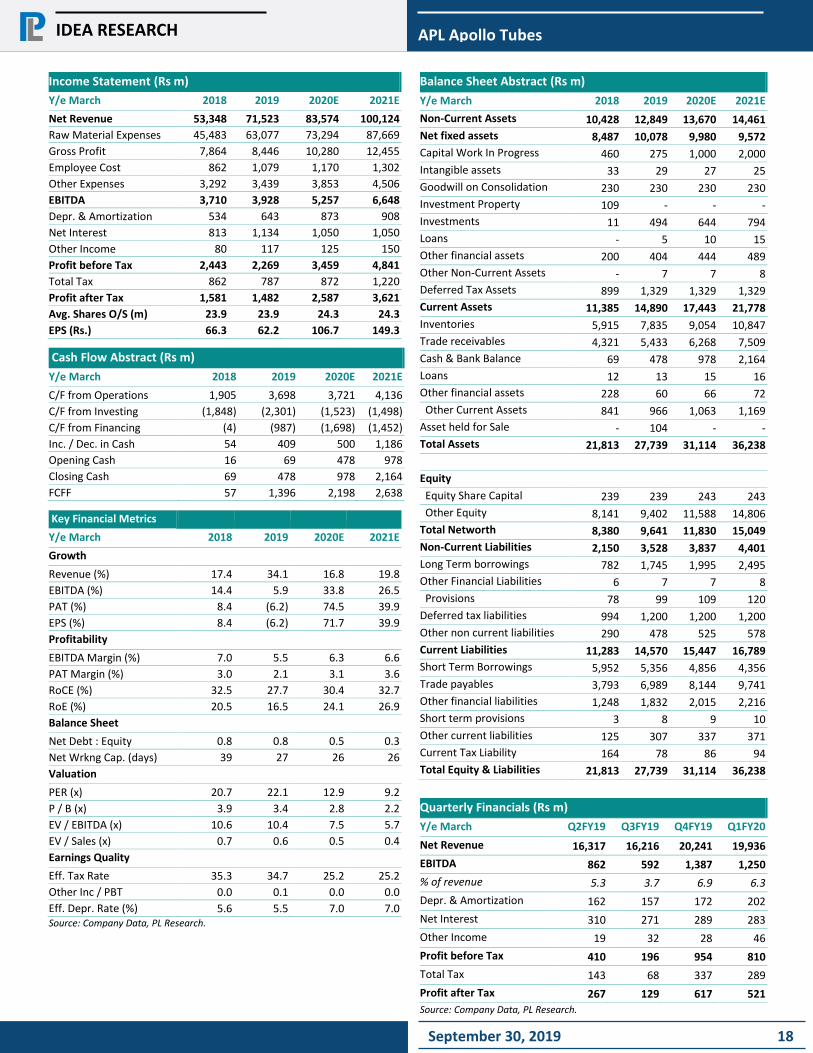
Income Statement (Rs m)
Y/e March 2018 2019 2020E 2021E
Net Revenue 53,348 71,523 83,574 100,124
Raw Material Expenses 45,483 63,077 73,294 87,669
Gross Profit 7,864 8,446 10,280 12,455
Employee Cost 862 1,079 1,170 1,302
Other Expenses 3,292 3,439 3,853 4,506
EBITDA 3,710 3,928 5,257 6,648
Depr. & Amortization 534 643 873 908
Net Interest 813 1,134 1,050 1,050
Other Income 80 117 125 150
Profit before Tax 2,443 2,269 3,459 4,841
Total Tax 862 787 872 1,220
Profit after Tax 1,581 1,482 2,587 3,621
Avg. Shares O/S (m) 23.9 23.9 24.3 24.3
EPS (Rs.) 66.3 62.2 106.7 149.3
Cash Flow Abstract (Rs m)
Y/e March 2018 2019 2020E 2021E
C/F from Operations 1,905 3,698 3,721 4,136
C/F from Investing (1,848) (2,301) (1,523) (1,498)
C/F from Financing (4) (987) (1,698) (1,452)
Inc. / Dec. in Cash 54 409 500 1,186
Opening Cash 16 69 478 978
Closing Cash 69 478 978 2,164
FCFF 57 1,396 2,198 2,638
Key Financial Metrics
Y/e March 2018 2019 2020E 2021E
Growth
Revenue (%) 17.4 34.1 16.8 19.8
EBITDA (%) 14.4 5.9 33.8 26.5
PAT (%) 8.4 (6.2) 74.5 39.9
EPS (%) 8.4 (6.2) 71.7 39.9
Profitability
EBITDA Margin (%) 7.0 5.5 6.3 6.6
PAT Margin (%) 3.0 2.1 3.1 3.6
RoCE (%) 32.5 27.7 30.4 32.7
RoE (%) 20.5 16.5 24.1 26.9
Balance Sheet
Net Debt : Equity 0.8 0.8 0.5 0.3
Net Wrkng Cap. (days) 39 27 26 26
Valuation
PER (x) 20.7 22.1 12.9 9.2
P / B (x) 3.9 3.4 2.8 2.2
EV / EBITDA (x) 10.6 10.4 7.5 5.7
EV / Sales (x) 0.7 0.6 0.5 0.4
Earnings Quality
Eff. Tax Rate 35.3 34.7 25.2 25.2
Other Inc / PBT 0.0 0.1 0.0 0.0
Eff. Depr. Rate (%) 5.6 5.5 7.0 7.0 Source: Company Data, PL Research.
Balance Sheet Abstract (Rs m)
Y/e March 2018 2019 2020E 2021E
Non-Current Assets 10,428 12,849 13,670 14,461
Net fixed assets 8,487 10,078 9,980 9,572
Capital Work In Progress 460 275 1,000 2,000
Intangible assets 33 29 27 25
Goodwill on Consolidation 230 230 230 230
Investment Property 109 - - -
Investments 11 494 644 794
Loans - 5 10 15
Other financial assets 200 404 444 489
Other Non-Current Assets - 7 7 8
Deferred Tax Assets 899 1,329 1,329 1,329
Current Assets 11,385 14,890 17,443 21,778
Inventories 5,915 7,835 9,054 10,847
Trade receivables 4,321 5,433 6,268 7,509
Cash & Bank Balance 69 478 978 2,164
Loans 12 13 15 16
Other financial assets 228 60 66 72
Other Current Assets 841 966 1,063 1,169
Asset held for Sale - 104 - -
Total Assets 21,813 27,739 31,114 36,238
Equity
Equity Share Capital 239 239 243 243
Other Equity 8,141 9,402 11,588 14,806
Total Networth 8,380 9,641 11,830 15,049
Non-Current Liabilities 2,150 3,528 3,837 4,401
Long Term borrowings 782 1,745 1,995 2,495
Other Financial Liabilities 6 7 7 8
Provisions 78 99 109 120
Deferred tax liabilities 994 1,200 1,200 1,200
Other non current liabilities 290 478 525 578
Current Liabilities 11,283 14,570 15,447 16,789
Short Term Borrowings 5,952 5,356 4,856 4,356
Trade payables 3,793 6,989 8,144 9,741
Other financial liabilities 1,248 1,832 2,015 2,216
Short term provisions 3 8 9 10
Other current liabilities 125 307 337 371
Current Tax Liability 164 78 86 94
Total Equity & Liabilities 21,813 27,739 31,114 36,238
Quarterly Financials (Rs m)
Y/e March Q2FY19 Q3FY19 Q4FY19 Q1FY20
Net Revenue 16,317 16,216 20,241 19,936
EBITDA 862 592 1,387 1,250
% of revenue 5.3 3.7 6.9 6.3
Depr. & Amortization 162 157 172 202
Net Interest 310 271 289 283
Other Income 19 32 28 46
Profit before Tax 410 196 954 810
Total Tax 143 68 337 289
Profit after Tax 267 129 617 521
Source: Company Data, PL Research.
September 30, 2019 19
APL Apollo Tubes
IDEA RESEARCH
DISCLAIMER/DISCLOSURES
ANALYST CERTIFICATION
We/I, Ms. Shailee Parekh (MMS, B.com) and Mr Heet Vora (CA) authors and the names subscribed to this report, hereby certify that all of the views expressed in this research report accurately reflect our views about the subject issuer(s) or securities. We also certify that no part of our compensation was, is, or will be directly or indirectly related to the specific recommendation(s) or view(s) in this report.
Terms & conditions and other disclosures:
Prabhudas Lilladher Pvt. Ltd, Mumbai, India (hereinafter referred to as “PL”) is engaged in the business of Stock Broking, Portfolio Manager, Depository Participant and distribution for third party financial products. PL is a subsidiary of Prabhudas Lilladher Advisory Services Pvt Ltd. which has its various subsidiaries engaged in business of commodity broking, investment banking, financial services (margin funding) and distribution of third party financial/other products, details in respect of which are available at www.plindia.com
This document has been prepared by the Research Division of PL and is meant for use by the recipient only as information and is not for circulation. This document is not to be reported or copied or made available to others without prior permission of PL. It should not be considered or taken as an offer to sell or a solicitation to buy or sell any security.
The information contained in this report has been obtained from sources that are considered to be reliable. However, PL has not independently verified the accuracy or completeness of the same. Neither PL nor any of its affiliates, its directors or its employees accepts any responsibility of whatsoever nature for the information, statements and opinion given, made available or expressed herein or for any omission therein.
Recipients of this report should be aware that past performance is not necessarily a guide to future performance and value of investments can go down as well. The suitability or otherwise of any investments will depend upon the recipient's particular circumstances and, in case of doubt, advice should be sought from an independent expert/advisor.
Either PL or its affiliates or its directors or its employees or its representatives or its clients or their relatives may have position(s), make market, act as principal or engage in transactions of securities of companies referred to in this report and they may have used the research material prior to publication.
PL may from time to time solicit or perform investment banking or other services for any company mentioned in this document.
PL holds certification of registration as Research Analyst bearing SEBI Registration Number INH000000271 under Securities and Exchange Board of India (Research Analysts) Regulations, 2014.
PL submits that no material disciplinary action has been taken on us by any Regulatory Authority impacting Equity Research Analysis activities.
PL or its research analysts or its associates or his relatives do not have any financial interest in the subject company.
PL or its research analysts or its associates or his relatives do not have actual/beneficial ownership of one per cent or more securities of the subject company at the end of the month immediately preceding the date of publication of the research report.
PL or its research analysts or its associates or his relatives do not have any material conflict of interest at the time of publication of the research report.
PL or its associates might have received compensation from the subject company in the past twelve months.
PL or its associates might have managed or co-managed public offering of securities for the subject company in the past twelve months or mandated by the subject company for any other assignment in the past twelve months.
PL or its associates might have received any compensation for investment banking or merchant banking or brokerage services from the subject company in the past twelve months.
PL or its associates might have received any compensation for products or services other than investment banking or merchant banking or brokerage services from the subject company in the past twelve months
PL or its associates might have received any compensation or other benefits from the subject company or third party in connection with the research report.
PL encourages independence in research report preparation and strives to minimize conflict in preparation of research report. PL or its analysts did not receive any compensation or other benefits from the subject Company or third party in connection with the preparation of the research report. PL or its Research Analysts do not have any material conflict of interest at the time of publication of this report.
It is confirmed that Ms. Shailee Parekh (MMS, B.com) and Charmi Mehta (CA), Analysts of this report have not received any compensation from the companies mentioned in the report in the preceding twelve months
Compensation of our Research Analysts is not based on any specific merchant banking, investment banking or brokerage service transactions.
The Research analysts for this report certifies that all of the views expressed in this report accurately reflect his or her personal views about the subject company or companies and its or their securities, and no part of his or her compensation was, is or will be, directly or indirectly related to specific recommendations or views expressed in this report.
The research analysts for this report has not served as an officer, director or employee of the subject company PL or its research analysts have not engaged in market making activity for the subject company
Our sales people, traders, and other professionals or affiliates may provide oral or written market commentary or trading strategies to our clients that reflect opinions that are contrary to the opinions expressed herein, and our proprietary trading and investing businesses may make investment decisions that are inconsistent with the recommendations expressed herein. In reviewing these materials, you should be aware that any or all o the foregoing, among other things, may give rise to real or potential conflicts of interest.
PL and its associates, their directors and employees may (a) from time to time, have a long or short position in, and buy or sell the securities of the subject company or (b) be engaged in any other transaction involving such securities and earn brokerage or other compensation or act as a market maker in the financial instruments of the subject company or act as an advisor or lender/borrower to the subject company or may have any other potential conflict of interests with respect to any recommendation and other related information and opinions.
Prabhudas Lilladher Pvt. Ltd.
3rd Floor, Sadhana House, 570, P. B. Marg, Worli, Mumbai-400 018, India Tel: (91 22) 6632 2222 Fax: (91 22) 6632 2209