Embed Size (px)
Citation preview

October 2011 analysis suggested company sale was imminent, yet shares
traded well below a reasonable takeout valuation
Idea performance

Deal multiple of ~8.4x LTM adj. EBITDA, in line with best comp, O’Charley’s
Deal valuation

Market fails to price in imminent sale Long: Benihana (BNHN / BNHNA)
October 17, 2011
Analyst: Doug Bennett
Disclosure: The UW ASAP program is long BNHN and BNHNA.

Thesis
• Growing 3-concept Japanese / sushi restaurant operator likely to be sold for 6x-9x
adj. EBITDA within a 2-6 month time frame
• Turnaround CEO has “concluded that potential sale was the best way to maximize value for shareholders”
and engaged Jefferies & Co. (Sept. 2010). Late founder’s family has hindered sale process, but will lose
voting power on Nov. 17
• BNHN currently trades at 4.8x Adj. EBITDA, implying upside potential of 20-80%
• Mispricing exists due to some combination of a) lack of analyst coverage b) small size ($165m market value)
and illiquidity (dual share structure, concentrated ownership) c) steep market declines in Aug/Sept
d) confusion regarding Class A share reclassification proposal e) its true operating performance being
obscured by non-recurring charges
• Share reclassification voted down by late founder’s family by 250k votes on Sept. 12. Since then, preferred
shareholders have converted stake into 988k shares of common stock and insiders have purchased ~100k
common shares in order to sway Nov. 17 vote in favor of share reclass, which will dilute voting power of
founding family from 27% to 12%, eliminate the company’s poison pill and pave way for BNHN sale

Company overview
• Benihana Inc. owns, operates and franchises 3 Japanese restaurant concepts • Benihana (63 comp. owned, 18 franchised) – teppanyaki-style concept in which chef prepares food tableside
on teppan grill
• RA Sushi (25 comp. owned) – sushi and Pacific-Rim dishes served in contemporary, high-energy
environment
• Haru (8 comp. owned) – Japanese and fusion dished served in modern, urban atmosphere. Take-out and
delivery services also offered
• Company struggled due to mismanagement (compounded by difficult economic
environment) until turnaround CEO Richard Stockinger was hired in February 2009
• Comprehensive Renewal Plan implemented in early 2010 - same-store sales have grown since April 2010
with an improving trend
Jul-11 Oct-07 Jan-08 YE Apr-08 Jul-08 Oct-08 Jan-09 YE Apr-09 Jul-09 Oct-09 Jan-10 YE Apr-10 Jul-10 Oct-10 Jan-11 YE Apr-11 Jul-11 Oct-11 Jan-12 YE Apr-12
Teppanyaki 6.2% 2.4% 2.7% 2.9% -3.4% -5.1% -10.9% -7.7% -13.1% -12.2% -5.9% -7.9% 3.3% 7.9% 7.4% 6.3% 8.6% 7.7%
RA Sushi 4.4% 3.0% -3.6% -1.0% -9.1% -11.4% -9.1% -7.5% 3.5% 0.2% 4.4% 2.6% -0.1% -0.9% -1.5% 0.3% 2.4% 5.3%
Haru 10.3% 4.8% 0.2% 3.6% -7.7% -8.0% -14.6% -10.6% -14.8% -14.3% -1.6% -8.3% 2.4% -1.0% -1.1% -0.4% -1.9% 0.6%
Total 6.4% 2.8% 1.5% 2.4% -4.9% -6.5% -11.1% -8.0% -10.1% -9.9% -3.4% -5.8% 2.4% 4.7% 4.4% 4.2% 6.0% 6.4%
FY2011 FY2012FY2010FY2009FY2008
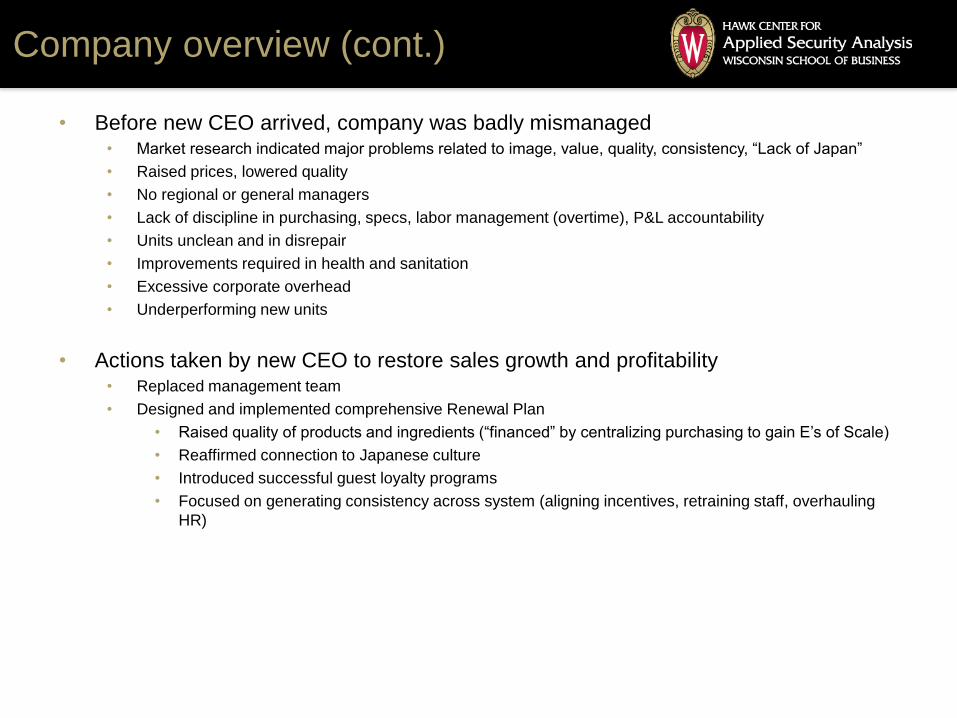
Company overview (cont.)
• Before new CEO arrived, company was badly mismanaged • Market research indicated major problems related to image, value, quality, consistency, “Lack of Japan”
• Raised prices, lowered quality
• No regional or general managers
• Lack of discipline in purchasing, specs, labor management (overtime), P&L accountability
• Units unclean and in disrepair
• Improvements required in health and sanitation
• Excessive corporate overhead
• Underperforming new units
• Actions taken by new CEO to restore sales growth and profitability • Replaced management team
• Designed and implemented comprehensive Renewal Plan
• Raised quality of products and ingredients (“financed” by centralizing purchasing to gain E’s of Scale)
• Reaffirmed connection to Japanese culture
• Introduced successful guest loyalty programs
• Focused on generating consistency across system (aligning incentives, retraining staff, overhauling
HR)

Situation overview
• September 2010 - CEO Stockinger first engages Jefferies & Co. in order to explore a sale
• May 2011 – Company files a lawsuit against late founder’s family trust, Benihana of Tokyo
(BOT)(~12% owners), claiming BOT “"undertook a course of action to disparage Benihana in an
effort to frustrate the company's ability to maximize interest in Benihana.”
• BOT filed a trademark lawsuit in late 2010 that Benihana claimed “was aimed at causing prospective
purchasers to question Benihana's relationship with BOT, the value of the assets, and the stability of the
company.”
• September 12, 2011 – Despite majority of shareholders voting in favor of the proposed Class A
conversion, initiative fails by ~275k votes due to BOT’s disproportionate voting power (12%
economic interest, 27% voting power)
• September 20, 2011 to present – BFC Financial converts remaining 500k shares of preferred
stock into 988k shares of common stock with intent to vote for the reclass at November 17 revote
(more to follow)
• Coliseum Capital buys additional 157k Class A shares
• CEO, CFO, General Counsel & BFC Financial affiliates purchase ~100k common shares in open market
• November 17, 2011 – second Class A share reclassification likely to pass at special meeting
• Announcement of company sale likely soon after as 3-class share structure (class A, common, convertible
preferred) is reduced to 1 class, the company’s poison pill is eliminated and BOT’s voting power falls from
~27% to ~12%

The smoking gun
• On October 7, BFC Financial, owners of BNHN convertible preferred stock, converted their last
500,000 preferred shares into 987,528 BNHN common in order to sway the vote at the Nov. 17
Class A reclassification vote. The stake had a market value of about $8m when converted (987,528
BNHN shares at $8.10), yet the 500,000 convertible preferred shares paid 5% annually and would
have been redeemed or converted no later than July 2014 at $12.67 per common share (987,528
BNHN shares at $12.67, or a market value of ~$12.5m).
• Why would BFC forego the interest and $12.5m payoff by July 2014 for $8m now and increased
voting power for the reclass? Even using a 15% discount rate on the preferred cash flows through
redemption in July 2014, the NPV as of October 7, 2011 was around ~$10m. Why would BFC
trade $10m today (equivalent to ~$10 per newly converted share) for $8m today ($8 per share)? I
assume the answer will become apparent when a sale is announced well above $10 per share in
the next few months.
Oct-11 Jul-12 Jul-13 Jul-14
Covertible shares held by BFC Financial 500,000
New common shares upon conversion (1.975 adj. factor) 987,528
Annual preferred dividend ($1.25 per share) $625,000 $625,000 $625,000
Terminal payment (500,000*1.975 adj. factor*$12.67 per share) $12,511,980
Total convert. preferred cash flows through maturity $625,000 $625,000 $13,136,980
Assumed discount rate 15.0%
Discount factor 89.8% 78.1% 67.9%
Discounted cash flows $561,243 $488,037 $8,920,123
NPV assuming preferreds held to maturity $9,969,403
NPV per common share $10.10
NPV given Oct. 7. 2011 early conversion $7,998,977
Price per common share at early conversion $8.10

Benihana’s value in a sale
• Restaurant deals have averaged 8x EBITDA over the last 15 years, while no restaurant company
with an enterprise value greater than $100m has sold for less than 6x EBITDA since 2002
Source: Goldman Sachs
Benihana

Benihana’s value in a sale (cont.)
• Upside potential of 20-80% given a 6x-9x deal multiple range
• Interesting to note that corporate overhead is running about $20-$22 million annually on an
adjusted basis (around $31m LTM unadjusted) – a strategic acquirer could realize large cost
synergies (add $10m-$15m to EBITDA)
6.0x 7.0x 8.0x 9.0x
LTM EBITDA $22.9 $22.9 $22.9 $22.9
Add: Non-recurring charges $10.6 $10.6 $10.6 $10.6
LTM Adj. EBITDA $33.5 $33.5 $33.5 $33.5
Enterprise value $201.1 $234.6 $268.2 $301.7
Less: Debt $0.0 $0.0 $0.0 $0.0
Add: Cash $4.6 $4.6 $4.6 $4.6
Equity value $205.7 $239.2 $272.8 $306.3
Projected price per share $11.17 $12.99 $14.81 $16.63
Current market value $169.4 $169.4 $169.4 $169.4
Current price per share $9.20 $9.20 $9.20 $9.20
Return potential 21% 41% 61% 81%
LTM operating cash flow $25.3 $25.3 $25.3 $25.3
Add: After-tax non-rec. charges $6.9 $6.9 $6.9 $6.9
Adj. LTM operating cash flow $32.2 $32.2 $32.2 $32.2
Less: Maintenance capex $8.0 $8.0 $8.0 $8.0
Adj. free cash flow $24.2 $24.2 $24.2 $24.2
Implied P/FCF:
Multiple 8.5x 9.9x 11.3x 12.7x
Yield 11.7% 10.1% 8.9% 7.9%
EV/EBITDA Multiples
Sanity check

Risks
• Even if a sale fails to materialize, Benihana is trading at 4.8x EBITDA (adjusted for non-recurring
charges) - which is at the bottom of the range vs. comparable companies – despite strong SSS
growth and improving profitability
• Shares trade at 9.5x LTM unadjusted free cash flow and 6.5x LTM adjusted free cash flow, which should
provide downside protection
• Corporate-level “non-recurring” charges could become “recurring” expenses should the Class A
share reclassification fail and the fight with BOT continue
• Non-recurring charges of $10.6m in the LTM on top of $22.1m recurring expenses ($32.7m total)
• The $22.1m LTM recurring corporate expenses are up $4m from FY2010
• A market meltdown has potential to hit this stock especially hard, given small size, illiquidity and
tie to discretionary consumer spending
Comparable companies Last Px Mkt Cap EV EBITDA T12M EV/EBITDA T12M Ret YTD Pct Rev - 1 Yr Gr:Y P/E
BJ'S RESTAURANTS INC 49 $1,357.2 $1,301.6 $70.6 18.4x 38.3% 20.4% 49.0x
KRISPY KREME DOUGHNUTS INC 7.16 $486.4 $481.7 $30.8 15.6x 2.6% 4.5% 31.1x
DARDEN RESTAURANTS INC 46.66 $6,150.9 $7,868.7 $1,050.8 7.5x 3.7% 5.4% 13.7x
CHEESECAKE FACTORY INC/THE 27.01 $1,532.2 $1,473.3 $198.1 7.4x -11.9% 3.6% 18.1x
BIGLARI HOLDINGS INC 327.63 $469.5 $551.0 $80.0 6.9x -20.1% 7.2% 16.2x
DENNY'S CORP 3.55 $345.5 $573.5 $85.7 6.7x -0.8% -9.8% 12.7x
BRINKER INTERNATIONAL INC 22.29 $1,842.9 $2,285.6 $338.8 6.6x 8.8% -3.4% 14.0x
MCCORMICK & SCHMICK'S SEAFOO 7.2 $107.1 $107.1 $20.1 5.3x -20.8% -2.3% 0.0x
PF CHANG'S CHINA BISTRO INC 28.44 $635.4 $690.0 $140.1 4.9x -40.1% 1.2% 14.6x
BENIHANA INC 8.95 $164.8 $160.2 $33.5 4.8x 11.7% 4.5% 59.7x
Source: Bloomberg, Company reports, Analyst estimates

Appendix - Stock ownership (pre-vote)
• Total diluted Class A common and common shares outstanding: 18,416,710
• Common stock (1 vote per share)
• Class A common stock (1/10 vote per share)
Common stock owners Report Date Position Mkt Val % dil. shares O/S
Beniha of Tokyo, Inc. 06/21/2011 2,153,744 19,276,009 11.8%
BFC Financial Corp. 10/07/2011 1,582,577 14,164,064 8.7%
Coliseum Capital Management LLC 09/26/2011 610,512 5,464,082 3.3%
Andreeff Equity Advisors LLC 06/30/2011 521,291 4,665,554 2.9%
Dimensional Fund Advisors, Inc. 06/30/2011 238,497 2,134,548 1.3%
Fidelity Management & Research Co. 06/30/2011 200,000 1,790,000 1.1%
FLANERY J DAVID 09/29/2011 165,000 1,476,750 0.9%
The Vanguard Group, Inc. 06/30/2011 72,315 647,219 0.4%
First Wilshire Securities Management, Inc. 06/30/2011 69,962 626,160 0.4%
ABDO JOHN E 10/07/2011 63,000 563,850 0.3%
Class A common stock owners Report Date Position Mkt Val % dil. shares O/S
Coliseum Capital Management LLC 09/29/2011 2,000,384 17,823,421 11.0%
RBC Global Asset Management (US), Inc. 06/30/2011 1,153,581 10,278,407 6.3%
BlackRock Fund Advisors 06/30/2011 724,887 6,458,743 4.0%
Columbia Management Investment Advisers LLC 06/30/2011 685,571 6,108,438 3.8%
Andreeff Equity Advisors LLC 06/30/2011 583,974 5,203,208 3.2%
STOCKINGER RICHARD C 07/08/2011 353,333 3,148,197 1.9%
Roark, Rearden & Hamot LLC 06/30/2011 350,000 3,118,500 1.9%
Dimensional Fund Advisors, Inc. 06/30/2011 314,756 2,804,476 1.7%
Royce & Associates LLC 06/30/2011 228,800 2,038,608 1.3%
The Vanguard Group, Inc. 06/30/2011 222,566 1,983,063 1.2%
Robeco Investment Management 06/30/2011 220,045 1,960,601 1.2%

Appendix – Share conversion
Number of shares (millions)
Class A 10.9 10.9
Common 6.0 6.0
Preferred 0.5 1.0
Add: Option conversions 0.6
Adj. shares outstanding 18.4
Current share price $8.95
Market cap $164.8
Less: cash 4.6
Add: Debt 0.0
Enteprise Value $160.2
LTM Adj. EBITDA 33.5
Current EV/EBITDA multiple 4.8x
Common
Post conversionPre-conversion

Appendix – Combined operations
Consolidated 2007 2008 2009 2010 2011 LTM
Revenues:
Restaurant sales 270.9 295.2 303.9 311.8 325.9 331.7
Franchise fees and royalties 1.6 1.8 1.7 1.7 1.7 1.8
Total revenues 272.5 296.9 305.6 313.5 327.6 333.4
Restaurant expenses:
Cost of food and beverage sales 66.0 69.7 72.6 74.8 79.8 81.5
Restaurant operating expenses 159.4 178.1 196.5 208.5 209.4 211.9
Restaurant opening costs 1.5 3.4 2.2 1.0 0.0 0.0
G&A expenses 23.8 28.1 22.7 24.6 36.4 38.1
Impairment charges 0.0 0.0 21.5 12.3 0.0 0.0
Total operating expenses 250.7 279.4 315.5 321.3 325.6 331.5
EBIT 21.7 17.6 -9.9 -7.7 2.0 1.9
EBITDA 35.6 34.9 8.7 12.3 23.6 22.9
Operating cash flow 31.2 27.8 33.9 27.6 27.5 25.3
Adjusted EBIT & EBITDA:
EBIT (reported) 21.7 17.6 -9.9 -7.7 2.0 1.9
Add: Impairment charges 0.0 0.0 21.5 12.3 0.0 0.0
Add: Other non-recurring 0.0 0.0 2.8 1.6 10.8 10.6
Adj. EBIT 21.7 17.6 14.4 6.2 12.8 12.5
Add: D&A 13.9 17.3 18.7 20.1 21.6 21.1
Adj. EBITDA 35.6 34.9 33.0 26.3 34.4 33.5
Margins:
Gross 75.8% 76.5% 76.2% 76.2% 75.6% 75.6%
Adj. EBIT 8.0% 5.9% 4.7% 2.0% 3.9% 3.7%
Adj. EBITDA 13.1% 11.8% 10.8% 8.4% 10.5% 10.1%
During the year ended March 27, 2011, we incurred certain non-recurring costs in our Corporate general and administrative expenses of approximately $10.8 million.
These costs include costs associated with various financial, operational and strategic growth consulting agreements (including payments made in consideration for
services provided by our interim Chief Financial Officer) of approximately $3.3 million, severance costs incurred related to the resignation of Jose I. Ortega, our former
Chief Financial Officer, of $0.2 million, fees paid to the Special Committee, formed to explore financial alternatives for the Company, totaling approximately $0.4 million,
costs incurred in conjunction with the execution of our accounting and payroll function outsourcing agreement, including the related severance costs, of approximately
$2.0 million (includes $1.4 million of accelerated deprecation expense and final contract settlement of the ERP system), the write-off of abandoned projects of
approximately $0.2 million, expenses incurred to respond to and ultimately settle the proxy contest in connection with our Annual Shareholders’ Meeting of $0.9 million,
an additional $2.3 million related to stock based compensation in connection with the directors’ stock option grants and restricted share awards granted to certain
executives pursuant to their employment agreements and costs incurred in connection with the Board’s assessment of strategic alternatives, including a possible sale of
the Company, of $1.5 million. – Benihana 10K – FY2011


![Eckankar Founder’s Day - Eckankar in California Founders Day... · Eckankar Founder’s Day Dinner & Celebration Honoring Paul Twitchell [center] who introduced the modern teachings](https://img.pdfslide.us/doc/110x75/5b15b55d7f8b9a8b288d95c2/eckankar-founders-day-eckankar-in-founders-day-eckankar-founders.jpg)