Embed Size (px)
Citation preview
IDCIDC
Diabetes Update: Diabetes Update: Recent Research and Impact Recent Research and Impact
on Diabetes Managementon Diabetes Management
• Type 1 DiabetesType 1 Diabetes– Post DCCT findings--improving glycemic control and Post DCCT findings--improving glycemic control and
preventing complicationspreventing complications
• Type 2 DiabetesType 2 Diabetes– Impact of the United Kingdom Prospective Diabetes Study on Impact of the United Kingdom Prospective Diabetes Study on
Current PracticeCurrent Practice
– Relationship between blood glucose, blood pressure Relationship between blood glucose, blood pressure dyslipidemia and complicationsdyslipidemia and complications
• Diabetes in PregnancyDiabetes in Pregnancy – New screening, diagnostic and treatment criteria (use of New screening, diagnostic and treatment criteria (use of
Glyburide) for GDMGlyburide) for GDM

IDCIDC
Epidemiology of Diabetes Epidemiology of Diabetes Interventions and Complications TrialInterventions and Complications Trial
6-Year Follow-up6-Year Follow-up
1375 SubjectsRecruited
Both original groups are nowtreated with the
goal of HbA1c <7%
710 Conventionally Treated Patients
HbA1c=9.2%
Annual measurements at
28 sites
710 IntensivelyTreated Patients
HbA1c=7.2%

IDCIDC
EDIC:EDIC: Comparison of Baseline and Year 6 HbA1cComparison of Baseline and Year 6 HbA1c
7.27.5
9.2
8.5
6
6.5
7
7.5
8
8.5
9
9.5
Baseline Year 6
IntensiveConventionalH
bA1c
%H
bA1c
%
DiabetesDiabetes 48:383–390, 1999 48:383–390, 1999
IDCIDC
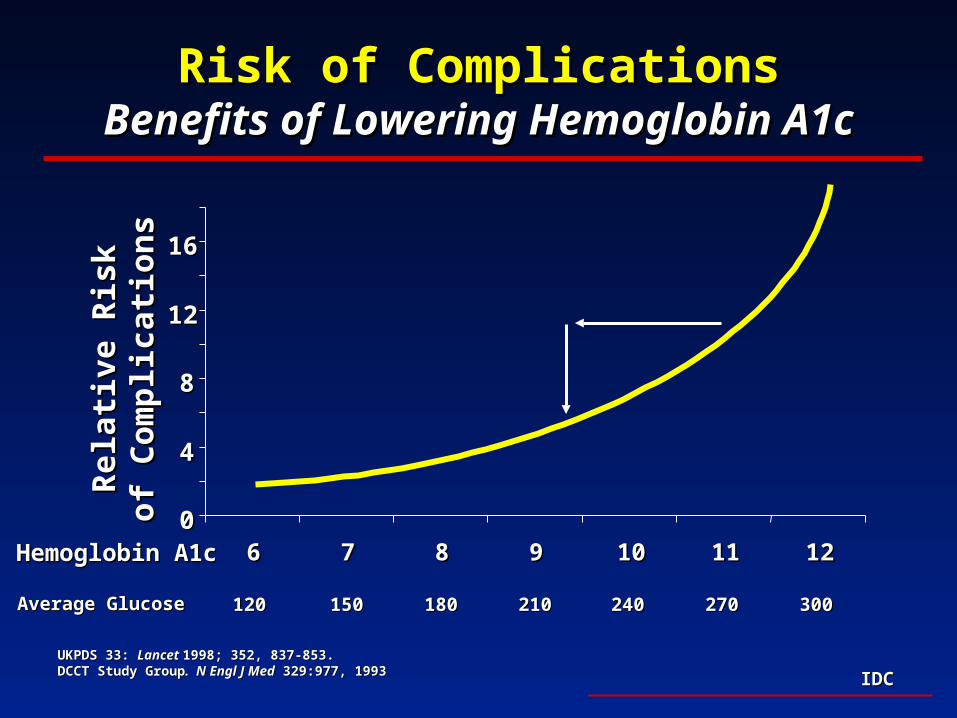
Risk of ComplicationsRisk of ComplicationsBenefits of Lowering Hemoglobin A1cBenefits of Lowering Hemoglobin A1c
00
44
88
1212
1616
66 77 88 99 1010 1111 1212Hemoglobin A1cHemoglobin A1c
Rel
ativ
e R
isk
Rel
ativ
e R
isk
of C
omp
lica
tion
sof
Com
pli
cati
ons
UKPDS 33: UKPDS 33: Lancet Lancet 1998; 352, 837-853.1998; 352, 837-853.DCCT Study GroupDCCT Study Group. N Engl J Med. N Engl J Med 329:977, 1993 329:977, 1993
120 120 150150 180180 210210 240240 270270 300300Average GlucoseAverage Glucose

IDCIDC
DCCT and EDIC: Conclusions for Type 1 DCCT and EDIC: Conclusions for Type 1 DiabetesDiabetes
• HbA1c <7% because near normal blood glucose HbA1c <7% because near normal blood glucose control prevents the development and progress of control prevents the development and progress of microvascular diseasemicrovascular disease
• Intensive insulin therapies can be utilized as they Intensive insulin therapies can be utilized as they do not increase the risk of macrovascular diseasedo not increase the risk of macrovascular disease
• Any lowering of blood glucose is important since Any lowering of blood glucose is important since there is a continuous relationship between glucose there is a continuous relationship between glucose lowering and reduction in the risk of complicationslowering and reduction in the risk of complications
IDCIDC
Type 2 Diabetes: ControversiesType 2 Diabetes: Controversies
• Does intensive glycemic control in Type 2 diabetes reduce Does intensive glycemic control in Type 2 diabetes reduce micro and macrovascular complications?micro and macrovascular complications?
• Are there advantages or disadvantages to sulfonylureas, Are there advantages or disadvantages to sulfonylureas, insulin or metformin?insulin or metformin?– ? Increased cardiovascular risk with insulin or SU? Increased cardiovascular risk with insulin or SU– Is metformin advantageous in those with obesity?Is metformin advantageous in those with obesity?
• Does aggressive lowering of blood pressure reduce the risk of Does aggressive lowering of blood pressure reduce the risk of secondary complications?secondary complications?

IDCIDC
• Designed in 1976Designed in 1976
• A 20-year, multicenter (23), prospective, A 20-year, multicenter (23), prospective, randomized, interventional trialrandomized, interventional trial
• Recruited 5102 Recruited 5102 newly diagnosednewly diagnosed type 2 type 2 diabetes patientsdiabetes patients– FPG >108 mg/dL (6 mmol/L) on two occasionsFPG >108 mg/dL (6 mmol/L) on two occasions
• Mean duration of follow-up: 11 yearsMean duration of follow-up: 11 years
UKPDS: Study OverviewUKPDS: Study Overview
UKPDS Group: UKPDS Group: Lancet Lancet 1998; 352, 837-1998; 352, 837-853.853.

IDCIDC
UKPDS: Glucose Control StudyUKPDS: Glucose Control Study
5102 patients treated with diet (3 months)5102 patients treated with diet (3 months)
Conventional therapy Conventional therapy (n=1138)(n=1138)
Initial therapy - medical nutritionInitial therapy - medical nutritionTarget FPG < 270 mg/dL Target FPG < 270 mg/dL
(13.5 mmol/L)(13.5 mmol/L)
4209 patients randomized (82%)4209 patients randomized (82%)
Intensive therapy=3071 Intensive therapy=3071 **Initial drug monotherapy Initial drug monotherapy
Target FPG < 108mg/dLTarget FPG < 108mg/dL(6 mmol/L) (6 mmol/L)
Metformin Metformin Overweight onlyOverweight only
n=342n=342
SulfonylureasSulfonylureasInitial therapyInitial therapy
n=1573n=1573
InsulinInsulinSingle-multi injectionSingle-multi injection
n=1156n=1156
* These therapies* These therapieswere combined or changedwere combined or changedto maintain targetto maintain target
IDCIDC
UKPDS: Conclusions From Intensive UKPDS: Conclusions From Intensive Glucose Control StudyGlucose Control Study
• Intensive glucose control achieved HbA1c lowering Intensive glucose control achieved HbA1c lowering of ~ 1.0% at 10 yearsof ~ 1.0% at 10 years– Mean Hb A1c Mean Hb A1c 7.9% 7.9% 7.0% 7.0%
• Intensive glucose control Intensive glucose control significantlysignificantly reduced reduced clinical complicationsclinical complications– Reduced microvascular complications by 25%Reduced microvascular complications by 25%
• Glycemic control deteriorated over time regardless Glycemic control deteriorated over time regardless of therapyof therapy
IDCIDC
66
77
88
99
00 33 66 99 1212 1515
Hb
AH
bA 1
c1c (%
)(%
)
Years from randomizationYears from randomization
ConventionalConventional
IntensiveIntensive
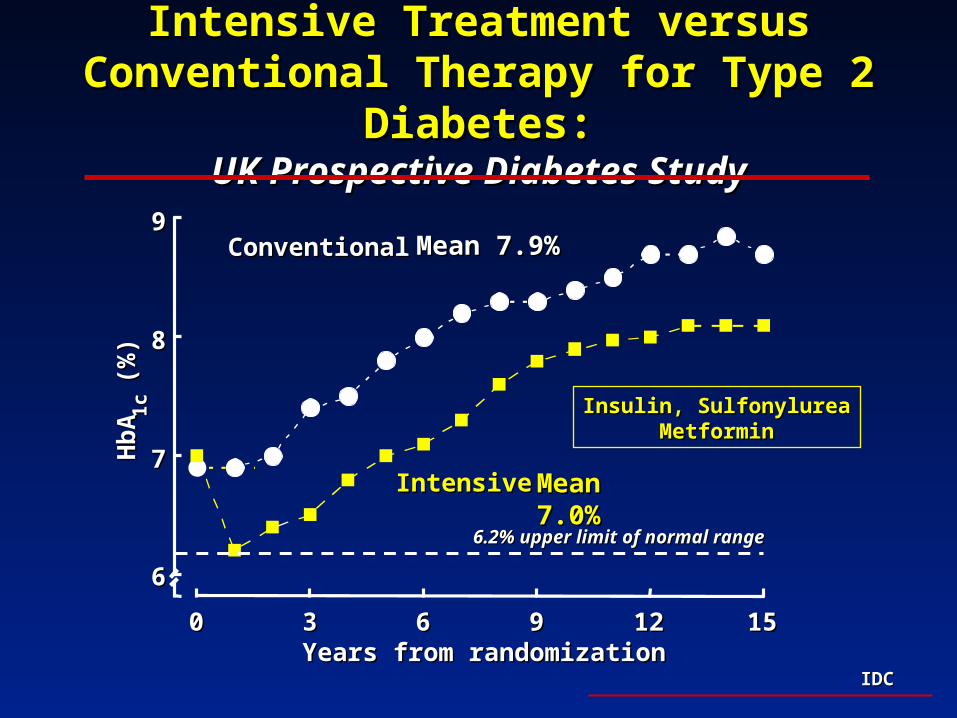
6.2% upper limit of normal range6.2% upper limit of normal range
Insulin, SulfonylureaInsulin, SulfonylureaMetforminMetformin
Intensive Treatment versus Conventional Intensive Treatment versus Conventional Therapy for Type 2 Diabetes:Therapy for Type 2 Diabetes:
UK Prospective Diabetes StudyUK Prospective Diabetes Study
Mean 7.9%Mean 7.9%
Mean Mean 7.0%7.0%
IDCIDC
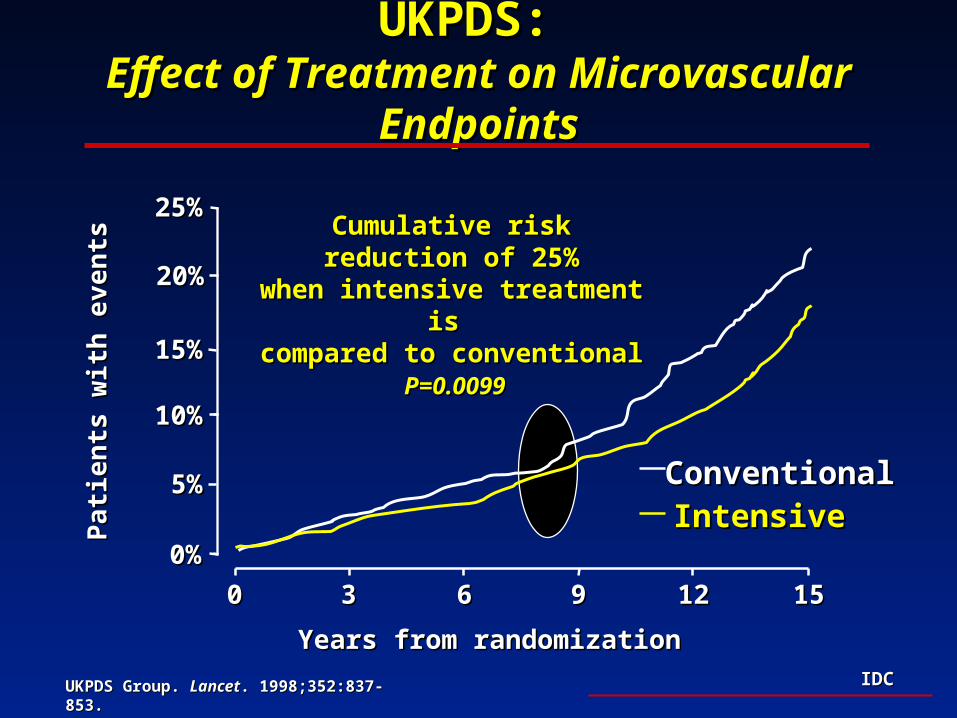
UKPDS: UKPDS: Effect of Treatment on Microvascular EndpointsEffect of Treatment on Microvascular Endpoints
UKPDS Group. UKPDS Group. LancetLancet. 1998;352:837-853.. 1998;352:837-853.
Years from randomizationYears from randomization
Pat
ien
ts w
ith
eve
nts
Pat
ien
ts w
ith
eve
nts
Cumulative risk reduction of Cumulative risk reduction of 25%25%
when intensive treatment is when intensive treatment is compared to conventionalcompared to conventional
P=0.0099P=0.0099
0%0%
10%10%
20%20%
00 33 66 99 1212 1515
IntensiveIntensiveConventionalConventional
25%25%
15%15%
5%5%
IDCIDC
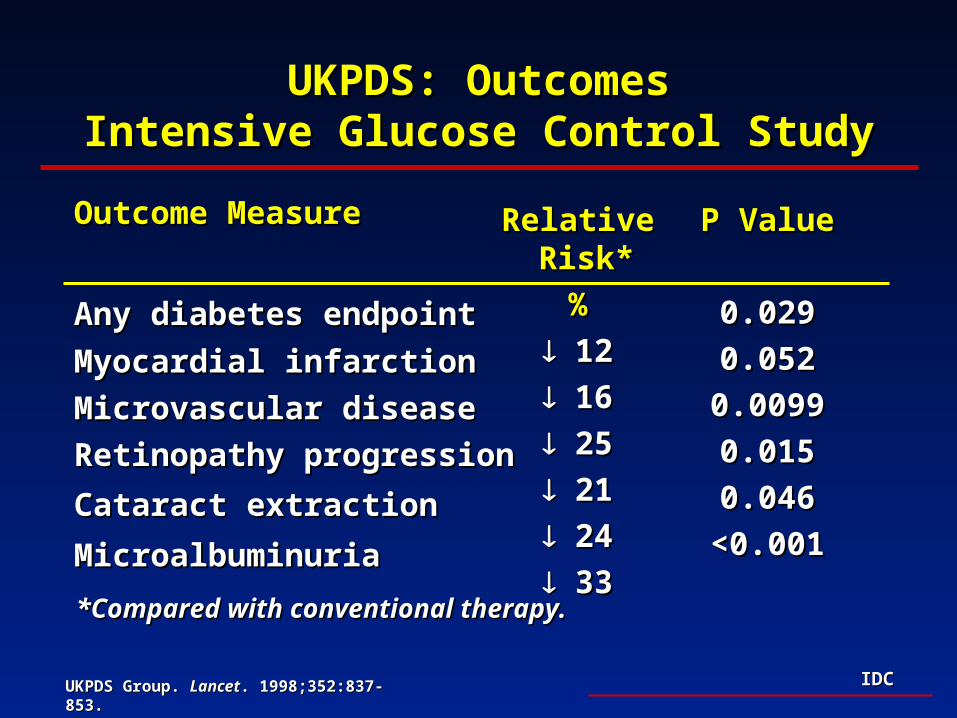
UKPDS: OutcomesUKPDS: OutcomesIntensive Glucose Control StudyIntensive Glucose Control Study
Relative Risk* Relative Risk*
%%
1212
1616
2525
2121
2424
3333
*Compared with conventional therapy.*Compared with conventional therapy.
P ValueP Value
0.0290.029
0.0520.052
0.00990.0099
0.0150.015
0.0460.046
<0.001<0.001
Outcome MeasureOutcome Measure
Any diabetes endpointAny diabetes endpoint
Myocardial infarctionMyocardial infarction
Microvascular diseaseMicrovascular disease
Retinopathy progressionRetinopathy progression
Cataract extractionCataract extraction
Microalbuminuria Microalbuminuria
UKPDS Group. UKPDS Group. LancetLancet. 1998;352:837-853.. 1998;352:837-853.
IDCIDC
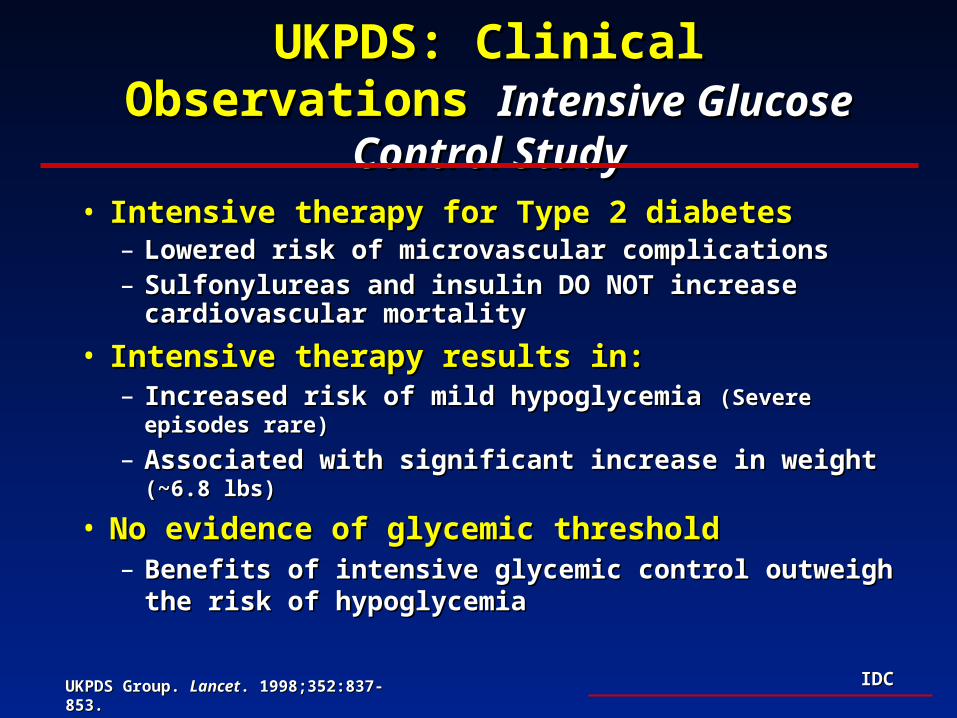
• Intensive therapy for Type 2 diabetesIntensive therapy for Type 2 diabetes– Lowered risk of microvascular complicationsLowered risk of microvascular complications– Sulfonylureas and insulin DO NOT increase Sulfonylureas and insulin DO NOT increase
cardiovascular mortalitycardiovascular mortality
• Intensive therapy results in:Intensive therapy results in:– Increased risk of mild hypoglycemia Increased risk of mild hypoglycemia (Severe episodes rare)(Severe episodes rare)
– Associated with significant increase in weight Associated with significant increase in weight (~6.8 lbs)(~6.8 lbs)
• No evidence of glycemic thresholdNo evidence of glycemic threshold– Benefits of intensive glycemic control outweigh the risk Benefits of intensive glycemic control outweigh the risk
of hypoglycemiaof hypoglycemia
UKPDS: Clinical Observations UKPDS: Clinical Observations Intensive Glucose Control StudyIntensive Glucose Control Study
UKPDS Group. UKPDS Group. LancetLancet. 1998;352:837-853.. 1998;352:837-853.
IDCIDC
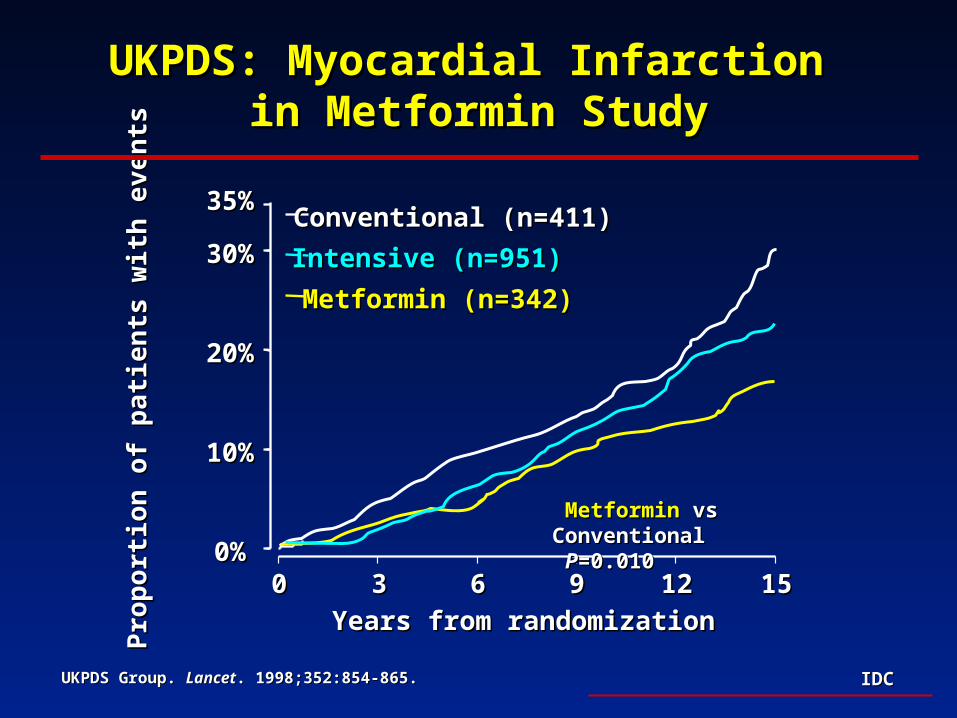
UKPDS: Myocardial Infarction UKPDS: Myocardial Infarction in Metformin Studyin Metformin Study
0%0%
10%10%
20%20%
30%30%
35%35%
00 33 66 99 1212 1515
Pro
por
tion
of
pat
ien
ts w
ith
eve
nts
Pro
por
tion
of
pat
ien
ts w
ith
eve
nts
Years from randomizationYears from randomization
Conventional (n=411)Conventional (n=411)
Intensive (n=951)Intensive (n=951)
Metformin (n=342)Metformin (n=342)
MetforminMetformin vs Conventional vs Conventional PP=0.010=0.010
UKPDS Group. UKPDS Group. LancetLancet. 1998;352:854-865.. 1998;352:854-865.

IDCIDC
UKPDS: Conclusions UKPDS: Conclusions Metformin Therapy in Overweight PatientsMetformin Therapy in Overweight Patients
• Metformin therapy may be preferable in Metformin therapy may be preferable in overweight individualsoverweight individuals– Comparable glycemic control Comparable glycemic control – Achieved with limited weight gain and less Achieved with limited weight gain and less
hypoglycemiahypoglycemia
• Potential benefit of metformin on CVD riskPotential benefit of metformin on CVD risk– Lower risk of myocardial infarction in those treated Lower risk of myocardial infarction in those treated
with metformin monotherapywith metformin monotherapy
– Benefit related to treatment of insulin resistance?Benefit related to treatment of insulin resistance?
IDCIDC
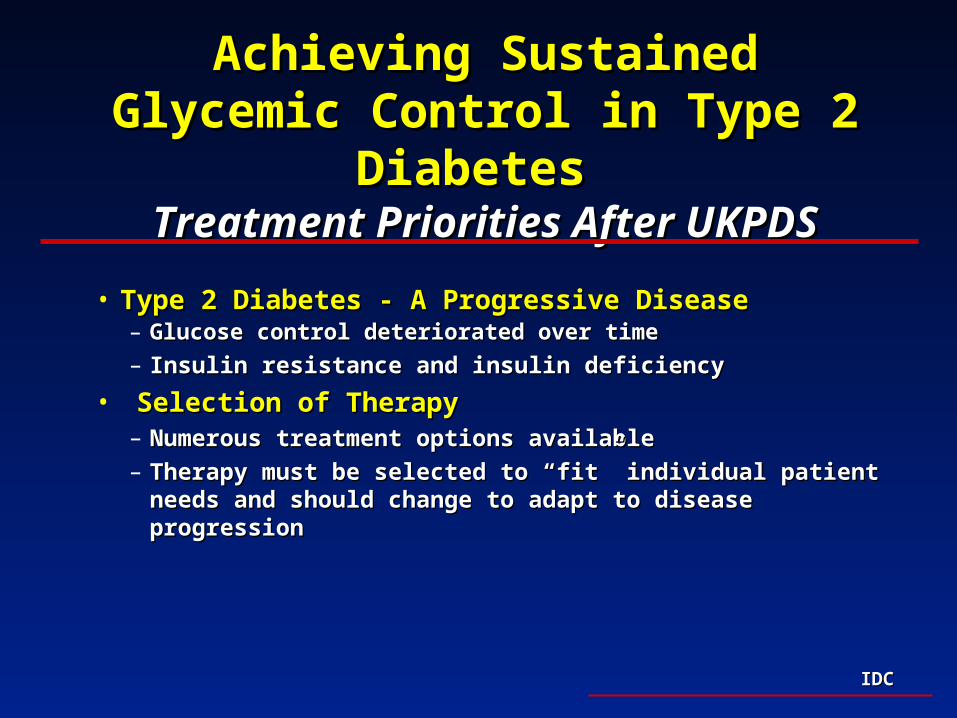
Achieving Sustained Glycemic Control Achieving Sustained Glycemic Control in Type 2 Diabetes in Type 2 Diabetes
Treatment Priorities After UKPDSTreatment Priorities After UKPDS
• Type 2 Diabetes - A Progressive DiseaseType 2 Diabetes - A Progressive Disease– Glucose control deteriorated over timeGlucose control deteriorated over time
– Insulin resistance and insulin deficiencyInsulin resistance and insulin deficiency
• Selection of TherapySelection of Therapy– Numerous treatment options availableNumerous treatment options available– Therapy must be selected to “fit” individual patient needs and Therapy must be selected to “fit” individual patient needs and
should change to adapt to disease progressionshould change to adapt to disease progression

IDCIDC
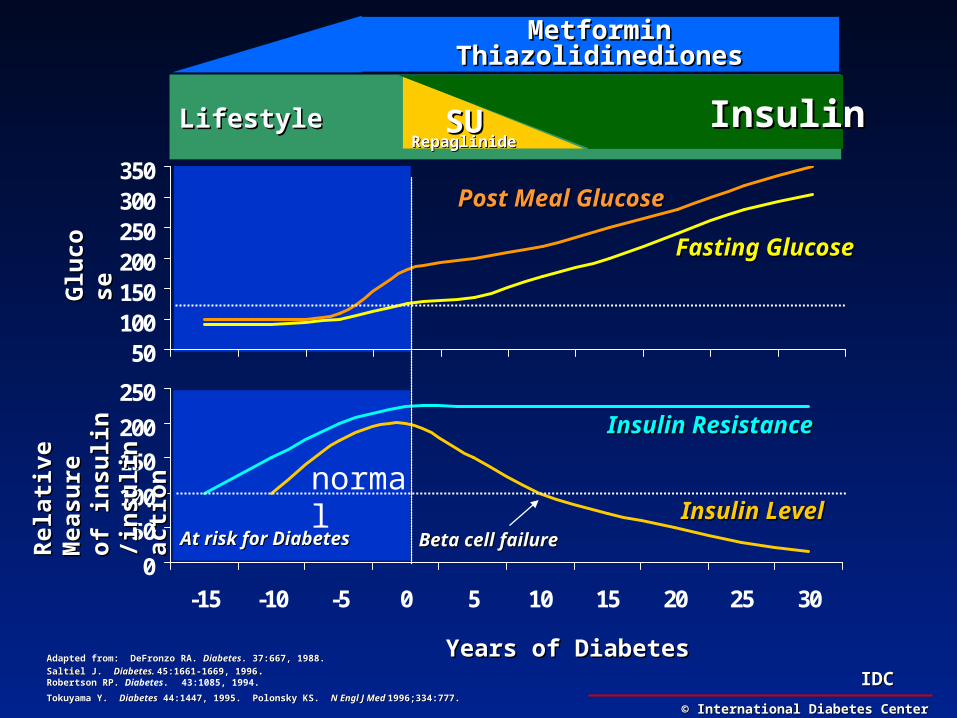
Pathogenesis of Type 2 DiabetesPathogenesis of Type 2 DiabetesInsulin Resistance and Insulin DeficiencyInsulin Resistance and Insulin Deficiency
DeFronzo RA. DeFronzo RA. DiabetesDiabetes. 37:667, 1988. . 37:667, 1988. Saltiel J. Saltiel J. Diabetes. Diabetes. 45:1661-1669, 199645:1661-1669, 1996. . Robertson RP. Robertson RP. Diabetes. 43:1085, 1994.
Tokuyama Y. Tokuyama Y. DiabetesDiabetes 44:1447, 1995. Polonsky KS. 44:1447, 1995. Polonsky KS. N Engl J Med N Engl J Med 1996;334:777.1996;334:777.
InsulinInsulinResistanceResistance
InsulinInsulinResistanceResistance
InsulinInsulinDeficiencyDeficiencyInsulinInsulin
DeficiencyDeficiency
Type 2 DiabetesType 2 DiabetesType 2 DiabetesType 2 Diabetes

IDCIDC
Natural History of Type 2 DiabetesNatural History of Type 2 Diabetes
0
50
100
150
200
250
-15 -10 -5 0 5 10 15 20 25 30
50100150200250300350
Years of DiabetesYears of Diabetes
Glu
cose
Glu
cose
Rel
ativ
e M
easu
reR
elat
ive
Mea
sure
of in
suli
n /i
nsu
lin
of
insu
lin
/ins
uli
n
acti
onac
tion
Insulin ResistanceInsulin Resistance
Insulin LevelInsulin Level
Fasting GlucoseFasting Glucose
Beta cell failureBeta cell failure
Post Meal GlucosePost Meal Glucose
© International Diabetes Center© International Diabetes Center
Adapted from: DeFronzo RA. Adapted from: DeFronzo RA. DiabetesDiabetes. 37:667, 1988. . 37:667, 1988.
Saltiel J. Saltiel J. Diabetes. Diabetes. 45:1661-1669, 199645:1661-1669, 1996. . Robertson RP. Robertson RP. Diabetes. 43:1085, 1994.
Tokuyama Y. Tokuyama Y. DiabetesDiabetes 44:1447, 1995. Polonsky KS. 44:1447, 1995. Polonsky KS. N Engl J Med N Engl J Med 1996;334:777.1996;334:777.
At risk for DiabetesAt risk for Diabetes
normal
IDCIDC
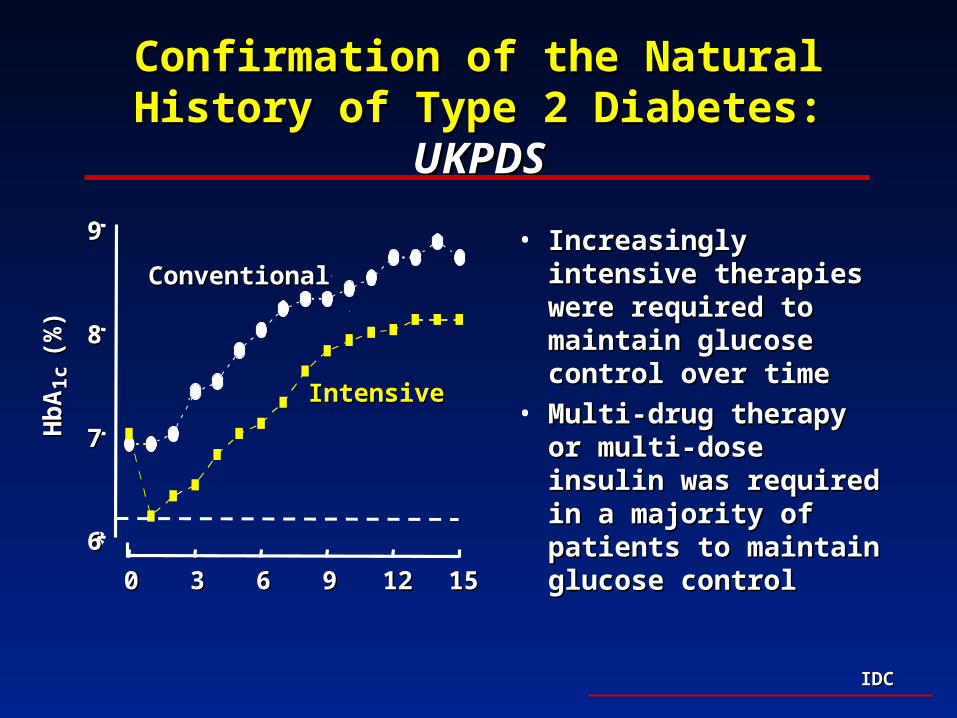
Confirmation of the Natural History of Confirmation of the Natural History of Type 2 Diabetes: Type 2 Diabetes: UKPDSUKPDS
66
77
88
99
00 33 66 99 1212 1515
Hb
AH
bA 1
c1c (
%)
(%)
ConventionalConventional
IntensiveIntensive
• Increasingly intensive Increasingly intensive therapies were required therapies were required to maintain glucose to maintain glucose control over timecontrol over time
• Multi-drug therapy or Multi-drug therapy or multi-dose insulin was multi-dose insulin was required in a majority of required in a majority of patients to maintain patients to maintain glucose control glucose control
IDCIDC
© International Diabetes Center© International Diabetes Center
Adapted from: DeFronzo RA. Adapted from: DeFronzo RA. DiabetesDiabetes. 37:667, 1988. . 37:667, 1988.
Saltiel J. Saltiel J. Diabetes. Diabetes. 45:1661-1669, 199645:1661-1669, 1996. . Robertson RP. Robertson RP. Diabetes. 43:1085, 1994.
Tokuyama Y. Tokuyama Y. DiabetesDiabetes 44:1447, 1995. Polonsky KS. 44:1447, 1995. Polonsky KS. N Engl J Med N Engl J Med 1996;334:777.1996;334:777.
LifestyleLifestyle SUSURepaglinideRepaglinide
InsulinInsulin
MetforminMetforminThiazolidinedionesThiazolidinediones
0
50
100
150
200
250
-15 -10 -5 0 5 10 15 20 25 30
50100150200250300350
Years of DiabetesYears of Diabetes
Glu
cose
Glu
cose
Rel
ativ
e M
easu
reR
elat
ive
Mea
sure
of in
suli
n /i
nsu
lin
of
insu
lin
/ins
uli
n
acti
onac
tion
Insulin ResistanceInsulin Resistance
Insulin LevelInsulin Level
Fasting GlucoseFasting Glucose
Beta cell failureBeta cell failure
Post Meal GlucosePost Meal Glucose
At risk for DiabetesAt risk for Diabetes
normal
IDCIDC
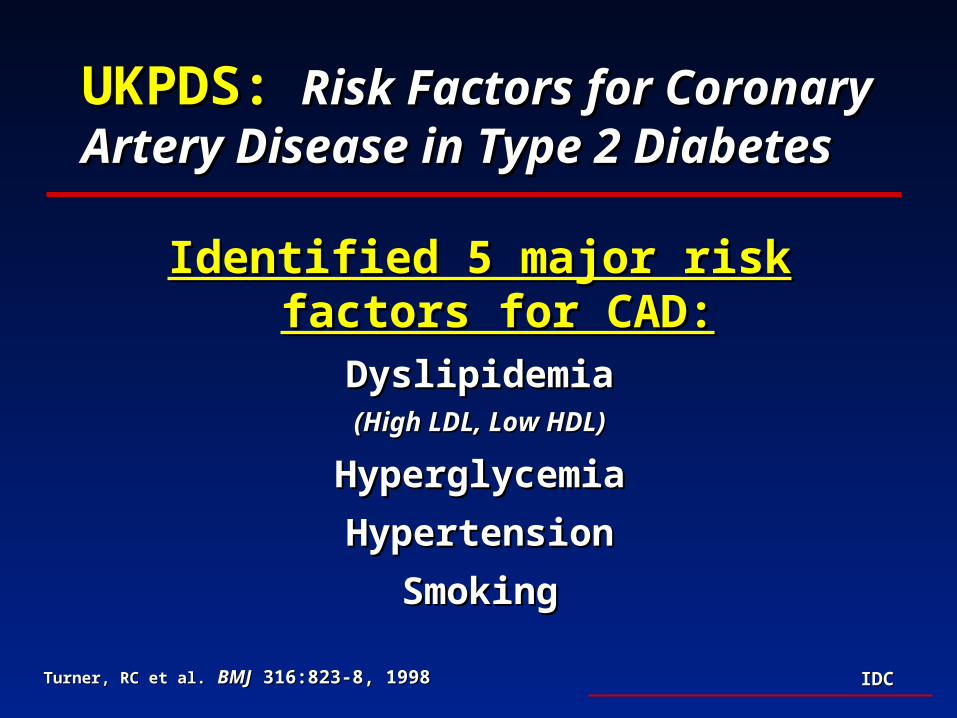
UKPDS:UKPDS: Risk Factors for Coronary Risk Factors for Coronary Artery Disease in Type 2 DiabetesArtery Disease in Type 2 Diabetes
Identified 5 major risk factors for CAD:Identified 5 major risk factors for CAD:DyslipidemiaDyslipidemia
(High LDL, Low HDL)(High LDL, Low HDL)
HyperglycemiaHyperglycemia
HypertensionHypertension
SmokingSmoking
Turner, RC et al.Turner, RC et al. BMJBMJ 316:823-8, 1998 316:823-8, 1998
IDCIDC
UKPDS: Intensive Blood Pressure Control UKPDS: Intensive Blood Pressure Control in Type 2 Diabetesin Type 2 Diabetes
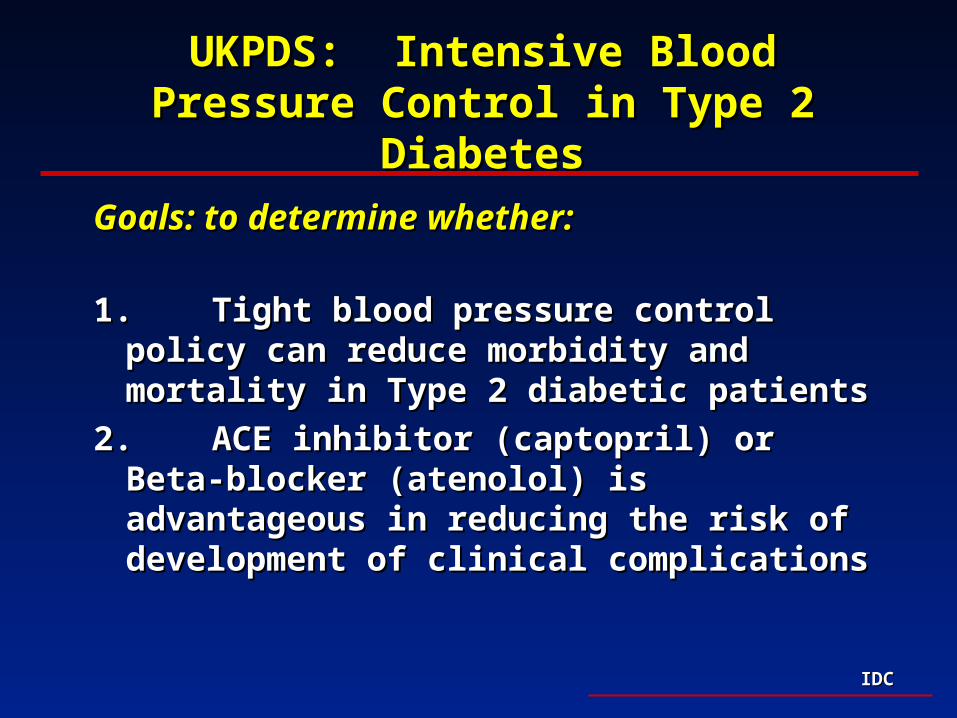
Goals: to determine whether:Goals: to determine whether:
1.1. Tight blood pressure control policy can reduce Tight blood pressure control policy can reduce morbidity and mortality in Type 2 diabetic morbidity and mortality in Type 2 diabetic patientspatients
2.2. ACE inhibitor (captopril) or Beta-blocker ACE inhibitor (captopril) or Beta-blocker (atenolol) is advantageous in reducing the risk (atenolol) is advantageous in reducing the risk of development of clinical complicationsof development of clinical complications
IDCIDC
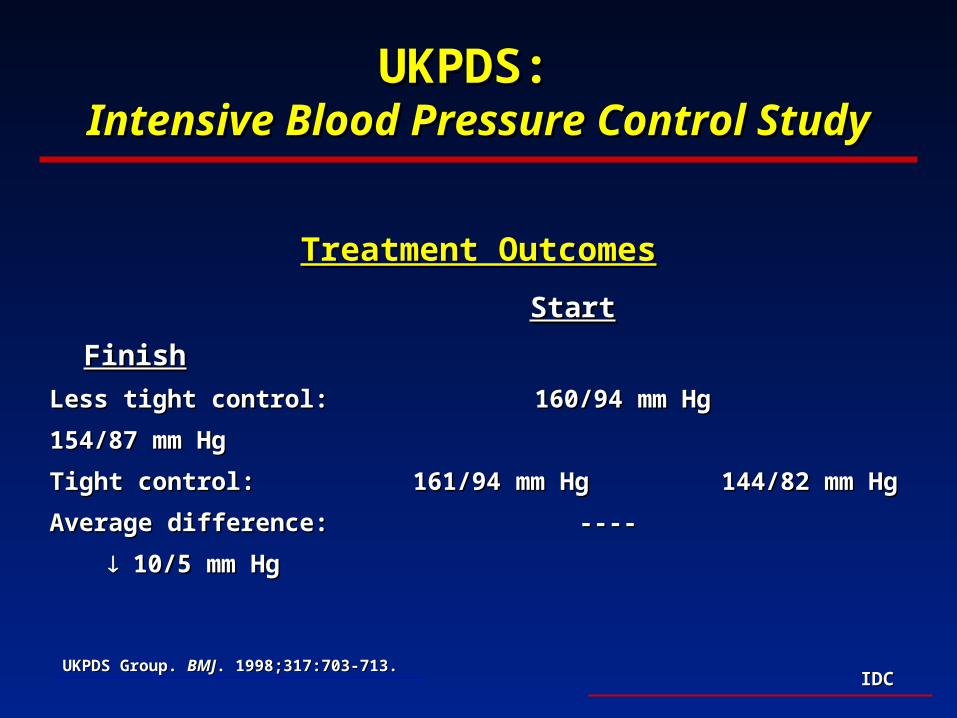
Treatment OutcomesTreatment Outcomes
StartStart FinishFinish
Less tight control: 160/94 mm Hg 154/87 mm HgLess tight control: 160/94 mm Hg 154/87 mm Hg
Tight control:Tight control: 161/94 mm Hg 144/82 mm Hg 161/94 mm Hg 144/82 mm Hg
Average difference: ---- Average difference: ---- 10/5 mm Hg 10/5 mm Hg
UKPDS: UKPDS: Intensive Blood Pressure Control StudyIntensive Blood Pressure Control Study
UKPDS Group. UKPDS Group. BMJBMJ. 1998;317:703-713.. 1998;317:703-713.
IDCIDC
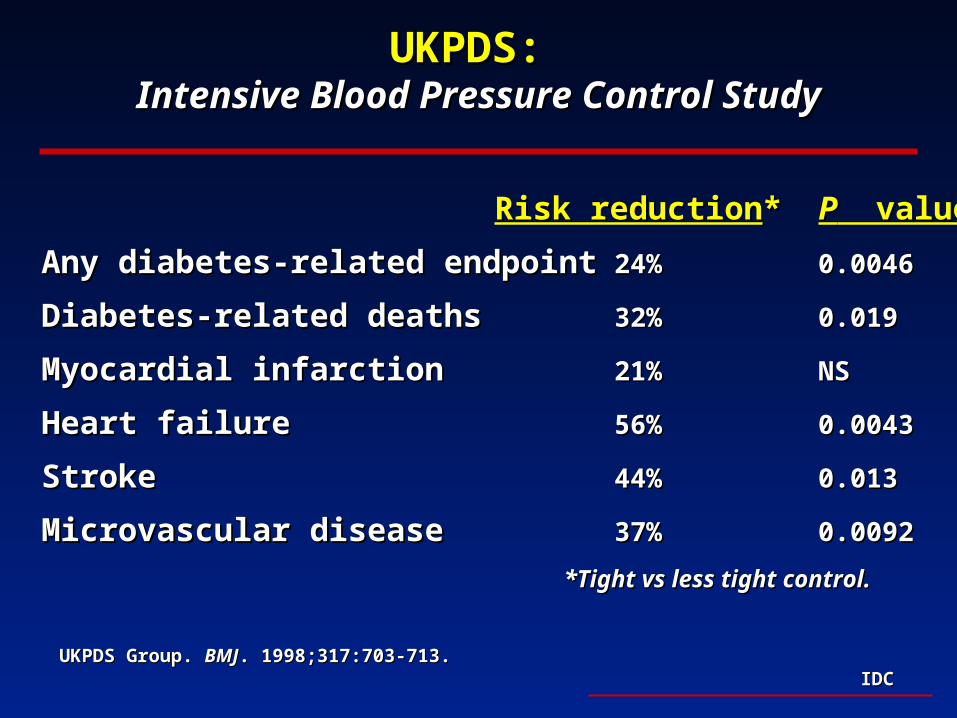
UKPDS: UKPDS: Intensive Blood Pressure Control StudyIntensive Blood Pressure Control Study
UKPDS Group. UKPDS Group. BMJBMJ. 1998;317:703-713.. 1998;317:703-713.
Risk reductionRisk reduction** PP value value
Any diabetes-related endpointAny diabetes-related endpoint 24%24% 0.00460.0046
Diabetes-related deathsDiabetes-related deaths 32%32% 0.0190.019
Myocardial infarctionMyocardial infarction 21%21% NSNS
Heart failureHeart failure 56%56% 0.00430.0043
StrokeStroke 44%44% 0.0130.013
Microvascular diseaseMicrovascular disease 37%37% 0.00920.0092
*Tight vs less tight control.*Tight vs less tight control.
IDCIDC
UKPDS: Treatment of HypertensionUKPDS: Treatment of Hypertension
• ACE inhibitor ACE inhibitor (captopril)(captopril) and beta-blocker and beta-blocker (atenolol)(atenolol) were equally effective in reducing the were equally effective in reducing the risk of secondary complicationsrisk of secondary complications
• Continuous relationship between systolic BP Continuous relationship between systolic BP and diabetes related complications above 130 and diabetes related complications above 130 mm Hgmm Hg
IDCIDC
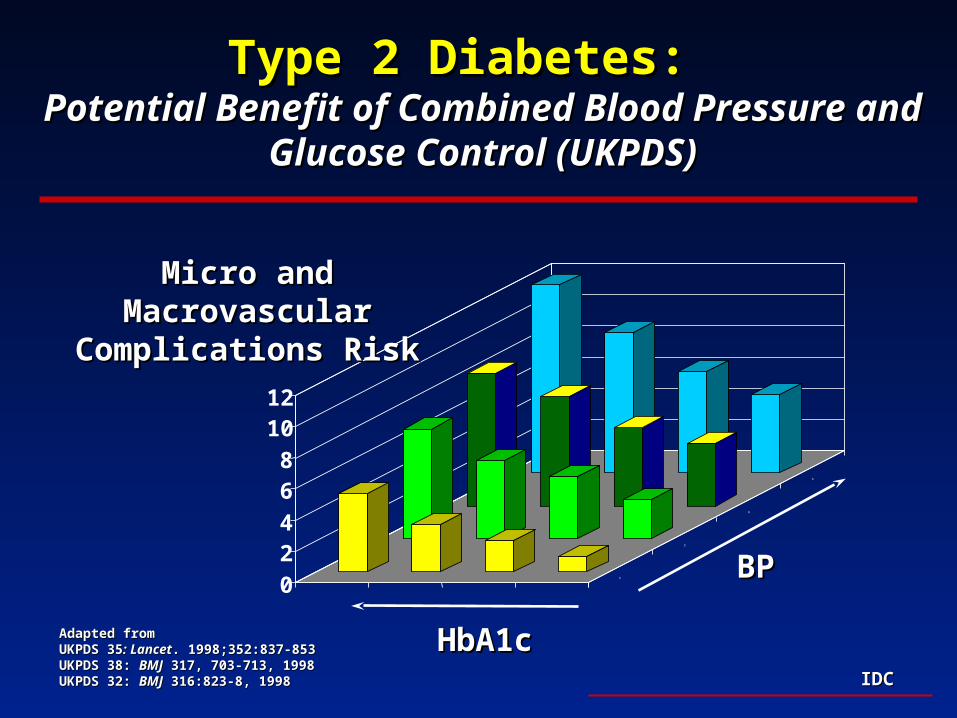
Type 2 Diabetes:Type 2 Diabetes: Potential Benefit of Combined Blood Pressure and Potential Benefit of Combined Blood Pressure and
Glucose Control (UKPDS)Glucose Control (UKPDS)
0
24
68
1012
1
2
3
4
HbA1cHbA1c
BPBP
Micro and Macrovascular Micro and Macrovascular Complications RiskComplications Risk
Adapted fromAdapted fromUKPDS 35UKPDS 35: Lancet: Lancet. 1998;352:837-853. 1998;352:837-853UKPDS 38: UKPDS 38: BMJBMJ 317, 703-713, 1998 317, 703-713, 1998UKPDS 32: UKPDS 32: BMJBMJ 316:823-8, 1998 316:823-8, 1998

IDCIDC
Implications of UKPDSImplications of UKPDSPriorities of CarePriorities of Care
• Intensive glycemic control in Type 2 diabetesIntensive glycemic control in Type 2 diabetes– ESSENTIAL to reduce risk of microvascular diseaseESSENTIAL to reduce risk of microvascular disease
– DOES NOT increase risk of macrovascular diseaseDOES NOT increase risk of macrovascular disease
– Continuous relationship of glucose with complicationsContinuous relationship of glucose with complications
• Macrovascular disease preventionMacrovascular disease prevention – Requires treatment of cardiovascular risk factors Requires treatment of cardiovascular risk factors
including hypertension and dyslipidemiaincluding hypertension and dyslipidemia

IDCIDC
Diabetes Self Management SkillsDiabetes Self Management SkillsMedical Nutrition Therapy Medical Nutrition Therapy && Activity Plan Activity Plan
Patient EducationPatient EducationGlucose MonitoringGlucose Monitoring
Diabetes Self Management SkillsDiabetes Self Management SkillsMedical Nutrition Therapy Medical Nutrition Therapy && Activity Plan Activity Plan
Patient EducationPatient EducationGlucose MonitoringGlucose Monitoring
Type 2 DiabetesType 2 DiabetesFasting BG Fasting BG >> 126 mg/dL126 mg/dLCasual BGCasual BG >> 200 mg/dL 200 mg/dL
Type 2 DiabetesType 2 DiabetesFasting BG Fasting BG >> 126 mg/dL126 mg/dLCasual BGCasual BG >> 200 mg/dL 200 mg/dL
HyperglycemiaHyperglycemiaHyperglycemiaHyperglycemia Lipid DisordersLipid DisordersLipid DisordersLipid Disorders HypertensionHypertensionHypertensionHypertension ComplicationsComplicationsComplicationsComplications Other ComponentsOther Componentsof Careof Care
Other ComponentsOther Componentsof Careof Care
Systematic Approach to Management of Systematic Approach to Management of Type 2 DiabetesType 2 Diabetes
IDCIDC
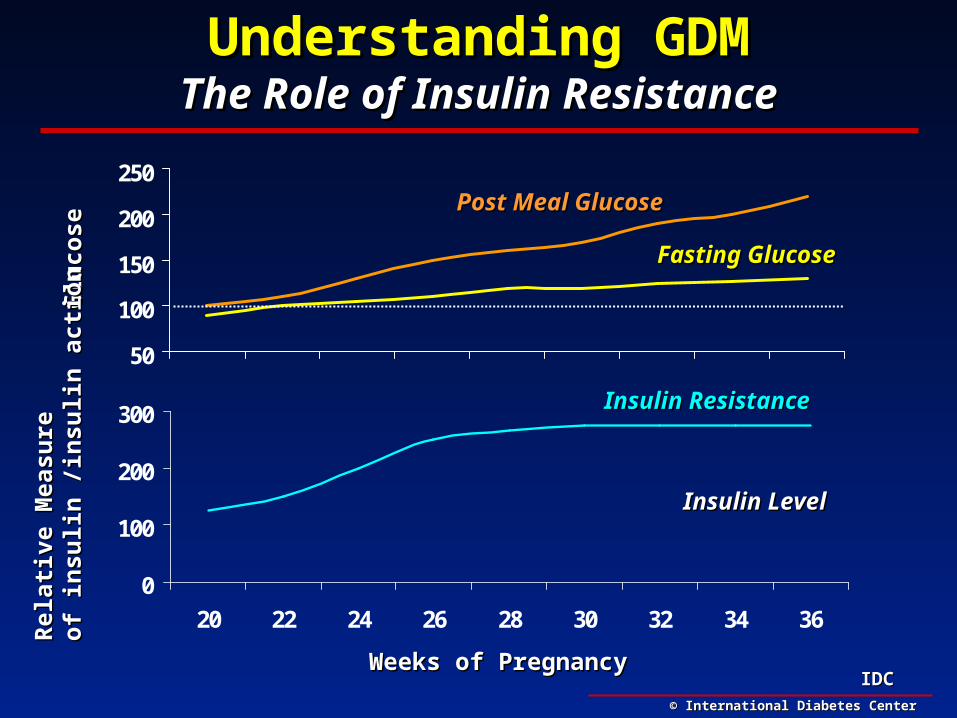
Understanding GDMUnderstanding GDMThe Role of Insulin ResistanceThe Role of Insulin Resistance
0
100
200
300
20 22 24 26 28 30 32 34 36
50
100
150
200
250
Weeks of PregnancyWeeks of Pregnancy
Glu
cose
Glu
cose
Rel
ativ
e M
easu
reR
elat
ive
Mea
sure
of in
suli
n /i
nsu
lin
act
ion
of in
suli
n /i
nsu
lin
act
ion
Insulin ResistanceInsulin Resistance
Insulin LevelInsulin Level
Fasting GlucoseFasting Glucose
Post Meal GlucosePost Meal Glucose
© International Diabetes Center© International Diabetes Center
IDCIDC
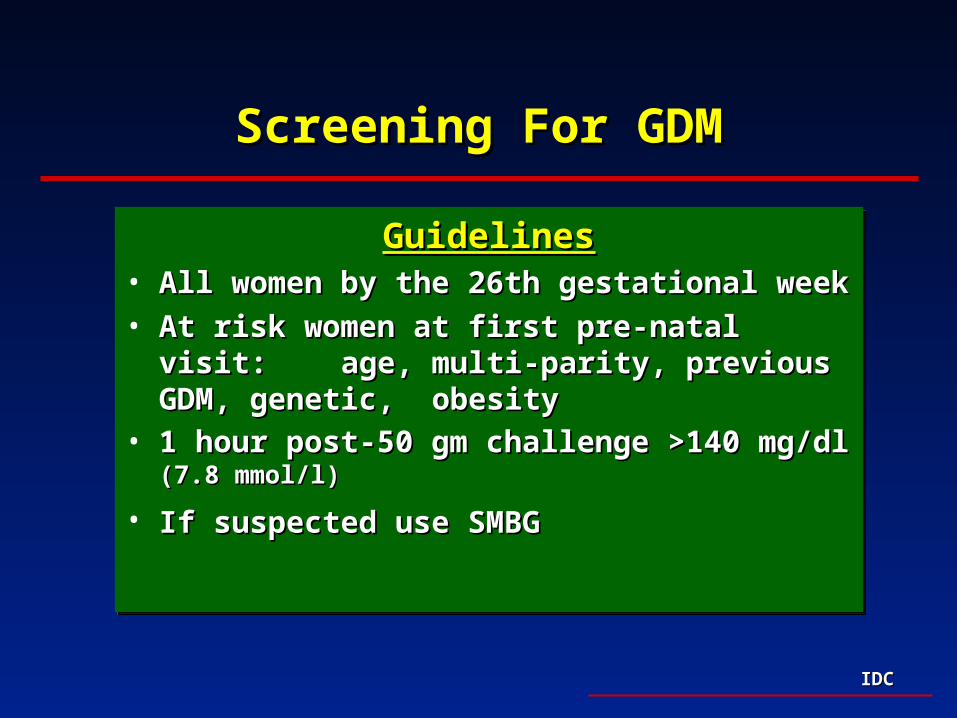
Screening For GDMScreening For GDM
GuidelinesGuidelines• All women by the 26th gestational weekAll women by the 26th gestational week
• At risk women at first pre-natal visit: At risk women at first pre-natal visit: age, multi-parity, previous GDM, genetic, age, multi-parity, previous GDM, genetic, obesityobesity
• 1 hour post-50 gm challenge >140 mg/dl 1 hour post-50 gm challenge >140 mg/dl (7.8 mmol/l)(7.8 mmol/l)
• If suspected use SMBGIf suspected use SMBG
IDCIDC
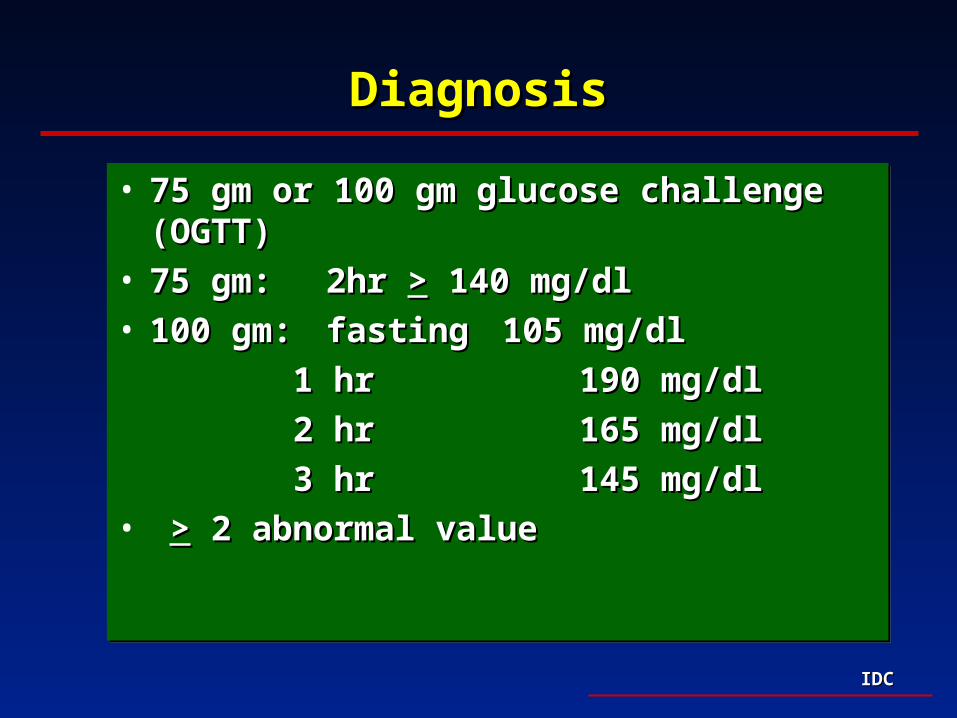
DiagnosisDiagnosis
• 75 gm or 100 gm glucose challenge (OGTT)75 gm or 100 gm glucose challenge (OGTT)• 75 gm: 75 gm: 2hr 2hr >> 140 mg/dl 140 mg/dl• 100 gm: 100 gm: fasting fasting 105 mg/dl105 mg/dl
1 hr 1 hr 190 mg/dl190 mg/dl
2 hr 2 hr 165 mg/dl165 mg/dl
3 hr 3 hr 145 mg/dl145 mg/dl• >> 2 abnormal value 2 abnormal value
IDCIDC
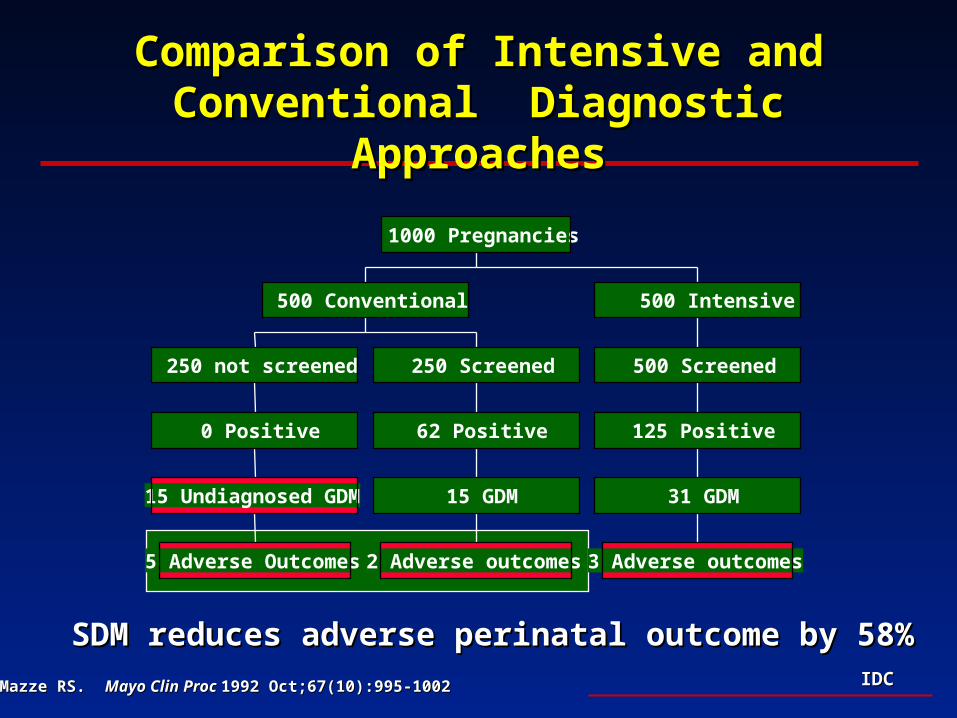
5 Adverse Outcomes
15 Undiagnosed GDM
0 Positive
250 not screened
2 Adverse outcomes
15 GDM
62 Positive
250 Screened
500 Conventional
3 Adverse outcomes
31 GDM
125 Positive
500 Screened
500 Intensive
1000 Pregnancies
Comparison of Intensive and Conventional Comparison of Intensive and Conventional Diagnostic ApproachesDiagnostic Approaches
SDM reduces adverse perinatal outcome by 58%SDM reduces adverse perinatal outcome by 58%
Mazze RS. Mazze RS. Mayo Clin Proc Mayo Clin Proc 1992 Oct;67(10):995-1002 1992 Oct;67(10):995-1002

IDCIDC
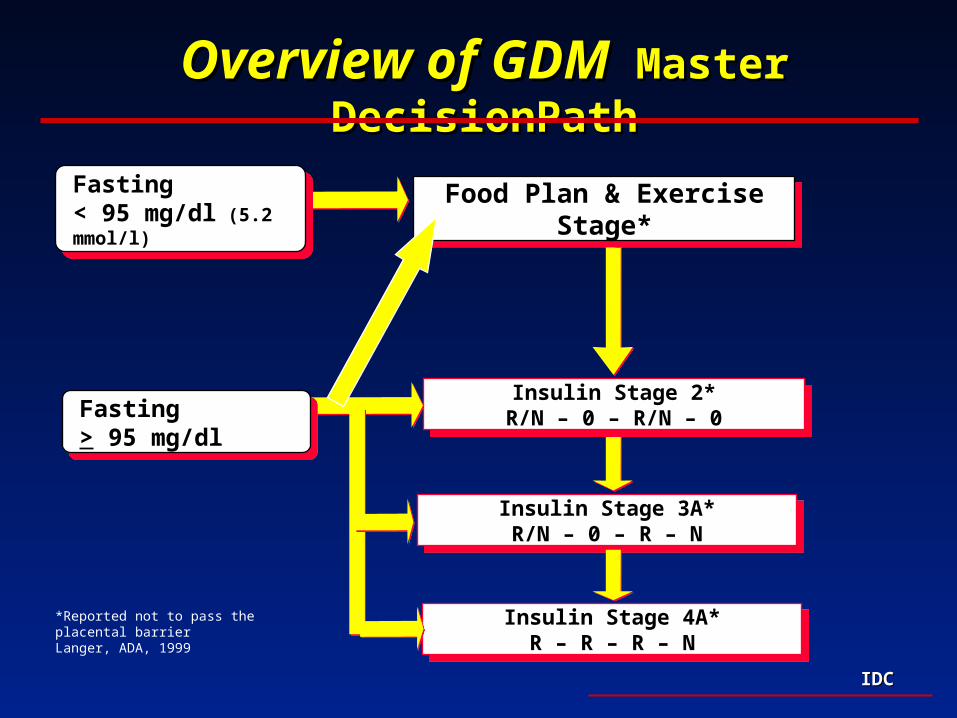
TreatmentTreatment
GuidelinesGuidelines
• FPG target 70-90mg/dl (<5mmol/L)FPG target 70-90mg/dl (<5mmol/L)
• CPG target <120mg/dl (<6.7mmol/L)CPG target <120mg/dl (<6.7mmol/L)
• SMBG all patientsSMBG all patients
IDCIDC
Overview of GDMOverview of GDM Master DecisionPath Master DecisionPath
Insulin Stage 3A*R/N – 0 – R – N
Insulin Stage 3A*R/N – 0 – R – N
Insulin Stage 2*R/N – 0 – R/N – 0
Insulin Stage 2*R/N – 0 – R/N – 0
Insulin Stage 4A*R – R – R – N
Insulin Stage 4A*R – R – R – N
Fasting < 95 mg/dl (5.2 mmol/l)
Fasting < 95 mg/dl (5.2 mmol/l) Food Plan & Exercise Stage*Food Plan & Exercise Stage*
Fasting > 95 mg/dl Fasting > 95 mg/dl
*Reported not to pass the placental barrierLanger, ADA, 1999

IDCIDC
Summary: Gestational DiabetesSummary: Gestational Diabetes
• All pregnant women should be screenedAll pregnant women should be screened
• Tight glycemic controlTight glycemic control
IDCIDC
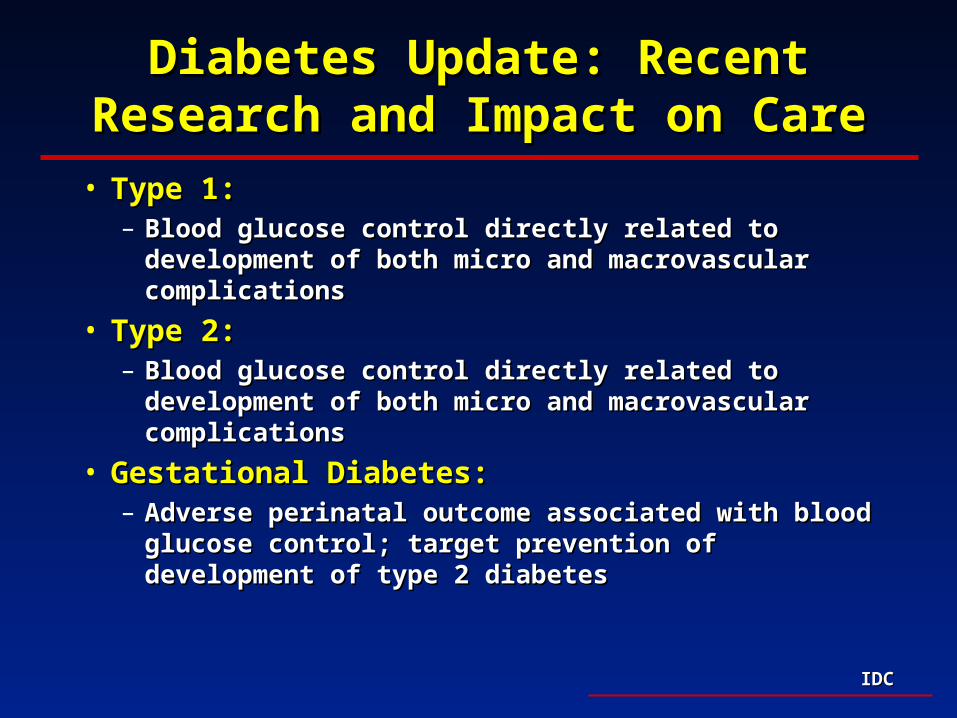
Diabetes Update: Recent Research Diabetes Update: Recent Research and Impact on Careand Impact on Care
• Type 1:Type 1:
– Blood glucose control directly related to development Blood glucose control directly related to development of both micro and macrovascular complicationsof both micro and macrovascular complications
• Type 2:Type 2:
– Blood glucose control directly related to development Blood glucose control directly related to development of both micro and macrovascular complicationsof both micro and macrovascular complications
• Gestational Diabetes:Gestational Diabetes:
– Adverse perinatal outcome associated with blood Adverse perinatal outcome associated with blood glucose control; target prevention of development of glucose control; target prevention of development of type 2 diabetestype 2 diabetes