Embed Size (px)
Citation preview
IDBI Bank Ltd.
Consolidated Pillar III Disclosures (September 30, 2016)
1. Scope of Application and Capital Adequacy
Table DF-1: Scope of Application
Accounting and regulatory consolidation
For the purpose of financial reporting, the Bank consolidates its subsidiaries in accordance with Accounting
Standard (AS) 21, Consolidated Financial Statements, on a line-by-line basis by adding together like items
of assets, liabilities, income and expenditure. Investments in associates are accounted for by the equity
method in accordance with AS-23, “Accounting for Investments in Associates in Consolidated Financial
Statements”.
For the purpose of consolidated prudential regulatory reporting, the consolidated Bank includes all group
entities under its control, except group companies which are engaged in insurance business and any non-
financial activities. Details of subsidiaries and associates of the Bank along with the consolidation status for
accounting and regulatory purposes are given below:
Name of the head of the banking group to which the framework applies: IDBI Bank Ltd.
(i) Qualitative Disclosures
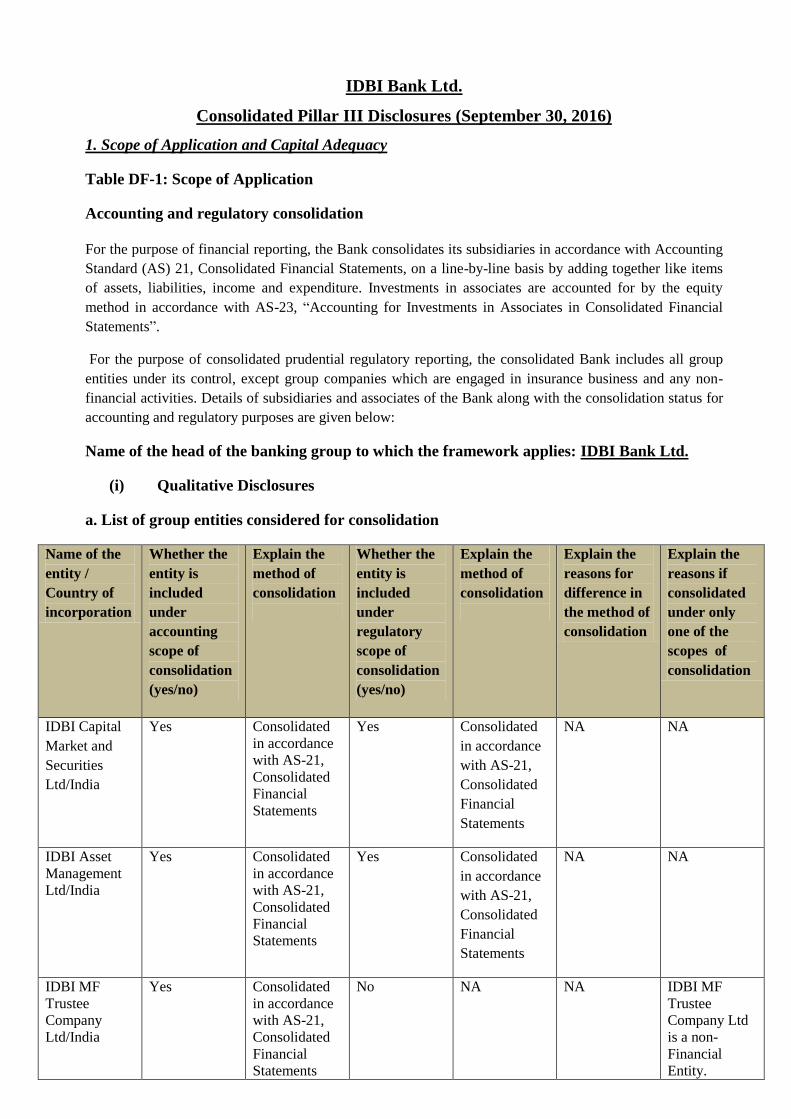
a. List of group entities considered for consolidation
Name of the
entity /
Country of
incorporation
Whether the
entity is
included
under
accounting
scope of
consolidation
(yes/no)
Explain the
method of
consolidation
Whether the
entity is
included
under
regulatory
scope of
consolidation
(yes/no)
Explain the
method of
consolidation
Explain the
reasons for
difference in
the method of
consolidation
Explain the
reasons if
consolidated
under only
one of the
scopes of
consolidation
IDBI Capital
Market and
Securities
Ltd/India
Yes Consolidated
in accordance
with AS-21,
Consolidated
Financial
Statements
Yes
Consolidated
in accordance
with AS-21,
Consolidated
Financial
Statements
NA NA
IDBI Asset
Management
Ltd/India
Yes Consolidated
in accordance
with AS-21,
Consolidated
Financial
Statements
Yes
Consolidated
in accordance
with AS-21,
Consolidated
Financial
Statements
NA NA
IDBI MF
Trustee
Company
Ltd/India
Yes Consolidated
in accordance
with AS-21,
Consolidated
Financial
Statements
No
NA NA IDBI MF
Trustee
Company Ltd
is a non-
Financial
Entity.
Consolidated Pillar III Disclosures (September 30, 2016)
2
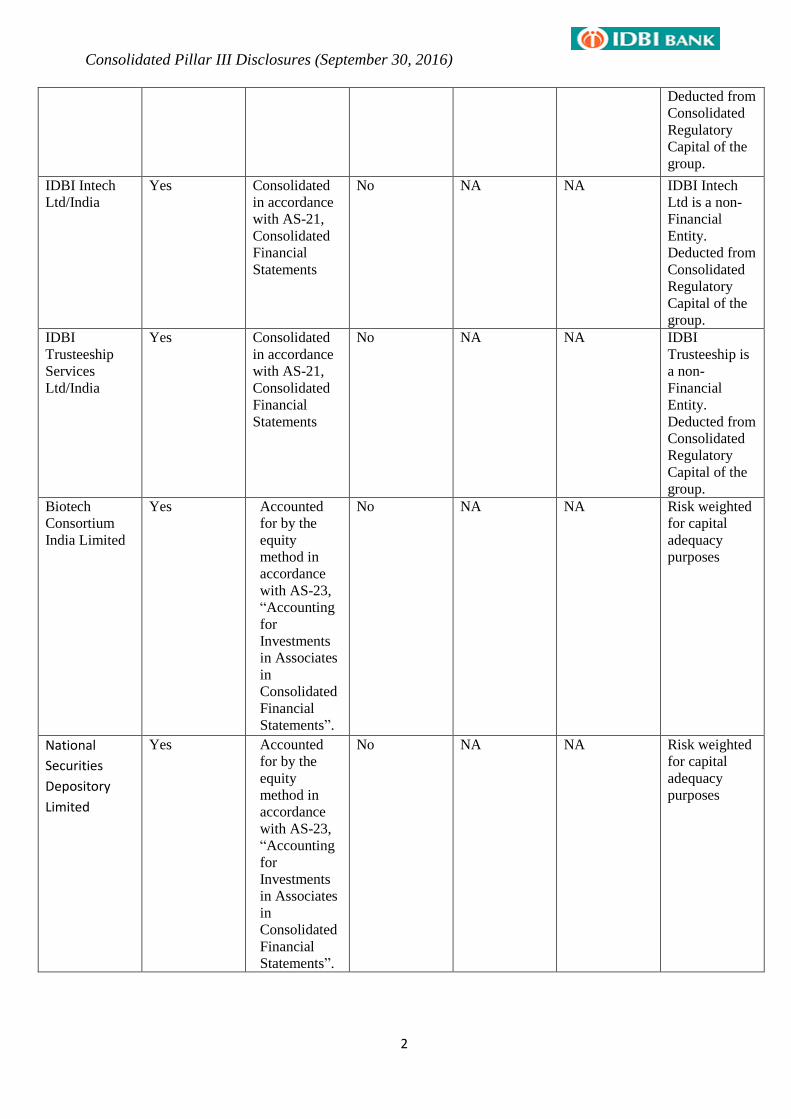
Deducted from
Consolidated
Regulatory
Capital of the
group.
IDBI Intech
Ltd/India
Yes Consolidated
in accordance
with AS-21,
Consolidated
Financial
Statements
No NA NA IDBI Intech
Ltd is a non-
Financial
Entity.
Deducted from
Consolidated
Regulatory
Capital of the
group.
IDBI
Trusteeship
Services
Ltd/India
Yes
Consolidated
in accordance
with AS-21,
Consolidated
Financial
Statements
No
NA NA IDBI
Trusteeship is
a non-
Financial
Entity.
Deducted from
Consolidated
Regulatory
Capital of the
group.
Biotech
Consortium
India Limited
Yes Accounted
for by the
equity
method in
accordance
with AS-23,
“Accounting
for
Investments
in Associates
in
Consolidated
Financial
Statements”.
No NA NA Risk weighted
for capital
adequacy
purposes
National
Securities
Depository
Limited
Yes Accounted
for by the
equity
method in
accordance
with AS-23,
“Accounting
for
Investments
in Associates
in
Consolidated
Financial
Statements”.
No NA NA Risk weighted
for capital
adequacy
purposes
Consolidated Pillar III Disclosures (September 30, 2016)
3
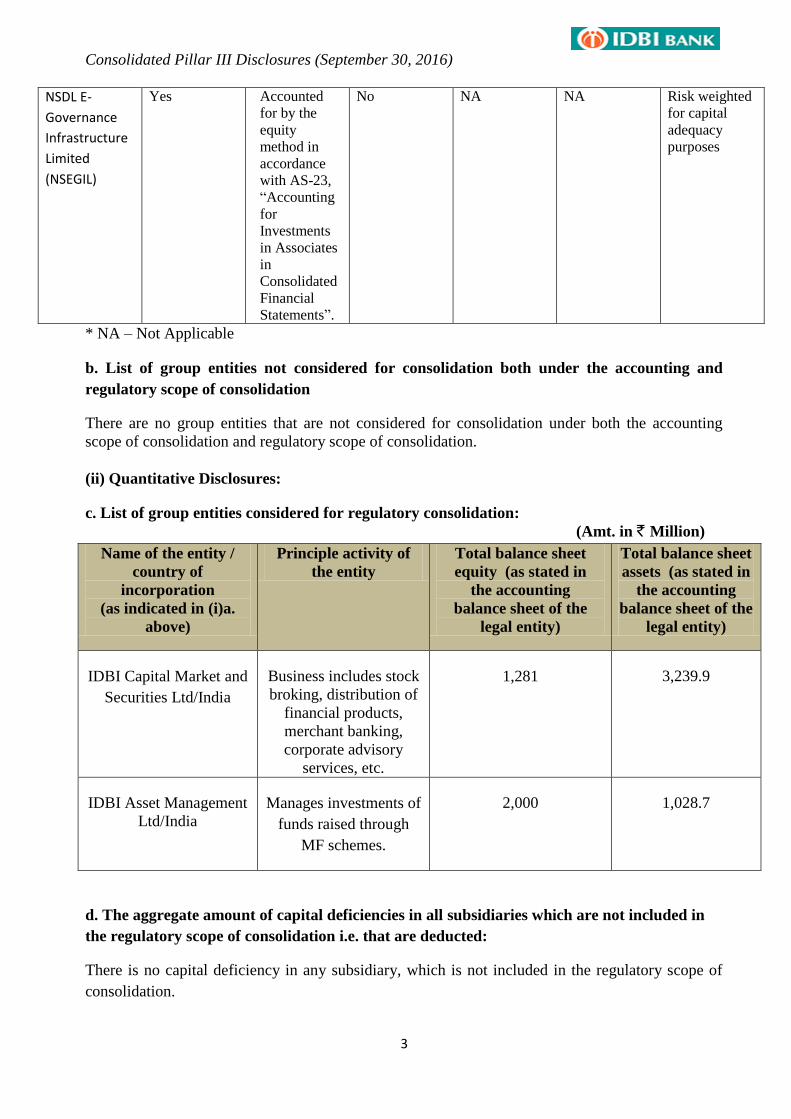
NSDL E-
Governance
Infrastructure
Limited
(NSEGIL)
Yes Accounted
for by the
equity
method in
accordance
with AS-23,
“Accounting
for
Investments
in Associates
in
Consolidated
Financial
Statements”.
No NA NA Risk weighted
for capital
adequacy
purposes
* NA – Not Applicable
b. List of group entities not considered for consolidation both under the accounting and
regulatory scope of consolidation
There are no group entities that are not considered for consolidation under both the accounting
scope of consolidation and regulatory scope of consolidation.
(ii) Quantitative Disclosures:
c. List of group entities considered for regulatory consolidation:
(Amt. in ` Million)
Name of the entity /
country of
incorporation
(as indicated in (i)a.
above)
Principle activity of
the entity
Total balance sheet
equity (as stated in
the accounting
balance sheet of the
legal entity)
Total balance sheet
assets (as stated in
the accounting
balance sheet of the
legal entity)
IDBI Capital Market and
Securities Ltd/India
Business includes stock
broking, distribution of
financial products,
merchant banking,
corporate advisory
services, etc.
1,281
3,239.9
IDBI Asset Management
Ltd/India
Manages investments of
funds raised through
MF schemes.
2,000 1,028.7
d. The aggregate amount of capital deficiencies in all subsidiaries which are not included in
the regulatory scope of consolidation i.e. that are deducted:
There is no capital deficiency in any subsidiary, which is not included in the regulatory scope of
consolidation.
Consolidated Pillar III Disclosures (September 30, 2016)
4
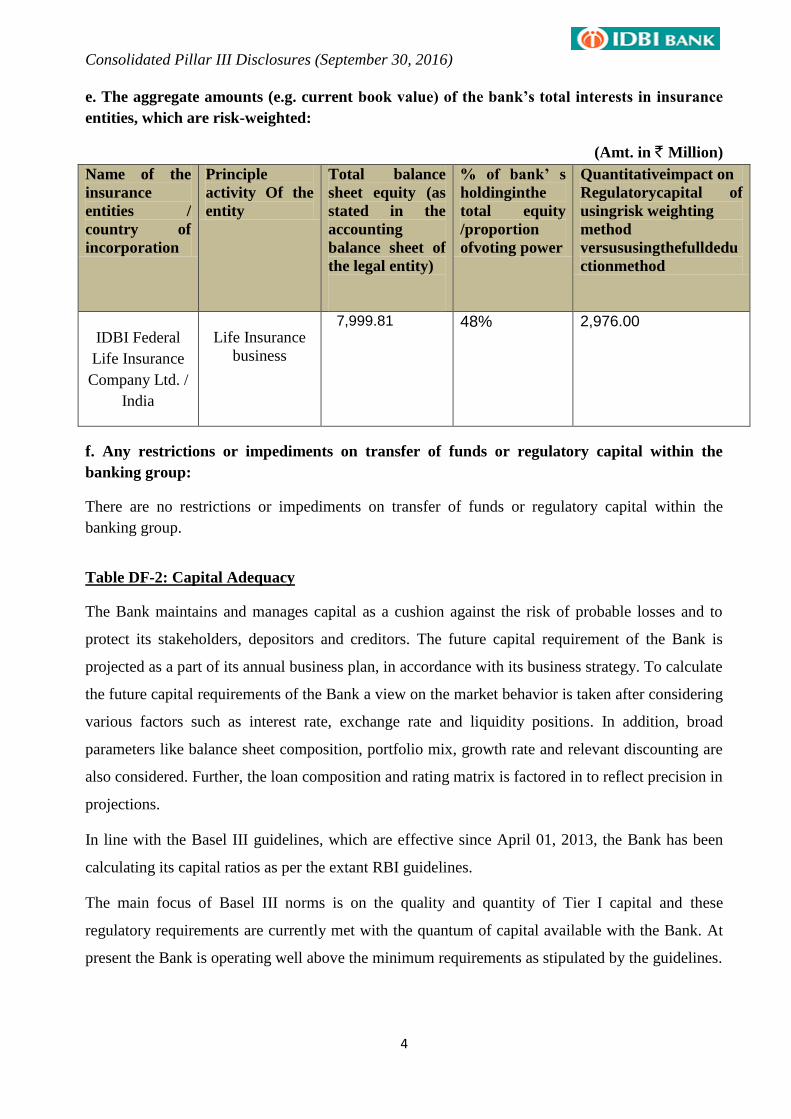
e. The aggregate amounts (e.g. current book value) of the bank’s total interests in insurance
entities, which are risk-weighted:
(Amt. in ` Million)
Name of the
insurance
entities /
country of
incorporation
Principle
activity Of the
entity
Total balance
sheet equity (as
stated in the
accounting
balance sheet of
the legal entity)
% of bank’ s
holdinginthe
total equity
/proportion
ofvoting power
Quantitativeimpact on
Regulatorycapital of
usingrisk weighting
method
versususingthefulldedu
ctionmethod
IDBI Federal
Life Insurance
Company Ltd. /
India
Life Insurance
business
7,999.81 48% 2,976.00
f. Any restrictions or impediments on transfer of funds or regulatory capital within the
banking group:
There are no restrictions or impediments on transfer of funds or regulatory capital within the
banking group.
Table DF-2: Capital Adequacy
The Bank maintains and manages capital as a cushion against the risk of probable losses and to
protect its stakeholders, depositors and creditors. The future capital requirement of the Bank is
projected as a part of its annual business plan, in accordance with its business strategy. To calculate
the future capital requirements of the Bank a view on the market behavior is taken after considering
various factors such as interest rate, exchange rate and liquidity positions. In addition, broad
parameters like balance sheet composition, portfolio mix, growth rate and relevant discounting are
also considered. Further, the loan composition and rating matrix is factored in to reflect precision in
projections.
In line with the Basel III guidelines, which are effective since April 01, 2013, the Bank has been
calculating its capital ratios as per the extant RBI guidelines.
The main focus of Basel III norms is on the quality and quantity of Tier I capital and these
regulatory requirements are currently met with the quantum of capital available with the Bank. At
present the Bank is operating well above the minimum requirements as stipulated by the guidelines.
Consolidated Pillar III Disclosures (September 30, 2016)
5
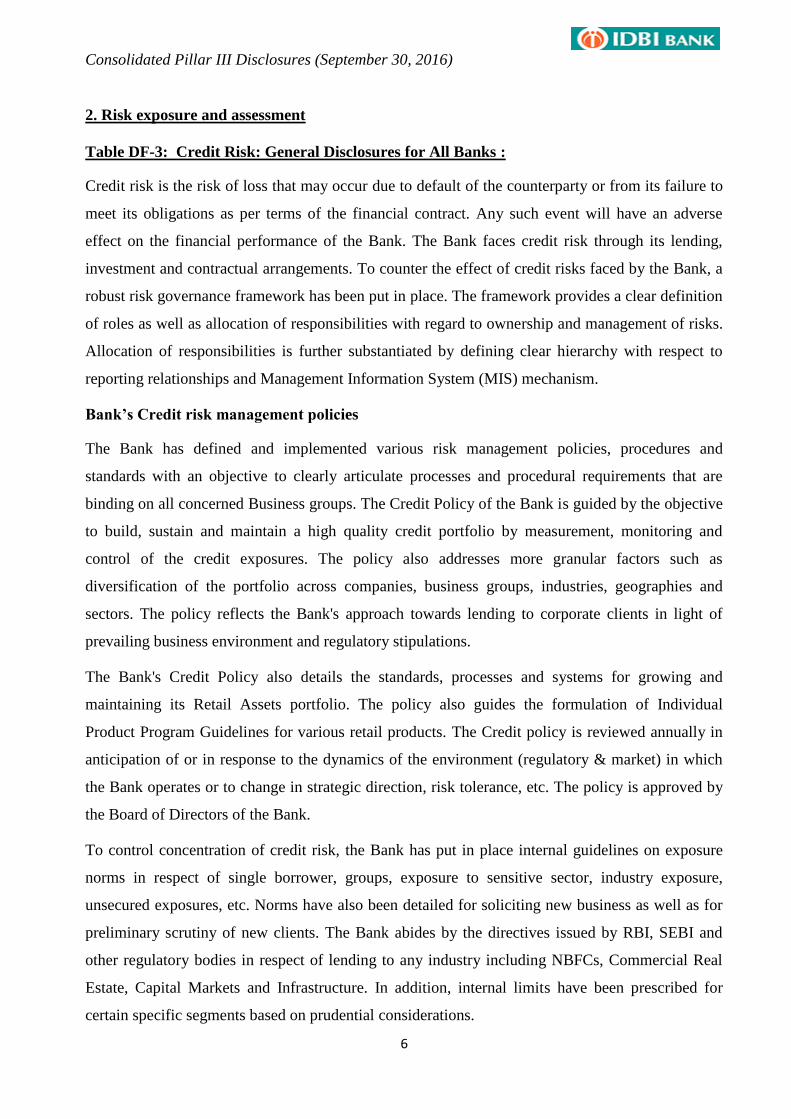
The Standalone CRAR position of the Bank as on September 30, 2016, is as below:
CRAR Basel III
CET 1 7.367%
Tier 1 8.676%
Tier 2 2.964%
Total( Tier 1 + Tier 2) 11.640%
For identification, quantification and estimation of current and future risks, the Bank has a Board
approved Internal Capital Adequacy Assessment Process (ICAAP) policy. The policy covers the
process for addressing such risks, measuring their impact on the financial position of the Bank and
formulating appropriate strategies for their containment & mitigation; thereby maintaining an
adequate level of capital. The ICAAP exercise is conducted periodically to determine that the Bank
has adequate capital to meet regulatory requirements in line with its business requirements. The
Bank also has a comprehensive stress test policy covering regulatory stress conditions to give an
insight into the impact of severe but plausible stress scenarios on the Bank's risk profile and capital
position. The stress test exercises are carried out regularly based on the board approved stress
testing framework incorporating RBI guidelines on Stress testing dated December 02, 2013. The
impact of stress scenarios on the profitability and capital adequacy of the Bank are analyzed. The
result of the exercise is reported to the suitable board level committee(s).
The Consolidated CRAR position, as on September 30, 2016 is as follows:
(Amt. in ` Million)
Capital requirement
Credit Risk Capital:
Portfolios subject to standardised approach 2,66,166.81
Securitisation 64.82
Market Risk Capital:
Standardised duration approach 22,259.03
Interest Rate Risk 9,093.01
Foreign exchange Risk (including Gold) 360.00
Equity Risk 12,806.02
Operational Risk Capital:
Basic indicator approach 14,432.36
Total Minimum Capital required
Common Equity Tier 1, Tier 1 and Total capital ratio:
CET 1 7.443%
Tier 1 8.757%
Tier 2 2.967%
Total( Tier 1 + Tier 2) 11.724%
Consolidated Pillar III Disclosures (September 30, 2016)
6
2. Risk exposure and assessment
Table DF-3: Credit Risk: General Disclosures for All Banks :
Credit risk is the risk of loss that may occur due to default of the counterparty or from its failure to
meet its obligations as per terms of the financial contract. Any such event will have an adverse
effect on the financial performance of the Bank. The Bank faces credit risk through its lending,
investment and contractual arrangements. To counter the effect of credit risks faced by the Bank, a
robust risk governance framework has been put in place. The framework provides a clear definition
of roles as well as allocation of responsibilities with regard to ownership and management of risks.
Allocation of responsibilities is further substantiated by defining clear hierarchy with respect to
reporting relationships and Management Information System (MIS) mechanism.
Bank’s Credit risk management policies
The Bank has defined and implemented various risk management policies, procedures and
standards with an objective to clearly articulate processes and procedural requirements that are
binding on all concerned Business groups. The Credit Policy of the Bank is guided by the objective
to build, sustain and maintain a high quality credit portfolio by measurement, monitoring and
control of the credit exposures. The policy also addresses more granular factors such as
diversification of the portfolio across companies, business groups, industries, geographies and
sectors. The policy reflects the Bank's approach towards lending to corporate clients in light of
prevailing business environment and regulatory stipulations.
The Bank's Credit Policy also details the standards, processes and systems for growing and
maintaining its Retail Assets portfolio. The policy also guides the formulation of Individual
Product Program Guidelines for various retail products. The Credit policy is reviewed annually in
anticipation of or in response to the dynamics of the environment (regulatory & market) in which
the Bank operates or to change in strategic direction, risk tolerance, etc. The policy is approved by
the Board of Directors of the Bank.
To control concentration of credit risk, the Bank has put in place internal guidelines on exposure
norms in respect of single borrower, groups, exposure to sensitive sector, industry exposure,
unsecured exposures, etc. Norms have also been detailed for soliciting new business as well as for
preliminary scrutiny of new clients. The Bank abides by the directives issued by RBI, SEBI and
other regulatory bodies in respect of lending to any industry including NBFCs, Commercial Real
Estate, Capital Markets and Infrastructure. In addition, internal limits have been prescribed for
certain specific segments based on prudential considerations.
Consolidated Pillar III Disclosures (September 30, 2016)
7
The Bank has a specific policy on Counter Party Credit Risk pertaining to exposure on domestic &
international banks and a policy on Country Risk Management pertaining to exposure on various
countries.
Credit risk assessment process:
The sanction of credit proposals is in accordance with the delegation structure approved by the
Board of Directors. Credit risk rating, used by the Bank is one of the key tools for assessing its
credit proposals.
The Bank has implemented internal rating model Risk Assessment Module (RAM), a two -
dimensional module for rating viz.; obligor and facility, in line with Basel requirements. Different
risk parameters such as financial, business, management and industry are used for different rating
models in accordance with the category and characteristics of the borrower. Qualitative and
quantitative information of the proposal is evaluated by the credit risk analyst to ascertain the credit
rating of the borrower.
Proposals over a certain threshold amount are rated centrally by rating analysts of the Bank.
Suitable committee based approaches followed to validate the internal credit ratings. The
committees comprise of senior officials of the Bank. Approval of credit for retail products are
guided by the individual retail product paper guidelines and each proposal is appraised through a
scoring model.
In addition to the above, a Credit audit process is in place, which aims at reviewing the loans and
acts as an effective tool to evaluate the efficacy of credit assessment, monitoring and mitigation
process.
Credit Portfolio Monitoring:
The credit portfolio of the Bank is monitored on regular basis to ensure compliance with internal
and regulatory limits as well as to avoid undue concentration (borrower or Industry). The same is
periodically reported to the senior management.
Further, to ensure high quality of the asset portfolio the Bank has adopted a two pronged strategy
i.e., containment of incidence of and resolution / recovery of NPAs. In this regard, the bank has
NPA policy, which sets out guidelines for restricting slippage of existing standard assets and
recovery / resolution of NPA by close monitoring, constant follow-up and evolving a suitable
proactive Corrective Action Plan.
Consolidated Pillar III Disclosures (September 30, 2016)
8
Definitions of non-performing assets:
The Bank classifies its advances into performing and non-performing advances in accordance with
the extant RBI guidelines. The non-performing asset (NPA) is a loan or an advance where; Interest
and/ or installment of principal remains overdue for more than 90 days for a term loan. The account
remains „out of order‟ in respect of an Overdraft/Cash Credit (OD/CC). 'Out of order' means if the
account outstanding balance remains continuously in excess of the sanctioned limit/drawing power.
In cases where the outstanding balance in the principal operating account is less than the sanctioned
limit/drawing power, but there are no credits continuously for 90 days as on the date of Balance
Sheet or credits are not enough to cover the interest debited during the same period, these accounts
are treated as 'out of order‟.
The bill remains overdue for a period of more than 90 days in the case of bills purchased
and discounted.
In respect of an agricultural loan, the interest and / or installment of principal remains
overdue for two crop seasons for short duration crops and for one crop season for long
duration crops.
NPAs are further classified into sub-standard, doubtful and loss assets. A substandard asset is one,
which has remained as NPA for a period less than or equal to 12 months. An asset is classified as
doubtful if it has remained in the sub-standard category for more than 12 months. A loss asset is
one where loss has been identified by the Bank or by the internal / external auditors or the RBI
inspection but the amount has not been written off fully.
In respect of investments in securities, where interest / principal is in arrears, the Bank does not
reckon income on such securities and makes provisions as per provisioning norms prescribed by
RBI for depreciation in the value of investments.
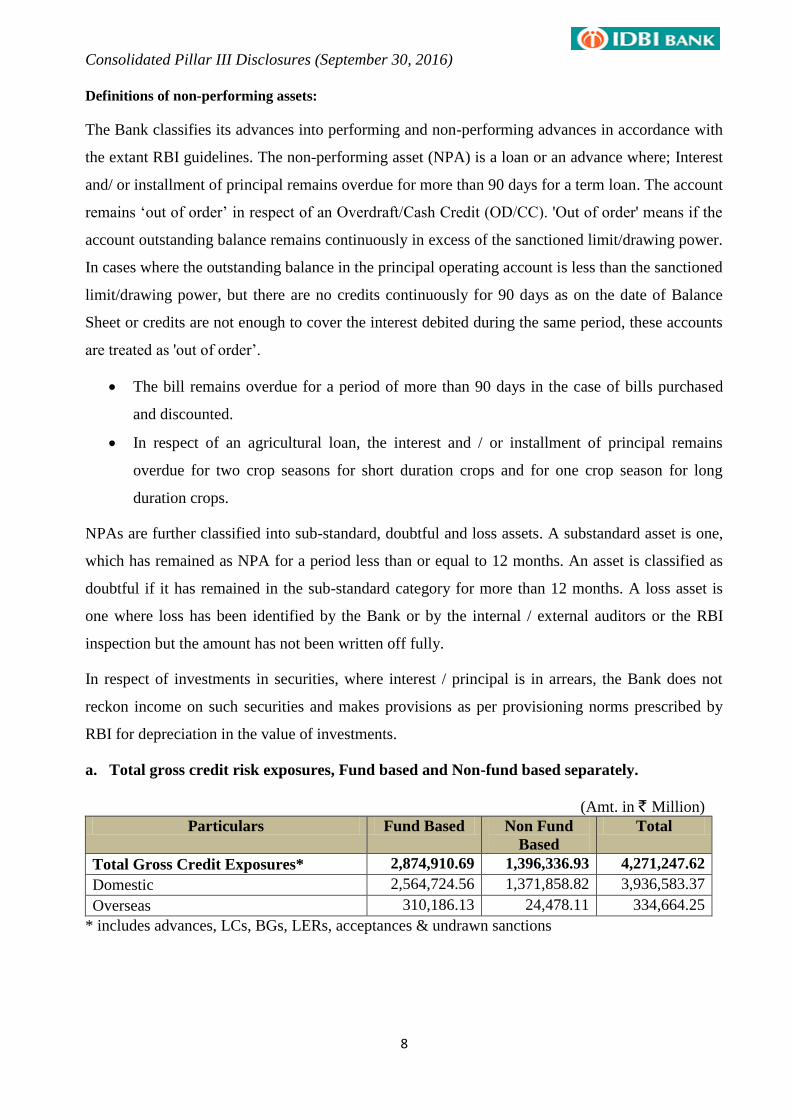
a. Total gross credit risk exposures, Fund based and Non-fund based separately.
(Amt. in ` Million)
Particulars Fund Based Non Fund
Based
Total
Total Gross Credit Exposures* 2,874,910.69 1,396,336.93 4,271,247.62
Domestic 2,564,724.56 1,371,858.82 3,936,583.37
Overseas 310,186.13 24,478.11 334,664.25
* includes advances, LCs, BGs, LERs, acceptances & undrawn sanctions
Consolidated Pillar III Disclosures (September 30, 2016)
9
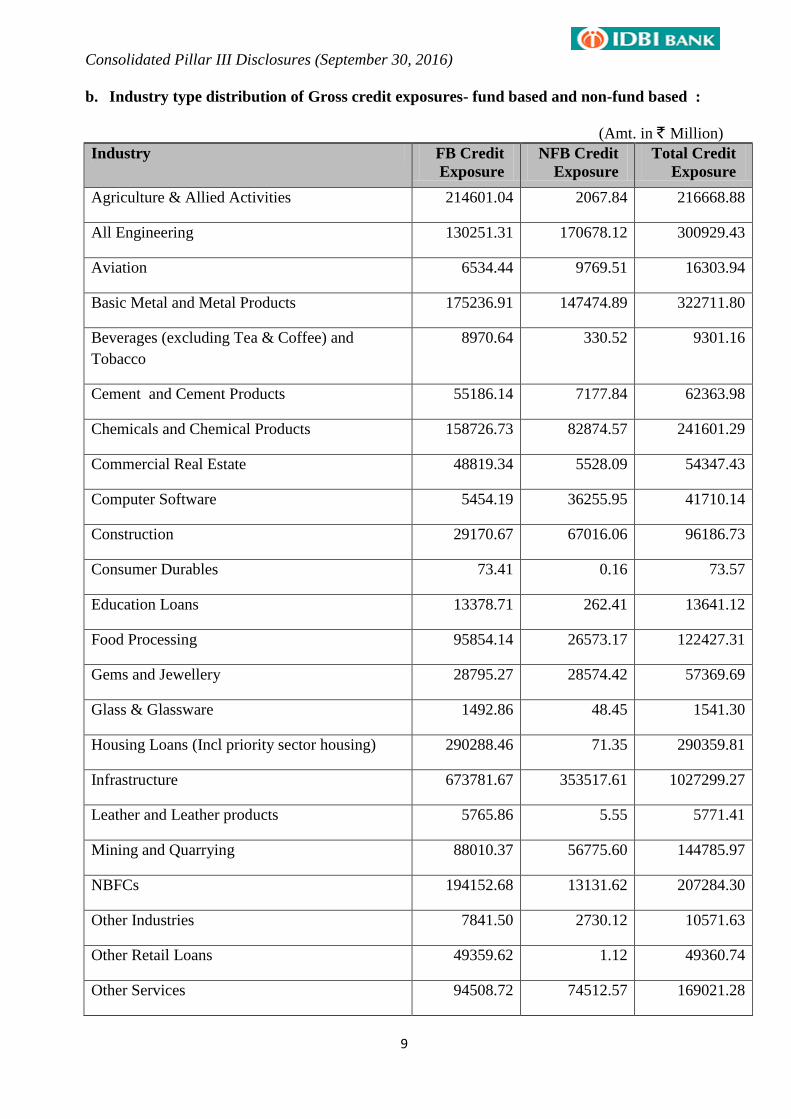
b. Industry type distribution of Gross credit exposures- fund based and non-fund based :
(Amt. in ` Million)
Industry FB Credit
Exposure
NFB Credit
Exposure
Total Credit
Exposure
Agriculture & Allied Activities 214601.04 2067.84 216668.88
All Engineering 130251.31 170678.12 300929.43
Aviation 6534.44 9769.51 16303.94
Basic Metal and Metal Products 175236.91 147474.89 322711.80
Beverages (excluding Tea & Coffee) and
Tobacco
8970.64 330.52 9301.16
Cement and Cement Products 55186.14 7177.84 62363.98
Chemicals and Chemical Products 158726.73 82874.57 241601.29
Commercial Real Estate 48819.34 5528.09 54347.43
Computer Software 5454.19 36255.95 41710.14
Construction 29170.67 67016.06 96186.73
Consumer Durables 73.41 0.16 73.57
Education Loans 13378.71 262.41 13641.12
Food Processing 95854.14 26573.17 122427.31
Gems and Jewellery 28795.27 28574.42 57369.69
Glass & Glassware 1492.86 48.45 1541.30
Housing Loans (Incl priority sector housing) 290288.46 71.35 290359.81
Infrastructure 673781.67 353517.61 1027299.27
Leather and Leather products 5765.86 5.55 5771.41
Mining and Quarrying 88010.37 56775.60 144785.97
NBFCs 194152.68 13131.62 207284.30
Other Industries 7841.50 2730.12 10571.63
Other Retail Loans 49359.62 1.12 49360.74
Other Services 94508.72 74512.57 169021.28
Consolidated Pillar III Disclosures (September 30, 2016)
10
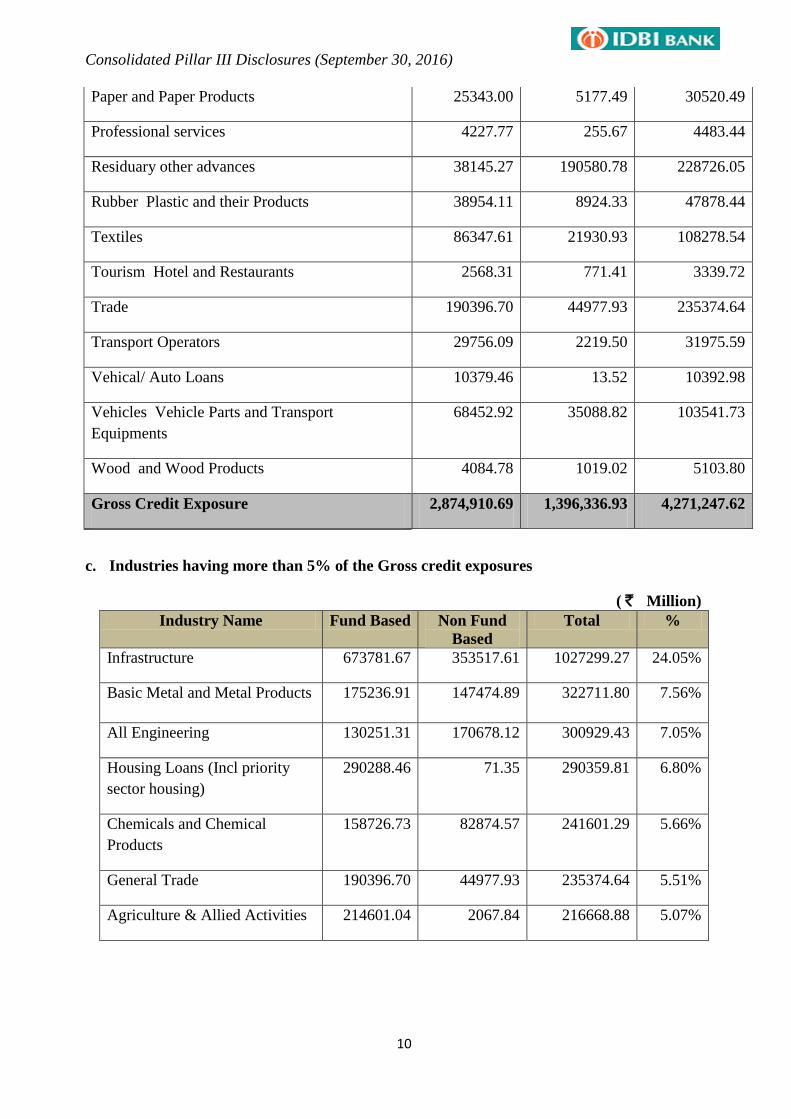
Paper and Paper Products 25343.00 5177.49 30520.49
Professional services 4227.77 255.67 4483.44
Residuary other advances 38145.27 190580.78 228726.05
Rubber Plastic and their Products 38954.11 8924.33 47878.44
Textiles 86347.61 21930.93 108278.54
Tourism Hotel and Restaurants 2568.31 771.41 3339.72
Trade 190396.70 44977.93 235374.64
Transport Operators 29756.09 2219.50 31975.59
Vehical/ Auto Loans 10379.46 13.52 10392.98
Vehicles Vehicle Parts and Transport
Equipments
68452.92 35088.82 103541.73
Wood and Wood Products 4084.78 1019.02 5103.80
Gross Credit Exposure 2,874,910.69 1,396,336.93 4,271,247.62
c. Industries having more than 5% of the Gross credit exposures
( ` Million)
Industry Name Fund Based Non Fund
Based
Total %
Infrastructure 673781.67 353517.61 1027299.27 24.05%
Basic Metal and Metal Products 175236.91 147474.89 322711.80 7.56%
All Engineering 130251.31 170678.12 300929.43 7.05%
Housing Loans (Incl priority
sector housing)
290288.46 71.35 290359.81 6.80%
Chemicals and Chemical
Products
158726.73 82874.57 241601.29 5.66%
General Trade 190396.70 44977.93 235374.64 5.51%
Agriculture & Allied Activities 214601.04 2067.84 216668.88 5.07%
Consolidated Pillar III Disclosures (September 30, 2016)
11
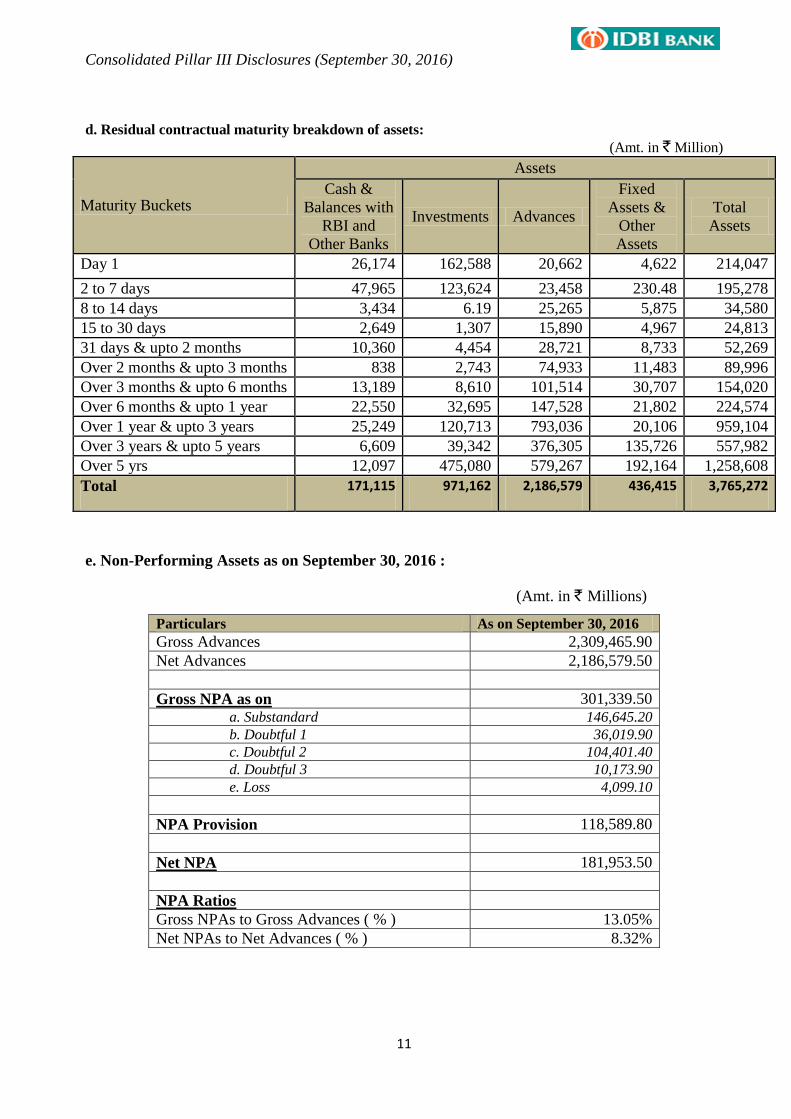
d. Residual contractual maturity breakdown of assets:
(Amt. in ` Million)
Maturity Buckets
Assets
Cash &
Balances with
RBI and
Other Banks
Investments Advances
Fixed
Assets &
Other
Assets
Total
Assets
Day 1 26,174 162,588 20,662 4,622 214,047
2 to 7 days 47,965 123,624 23,458 230.48 195,278
8 to 14 days 3,434 6.19 25,265 5,875 34,580
15 to 30 days 2,649 1,307 15,890 4,967 24,813
31 days & upto 2 months 10,360 4,454 28,721 8,733 52,269
Over 2 months & upto 3 months 838 2,743 74,933 11,483 89,996
Over 3 months & upto 6 months 13,189 8,610 101,514 30,707 154,020
Over 6 months & upto 1 year 22,550 32,695 147,528 21,802 224,574
Over 1 year & upto 3 years 25,249 120,713 793,036 20,106 959,104
Over 3 years & upto 5 years 6,609 39,342 376,305 135,726 557,982
Over 5 yrs 12,097 475,080 579,267 192,164 1,258,608
Total 171,115 971,162 2,186,579 436,415 3,765,272
e. Non-Performing Assets as on September 30, 2016 :
(Amt. in ` Millions)
Particulars As on September 30, 2016
Gross Advances 2,309,465.90
Net Advances 2,186,579.50
Gross NPA as on 301,339.50 a. Substandard 146,645.20
b. Doubtful 1 36,019.90
c. Doubtful 2 104,401.40
d. Doubtful 3 10,173.90
e. Loss 4,099.10
NPA Provision 118,589.80
Net NPA 181,953.50
NPA Ratios
Gross NPAs to Gross Advances ( % ) 13.05%
Net NPAs to Net Advances ( % ) 8.32%
Consolidated Pillar III Disclosures (September 30, 2016)
12
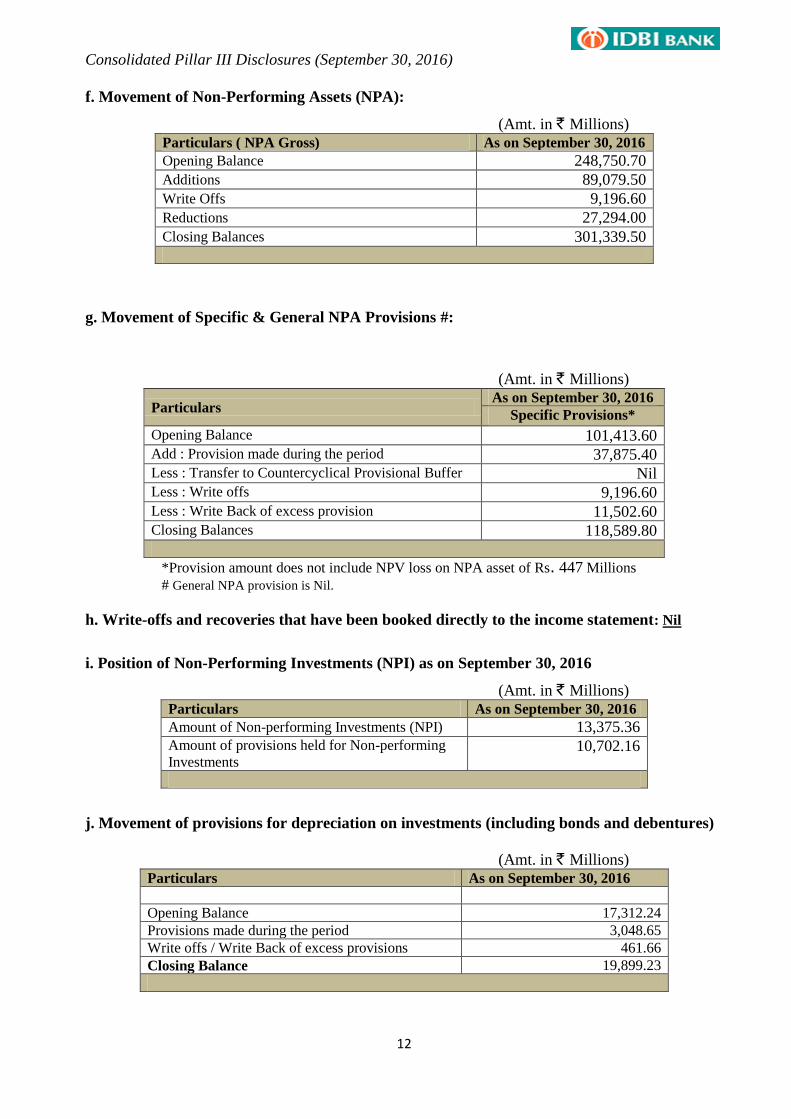
f. Movement of Non-Performing Assets (NPA):
(Amt. in ` Millions)
Particulars ( NPA Gross) As on September 30, 2016
Opening Balance 248,750.70
Additions 89,079.50
Write Offs 9,196.60
Reductions 27,294.00
Closing Balances 301,339.50
g. Movement of Specific & General NPA Provisions #:
(Amt. in ` Millions)
Particulars As on September 30, 2016
Specific Provisions*
Opening Balance 101,413.60 Add : Provision made during the period 37,875.40 Less : Transfer to Countercyclical Provisional Buffer Nil Less : Write offs 9,196.60 Less : Write Back of excess provision 11,502.60 Closing Balances 118,589.80
*Provision amount does not include NPV loss on NPA asset of Rs. 447 Millions
# General NPA provision is Nil.
h. Write-offs and recoveries that have been booked directly to the income statement: Nil
i. Position of Non-Performing Investments (NPI) as on September 30, 2016
(Amt. in ` Millions)
Particulars As on September 30, 2016
Amount of Non-performing Investments (NPI) 13,375.36 Amount of provisions held for Non-performing
Investments 10,702.16
j. Movement of provisions for depreciation on investments (including bonds and debentures)
(Amt. in ` Millions)
Particulars As on September 30, 2016
Opening Balance 17,312.24
Provisions made during the period 3,048.65
Write offs / Write Back of excess provisions 461.66
Closing Balance 19,899.23
Consolidated Pillar III Disclosures (September 30, 2016)
13
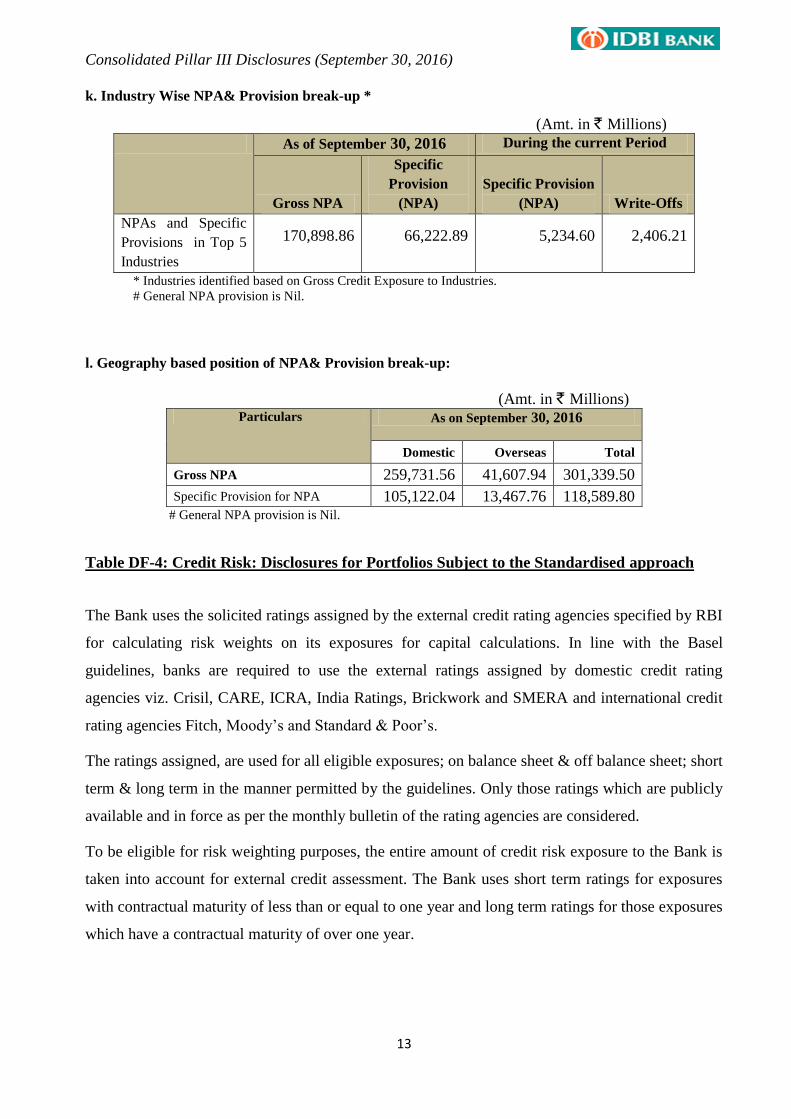
k. Industry Wise NPA& Provision break-up *
(Amt. in ` Millions) As of September 30, 2016 During the current Period
Gross NPA
Specific
Provision
(NPA)
Specific Provision
(NPA) Write-Offs
NPAs and Specific
Provisions in Top 5
Industries
170,898.86 66,222.89 5,234.60 2,406.21
* Industries identified based on Gross Credit Exposure to Industries.
# General NPA provision is Nil.
l. Geography based position of NPA& Provision break-up:
(Amt. in ` Millions) Particulars As on September 30, 2016
Domestic Overseas Total
Gross NPA 259,731.56 41,607.94 301,339.50
Specific Provision for NPA 105,122.04 13,467.76 118,589.80 # General NPA provision is Nil.
Table DF-4: Credit Risk: Disclosures for Portfolios Subject to the Standardised approach
The Bank uses the solicited ratings assigned by the external credit rating agencies specified by RBI
for calculating risk weights on its exposures for capital calculations. In line with the Basel
guidelines, banks are required to use the external ratings assigned by domestic credit rating
agencies viz. Crisil, CARE, ICRA, India Ratings, Brickwork and SMERA and international credit
rating agencies Fitch, Moody‟s and Standard & Poor‟s.
The ratings assigned, are used for all eligible exposures; on balance sheet & off balance sheet; short
term & long term in the manner permitted by the guidelines. Only those ratings which are publicly
available and in force as per the monthly bulletin of the rating agencies are considered.
To be eligible for risk weighting purposes, the entire amount of credit risk exposure to the Bank is
taken into account for external credit assessment. The Bank uses short term ratings for exposures
with contractual maturity of less than or equal to one year and long term ratings for those exposures
which have a contractual maturity of over one year.
Consolidated Pillar III Disclosures (September 30, 2016)
14
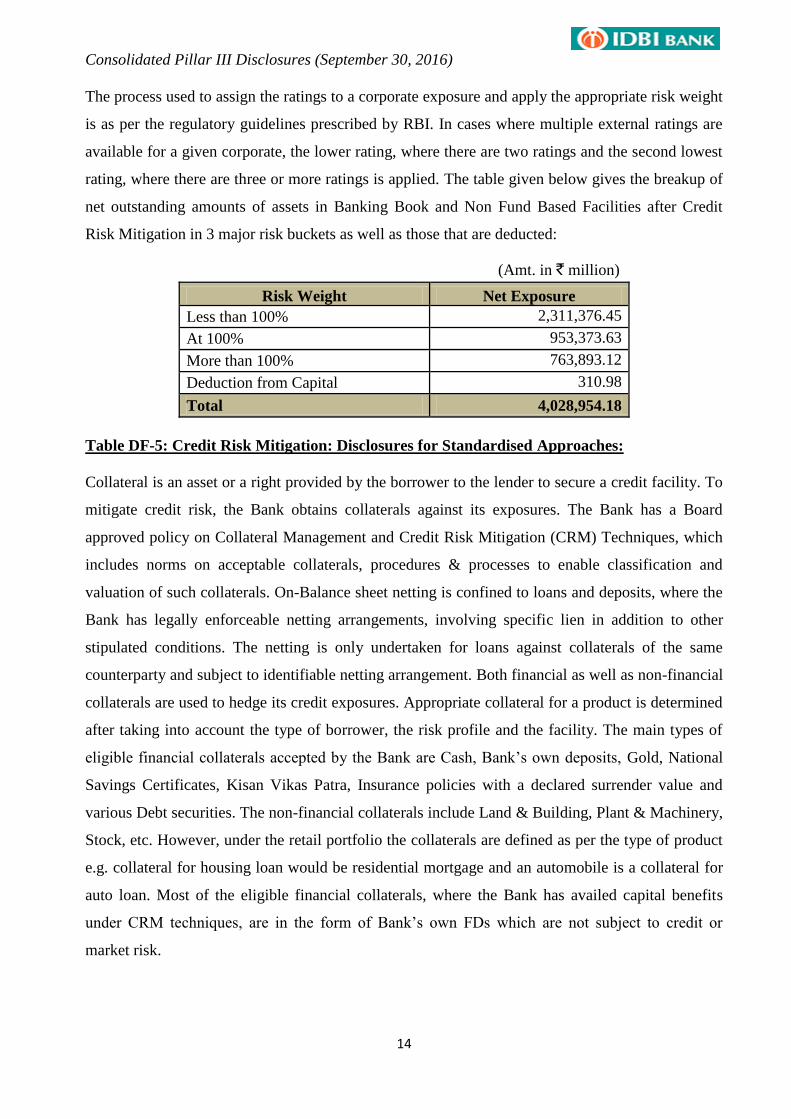
The process used to assign the ratings to a corporate exposure and apply the appropriate risk weight
is as per the regulatory guidelines prescribed by RBI. In cases where multiple external ratings are
available for a given corporate, the lower rating, where there are two ratings and the second lowest
rating, where there are three or more ratings is applied. The table given below gives the breakup of
net outstanding amounts of assets in Banking Book and Non Fund Based Facilities after Credit
Risk Mitigation in 3 major risk buckets as well as those that are deducted:
(Amt. in ` million)
Risk Weight Net Exposure
Less than 100% 2,311,376.45
At 100% 953,373.63
More than 100% 763,893.12
Deduction from Capital 310.98
Total 4,028,954.18
Table DF-5: Credit Risk Mitigation: Disclosures for Standardised Approaches:
Collateral is an asset or a right provided by the borrower to the lender to secure a credit facility. To
mitigate credit risk, the Bank obtains collaterals against its exposures. The Bank has a Board
approved policy on Collateral Management and Credit Risk Mitigation (CRM) Techniques, which
includes norms on acceptable collaterals, procedures & processes to enable classification and
valuation of such collaterals. On-Balance sheet netting is confined to loans and deposits, where the
Bank has legally enforceable netting arrangements, involving specific lien in addition to other
stipulated conditions. The netting is only undertaken for loans against collaterals of the same
counterparty and subject to identifiable netting arrangement. Both financial as well as non-financial
collaterals are used to hedge its credit exposures. Appropriate collateral for a product is determined
after taking into account the type of borrower, the risk profile and the facility. The main types of
eligible financial collaterals accepted by the Bank are Cash, Bank‟s own deposits, Gold, National
Savings Certificates, Kisan Vikas Patra, Insurance policies with a declared surrender value and
various Debt securities. The non-financial collaterals include Land & Building, Plant & Machinery,
Stock, etc. However, under the retail portfolio the collaterals are defined as per the type of product
e.g. collateral for housing loan would be residential mortgage and an automobile is a collateral for
auto loan. Most of the eligible financial collaterals, where the Bank has availed capital benefits
under CRM techniques, are in the form of Bank‟s own FDs which are not subject to credit or
market risk.
Consolidated Pillar III Disclosures (September 30, 2016)
15
The Bank also considers guarantees for securing its exposures; however only those guarantees
which are direct, explicit and unconditional are considered. Sovereigns, Public Sector Entities,
Banks, Primary Dealers, Credit Guarantee fund Trust for Micro and Small Enterprises (CGTMSE),
Export Credit Guarantee Corporation (ECGC) and highly rated corporate entities are considered as
eligible guarantors by the Bank for availing capital benefits as stipulated in the Basel guidelines.
The Bank utilizes various processes and techniques to reduce the impact of the credit risk to which
it is exposed. CRM is one such tool designed to reduce the Bank‟s credit exposure to the
counterparty while calculating its capital requirement to the extent of the value of eligible financial
collateral. The credit exposure to a counter party is adjusted by the value of eligible financial
collaterals after applying appropriate haircuts. The haircuts are applied to account for volatility in
value, including those arising from currency mismatch for both the exposure and the collateral. For
availing capital savings under eligible guarantees, the amount of exposure is divided into covered
and uncovered portions. The covered portion of the exposure attracts the risk weight of guarantor,
while the uncovered portion continues to attract the risk weight of the obligor subject to meeting
requirements stipulated in the Basel guidelines.
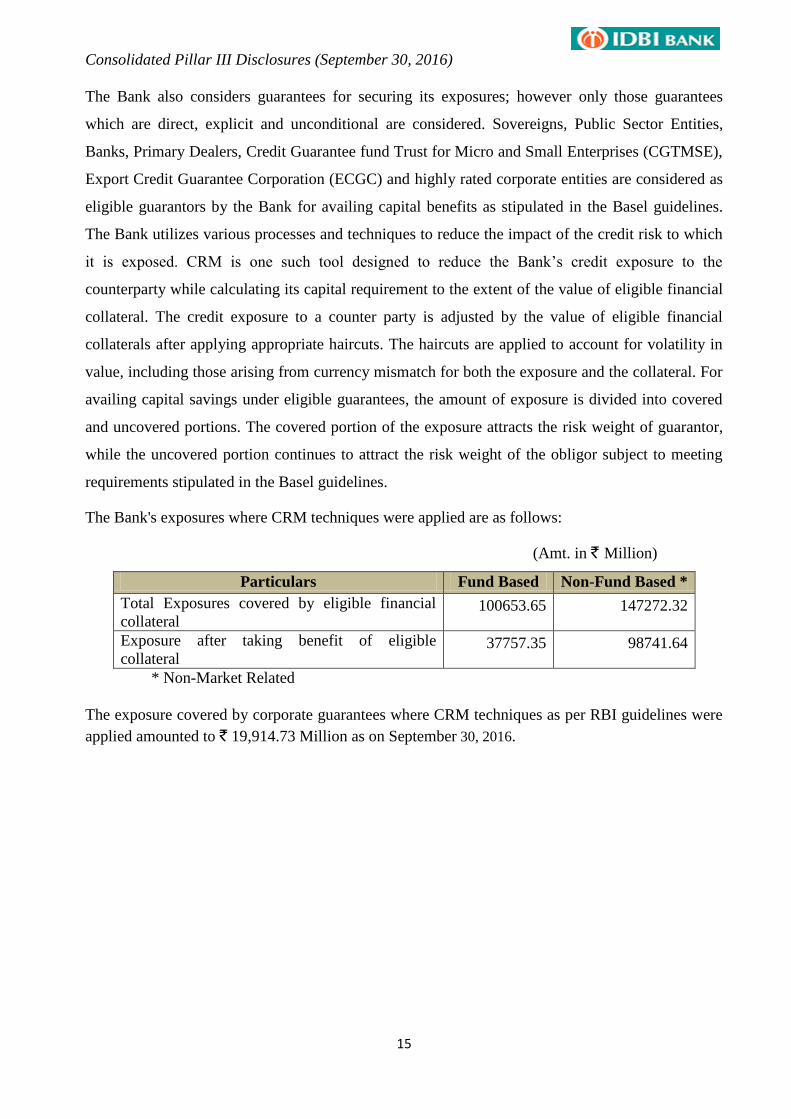
The Bank's exposures where CRM techniques were applied are as follows:
(Amt. in ` Million)
Particulars Fund Based Non-Fund Based *
Total Exposures covered by eligible financial
collateral 100653.65 147272.32
Exposure after taking benefit of eligible
collateral 37757.35 98741.64
* Non-Market Related
The exposure covered by corporate guarantees where CRM techniques as per RBI guidelines were
applied amounted to ` 19,914.73 Million as on September 30, 2016.
Consolidated Pillar III Disclosures (September 30, 2016)
16
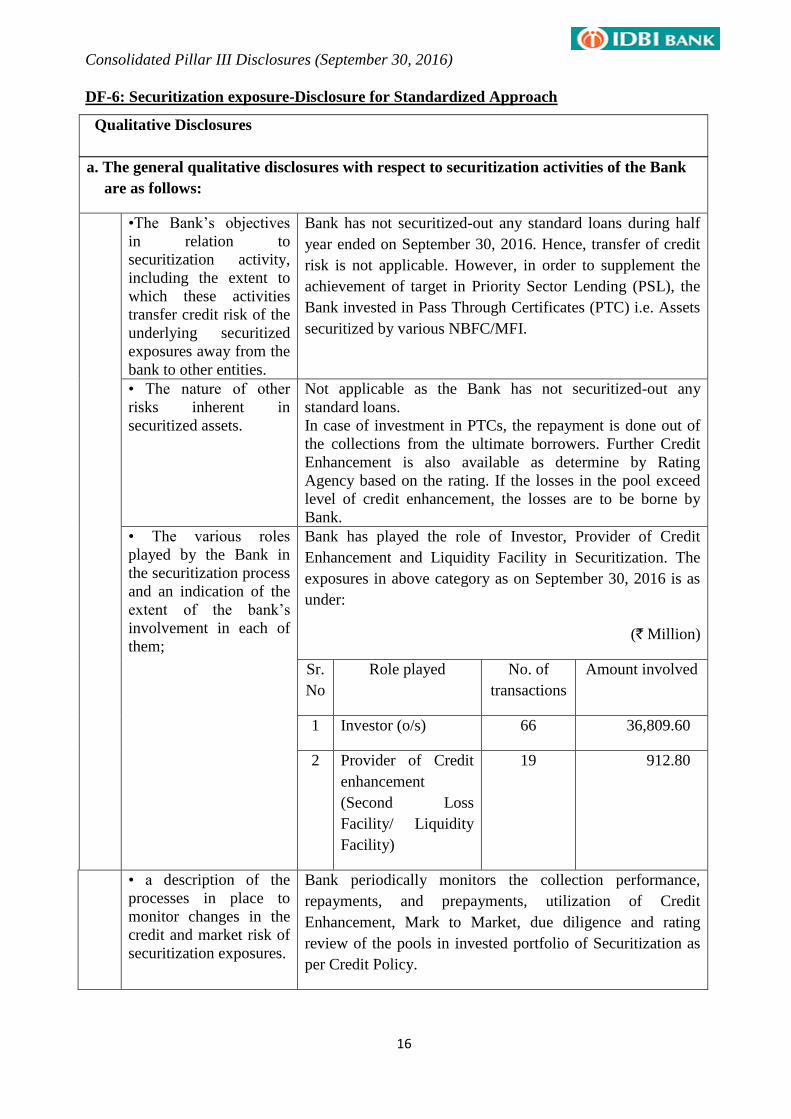
DF-6: Securitization exposure-Disclosure for Standardized Approach
Qualitative Disclosures
a. The general qualitative disclosures with respect to securitization activities of the Bank
are as follows:
•The Bank‟s objectives
in relation to
securitization activity,
including the extent to
which these activities
transfer credit risk of the
underlying securitized
exposures away from the
bank to other entities.
Bank has not securitized-out any standard loans during half
year ended on September 30, 2016. Hence, transfer of credit
risk is not applicable. However, in order to supplement the
achievement of target in Priority Sector Lending (PSL), the
Bank invested in Pass Through Certificates (PTC) i.e. Assets
securitized by various NBFC/MFI.
• The nature of other
risks inherent in
securitized assets.
Not applicable as the Bank has not securitized-out any
standard loans.
In case of investment in PTCs, the repayment is done out of
the collections from the ultimate borrowers. Further Credit
Enhancement is also available as determine by Rating
Agency based on the rating. If the losses in the pool exceed
level of credit enhancement, the losses are to be borne by
Bank.
• The various roles
played by the Bank in
the securitization process
and an indication of the
extent of the bank‟s
involvement in each of
them;
Bank has played the role of Investor, Provider of Credit
Enhancement and Liquidity Facility in Securitization. The
exposures in above category as on September 30, 2016 is as
under:
(` Million)
Sr.
No
Role played No. of
transactions
Amount involved
1 Investor (o/s) 66 36,809.60
2 Provider of Credit
enhancement
(Second Loss
Facility/ Liquidity
Facility)
19 912.80
• a description of the
processes in place to
monitor changes in the
credit and market risk of
securitization exposures.
Bank periodically monitors the collection performance,
repayments, and prepayments, utilization of Credit
Enhancement, Mark to Market, due diligence and rating
review of the pools in invested portfolio of Securitization as
per Credit Policy.
Consolidated Pillar III Disclosures (September 30, 2016)
17
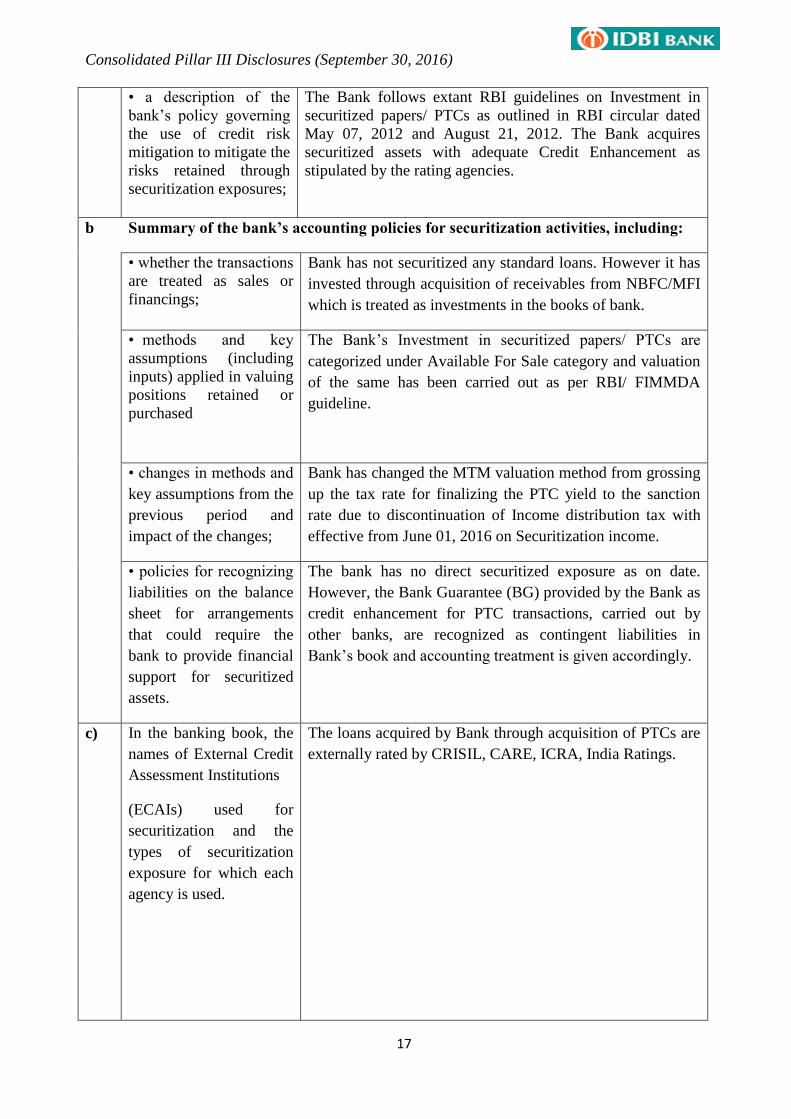
• a description of the
bank‟s policy governing
the use of credit risk
mitigation to mitigate the
risks retained through
securitization exposures;
The Bank follows extant RBI guidelines on Investment in
securitized papers/ PTCs as outlined in RBI circular dated
May 07, 2012 and August 21, 2012. The Bank acquires
securitized assets with adequate Credit Enhancement as
stipulated by the rating agencies.
b Summary of the bank’s accounting policies for securitization activities, including:
• whether the transactions
are treated as sales or
financings;
Bank has not securitized any standard loans. However it has
invested through acquisition of receivables from NBFC/MFI
which is treated as investments in the books of bank.
• methods and key
assumptions (including
inputs) applied in valuing
positions retained or
purchased
The Bank‟s Investment in securitized papers/ PTCs are
categorized under Available For Sale category and valuation
of the same has been carried out as per RBI/ FIMMDA
guideline.
• changes in methods and
key assumptions from the
previous period and
impact of the changes;
Bank has changed the MTM valuation method from grossing
up the tax rate for finalizing the PTC yield to the sanction
rate due to discontinuation of Income distribution tax with
effective from June 01, 2016 on Securitization income.
• policies for recognizing
liabilities on the balance
sheet for arrangements
that could require the
bank to provide financial
support for securitized
assets.
The bank has no direct securitized exposure as on date.
However, the Bank Guarantee (BG) provided by the Bank as
credit enhancement for PTC transactions, carried out by
other banks, are recognized as contingent liabilities in
Bank‟s book and accounting treatment is given accordingly.
c) In the banking book, the
names of External Credit
Assessment Institutions
(ECAIs) used for
securitization and the
types of securitization
exposure for which each
agency is used.
The loans acquired by Bank through acquisition of PTCs are
externally rated by CRISIL, CARE, ICRA, India Ratings.
Consolidated Pillar III Disclosures (September 30, 2016)
18
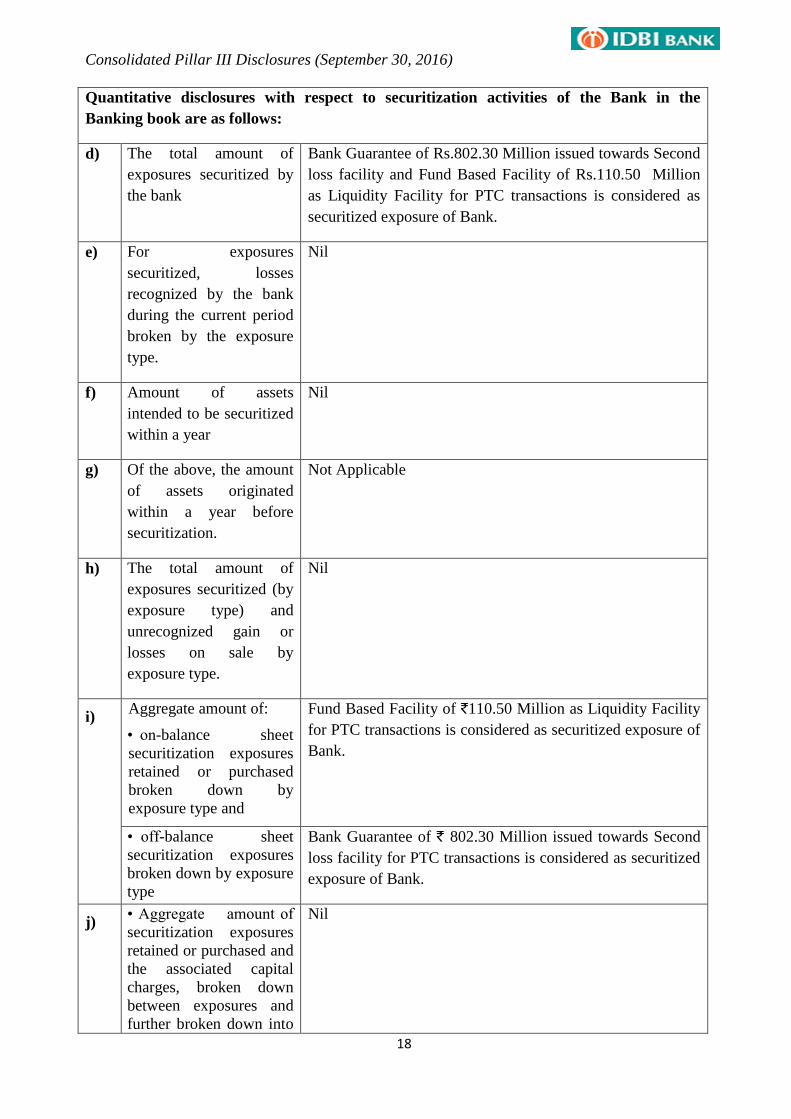
Quantitative disclosures with respect to securitization activities of the Bank in the
Banking book are as follows:
d) The total amount of
exposures securitized by
the bank
Bank Guarantee of Rs.802.30 Million issued towards Second
loss facility and Fund Based Facility of Rs.110.50 Million
as Liquidity Facility for PTC transactions is considered as
securitized exposure of Bank.
e) For exposures
securitized, losses
recognized by the bank
during the current period
broken by the exposure
type.
Nil
f) Amount of assets
intended to be securitized
within a year
Nil
g) Of the above, the amount
of assets originated
within a year before
securitization.
Not Applicable
h) The total amount of
exposures securitized (by
exposure type) and
unrecognized gain or
losses on sale by
exposure type.
Nil
i) Aggregate amount of:
• on-balance sheet
securitization exposures
retained or purchased
broken down by
exposure type and
Fund Based Facility of `110.50 Million as Liquidity Facility
for PTC transactions is considered as securitized exposure of
Bank.
• off-balance sheet
securitization exposures
broken down by exposure
type
Bank Guarantee of ` 802.30 Million issued towards Second
loss facility for PTC transactions is considered as securitized
exposure of Bank.
j) • Aggregate amount of
securitization exposures
retained or purchased and
the associated capital
charges, broken down
between exposures and
further broken down into
Nil
Consolidated Pillar III Disclosures (September 30, 2016)
19
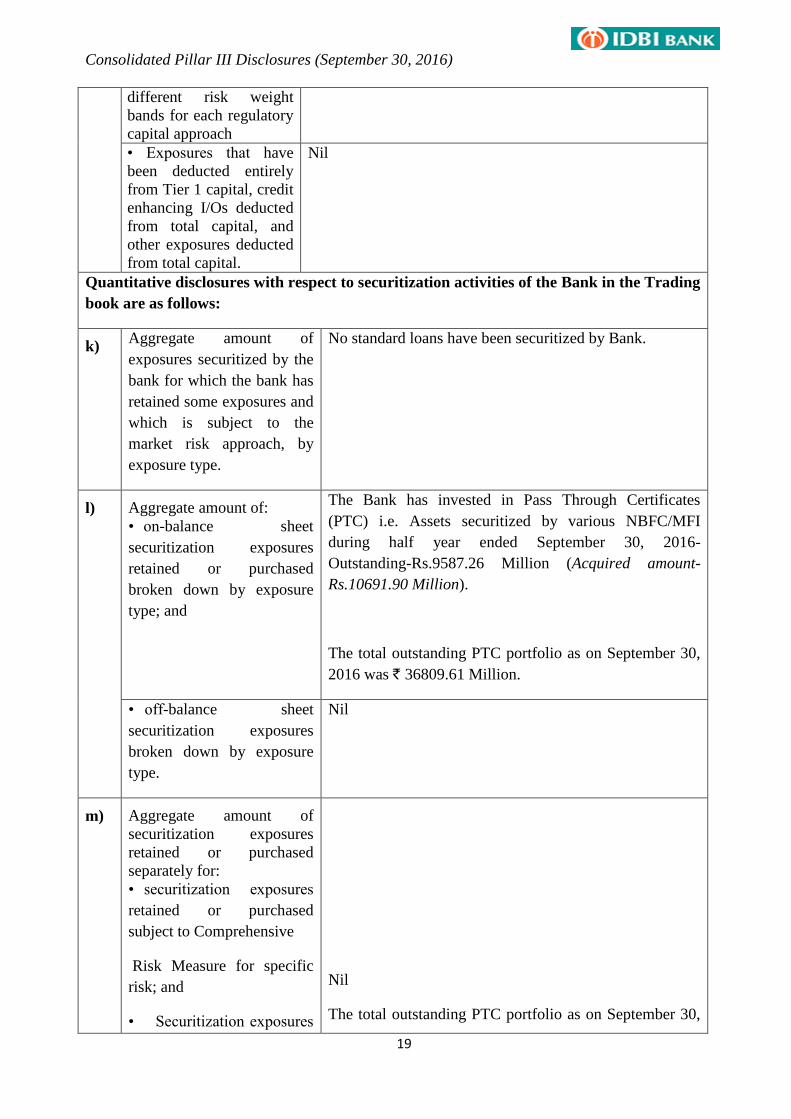
different risk weight
bands for each regulatory
capital approach
• Exposures that have
been deducted entirely
from Tier 1 capital, credit
enhancing I/Os deducted
from total capital, and
other exposures deducted
from total capital.
Nil
Quantitative disclosures with respect to securitization activities of the Bank in the Trading
book are as follows:
k) Aggregate amount of
exposures securitized by the
bank for which the bank has
retained some exposures and
which is subject to the
market risk approach, by
exposure type.
No standard loans have been securitized by Bank.
l) Aggregate amount of:
• on-balance sheet
securitization exposures
retained or purchased
broken down by exposure
type; and
The Bank has invested in Pass Through Certificates
(PTC) i.e. Assets securitized by various NBFC/MFI
during half year ended September 30, 2016-
Outstanding-Rs.9587.26 Million (Acquired amount-
Rs.10691.90 Million).
The total outstanding PTC portfolio as on September 30,
2016 was ` 36809.61 Million.
• off-balance sheet
securitization exposures
broken down by exposure
type.
Nil
m) Aggregate amount of
securitization exposures
retained or purchased
separately for:
• securitization exposures
retained or purchased
subject to Comprehensive
Risk Measure for specific
risk; and
• Securitization exposures
Nil
The total outstanding PTC portfolio as on September 30,
Consolidated Pillar III Disclosures (September 30, 2016)
20
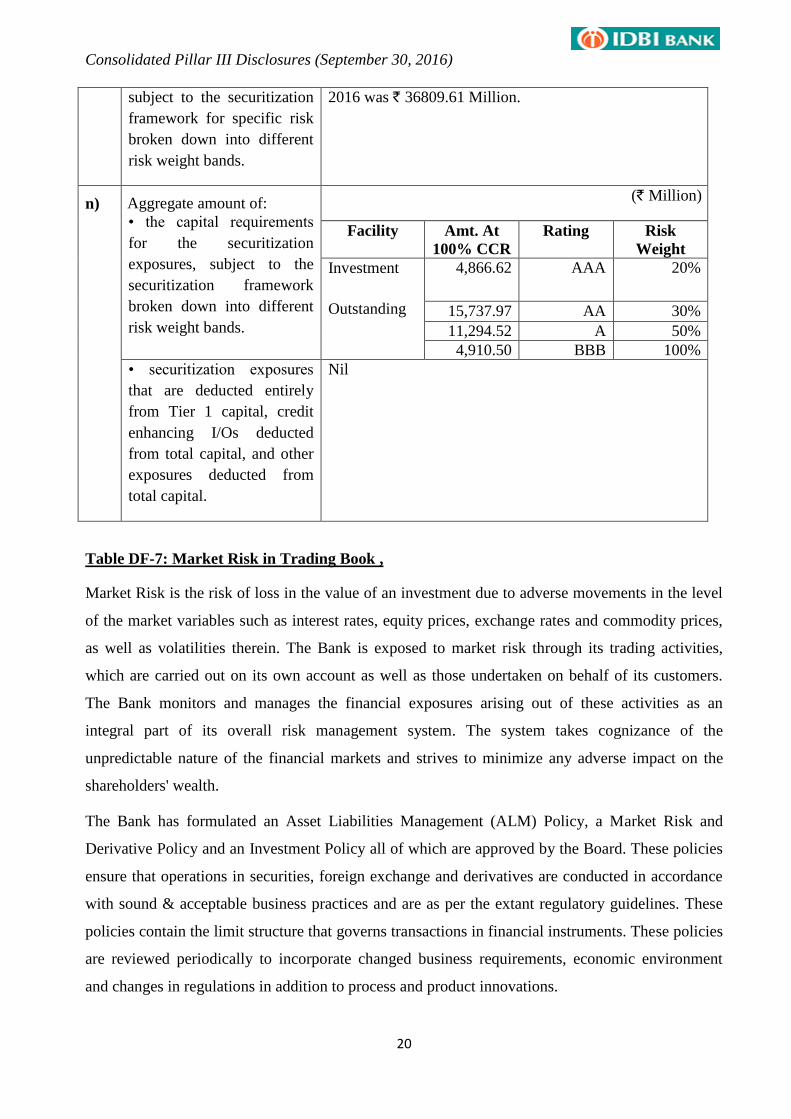
subject to the securitization
framework for specific risk
broken down into different
risk weight bands.
2016 was ` 36809.61 Million.
n) Aggregate amount of:
• the capital requirements
for the securitization
exposures, subject to the
securitization framework
broken down into different
risk weight bands.
(` Million)
Facility Amt. At
100% CCR
Rating Risk
Weight
Investment
Outstanding
4,866.62 AAA 20%
15,737.97 AA 30%
11,294.52 A 50%
4,910.50 BBB 100%
• securitization exposures
that are deducted entirely
from Tier 1 capital, credit
enhancing I/Os deducted
from total capital, and other
exposures deducted from
total capital.
Nil
Table DF-7: Market Risk in Trading Book ,
Market Risk is the risk of loss in the value of an investment due to adverse movements in the level
of the market variables such as interest rates, equity prices, exchange rates and commodity prices,
as well as volatilities therein. The Bank is exposed to market risk through its trading activities,
which are carried out on its own account as well as those undertaken on behalf of its customers.
The Bank monitors and manages the financial exposures arising out of these activities as an
integral part of its overall risk management system. The system takes cognizance of the
unpredictable nature of the financial markets and strives to minimize any adverse impact on the
shareholders' wealth.
The Bank has formulated an Asset Liabilities Management (ALM) Policy, a Market Risk and
Derivative Policy and an Investment Policy all of which are approved by the Board. These policies
ensure that operations in securities, foreign exchange and derivatives are conducted in accordance
with sound & acceptable business practices and are as per the extant regulatory guidelines. These
policies contain the limit structure that governs transactions in financial instruments. These policies
are reviewed periodically to incorporate changed business requirements, economic environment
and changes in regulations in addition to process and product innovations.
Consolidated Pillar III Disclosures (September 30, 2016)
21
The Asset Liability Management Committee (ALCO) comprising top executives of the Bank meet
regularly to manage balance sheet risks in a coordinated manner. ALCO focuses on the
management of risks viz. liquidity, interest rate and foreign exchange risks. Interest rate sensitivity
analysis is measured through impact of interest rate movements on Net Interest Income (NII) of the
Bank.
The Market Risk and Derivative Policy identifies the trading risks to be managed by the Bank. It
also lays down the organizational structure, tools, systems, processes, etc., necessary for
appropriate levels of risk management in the trading book. The important risk management tools
employed by the Bank are Marked to Market (MTM) of trading portfolio, PV01, modified
duration, Stop loss, Greek limits, Potential Future Exposure, stress testing etc.
The Investment policy has been framed keeping in view market dynamics and various circulars
issued by RBI in this regard. The policy lays down the parameters for investments in instruments,
the purpose for such investments and the eligible customers with whom Bank can transact.
The Bank manages its market risk with the broad objectives of:
1. Management of interest rate risk, currency risk and equity risk arising from investments,
foreign exchange and derivatives portfolio;
2. Proper classification, valuation and accounting of the transactions in various portfolios;
3. Adequate and proper reporting of the transactions related to derivative, investment and
foreign exchange products;
4. Effective control over the operation and execution of market related transactions; and
5. Compliance with regulatory requirements.
The Bank has an independent Market Risk Group (MRG)/Middle Office which is responsible for
identification, assessment, monitoring and reporting of market risk in Treasury operations and to
highlight exceptions, if any. The group also recommends changes in policies and methodologies for
measuring market risk. The main strategies and processes of the group are:-
1. Delegation: Appropriate delegation of powers has been put in place for treasury operations.
Investment decisions are vested with Investment Committee of the Board. MRG monitors
various limits, which have been laid down in the policies.
2. Controls: The systems have adequate data integrity controls. The controls are used for audit
purpose as well.
3. Exception handling processes: The limits set in the policies have been inserted in the system
for ensuring that the same is being enforced to minimize exceptions. The limit
breaches/exceptions, if any, are analyzed and ratified from the delegated authorities.
Consolidated Pillar III Disclosures (September 30, 2016)
22
The MRG periodically reports on forex, investment and derivative product related risk measures to
the senior management and committees of the Board. The Bank also reports to regulators as per the
reporting requirements. Based on the risk appetite of the Bank, limits are placed on the risk metrics
which are monitored on a periodic basis.
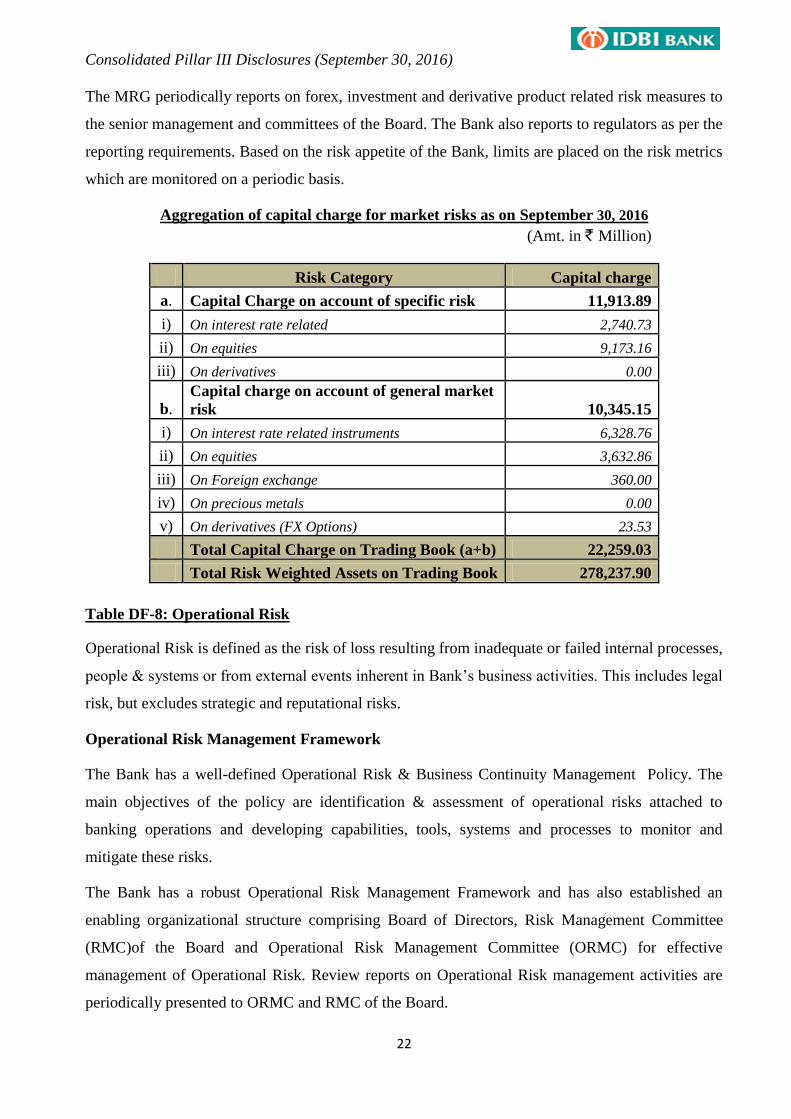
Aggregation of capital charge for market risks as on September 30, 2016
(Amt. in ` Million)
Risk Category Capital charge
a. Capital Charge on account of specific risk 11,913.89
i) On interest rate related 2,740.73
ii) On equities 9,173.16
iii) On derivatives 0.00
b. Capital charge on account of general market
risk 10,345.15
i) On interest rate related instruments 6,328.76
ii) On equities 3,632.86
iii) On Foreign exchange 360.00
iv) On precious metals 0.00
v) On derivatives (FX Options) 23.53
Total Capital Charge on Trading Book (a+b) 22,259.03
Total Risk Weighted Assets on Trading Book 278,237.90
Table DF-8: Operational Risk
Operational Risk is defined as the risk of loss resulting from inadequate or failed internal processes,
people & systems or from external events inherent in Bank‟s business activities. This includes legal
risk, but excludes strategic and reputational risks.
Operational Risk Management Framework
The Bank has a well-defined Operational Risk & Business Continuity Management Policy. The
main objectives of the policy are identification & assessment of operational risks attached to
banking operations and developing capabilities, tools, systems and processes to monitor and
mitigate these risks.
The Bank has a robust Operational Risk Management Framework and has also established an
enabling organizational structure comprising Board of Directors, Risk Management Committee
(RMC)of the Board and Operational Risk Management Committee (ORMC) for effective
management of Operational Risk. Review reports on Operational Risk management activities are
periodically presented to ORMC and RMC of the Board.
Consolidated Pillar III Disclosures (September 30, 2016)
23
Bank’s initiative in migrating to AMA
At present, the Bank is following the Basic Indicator Approach for computation of capital charge
for Operational Risk. However, as a part of intended migration to Advanced Measurement
Approach (AMA), the Bank is putting concerted efforts to further improve its Operational Risk
management system& procedure in a time bound manner. In this regard, Comprehensive
Operational Risk Evaluator has been implemented for management of Operational Risk attached to
various functions of the Bank. Further, the Bank has established Key Risk Indicator and Risk &
Control Self-Assessment Frameworks as a second line of defence for assessment & monitoring of
operational risks within the Bank. Training programmes on Operational Risk Management are
regularly conducted for continued sensitization of officers working at operational level,
strengthening the first line of defence. The Bank is collecting operational loss data across the Bank
through Loss Data Capture module and categorizing these losses under various business lines and
loss types in line with the RBI guidelines. The Bank has also put in place a Scenario Analysis
Framework for generation and analysis of scenario to evaluate its exposure to Low Frequency
High-Severity loss events. Stress testing for operational risk events within the Bank is conducted
by way of Scenario analysis in accordance with the Scenario Analysis framework. The Bank
identifies scenarios based on its own internal loss experience and relevant external data, with the
aim to capture all material risks, which may be applied consistently across the Bank. The outcome
of Scenario workshops is placed before Operational Risk Management Committee for their
directions. The Bank is in the process of validating its Operational Risk Measurement and
Operational Risk Management Frameworks/ systems.
Bank’s initiatives for implementation of Business Continuity Management (BCM)
In order to safeguard the human life & Bank‟s assets and to ensure uninterrupted banking services
during disruption/ disaster, the Bank has put in place a well-defined BCM for its various critical
functions, which also fulfils regulatory requirements. BCM comprises Business Continuity Plan
(BCP) and Disaster Management Plan (DMP). These BCM documents, inter alia, incorporate the
modalities, in an event of business disruption/disaster and consequent recovery strategies & plans.
The resilience of these plans under different disruption scenarios are tested on an ongoing basis
through mock evacuation drills, DR drills and BCP testing exercises. A robust and effective BCM
enables the Bank to provide continuity in service and facilitate customer satisfaction. To mitigate
the risk of system failure, the Bank has set up a Disaster Recovery (DR) site at Chennai& a near
DR site at Mumbai. The Bank periodically carries out DR drill exercises to test the capabilities of
DR site. Reporting of BCM activities is automated through the application software i-DAB.
Consolidated Pillar III Disclosures (September 30, 2016)
24
Table DF-9: Interest Rate Risk in the Banking Book (IRRBB)
IRRBB refers to the potential impact on the Bank‟s earnings and economic value of assets and
liabilities due to adverse movement in interest rates. Besides the general change in interest rate,
variation in the magnitude of interest rate change among the different products/ instruments (e.g.,
yield on Government securities, interest rate on term deposits, lending rate on advances etc.,) it is
also a significant source of interest rate risk. Changes in interest rates affect the Bank‟s earning
through variation in its Net Interest Income (Interest Income minus Interest Expenses) as well as
economic value of equity through net variation in economic value of assets and liabilities. The
extent of change in earning and economic value of equity primarily depends on the nature and
magnitude of maturity and re-pricing mismatches between the Bank‟s assets and liabilities.
Recognizing the importance of interest rate risk management, the Bank has put in place an
appropriate ALM system which incorporates the Board approved interest rate risk management
policy, procedures and limit structure in line with the RBI guidelines. The objectives of interest rate
risk management are to identify the sources of risks and to measure their magnitude in terms of
appropriate methods. It also includes appropriate funding, lending and off-balance sheet strategies
with respect to maturity structure, pricing, product and customer group mix within the overall
framework. The Bank‟s tolerance level for IRRBB is specified in terms of potential impact of net
interest income and economic value of equity. The Asset Liability Committee (ALCO) of the Bank
is responsible to ensure regular measurement, monitoring and control initiatives for the Bank‟s
interest rate risk management. Balance Sheet Management Group (BSMG) regularly measures and
monitors ALM mismatches and reports to ALCO for deciding on strategies for effective
management. Adequate information system has also been put in place for system based ALM
report generation on a daily basis.
Measurement and monitoring of IRRBB are carried out through the methods of Interest Rate
Sensitivity (repricing) gap, Duration gap and Scenario based analysis covering both earning
(impact on net interest income) and economic value perspective (impact on economic value of
equity). Preparation of interest rate sensitivity gap report involves bucketing of all interest rate
sensitive assets and liabilities into different time buckets based on their respective remaining term
to maturity or next repricing date, whichever is earlier. Assumptions made for this report are for
bucketing of core current and saving bank deposits into “over 1 year to 3 years” and advances
linked to BPLR or Base Rate into “over 3 months – 6 months” as these liabilities and assets do not
have prior-specified re-pricing date. Duration gap analysis is undertaken based on computation of
duration and present value of future cash flows of the interest rate sensitive assets and liabilities.
Consolidated Pillar III Disclosures (September 30, 2016)
25
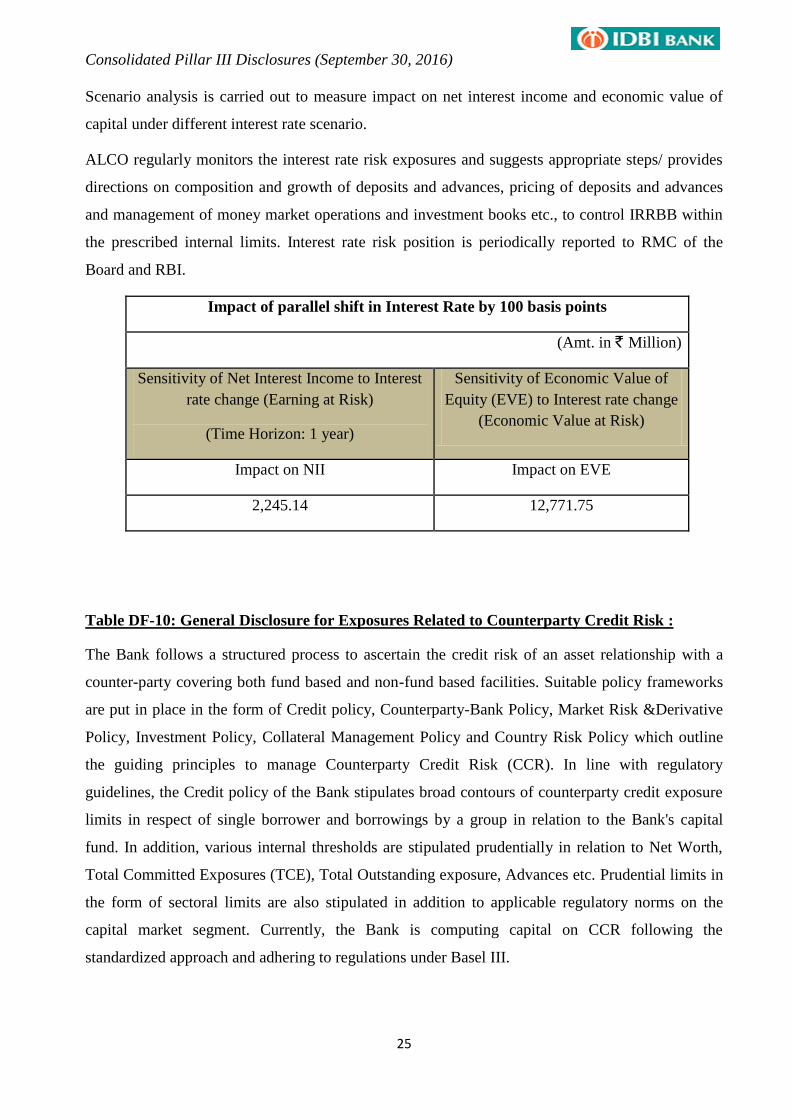
Scenario analysis is carried out to measure impact on net interest income and economic value of
capital under different interest rate scenario.
ALCO regularly monitors the interest rate risk exposures and suggests appropriate steps/ provides
directions on composition and growth of deposits and advances, pricing of deposits and advances
and management of money market operations and investment books etc., to control IRRBB within
the prescribed internal limits. Interest rate risk position is periodically reported to RMC of the
Board and RBI.
Impact of parallel shift in Interest Rate by 100 basis points
(Amt. in ` Million)
Sensitivity of Net Interest Income to Interest
rate change (Earning at Risk)
(Time Horizon: 1 year)
Sensitivity of Economic Value of
Equity (EVE) to Interest rate change
(Economic Value at Risk)
Impact on NII Impact on EVE
2,245.14 12,771.75
Table DF-10: General Disclosure for Exposures Related to Counterparty Credit Risk :
The Bank follows a structured process to ascertain the credit risk of an asset relationship with a
counter-party covering both fund based and non-fund based facilities. Suitable policy frameworks
are put in place in the form of Credit policy, Counterparty-Bank Policy, Market Risk &Derivative
Policy, Investment Policy, Collateral Management Policy and Country Risk Policy which outline
the guiding principles to manage Counterparty Credit Risk (CCR). In line with regulatory
guidelines, the Credit policy of the Bank stipulates broad contours of counterparty credit exposure
limits in respect of single borrower and borrowings by a group in relation to the Bank's capital
fund. In addition, various internal thresholds are stipulated prudentially in relation to Net Worth,
Total Committed Exposures (TCE), Total Outstanding exposure, Advances etc. Prudential limits in
the form of sectoral limits are also stipulated in addition to applicable regulatory norms on the
capital market segment. Currently, the Bank is computing capital on CCR following the
standardized approach and adhering to regulations under Basel III.
Consolidated Pillar III Disclosures (September 30, 2016)
26
The Bank‟s rating module, encompassing various rating models, supports internal credit rating of
counter-party. Product specific guidelines are also defined in terms of customer suitability and
appropriateness along with applicable terms and conditions. The Bank also has a Credit Support
Annex (CSA) arrangement with select counter-party banks. CSA defines the terms under which
collateral is transferred between derivative counterparties to mitigate the credit risk arising from
derivative positions. The process of Collateral Management covers the entire gamut of activities
right from its acceptability to its legal enforceability at the time of need. In establishing credit
reserve, the Bank caters to various alternative techniques including escrow mechanism and charges
thereon, activating Debt Service Reserve Account (DSRA), lien mark on deposits with the Bank,
stipulating conditions towards higher margin, obtaining personal and third party guarantee etc.
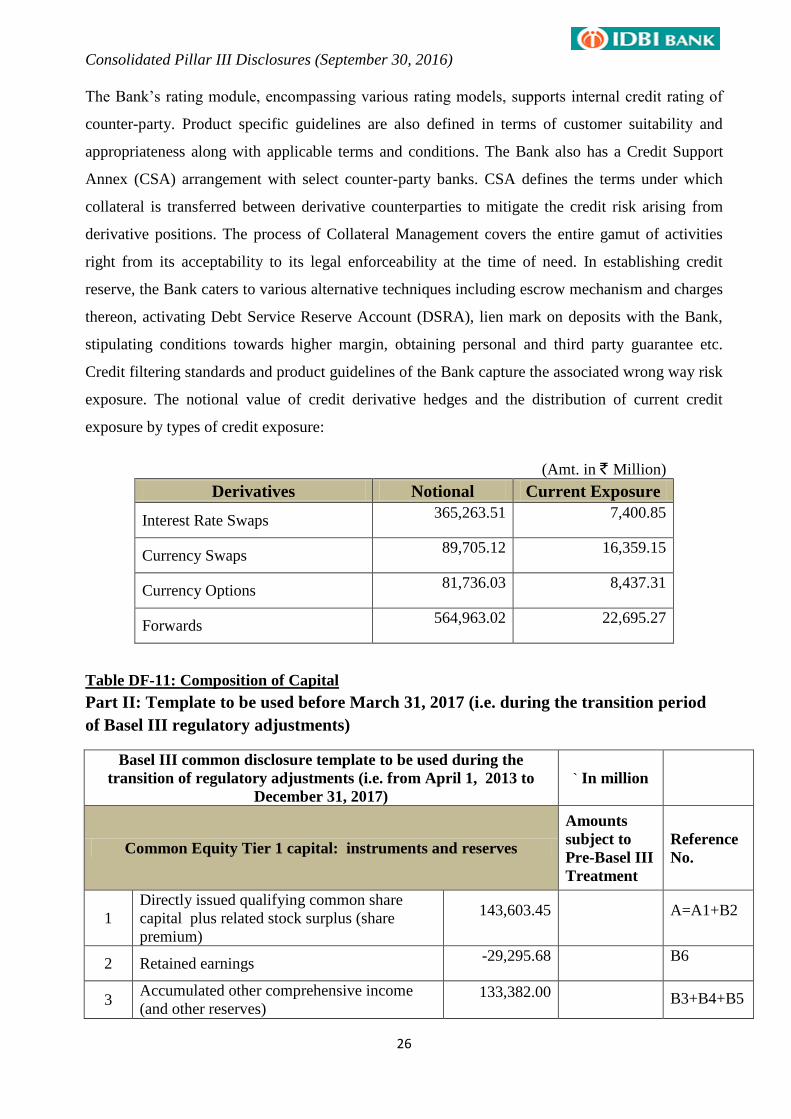
Credit filtering standards and product guidelines of the Bank capture the associated wrong way risk
exposure. The notional value of credit derivative hedges and the distribution of current credit
exposure by types of credit exposure:
(Amt. in ` Million)
Derivatives Notional Current Exposure
Interest Rate Swaps 365,263.51 7,400.85
Currency Swaps 89,705.12 16,359.15
Currency Options 81,736.03 8,437.31
Forwards 564,963.02 22,695.27
Table DF-11: Composition of Capital
Part II: Template to be used before March 31, 2017 (i.e. during the transition period
of Basel III regulatory adjustments)
Basel III common disclosure template to be used during the
transition of regulatory adjustments (i.e. from April 1, 2013 to
December 31, 2017)
` In million
Common Equity Tier 1 capital: instruments and reserves
Amounts
subject to
Pre-Basel III
Treatment
Reference
No.
1
Directly issued qualifying common share
capital plus related stock surplus (share
premium)
143,603.45 A=A1+B2
2 Retained earnings -29,295.68 B6
3 Accumulated other comprehensive income
(and other reserves) 133,382.00 B3+B4+B5
Consolidated Pillar III Disclosures (September 30, 2016)
27
+E2
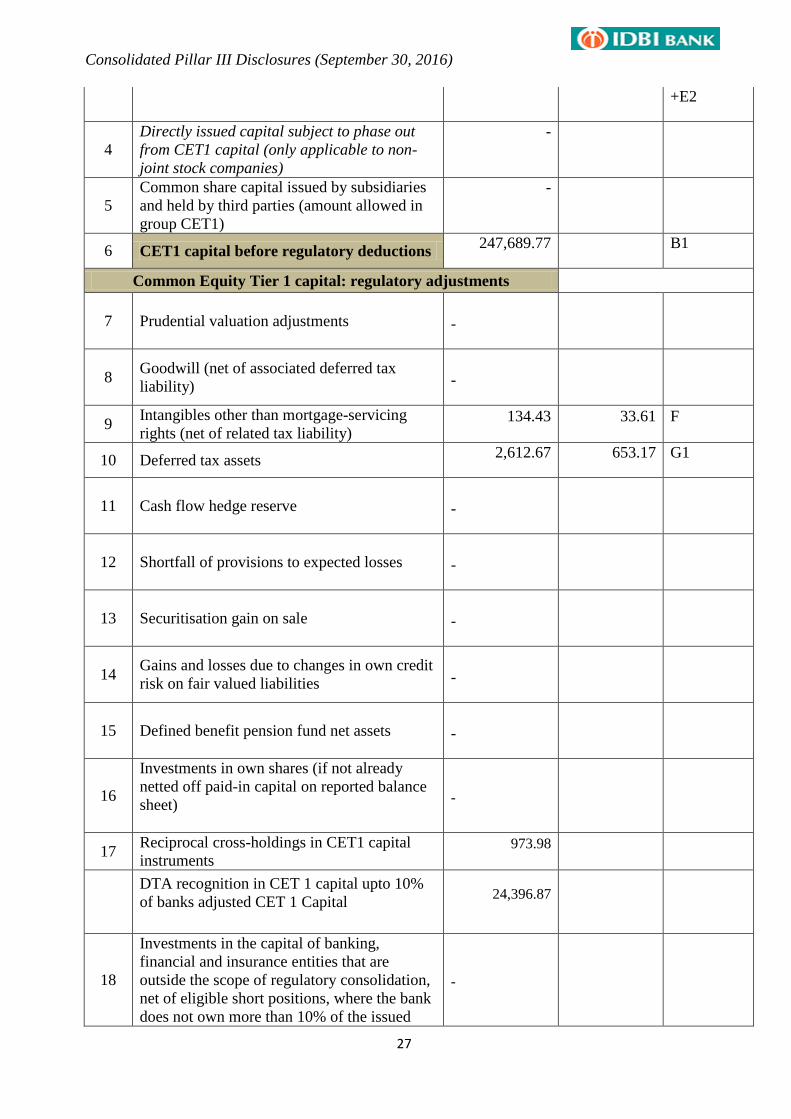
4
Directly issued capital subject to phase out
from CET1 capital (only applicable to non-
joint stock companies)
-
5
Common share capital issued by subsidiaries
and held by third parties (amount allowed in
group CET1)
-
6 CET1 capital before regulatory deductions 247,689.77 B1
Common Equity Tier 1 capital: regulatory adjustments
7 Prudential valuation adjustments
-
8 Goodwill (net of associated deferred tax
liability)
-
9 Intangibles other than mortgage-servicing
rights (net of related tax liability) 134.43 33.61 F
10 Deferred tax assets 2,612.67 653.17 G1
11 Cash flow hedge reserve
-
12 Shortfall of provisions to expected losses
-
13 Securitisation gain on sale
-
14 Gains and losses due to changes in own credit
risk on fair valued liabilities
-
15 Defined benefit pension fund net assets
-
16
Investments in own shares (if not already
netted off paid-in capital on reported balance
sheet)
-
17 Reciprocal cross-holdings in CET1 capital
instruments 973.98
DTA recognition in CET 1 capital upto 10%
of banks adjusted CET 1 Capital
24,396.87
18
Investments in the capital of banking,
financial and insurance entities that are
outside the scope of regulatory consolidation,
net of eligible short positions, where the bank
does not own more than 10% of the issued
-
Consolidated Pillar III Disclosures (September 30, 2016)
28
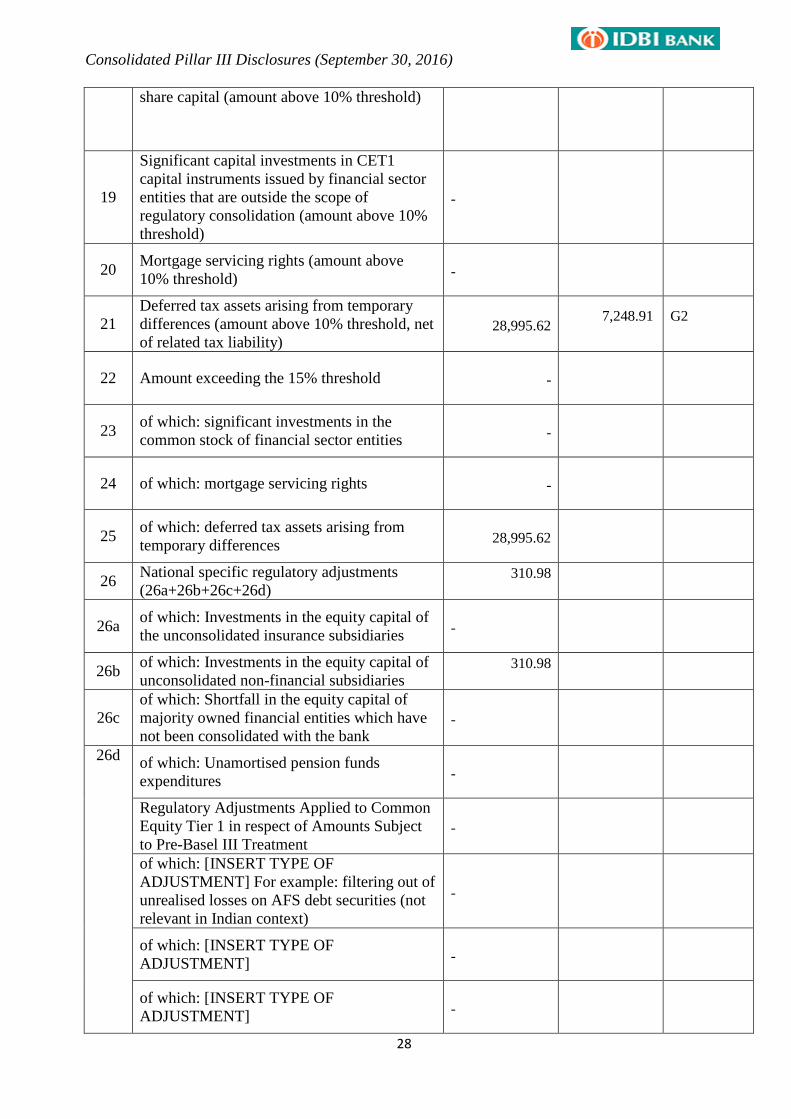
share capital (amount above 10% threshold)
19
Significant capital investments in CET1
capital instruments issued by financial sector
entities that are outside the scope of
regulatory consolidation (amount above 10%
threshold)
-
20 Mortgage servicing rights (amount above
10% threshold)
-
21
Deferred tax assets arising from temporary
differences (amount above 10% threshold, net
of related tax liability)
28,995.62 7,248.91 G2
22 Amount exceeding the 15% threshold
-
23 of which: significant investments in the
common stock of financial sector entities
-
24 of which: mortgage servicing rights
-
25 of which: deferred tax assets arising from
temporary differences
28,995.62
26 National specific regulatory adjustments
(26a+26b+26c+26d) 310.98
26a of which: Investments in the equity capital of
the unconsolidated insurance subsidiaries
-
26b of which: Investments in the equity capital of
unconsolidated non-financial subsidiaries 310.98
26c
of which: Shortfall in the equity capital of
majority owned financial entities which have
not been consolidated with the bank
-
26d of which: Unamortised pension funds
expenditures
-
Regulatory Adjustments Applied to Common
Equity Tier 1 in respect of Amounts Subject
to Pre-Basel III Treatment
-
of which: [INSERT TYPE OF
ADJUSTMENT] For example: filtering out of
unrealised losses on AFS debt securities (not
relevant in Indian context)
-
of which: [INSERT TYPE OF
ADJUSTMENT]
-
of which: [INSERT TYPE OF
ADJUSTMENT]
-
Consolidated Pillar III Disclosures (September 30, 2016)
29
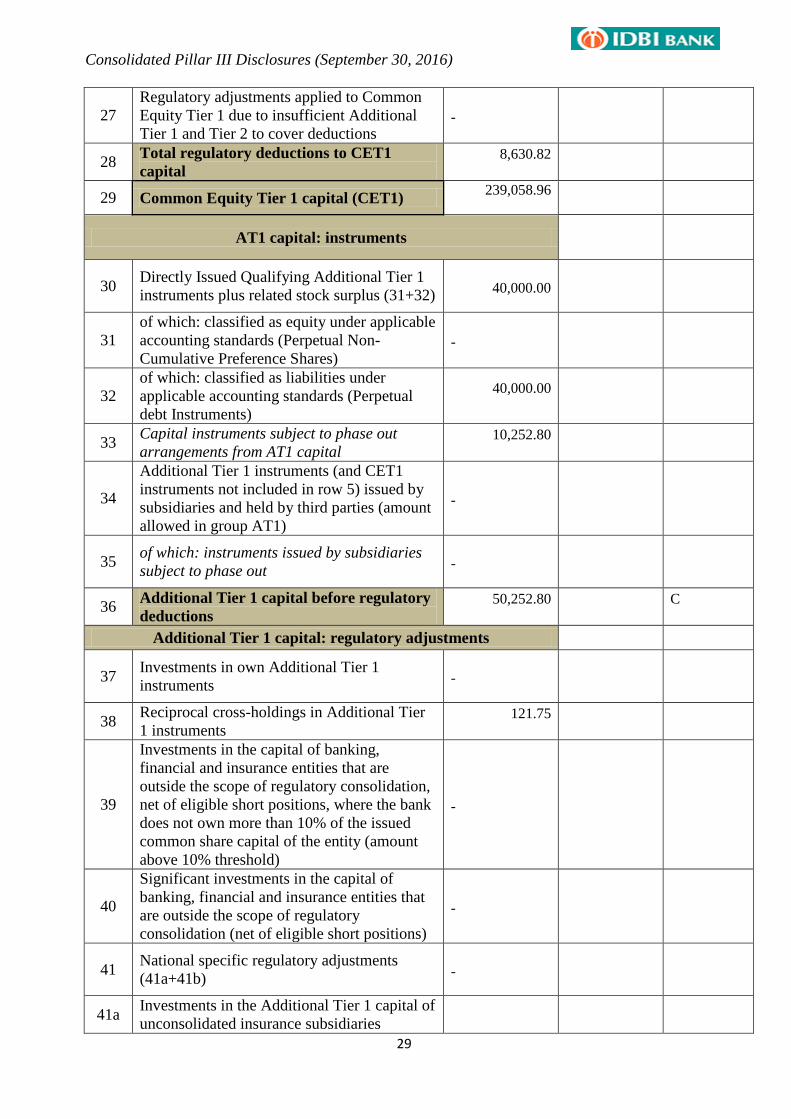
27
Regulatory adjustments applied to Common
Equity Tier 1 due to insufficient Additional
Tier 1 and Tier 2 to cover deductions
-
28 Total regulatory deductions to CET1
capital 8,630.82
29 Common Equity Tier 1 capital (CET1) 239,058.96
AT1 capital: instruments
30 Directly Issued Qualifying Additional Tier 1
instruments plus related stock surplus (31+32)
40,000.00
31
of which: classified as equity under applicable
accounting standards (Perpetual Non-
Cumulative Preference Shares)
-
32
of which: classified as liabilities under
applicable accounting standards (Perpetual
debt Instruments)
40,000.00
33 Capital instruments subject to phase out
arrangements from AT1 capital 10,252.80
34
Additional Tier 1 instruments (and CET1
instruments not included in row 5) issued by
subsidiaries and held by third parties (amount
allowed in group AT1)
-
35 of which: instruments issued by subsidiaries
subject to phase out
-
36 Additional Tier 1 capital before regulatory
deductions 50,252.80 C
Additional Tier 1 capital: regulatory adjustments
37 Investments in own Additional Tier 1
instruments
-
38 Reciprocal cross-holdings in Additional Tier
1 instruments 121.75
39
Investments in the capital of banking,
financial and insurance entities that are
outside the scope of regulatory consolidation,
net of eligible short positions, where the bank
does not own more than 10% of the issued
common share capital of the entity (amount
above 10% threshold)
-
40
Significant investments in the capital of
banking, financial and insurance entities that
are outside the scope of regulatory
consolidation (net of eligible short positions)
-
41 National specific regulatory adjustments
(41a+41b)
-
41a Investments in the Additional Tier 1 capital of
unconsolidated insurance subsidiaries
Consolidated Pillar III Disclosures (September 30, 2016)
30
-
41b
Shortfall in the Additional Tier 1 capital of
majority owned financial entities which have
not been consolidated with the bank
-
Regulatory Adjustments Applied to
Additional Tier 1 in respect of Amounts
Subject to Pre-Basel III Treatment
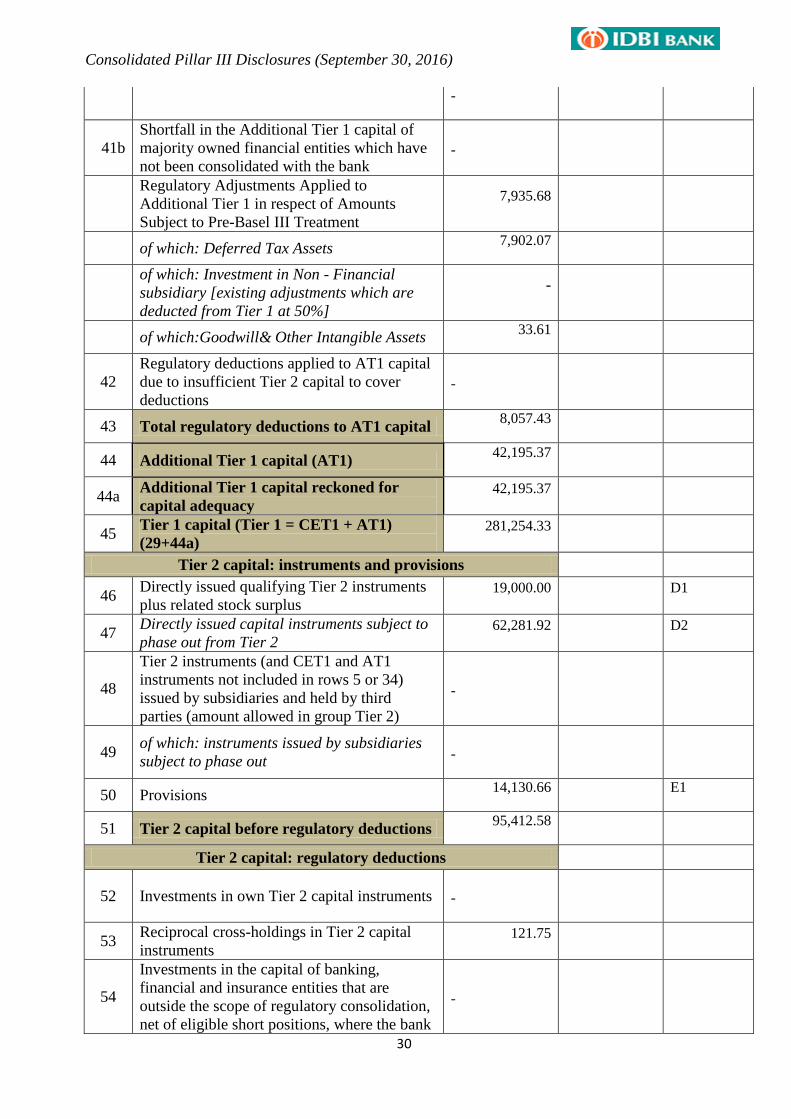
7,935.68
of which: Deferred Tax Assets 7,902.07
of which: Investment in Non - Financial
subsidiary [existing adjustments which are
deducted from Tier 1 at 50%]
-
of which:Goodwill& Other Intangible Assets 33.61
42
Regulatory deductions applied to AT1 capital
due to insufficient Tier 2 capital to cover
deductions
-
43 Total regulatory deductions to AT1 capital 8,057.43
44 Additional Tier 1 capital (AT1) 42,195.37
44a Additional Tier 1 capital reckoned for
capital adequacy 42,195.37
45 Tier 1 capital (Tier 1 = CET1 + AT1)
(29+44a) 281,254.33
Tier 2 capital: instruments and provisions
46 Directly issued qualifying Tier 2 instruments
plus related stock surplus 19,000.00 D1
47 Directly issued capital instruments subject to
phase out from Tier 2 62,281.92 D2
48
Tier 2 instruments (and CET1 and AT1
instruments not included in rows 5 or 34)
issued by subsidiaries and held by third
parties (amount allowed in group Tier 2)
-
49 of which: instruments issued by subsidiaries
subject to phase out
-
50 Provisions 14,130.66 E1
51 Tier 2 capital before regulatory deductions 95,412.58
Tier 2 capital: regulatory deductions
52 Investments in own Tier 2 capital instruments
-
53 Reciprocal cross-holdings in Tier 2 capital
instruments 121.75
54
Investments in the capital of banking,
financial and insurance entities that are
outside the scope of regulatory consolidation,
net of eligible short positions, where the bank
-
Consolidated Pillar III Disclosures (September 30, 2016)
31
does not own more than 10% of the issued
common share capital of the entity (amount
above the 10% threshold)
55
Significant investments in the capital banking,
financial and insurance entities that are
outside the scope of regulatory consolidation
(net of eligible short positions)
-
56 National specific regulatory adjustments
(56a+56b) 0.00
56a of which: Investments in the Tier 2 capital of
unconsolidated subsidiaries 0.00
56b
of which: Shortfall in the Tier 2 capital of
majority owned financial entities which have
not been consolidated with the bank
-
Regulatory Adjustments Applied To Tier 2 in
respect of Amounts Subject to Pre-Basel III
Treatment
-
of which: [INSERT TYPE OF
ADJUSTMENT e.g. existing adjustments
which are deducted from Tier 2 at 50%]
-
of which: [INSERT TYPE OF
ADJUSTMENT
-
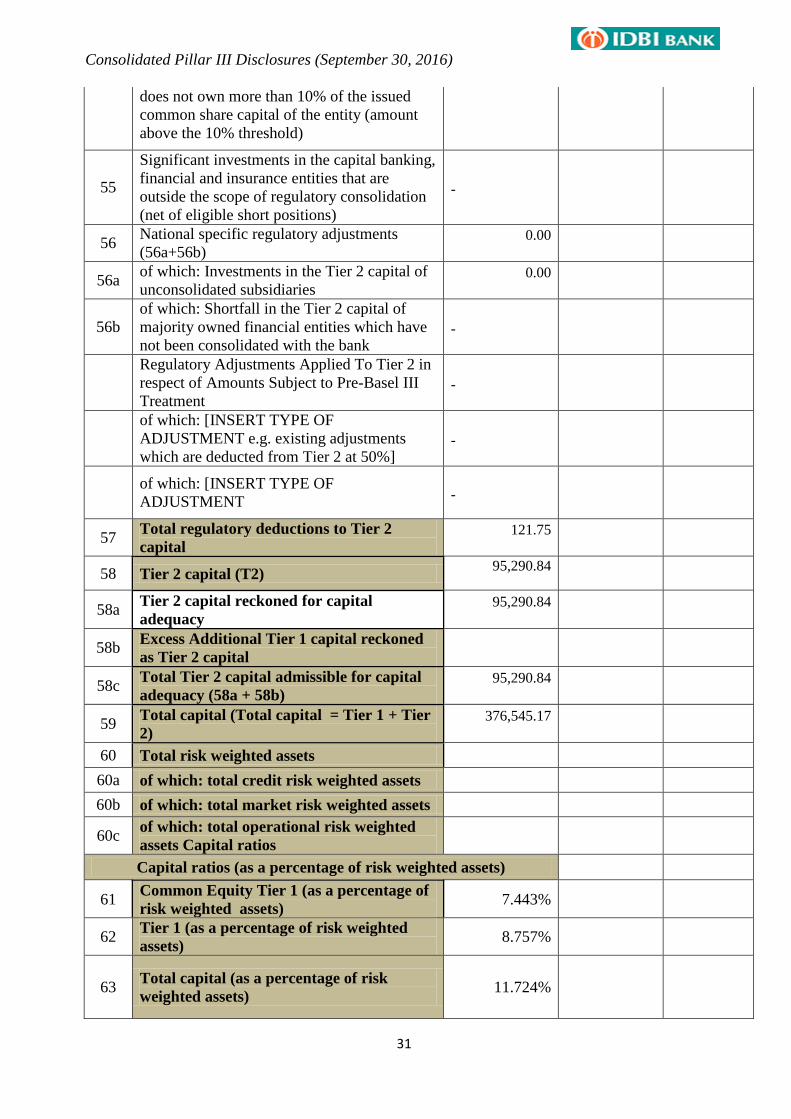
57 Total regulatory deductions to Tier 2
capital 121.75
58 Tier 2 capital (T2) 95,290.84
58a Tier 2 capital reckoned for capital
adequacy
95,290.84
58b Excess Additional Tier 1 capital reckoned
as Tier 2 capital
58c Total Tier 2 capital admissible for capital
adequacy (58a + 58b) 95,290.84
59 Total capital (Total capital = Tier 1 + Tier
2)
376,545.17
60 Total risk weighted assets
60a of which: total credit risk weighted assets
60b of which: total market risk weighted assets
60c of which: total operational risk weighted
assets Capital ratios
Capital ratios (as a percentage of risk weighted assets)
61 Common Equity Tier 1 (as a percentage of
risk weighted assets) 7.443%
62 Tier 1 (as a percentage of risk weighted
assets) 8.757%
63 Total capital (as a percentage of risk
weighted assets) 11.724%
Consolidated Pillar III Disclosures (September 30, 2016)
32
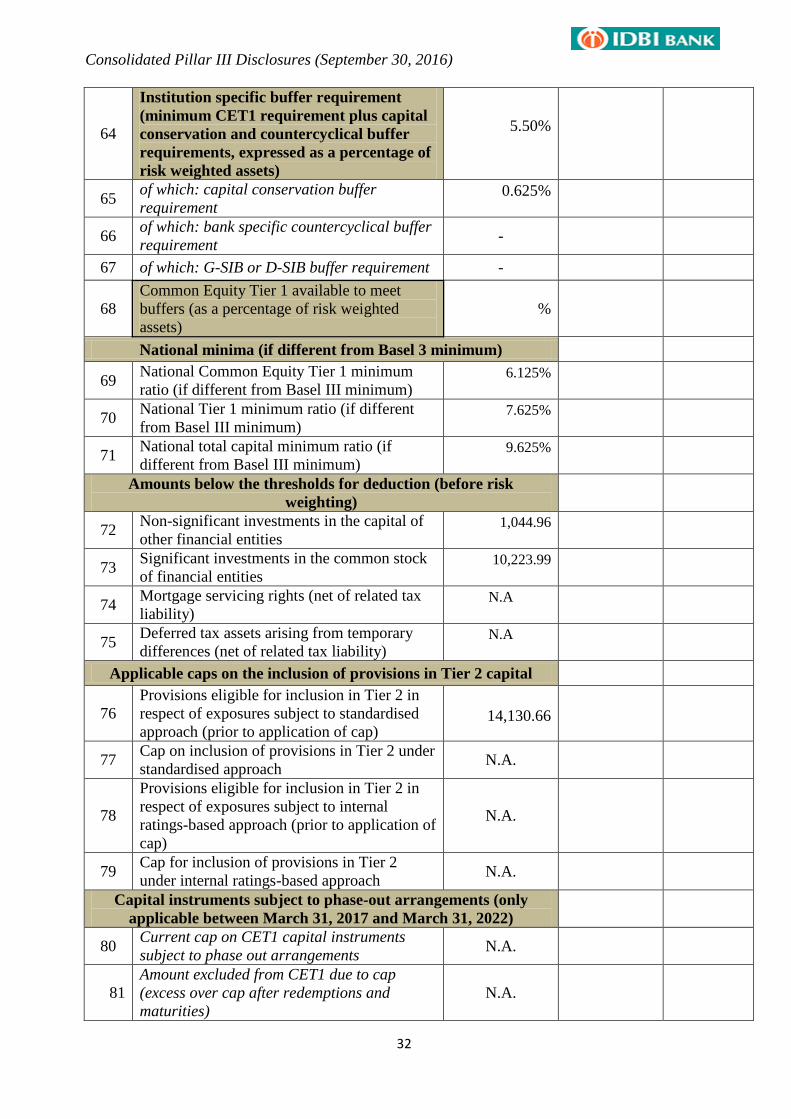
64
Institution specific buffer requirement
(minimum CET1 requirement plus capital
conservation and countercyclical buffer
requirements, expressed as a percentage of
risk weighted assets)
5.50%
65 of which: capital conservation buffer
requirement 0.625%
66 of which: bank specific countercyclical buffer
requirement -
67 of which: G-SIB or D-SIB buffer requirement -
68
Common Equity Tier 1 available to meet
buffers (as a percentage of risk weighted
assets)
%
National minima (if different from Basel 3 minimum)
69 National Common Equity Tier 1 minimum
ratio (if different from Basel III minimum) 6.125%
70 National Tier 1 minimum ratio (if different
from Basel III minimum) 7.625%
71 National total capital minimum ratio (if
different from Basel III minimum) 9.625%
Amounts below the thresholds for deduction (before risk
weighting)
72 Non-significant investments in the capital of
other financial entities 1,044.96
73 Significant investments in the common stock
of financial entities 10,223.99
74 Mortgage servicing rights (net of related tax
liability) N.A
75 Deferred tax assets arising from temporary
differences (net of related tax liability) N.A
Applicable caps on the inclusion of provisions in Tier 2 capital
76
Provisions eligible for inclusion in Tier 2 in
respect of exposures subject to standardised
approach (prior to application of cap)
14,130.66
77 Cap on inclusion of provisions in Tier 2 under
standardised approach N.A.
78
Provisions eligible for inclusion in Tier 2 in
respect of exposures subject to internal
ratings-based approach (prior to application of
cap)
N.A.
79 Cap for inclusion of provisions in Tier 2
under internal ratings-based approach N.A.
Capital instruments subject to phase-out arrangements (only
applicable between March 31, 2017 and March 31, 2022)
80 Current cap on CET1 capital instruments
subject to phase out arrangements N.A.
81
Amount excluded from CET1 due to cap
(excess over cap after redemptions and
maturities)
N.A.

Consolidated Pillar III Disclosures (September 30, 2016)
33
82 Current cap on AT1 instruments subject to
phase out arrangements N.A.
83 Amount excluded from AT1 due to cap (excess
over cap after redemptions and maturities) N.A.
84 Current cap on T2 instruments subject to
phase out arrangements N.A.
85 Amount excluded from T2 due to cap (excess
over cap after redemptions and maturities) N.A.
Consolidated Pillar III Disclosures (September 30, 2016)
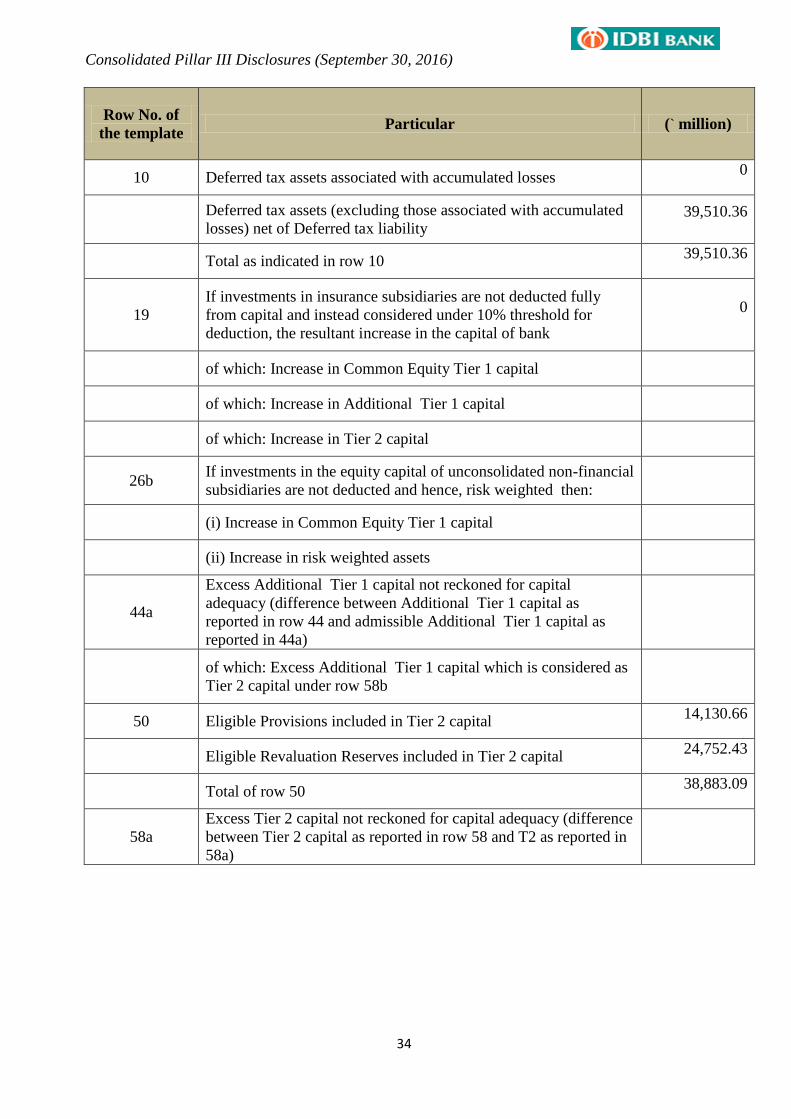
34
Row No. of
the template Particular (` million)
10 Deferred tax assets associated with accumulated losses 0
Deferred tax assets (excluding those associated with accumulated
losses) net of Deferred tax liability 39,510.36
Total as indicated in row 10
39,510.36
19
If investments in insurance subsidiaries are not deducted fully
from capital and instead considered under 10% threshold for
deduction, the resultant increase in the capital of bank
0
of which: Increase in Common Equity Tier 1 capital
of which: Increase in Additional Tier 1 capital
of which: Increase in Tier 2 capital
26b If investments in the equity capital of unconsolidated non-financial
subsidiaries are not deducted and hence, risk weighted then:
(i) Increase in Common Equity Tier 1 capital
(ii) Increase in risk weighted assets
44a
Excess Additional Tier 1 capital not reckoned for capital
adequacy (difference between Additional Tier 1 capital as
reported in row 44 and admissible Additional Tier 1 capital as
reported in 44a)
of which: Excess Additional Tier 1 capital which is considered as
Tier 2 capital under row 58b
50 Eligible Provisions included in Tier 2 capital 14,130.66
Eligible Revaluation Reserves included in Tier 2 capital
24,752.43
Total of row 50
38,883.09
58a
Excess Tier 2 capital not reckoned for capital adequacy (difference
between Tier 2 capital as reported in row 58 and T2 as reported in
58a)
Consolidated Pillar III Disclosures (September 30, 2016)
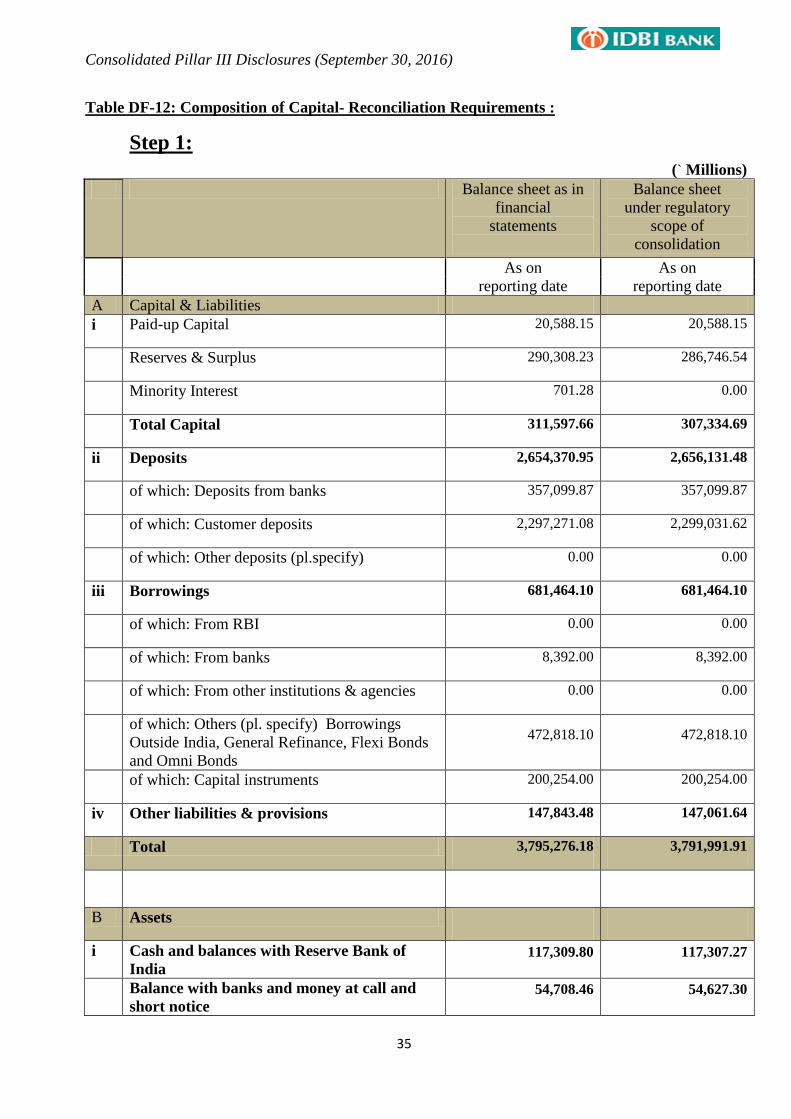
35
Table DF-12: Composition of Capital- Reconciliation Requirements :
Step 1:
(` Millions)
Balance sheet as in
financial
statements
Balance sheet
under regulatory
scope of
consolidation
As on As on
reporting date reporting date
A Capital & Liabilities
i Paid-up Capital 20,588.15 20,588.15
Reserves & Surplus 290,308.23 286,746.54
Minority Interest 701.28 0.00
Total Capital 311,597.66 307,334.69
ii Deposits 2,654,370.95 2,656,131.48
of which: Deposits from banks 357,099.87 357,099.87
of which: Customer deposits 2,297,271.08 2,299,031.62
of which: Other deposits (pl.specify) 0.00 0.00
iii Borrowings 681,464.10 681,464.10
of which: From RBI 0.00 0.00
of which: From banks 8,392.00 8,392.00
of which: From other institutions & agencies 0.00 0.00
of which: Others (pl. specify) Borrowings
Outside India, General Refinance, Flexi Bonds
and Omni Bonds
472,818.10 472,818.10
of which: Capital instruments 200,254.00 200,254.00
iv Other liabilities & provisions 147,843.48 147,061.64
Total 3,795,276.18 3,791,991.91
B Assets
i Cash and balances with Reserve Bank of
India 117,309.80 117,307.27
Balance with banks and money at call and
short notice 54,708.46 54,627.30
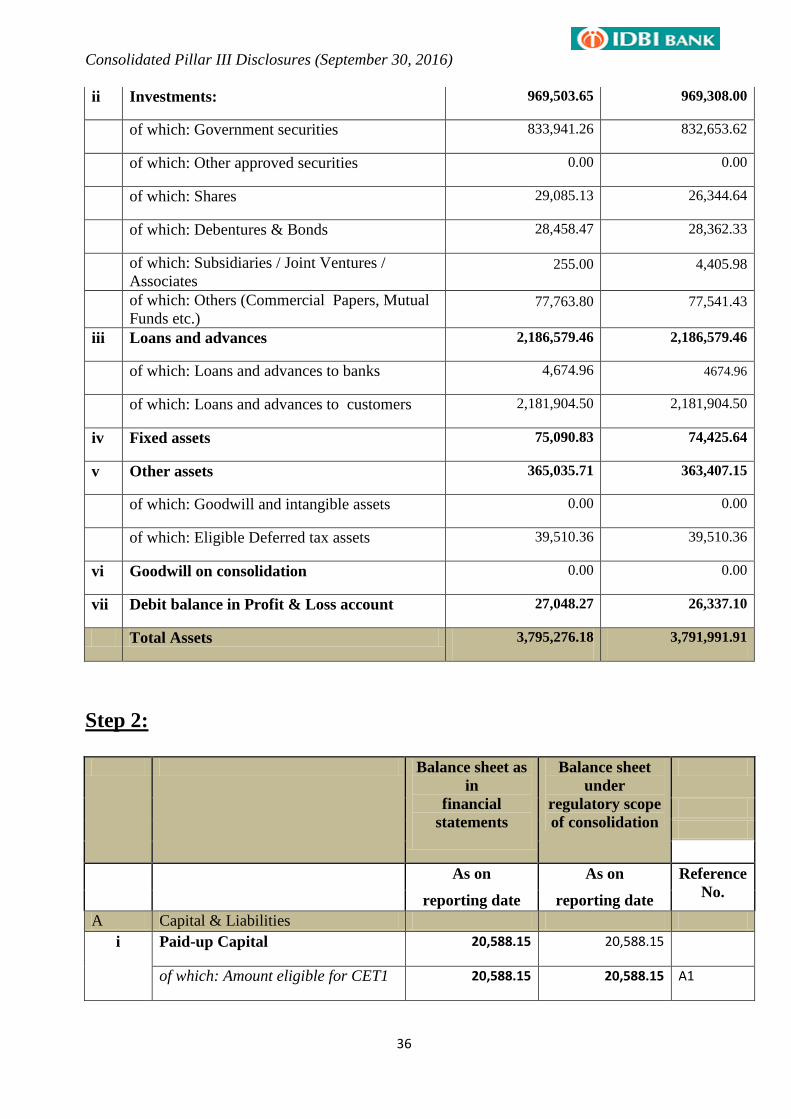
Consolidated Pillar III Disclosures (September 30, 2016)
36
ii Investments: 969,503.65 969,308.00
of which: Government securities 833,941.26 832,653.62
of which: Other approved securities 0.00 0.00
of which: Shares 29,085.13 26,344.64
of which: Debentures & Bonds 28,458.47 28,362.33
of which: Subsidiaries / Joint Ventures /
Associates 255.00 4,405.98
of which: Others (Commercial Papers, Mutual
Funds etc.) 77,763.80 77,541.43
iii Loans and advances 2,186,579.46 2,186,579.46
of which: Loans and advances to banks 4,674.96 4674.96
of which: Loans and advances to customers 2,181,904.50 2,181,904.50
iv Fixed assets 75,090.83 74,425.64
v Other assets 365,035.71 363,407.15
of which: Goodwill and intangible assets 0.00 0.00
of which: Eligible Deferred tax assets 39,510.36 39,510.36
vi Goodwill on consolidation 0.00 0.00
vii Debit balance in Profit & Loss account 27,048.27 26,337.10
Total Assets 3,795,276.18 3,791,991.91
Step 2:
Balance sheet as
in
financial
statements
Balance sheet
under
regulatory scope
of consolidation
As on As on Reference
No. reporting date reporting date
A Capital & Liabilities
i Paid-up Capital 20,588.15 20,588.15
of which: Amount eligible for CET1 20,588.15 20,588.15 A1
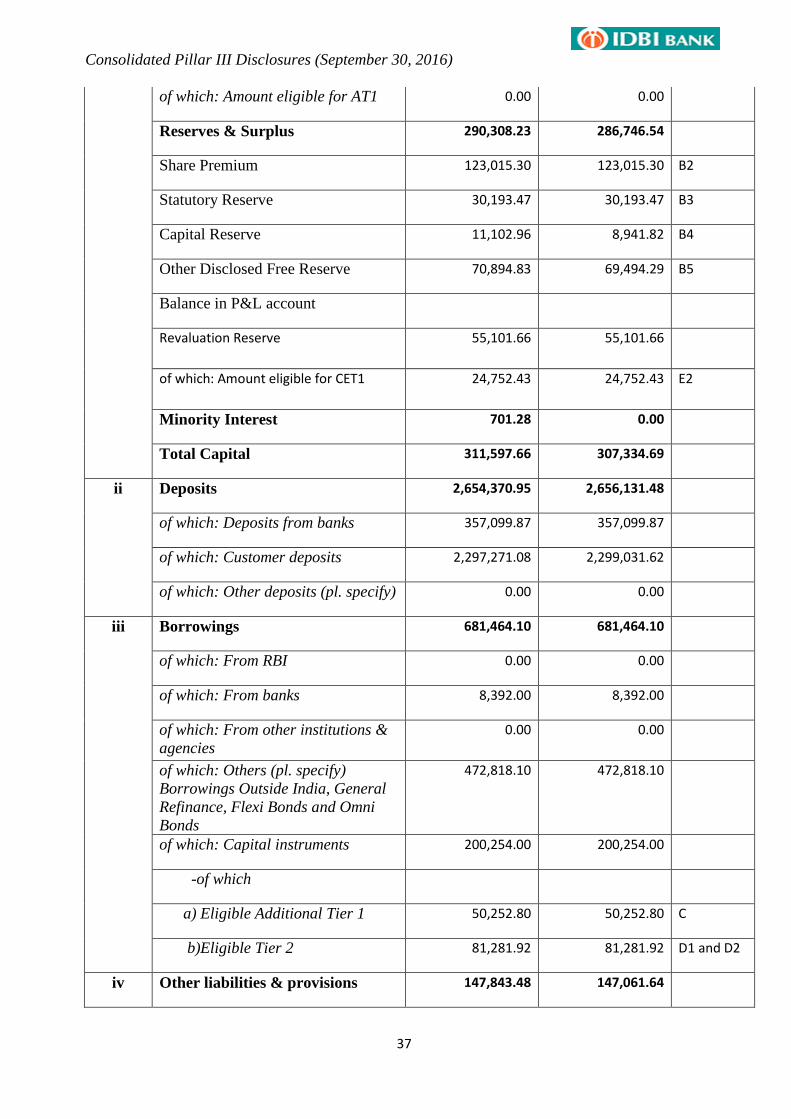
Consolidated Pillar III Disclosures (September 30, 2016)
37
of which: Amount eligible for AT1 0.00 0.00
Reserves & Surplus 290,308.23 286,746.54
Share Premium 123,015.30 123,015.30 B2
Statutory Reserve 30,193.47 30,193.47 B3
Capital Reserve 11,102.96 8,941.82 B4
Other Disclosed Free Reserve 70,894.83 69,494.29 B5
Balance in P&L account
Revaluation Reserve 55,101.66 55,101.66
of which: Amount eligible for CET1 24,752.43 24,752.43 E2
Minority Interest 701.28 0.00
Total Capital 311,597.66 307,334.69
ii Deposits 2,654,370.95 2,656,131.48
of which: Deposits from banks 357,099.87 357,099.87
of which: Customer deposits 2,297,271.08 2,299,031.62
of which: Other deposits (pl. specify) 0.00 0.00
iii Borrowings 681,464.10 681,464.10
of which: From RBI 0.00 0.00
of which: From banks 8,392.00 8,392.00
of which: From other institutions &
agencies
0.00 0.00
of which: Others (pl. specify)
Borrowings Outside India, General
Refinance, Flexi Bonds and Omni
Bonds
472,818.10 472,818.10
of which: Capital instruments 200,254.00 200,254.00
-of which
a) Eligible Additional Tier 1 50,252.80 50,252.80 C
b)Eligible Tier 2 81,281.92 81,281.92 D1 and D2
iv Other liabilities & provisions 147,843.48 147,061.64
Consolidated Pillar III Disclosures (September 30, 2016)
38
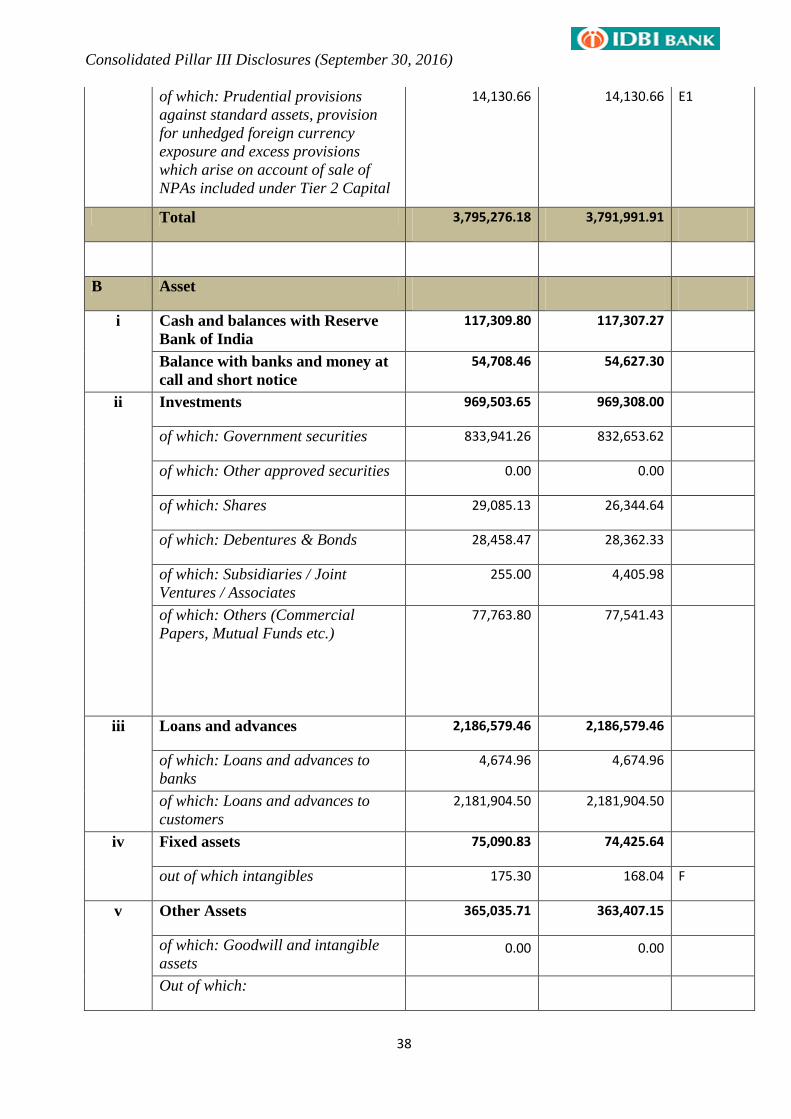
of which: Prudential provisions
against standard assets, provision
for unhedged foreign currency
exposure and excess provisions
which arise on account of sale of
NPAs included under Tier 2 Capital
14,130.66 14,130.66 E1
Total 3,795,276.18 3,791,991.91
B Asset
i Cash and balances with Reserve
Bank of India
117,309.80 117,307.27
Balance with banks and money at
call and short notice
54,708.46 54,627.30
ii Investments 969,503.65 969,308.00
of which: Government securities 833,941.26 832,653.62
of which: Other approved securities 0.00 0.00
of which: Shares 29,085.13 26,344.64
of which: Debentures & Bonds 28,458.47 28,362.33
of which: Subsidiaries / Joint
Ventures / Associates
255.00 4,405.98
of which: Others (Commercial
Papers, Mutual Funds etc.)
77,763.80 77,541.43
iii Loans and advances 2,186,579.46 2,186,579.46
of which: Loans and advances to
banks
4,674.96 4,674.96
of which: Loans and advances to
customers
2,181,904.50 2,181,904.50
iv Fixed assets 75,090.83 74,425.64
out of which intangibles 175.30 168.04 F
v Other Assets 365,035.71 363,407.15
of which: Goodwill and intangible
assets 0.00 0.00
Out of which:
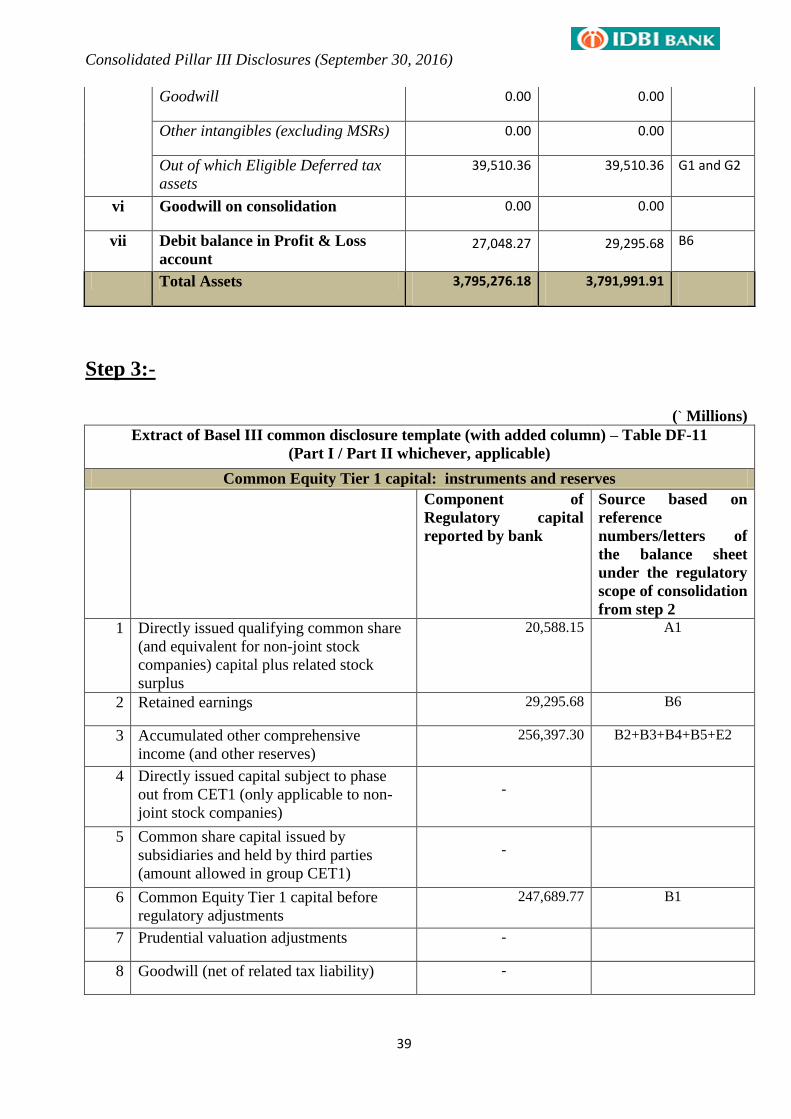
Consolidated Pillar III Disclosures (September 30, 2016)
39
Goodwill 0.00 0.00
Other intangibles (excluding MSRs) 0.00 0.00
Out of which Eligible Deferred tax
assets
39,510.36 39,510.36 G1 and G2
vi Goodwill on consolidation 0.00 0.00
vii Debit balance in Profit & Loss
account 27,048.27 29,295.68 B6
Total Assets 3,795,276.18 3,791,991.91
Step 3:-
(` Millions)
Extract of Basel III common disclosure template (with added column) – Table DF-11
(Part I / Part II whichever, applicable)
Common Equity Tier 1 capital: instruments and reserves
Component of
Regulatory capital
reported by bank
Source based on
reference
numbers/letters of
the balance sheet
under the regulatory
scope of consolidation
from step 2
1 Directly issued qualifying common share
(and equivalent for non-joint stock
companies) capital plus related stock
surplus
20,588.15 A1
2 Retained earnings 29,295.68 B6
3 Accumulated other comprehensive
income (and other reserves)
256,397.30 B2+B3+B4+B5+E2
4 Directly issued capital subject to phase
out from CET1 (only applicable to non-
joint stock companies)
-
5 Common share capital issued by
subsidiaries and held by third parties
(amount allowed in group CET1)
-
6 Common Equity Tier 1 capital before
regulatory adjustments
247,689.77 B1
7 Prudential valuation adjustments -
8 Goodwill (net of related tax liability) -
Consolidated Pillar III Disclosures (September 30, 2016)
40
Table DF- 13: Main features of regulatory capital instruments
“DF- 13: Main features of regulatory capital instruments issued by the Bank are available on the
website under "Regulatory Disclosure Section >> FY 2015-16 (Basel III) >> September 2016".
Table DF-14: Terms and Conditions of Regulatory Capital Instruments issued by the Bank
„„DF- 14.The Term Sheets for regulatory capital instruments issued by the Bank are available on
the website under "Regulatory Disclosure Section >> FY 2015-16 (Basel III) >>September 2016".
Table DF-16: Equities – Banking Book Positions
Equity investments in the following are held in the Banking book:
1. Subsidiaries & JVs - These are intended to be held for a long time with an intention to
participate in the distribution of profits of the companies. These investments are classified as
HTM.
2. Associates - Most of these investments were originated by the erstwhile Development Financial
Institutional (DFI) in fulfillment of its development banking role. Bank intends to divest these
investments as and when opportunity arises. These investments are classified as AFS.
3. Shareholding of less than 20% in equity capital of the investee companies which has been
acquired through subscription / purchase / conversion of loan dues into equity/ recovery
of recompense. These are intended to be held over medium term and to be divested through
buyback and or sale through third parties, stock exchanges or otherwise. These investments are
classified as AFS.
As per the RBI guidelines, investments classified under HTM category need not be marked to
market and carried at acquisition cost. Any diminution, other than temporary, in the value of equity
investments is provided for. Any loss on sale of investments in HTM category is recognized in the
profit and loss statement. Any profit on sale of investments under HTM category is recognized in
the profit and loss statement and is then appropriated to capital reserve, net of taxes and statutory
reserve.
As per the Investment policy , the quoted equity shares in the Bank's portfolio are marked to
market on a daily basis. Equity shares for which current quotations are not available or where the
shares are not quoted on the stock exchanges, are valued at the break-up value (without considering
„revaluation reserves‟, if any) which is ascertained from the company‟s latest balance sheet (not
more than one year prior to the date of valuation). In case the latest balance sheet is not available
the shares are valued at Re.1 per company.
There has been no change in these practices during the reporting period
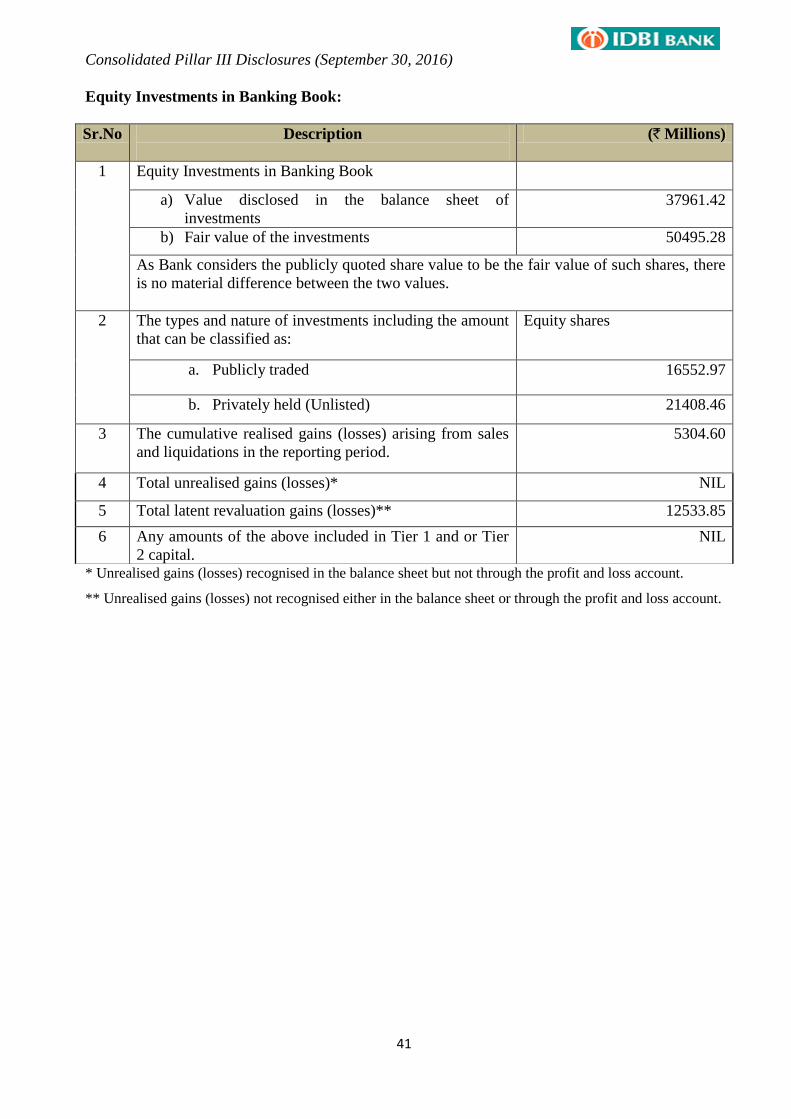
Consolidated Pillar III Disclosures (September 30, 2016)
41
Equity Investments in Banking Book:
* Unrealised gains (losses) recognised in the balance sheet but not through the profit and loss account.
** Unrealised gains (losses) not recognised either in the balance sheet or through the profit and loss account.
Sr.No Description
(` Millions)
1
Equity Investments in Banking Book
a) Value disclosed in the balance sheet of
investments
37961.42
b) Fair value of the investments 50495.28
As Bank considers the publicly quoted share value to be the fair value of such shares, there
is no material difference between the two values.
2 The types and nature of investments including the amount
that can be classified as:
Equity shares
a. Publicly traded 16552.97
b. Privately held (Unlisted) 21408.46
3 The cumulative realised gains (losses) arising from sales
and liquidations in the reporting period.
5304.60
4 Total unrealised gains (losses)* NIL
5 Total latent revaluation gains (losses)** 12533.85
6 Any amounts of the above included in Tier 1 and or Tier
2 capital.
NIL
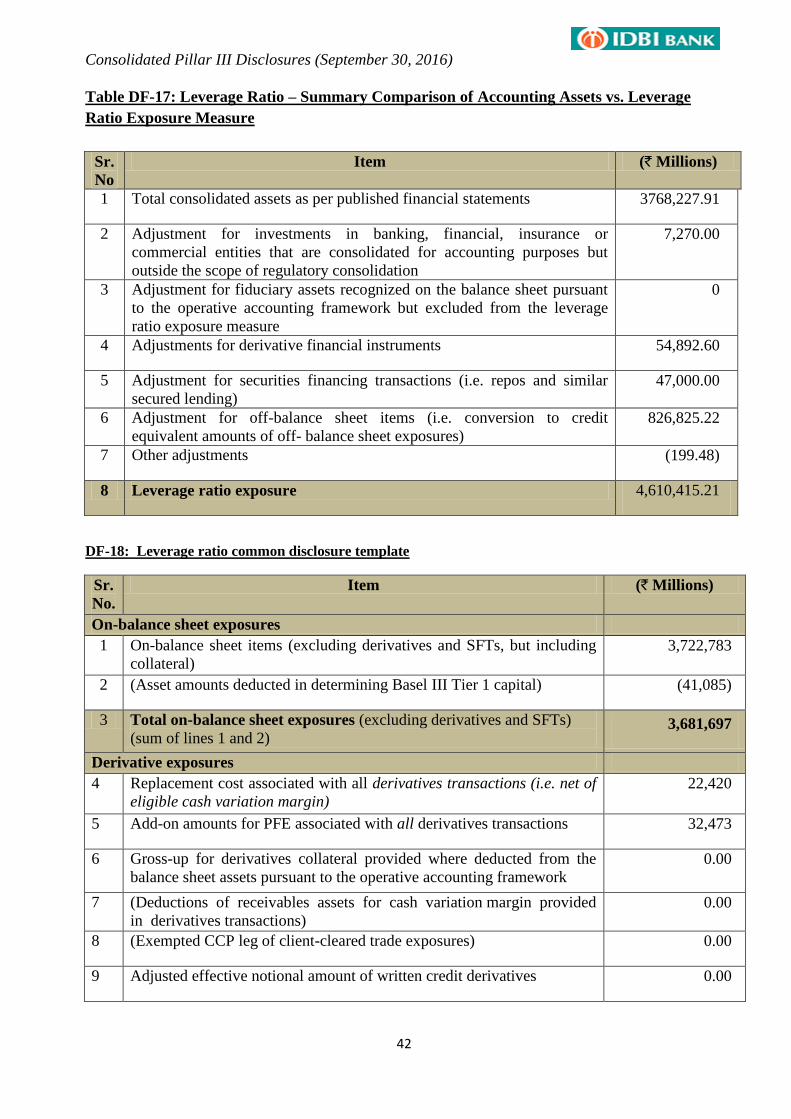
Consolidated Pillar III Disclosures (September 30, 2016)
42
Table DF-17: Leverage Ratio – Summary Comparison of Accounting Assets vs. Leverage
Ratio Exposure Measure
Sr.
No
Item (` Millions)
1 Total consolidated assets as per published financial statements 3768,227.91
2 Adjustment for investments in banking, financial, insurance or
commercial entities that are consolidated for accounting purposes but
outside the scope of regulatory consolidation
7,270.00
3 Adjustment for fiduciary assets recognized on the balance sheet pursuant
to the operative accounting framework but excluded from the leverage
ratio exposure measure
0
4 Adjustments for derivative financial instruments 54,892.60
5 Adjustment for securities financing transactions (i.e. repos and similar
secured lending)
47,000.00
6 Adjustment for off-balance sheet items (i.e. conversion to credit
equivalent amounts of off- balance sheet exposures)
826,825.22
7 Other adjustments (199.48)
8 Leverage ratio exposure 4,610,415.21
DF-18: Leverage ratio common disclosure template
Sr.
No.
Item (` Millions)
On-balance sheet exposures
1 On-balance sheet items (excluding derivatives and SFTs, but including
collateral)
3,722,783
2 (Asset amounts deducted in determining Basel III Tier 1 capital) (41,085)
3 Total on-balance sheet exposures (excluding derivatives and SFTs)
(sum of lines 1 and 2) 3,681,697
Derivative exposures
4 Replacement cost associated with all derivatives transactions (i.e. net of
eligible cash variation margin)
22,420
5 Add-on amounts for PFE associated with all derivatives transactions 32,473
6 Gross-up for derivatives collateral provided where deducted from the
balance sheet assets pursuant to the operative accounting framework
0.00
7 (Deductions of receivables assets for cash variation margin provided
in derivatives transactions)
0.00
8 (Exempted CCP leg of client-cleared trade exposures) 0.00
9 Adjusted effective notional amount of written credit derivatives 0.00
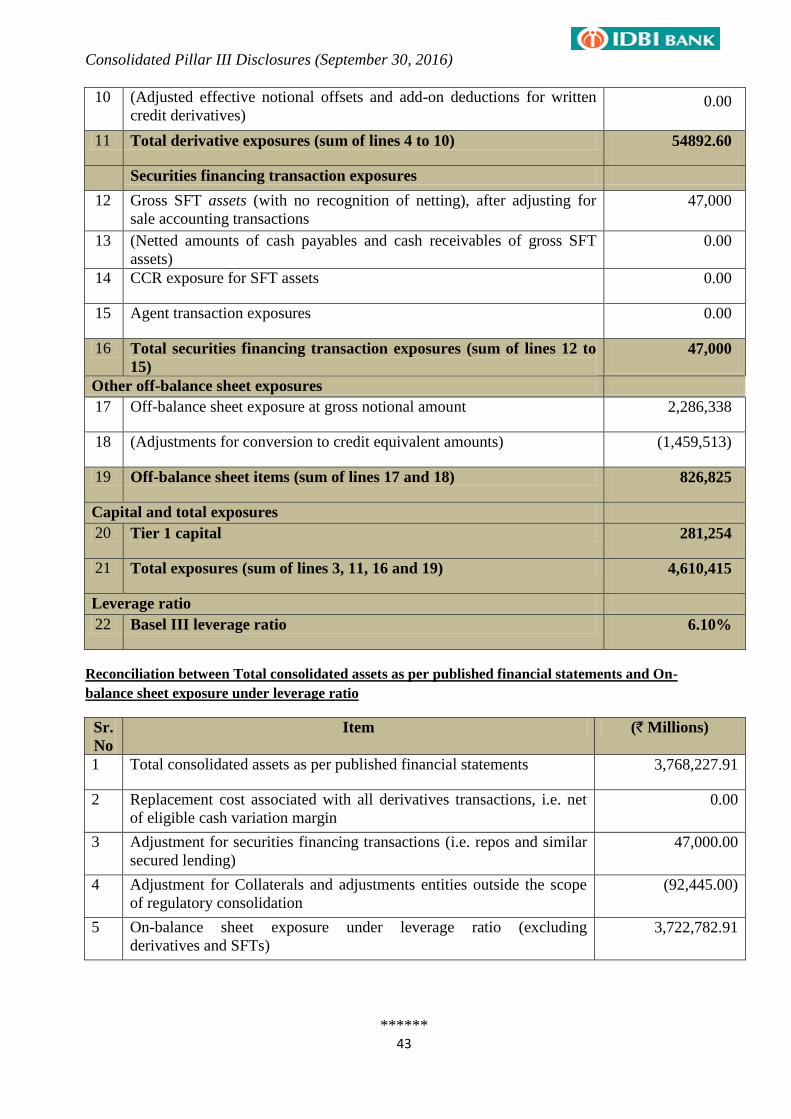
Consolidated Pillar III Disclosures (September 30, 2016)
43
10 (Adjusted effective notional offsets and add-on deductions for written
credit derivatives) 0.00
11 Total derivative exposures (sum of lines 4 to 10) 54892.60
Securities financing transaction exposures
12 Gross SFT assets (with no recognition of netting), after adjusting for
sale accounting transactions
47,000
13 (Netted amounts of cash payables and cash receivables of gross SFT
assets)
0.00
14 CCR exposure for SFT assets 0.00
15 Agent transaction exposures 0.00
16 Total securities financing transaction exposures (sum of lines 12 to
15)
47,000
Other off-balance sheet exposures
17 Off-balance sheet exposure at gross notional amount 2,286,338
18 (Adjustments for conversion to credit equivalent amounts) (1,459,513)
19 Off-balance sheet items (sum of lines 17 and 18) 826,825
Capital and total exposures
20 Tier 1 capital 281,254
21 Total exposures (sum of lines 3, 11, 16 and 19) 4,610,415
Leverage ratio
22 Basel III leverage ratio 6.10%
Reconciliation between Total consolidated assets as per published financial statements and On-
balance sheet exposure under leverage ratio
Sr.
No
Item (` Millions)
1 Total consolidated assets as per published financial statements 3,768,227.91
2 Replacement cost associated with all derivatives transactions, i.e. net
of eligible cash variation margin
0.00
3 Adjustment for securities financing transactions (i.e. repos and similar
secured lending)
47,000.00
4 Adjustment for Collaterals and adjustments entities outside the scope
of regulatory consolidation
(92,445.00)
5 On-balance sheet exposure under leverage ratio (excluding
derivatives and SFTs)
3,722,782.91
******