Embed Size (px)
Citation preview
July 14th
, 2010
IDBI Bank Ltd.
Not just for the big boys…
SKP Securities Ltd www.skpmoneywise.com 1 of 12
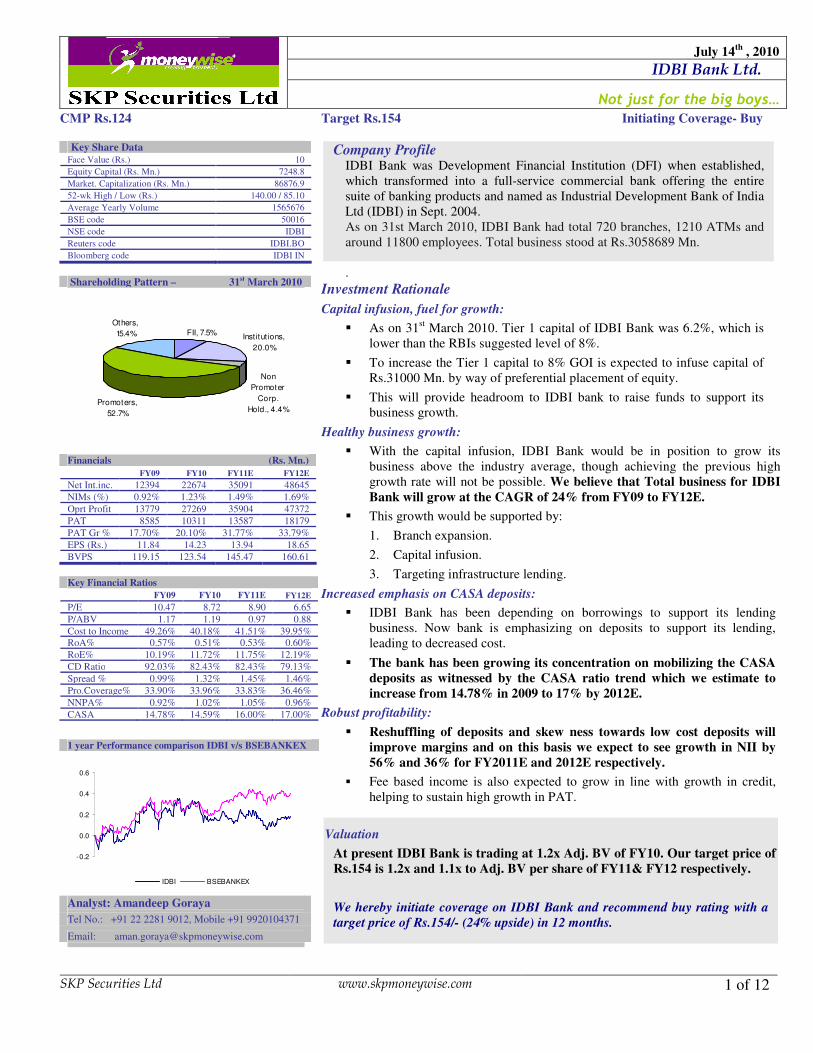
CMP Rs.124 Target Rs.154 Initiating Coverage- Buy
Key Share Data Face Value (Rs.) 10
Equity Capital (Rs. Mn.) 7248.8
Market. Capitalization (Rs. Mn.) 86876.9
52-wk High / Low (Rs.) 140.00 / 85.10
Average Yearly Volume 1565676
BSE code 50016
NSE code IDBI
Reuters code IDBI.BO
Bloomberg code IDBI IN
Shareholding Pattern – 31st March 2010
FII, 7.5%Institutions,
20.0%
Non
Promoter
Corp.
Hold., 4.4%Promoters,
52.7%
Others,
15.4%
Financials (Rs. Mn.)
FY09 FY10 FY11E FY12E
Net Int.inc. 12394 22674 35091 48645
NIMs (%) 0.92% 1.23% 1.49% 1.69%
Oprt Profit 13779 27269 35904 47372
PAT 8585 10311 13587 18179
PAT Gr % 17.70% 20.10% 31.77% 33.79%
EPS (Rs.) 11.84 14.23 13.94 18.65
BVPS 119.15 123.54 145.47 160.61
Key Financial Ratios
FY09 FY10 FY11E FY12E
P/E 10.47 8.72 8.90 6.65
P/ABV 1.17 1.19 0.97 0.88
Cost to Income 49.26% 40.18% 41.51% 39.95%
RoA% 0.57% 0.51% 0.53% 0.60%
RoE% 10.19% 11.72% 11.75% 12.19%
CD Ratio 92.03% 82.43% 82.43% 79.13%
Spread % 0.99% 1.32% 1.45% 1.46%
Pro.Coverage% 33.90% 33.96% 33.83% 36.46%
NNPA% 0.92% 1.02% 1.05% 0.96%
CASA 14.78% 14.59% 16.00% 17.00%
1 year Performance comparison IDBI v/s BSEBANKEX
-0.2
0.0
0.2
0.4
0.6
IDBI BSEBANKEX
Analyst: Amandeep Goraya
Tel No.: +91 22 2281 9012, Mobile +91 9920104371
Email: [email protected]
Company Profile IDBI Bank was Development Financial Institution (DFI) when established,
which transformed into a full-service commercial bank offering the entire
suite of banking products and named as Industrial Development Bank of India
Ltd (IDBI) in Sept. 2004.
As on 31st March 2010, IDBI Bank had total 720 branches, 1210 ATMs and
around 11800 employees. Total business stood at Rs.3058689 Mn.
.
Investment Rationale
Capital infusion, fuel for growth:
� As on 31st March 2010. Tier 1 capital of IDBI Bank was 6.2%, which is
lower than the RBIs suggested level of 8%.
� To increase the Tier 1 capital to 8% GOI is expected to infuse capital of
Rs.31000 Mn. by way of preferential placement of equity.
� This will provide headroom to IDBI bank to raise funds to support its
business growth.
Healthy business growth:
� With the capital infusion, IDBI Bank would be in position to grow its
business above the industry average, though achieving the previous high
growth rate will not be possible. We believe that Total business for IDBI
Bank will grow at the CAGR of 24% from FY09 to FY12E.
� This growth would be supported by:
1. Branch expansion.
2. Capital infusion.
3. Targeting infrastructure lending.
Increased emphasis on CASA deposits:
� IDBI Bank has been depending on borrowings to support its lending
business. Now bank is emphasizing on deposits to support its lending,
leading to decreased cost.
� The bank has been growing its concentration on mobilizing the CASA
deposits as witnessed by the CASA ratio trend which we estimate to
increase from 14.78% in 2009 to 17% by 2012E.
Robust profitability:
� Reshuffling of deposits and skew ness towards low cost deposits will
improve margins and on this basis we expect to see growth in NII by
56% and 36% for FY2011E and 2012E respectively.
� Fee based income is also expected to grow in line with growth in credit,
helping to sustain high growth in PAT.
Valuation
At present IDBI Bank is trading at 1.2x Adj. BV of FY10. Our target price of
Rs.154 is 1.2x and 1.1x to Adj. BV per share of FY11& FY12 respectively.
We hereby initiate coverage on IDBI Bank and recommend buy rating with a
target price of Rs.154/- (24% upside) in 12 months.
IDBI Bank Ltd.
SKP Securities Ltd www.skpmoneywise.com Page 2 of 12
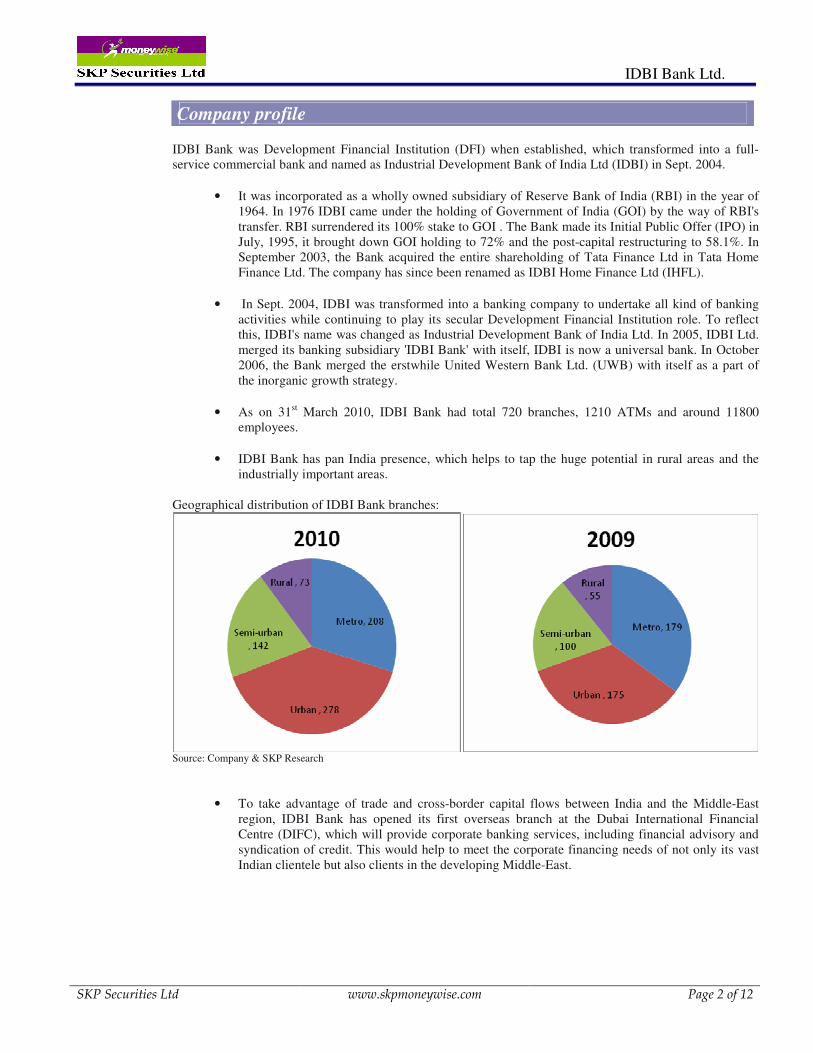
IDBI Bank was Development Financial Institution (DFI) when established, which transformed into a full-
service commercial bank and named as Industrial Development Bank of India Ltd (IDBI) in Sept. 2004.
• It was incorporated as a wholly owned subsidiary of Reserve Bank of India (RBI) in the year of
1964. In 1976 IDBI came under the holding of Government of India (GOI) by the way of RBI's
transfer. RBI surrendered its 100% stake to GOI . The Bank made its Initial Public Offer (IPO) in
July, 1995, it brought down GOI holding to 72% and the post-capital restructuring to 58.1%. In
September 2003, the Bank acquired the entire shareholding of Tata Finance Ltd in Tata Home
Finance Ltd. The company has since been renamed as IDBI Home Finance Ltd (IHFL).
• In Sept. 2004, IDBI was transformed into a banking company to undertake all kind of banking
activities while continuing to play its secular Development Financial Institution role. To reflect
this, IDBI's name was changed as Industrial Development Bank of India Ltd. In 2005, IDBI Ltd.
merged its banking subsidiary 'IDBI Bank' with itself, IDBI is now a universal bank. In October
2006, the Bank merged the erstwhile United Western Bank Ltd. (UWB) with itself as a part of
the inorganic growth strategy.
• As on 31st March 2010, IDBI Bank had total 720 branches, 1210 ATMs and around 11800
employees.
• IDBI Bank has pan India presence, which helps to tap the huge potential in rural areas and the
industrially important areas.
Geographical distribution of IDBI Bank branches:
Source: Company & SKP Research
• To take advantage of trade and cross-border capital flows between India and the Middle-East
region, IDBI Bank has opened its first overseas branch at the Dubai International Financial
Centre (DIFC), which will provide corporate banking services, including financial advisory and
syndication of credit. This would help to meet the corporate financing needs of not only its vast
Indian clientele but also clients in the developing Middle-East.
Company profile
IDBI Bank Ltd.
SKP Securities Ltd www.skpmoneywise.com Page 3 of 12
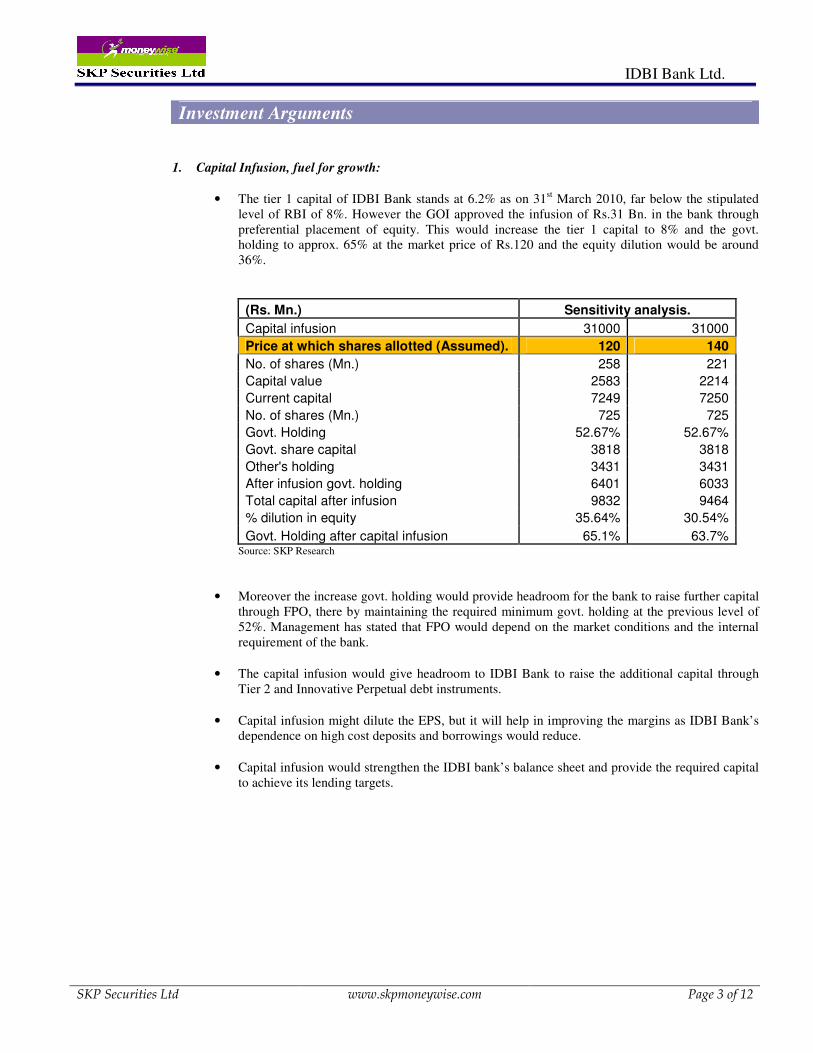
1. Capital Infusion, fuel for growth:
• The tier 1 capital of IDBI Bank stands at 6.2% as on 31st March 2010, far below the stipulated
level of RBI of 8%. However the GOI approved the infusion of Rs.31 Bn. in the bank through
preferential placement of equity. This would increase the tier 1 capital to 8% and the govt.
holding to approx. 65% at the market price of Rs.120 and the equity dilution would be around
36%.
(Rs. Mn.) Sensitivity analysis.
Capital infusion 31000 31000
Price at which shares allotted (Assumed). 120 140
No. of shares (Mn.) 258 221
Capital value 2583 2214
Current capital 7249 7250
No. of shares (Mn.) 725 725
Govt. Holding 52.67% 52.67%
Govt. share capital 3818 3818
Other's holding 3431 3431
After infusion govt. holding 6401 6033
Total capital after infusion 9832 9464
% dilution in equity 35.64% 30.54%
Govt. Holding after capital infusion 65.1% 63.7% Source: SKP Research
• Moreover the increase govt. holding would provide headroom for the bank to raise further capital
through FPO, there by maintaining the required minimum govt. holding at the previous level of
52%. Management has stated that FPO would depend on the market conditions and the internal
requirement of the bank.
• The capital infusion would give headroom to IDBI Bank to raise the additional capital through
Tier 2 and Innovative Perpetual debt instruments.
• Capital infusion might dilute the EPS, but it will help in improving the margins as IDBI Bank’s
dependence on high cost deposits and borrowings would reduce.
• Capital infusion would strengthen the IDBI bank’s balance sheet and provide the required capital
to achieve its lending targets.
Investment Arguments

IDBI Bank Ltd.
SKP Securities Ltd www.skpmoneywise.com Page 4 of 12
2. Healthy business growth:
• With the capital infusion, IDBI Bank would be in position to grow its business above the industry
average, though achieving the previous high growth rate will not be possible. We believe that
Total business for IDBI Bank will grow at the CAGR of 24% from FY09 to FY12E.
20%23%
42%39%
0
500000
1000000
1500000
2000000
2500000
3000000
2009 2010 2011 E 2012 E
Rs. M
n.
0%
5%
10%
15%
20%
25%
30%
35%
40%
45%
Advances Depossts Total business Growth rate (RHS)
Source: Company & SKP Research
• IDBI Bank has substantial portion of its loan book consisting of corporate lending.
Source: Company & SKP Research
• We expect the bank to continue focus on corporate segment, with infrastructure lending as major
growth driver.
• We for see strong growth prospects in the infrastructure sector supported by the govt. spending
and ongoing construction activities in realty sector. This will act as the major contributor towards
the growth in IDBI bank’s loan book.
CAGR 24%

IDBI Bank Ltd.
SKP Securities Ltd www.skpmoneywise.com Page 5 of 12
3. Increased emphasis on CASA deposits:
• We expect deposits of IDBI Bank to grow at CAGR of 31% over 2009 to 2012E.
• IDBI Bank has been depending on borrowings to support its lending business. Now bank is
emphasizing on deposits to support its lending, leading to decreased cost as CASA deposits
would be targeted.
29%
56%
65%72% 73% 75%
58%
42%46%
34%
26%20%
17%18%
0%
10%
20%
30%
40%
50%
60%
70%
80%
2006 2007 2008 2009 2010 2011 E 2012 E
Deposits to Total Liabilities Borrowings to total Liabilities
Source: Company & SKP Research
• The bank has been growing its concentration on mobilizing the CASA deposits as witnessed
by the CASA ratio trend which we estimate to increase from 14.78% in 2009 to 17% by
2012E. Growth in CASA is backed on: 1. Branch expansion
2. Marketing network
3. Healthy customer relationship.
14.78% 14.59% 16.00% 17.00%
37.45%
47.19%
31.61% 32.81%
0%
5%
10%
15%
20%
25%
30%
35%
40%
45%
50%
2009 2010 2011 E 2012 E
CASA ratio CASA growth
Source: Company & SKP Research
• IDBI Bank has achieved 100% CBS, this would help in bringing the current account deposits.
IDBI Bank Ltd.
SKP Securities Ltd www.skpmoneywise.com Page 6 of 12
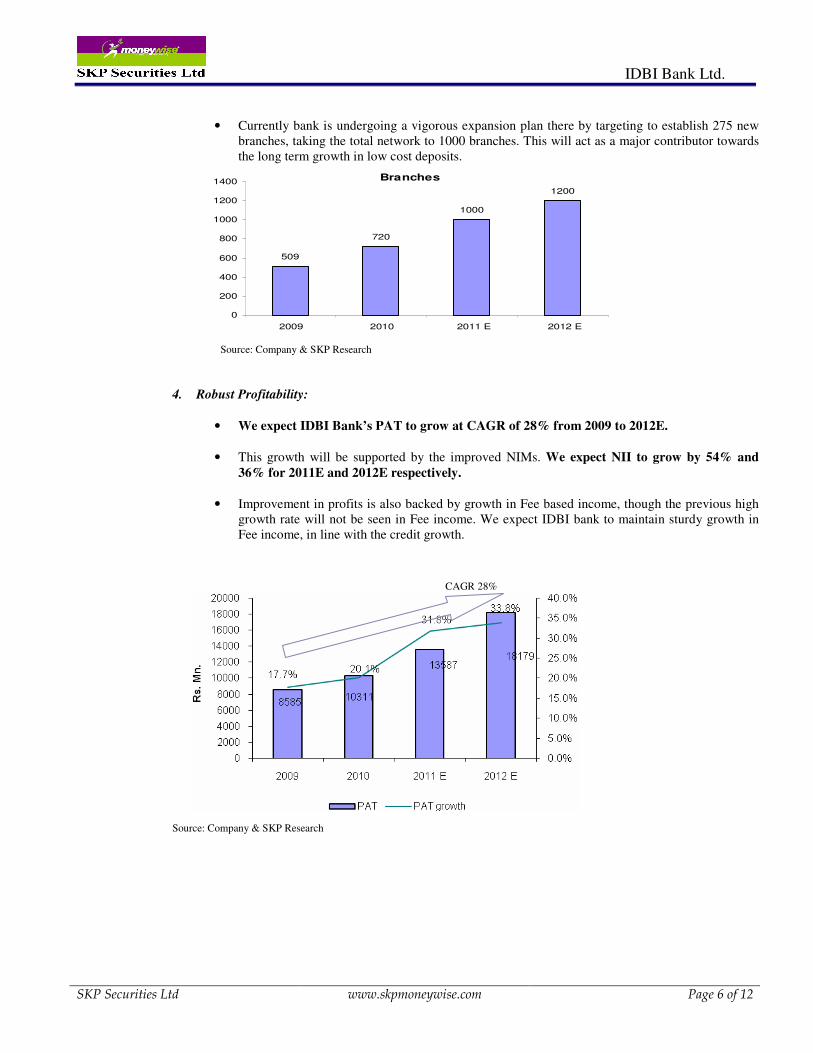
• Currently bank is undergoing a vigorous expansion plan there by targeting to establish 275 new
branches, taking the total network to 1000 branches. This will act as a major contributor towards
the long term growth in low cost deposits.
Branches
509
720
1000
1200
0
200
400
600
800
1000
1200
1400
2009 2010 2011 E 2012 E
Source: Company & SKP Research
4. Robust Profitability:
• We expect IDBI Bank’s PAT to grow at CAGR of 28% from 2009 to 2012E.
• This growth will be supported by the improved NIMs. We expect NII to grow by 54% and
36% for 2011E and 2012E respectively.
• Improvement in profits is also backed by growth in Fee based income, though the previous high
growth rate will not be seen in Fee income. We expect IDBI bank to maintain sturdy growth in
Fee income, in line with the credit growth.
Source: Company & SKP Research
CAGR 28%
IDBI Bank Ltd.
SKP Securities Ltd www.skpmoneywise.com Page 7 of 12
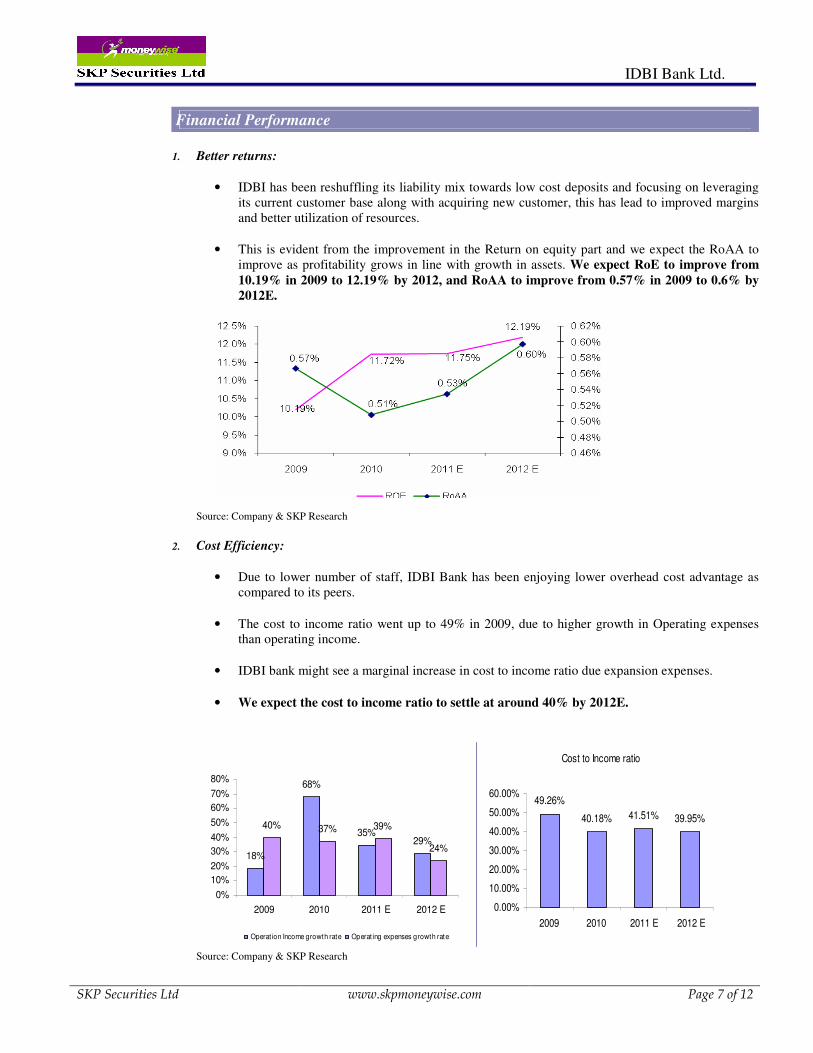
1. Better returns:
• IDBI has been reshuffling its liability mix towards low cost deposits and focusing on leveraging
its current customer base along with acquiring new customer, this has lead to improved margins
and better utilization of resources.
• This is evident from the improvement in the Return on equity part and we expect the RoAA to
improve as profitability grows in line with growth in assets. We expect RoE to improve from
10.19% in 2009 to 12.19% by 2012, and RoAA to improve from 0.57% in 2009 to 0.6% by
2012E.
Source: Company & SKP Research
2. Cost Efficiency:
• Due to lower number of staff, IDBI Bank has been enjoying lower overhead cost advantage as
compared to its peers.
• The cost to income ratio went up to 49% in 2009, due to higher growth in Operating expenses
than operating income.
• IDBI bank might see a marginal increase in cost to income ratio due expansion expenses.
• We expect the cost to income ratio to settle at around 40% by 2012E.
18%
68%
35%29%
40% 37% 39%
24%
0%
10%
20%
30%
40%
50%
60%
70%
80%
2009 2010 2011 E 2012 E
Operation Income growth rate Operat ing expenses growth rate
Cost to Income ratio
49.26%
40.18% 41.51% 39.95%
0.00%
10.00%
20.00%
30.00%
40.00%
50.00%
60.00%
2009 2010 2011 E 2012 E
Source: Company & SKP Research
Financial Performance

IDBI Bank Ltd.
SKP Securities Ltd www.skpmoneywise.com Page 8 of 12
One year forward Price to Book Value band chart:
Source: Capitaline & SKP Research.
One year forward Price to Adj. Book Value band chart:
0
50
100
150
200
250
300
Date
28/0
6/2
005
29/0
9/2
005
02/0
1/2
006
07/0
4/2
006
07/0
7/2
006
09/1
0/2
006
10/0
1/2
007
17/0
4/2
007
18/0
7/2
007
18/1
0/2
007
18/0
1/2
008
24/0
4/2
008
25/0
7/2
008
29/1
0/2
008
05/0
2/2
009
19/0
5/2
009
17/0
8/2
009
20/1
1/2
009
24/0
2/2
010
31/0
5/2
010
Source: Capitaline & SKP Research.
At present IDBI Bank is trading at 1.2x Adj. BV of FY10. Our target price of Rs.154 is 1.2x and 1.1x
to Adj. BV per share of FY11E& FY12E respectively.
We hereby initiate coverage on IDBI Bank and recommend buy rating with a target price of Rs.154/-
(24% upside) in 12 months.
Valuations & Outlook
1.6x
1.2x
0.8x
0.4x
2x
1.6x
1.2x
0.8x
0.4x
IDBI Bank Ltd.
SKP Securities Ltd www.skpmoneywise.com Page 9 of 12
Key Concerns
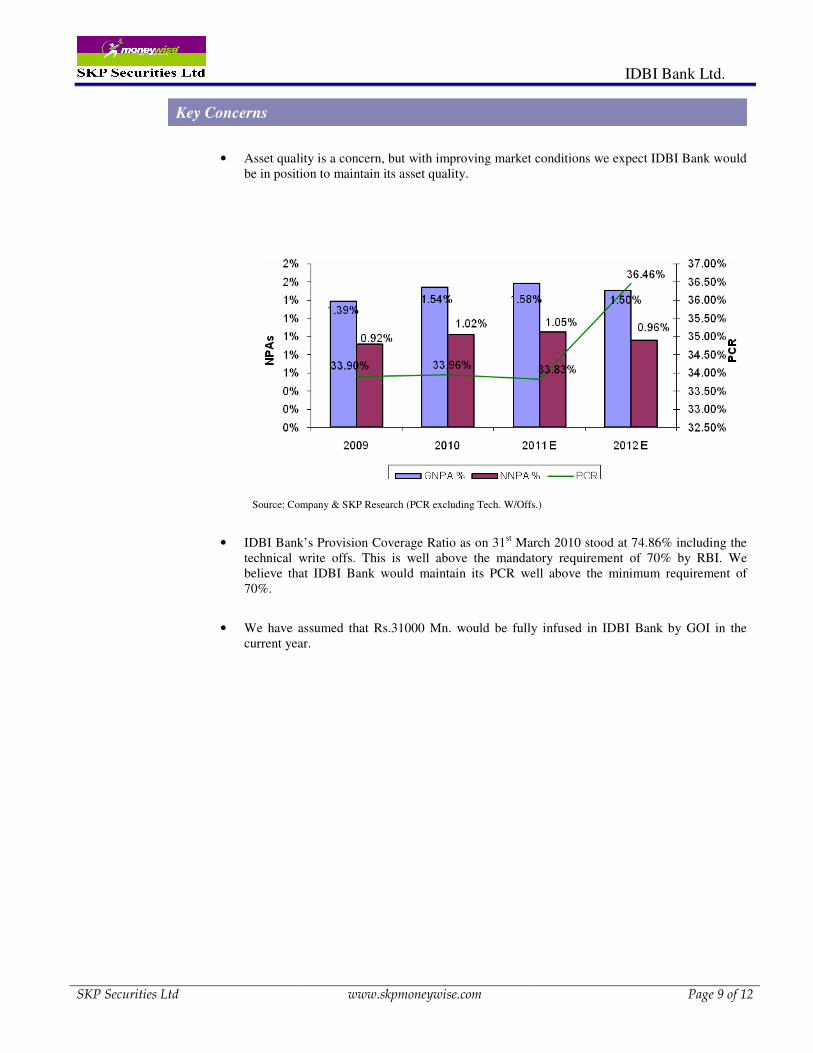
• Asset quality is a concern, but with improving market conditions we expect IDBI Bank would
be in position to maintain its asset quality.
Source: Company & SKP Research (PCR excluding Tech. W/Offs.)
• IDBI Bank’s Provision Coverage Ratio as on 31st March 2010 stood at 74.86% including the
technical write offs. This is well above the mandatory requirement of 70% by RBI. We
believe that IDBI Bank would maintain its PCR well above the minimum requirement of
70%.
• We have assumed that Rs.31000 Mn. would be fully infused in IDBI Bank by GOI in the
current year.
IDBI Bank Ltd.
SKP Securities Ltd www.skpmoneywise.com Page 10 of 12
Financial Statements & Ratios
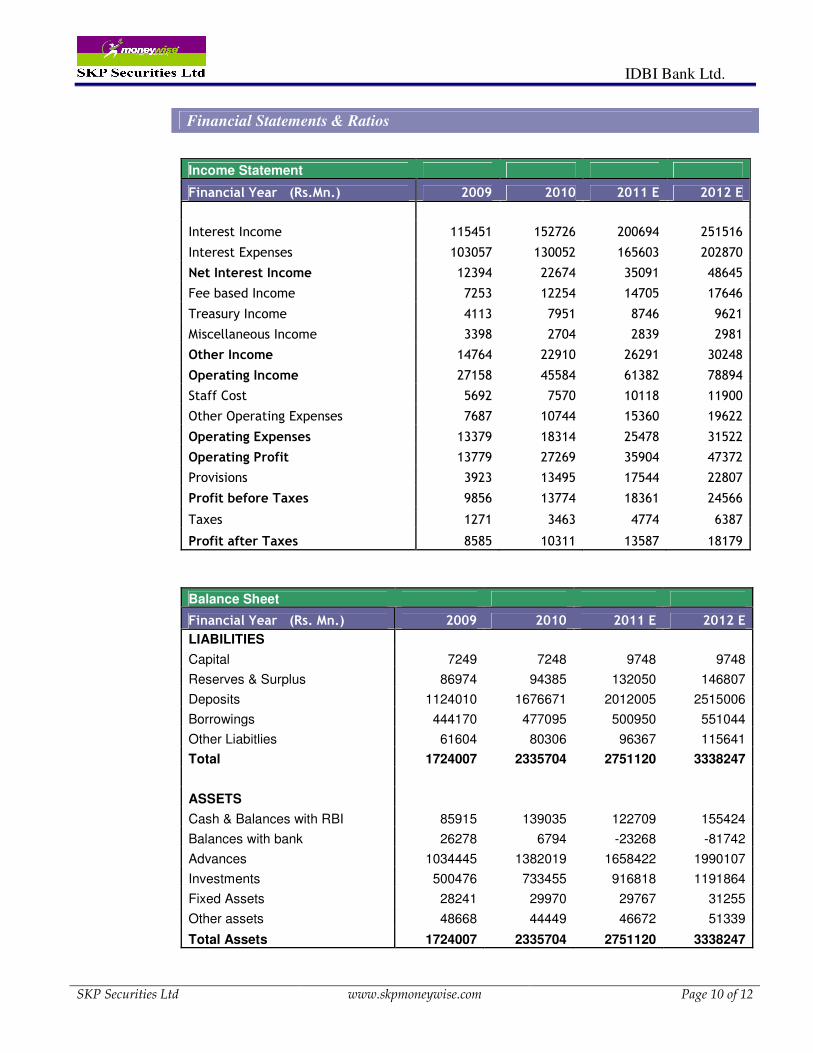
Income Statement
Financial Year (Rs.Mn.) 2009 2010 2011 E 2012 E
Interest Income 115451 152726 200694 251516
Interest Expenses 103057 130052 165603 202870
Net Interest Income 12394 22674 35091 48645
Fee based Income 7253 12254 14705 17646
Treasury Income 4113 7951 8746 9621
Miscellaneous Income 3398 2704 2839 2981
Other Income 14764 22910 26291 30248
Operating Income 27158 45584 61382 78894
Staff Cost 5692 7570 10118 11900
Other Operating Expenses 7687 10744 15360 19622
Operating Expenses 13379 18314 25478 31522
Operating Profit 13779 27269 35904 47372
Provisions 3923 13495 17544 22807
Profit before Taxes 9856 13774 18361 24566
Taxes 1271 3463 4774 6387
Profit after Taxes 8585 10311 13587 18179
Balance Sheet
Financial Year (Rs. Mn.) 2009 2010 2011 E 2012 E
LIABILITIES
Capital 7249 7248 9748 9748
Reserves & Surplus 86974 94385 132050 146807
Deposits 1124010 1676671 2012005 2515006
Borrowings 444170 477095 500950 551044
Other Liabitlies 61604 80306 96367 115641
Total 1724007 2335704 2751120 3338247
ASSETS
Cash & Balances with RBI 85915 139035 122709 155424
Balances with bank 26278 6794 -23268 -81742
Advances 1034445 1382019 1658422 1990107
Investments 500476 733455 916818 1191864
Fixed Assets 28241 29970 29767 31255
Other assets 48668 44449 46672 51339
Total Assets 1724007 2335704 2751120 3338247
IDBI Bank Ltd.
SKP Securities Ltd www.skpmoneywise.com Page 11 of 12
Ratios 2009 2010 2011 E 2012 E
Spread analysis (%)
Yield on advances 9.76% 8.92% 8.89% 9.05%
Yield on investments 5.30% 6.85% 7.56% 7.80%
Yield on interest-earning assets 8.53% 8.31% 8.55% 8.73%
Cost of deposits 7.14% 6.56% 6.68% 6.88%
Cost of funds 7.53% 6.99% 7.10% 7.27%
Spread 0.99% 1.32% 1.45% 1.46%
Profitability ratios (%)
RoAA 0.57% 0.51% 0.53% 0.60%
ROE 10.19% 11.72% 11.75% 12.19%
NIM 0.92% 1.23% 1.49% 1.69%
Cost to Income 49.26% 40.18% 41.51% 39.95%
Asset Quality (%)
Gross NPAs% 1.39% 1.54% 1.58% 1.50%
Net NPAs% 0.92% 1.02% 1.05% 0.96%
Provision Coverage Ratio 33.90% 33.96% 33.83% 36.46%
Net NPA as % to Networth 10.99% 15.71% 12.22% 12.15%
Delinquency Rate 0.62% 1.07% 1.15% 1.19%
Valuation ratios (x)
EPS 11.84 14.23 13.94 18.65
BV per share 119.15 123.54 145.47 160.61
Adj. BV 106.06 104.13 127.69 141.09
P/E 10.47 8.72 8.90 6.65
P/Adj.BV 1.17 1.19 0.97 0.88
Business Ratio
Credit Deposit ratio 92.03% 82.43% 82.43% 79.13%
Investment Deposit ratio 44.53% 43.74% 45.57% 47.39%
SLR to Investment ratio 81.37% 82.91% 82.33% 82.33%
CASA ratio 14.78% 14.59% 16.00% 17.00%
Total Business Growth rate 39.1% 41.7% 20.0% 22.7%
Cash Flow Statement (Rs. Mn.) 2009 2010 2011 E 2012 E
PBT 9856 10447 18361 24566
Net Cash from Operating Activities 27697 38794 -47576 52051
Net Cash used in Investing Activities -1401 -3071 0 0
Net cash generated from Financing Activities -1671 -2088 1169 -77810
Net Increase in cash & cash equivalents 24625 33635 -46407 -25759
Cash & Cash Equivalents as at year start. 87588 112213 145848 99441
Cash & Cash Equivalents as at year end. 112213 145848 99441 73683
IDBI Bank Ltd.
SKP Securities Ltd www.skpmoneywise.com Page 12 of 12
The above analysis and data are based on last available prices and not official closing rates. SKP Research is also available on Bloomberg, Thomson First Call & Investext Myiris, Moneycontrol, Tickerplant
and ISI Securities
.
DISCLAIMER: This document has been issued by SKP Securities Ltd (SKP), a stock broker registered with and regulated by Securities & Exchange Board of India, for the information of its clients/potential clients and business associates/affiliates
only and is for private circulation only, disseminated and available electronically and in printed form. Additional information on recommended securities may be made available on request. This document is supplied to you solely for your information and no matter contained herein may be reproduced, reprinted, sold, copied in whole or in part, redistributed or passed on, directly or indirectly, to any other person for any purpose, in India or into any other country without prior written
consent of SKP. The distribution of this document in other jurisdictions may be strictly restricted and/ or prohibited by law, and persons into whose possession this document comes should inform themselves about such restriction and/ or prohibition,
and observe any such restrictions and/ or prohibition. If you are dissatisfied with the contents of this complimentary document or with the terms of this Disclaimer, your sole and exclusive remedy is to stop using the document and SKP shall not be
responsible and/ or liable in any manner. Neither this document nor the information or any opinion expressed therein should be construed as an investment advice or offer to anybody to acquire, subscribe, purchase, sell, dispose of, retain any
securities or derivatives related to such securities or an offer to sell or the solicitation of an offer to purchase or subscribe for any investment or as an official endorsement of any investment. Any recommendation or view or opinion expressed on
investments in this document is not intended to constitute investment advice and should not be intended or treated as a substitute for necessary review or validation or any professional advice. The views expressed in this document are those of the
analyst which are subject to change and do not represent to be an authority on the subject. SKP may or may not subscribe to any and/ or all the views expressed herein. It is the endeavor of SKP to ensure that the analyst(s) use current, reliable,
comprehensive information and obtain such information from sources, which the analyst(s) believes to be reliable. However, such information may not have been independently verified by SKP or the analyst(s). The information, opinions and views
contained within this document are based upon publicly available information, considered reliable at the time of publication, which are subject to change from time to time without any prior notice. The Document may be updated anytime without
any prior notice to anybody. SKP makes no guarantee, representation or warranty, express or implied; and accepts no responsibility or liability as to the accuracy or completeness or correctness of the information in this Report. SKP, its Directors,
affiliates and employees do not accept any liability whatsoever, direct or indirect, that may arise from the use of the information or recommendations herein. Please note that past performance is not necessarily a guide to evaluate future performance. SKP or its affiliates, may, from time to time render advisory and other services to companies being referred to in this document and receive compensation for the same. SKP and/or its affiliates, directors and employees may trade for their own
account or may also perform or seek to perform investment banking or underwriting services for or relating to those companies and may also be represented in the supervisory board or on any other committee of those companies or may sell or buy
any securities or make any investment, which may be contrary to or inconsistent with this document. This document should be read and relied upon at the sole discretion and risk of the reader. The value of any investment made at your discretion
based on this document or income there from may be affected by changes in economic, financial and/ or political factors and may go down as well as up and you may not get back the full or the expected amount invested. Some securities and/ or
investments involve substantial risk and are not suitable for all investors. Neither SKP nor its affiliates or their directors, employees, agents or representatives/associates, shall be responsible or liable in any manner, directly or indirectly, for
information, views or opinions expressed in this document or the contents or any errors or discrepancies herein or for any decisions or actions taken in reliance on the document or inability to use or access our service or this document or for any loss
or damages whether direct or indirect, incidental, special or consequential including without limitation loss of revenue or profits or any loss or damage that may arise from or in connection with the use of or reliance on this document or inability to
use or access our service or this document.
SKP Securities Ltd Contacts Research Sales
Mumbai Kolkata Mumbai Kolkata
Phone 022 2281 9012 033 4007 7000 022 2281 1015 033 4007 7400
Fax 022 2283 0932 033 4007 7007 022 2283 0932 033 4007 7007
E-mail [email protected] [email protected] [email protected]
Member: NSE BSE NSDL CDSL NCDEX* MCX* MCX-SX FPSB *Group
Entities INB/INF: 230707532, BSE INB: 010707538, CDSL IN-DP-CDSL-132-2000, DPID: 021800, NSDL IN-DP-NSDL: 222-2001, DP ID: IN302646, ARN: 0006, NCDEX: 00715, MCX: 31705, MCX-SX: INE
260707532