Embed Size (px)
Citation preview

PNNL-28380
Prepared for the U.S. Department of Energy under Contract DE-AC05-76RL01830
Idaho Residential Energy Code Field Study
February 2019
R Bartlett
M Halverson
Y Xie


PNNL-28380
Idaho Residential Energy Code Field Study
R Bartlett
M Halverson
Y Xie
February 2019
Prepared for
the U.S. Department of Energy
under Contract DE-AC05-76RL01830
Pacific Northwest National Laboratory
Richland, Washington 99352


iii
Executive Summary
A research project in the state of Idaho identified opportunities to reduce homeowner energy costs in
residential single-family new construction by increasing compliance with the current state energy code.
The study was initiated in January 2018; data collection began in March 2018 and continued through June
2018. During this period, research teams visited 127 homes during various stages of construction,
resulting in a collection of data based on observations made directly in the field. Analysis of the data has
led to a better understanding of the energy features present in homes and indicates nearly $500,000 in
potential annual savings to Idaho homeowners that could result from increased compliance with the Idaho
Energy Conservation Code.
Methodology
The project team was led by David Freelove, Idaho Energy Code Circuit Rider, with support from
Cadmus, the Idaho Association of Building Officials, and the Northwest Energy Efficiency Alliance. The
team applied a methodology that was previously developed and tested by the U.S. Department of Energy
(DOE). The methodology identified the energy code-required building components that have the largest
direct impact on energy consumption. These key items are a focal point of the study, and provide the data
used in the analysis and savings estimates. The project team implemented an Idaho-specific sampling
plan representative of new construction within the state. This sampling plan was developed by Pacific
Northwest National Laboratory (PNNL).
Following data collection, PNNL conducted three stages of analysis on the resulting data set (Figure
ES.1). The first stage identified compliance trends within the state based on the field observations for
each key item. The second stage modeled energy consumption of the homes observed in the field relative
to what would be expected if sampled homes just met minimum code requirements. The third stage then
calculated the potential energy savings and consumer cost savings associated with increased code
compliance. Together, these findings provide valuable insight on challenges facing energy code
implementation and enforcement, and are intended to inform future energy code education, training and
outreach activities.
Figure ES.1. Stages of Analysis Applied in the Study
Results
The key items with the greatest potential for savings in Idaho are presented in Table ES.1. The estimates
presented in the table represent the savings associated with each measure and are extrapolated based on
projected new construction. These items may be considered during consideration of compliance-
improvement programs within the state, including energy code education, training and outreach
initiatives.

iv
Table ES.1. Estimated Annual Statewide Savings Potential in Idaho
Measure
Total Energy Savings
(MMBtu) Total Energy Cost
Savings ($)
Duct Leakage 27,966 307,201
Exterior Wall Insulation 17,088 167,182
Foundation Insulation 1,383 5,436
TOTAL 46,436 MMBtu $479,819
Figure ES.2. Modeled distribution of regulated EUI (kBtu/ft2/year) in Idaho
In terms of overall energy consumption, the analysis shows that homes within the state use less energy
than would be expected relative to homes built to the current minimum state code requirements (Figure
ES.2). Analysis of the collected field data indicates average regulated energy use intensity (EUI) of 34.62
kBtu/ft2-yr statewide compared to 40.51 kBtu/ft2-yr for homes exactly meeting minimum prescriptive
energy code requirements. This suggests that on average the typical home in the state is about 15% better
than code.
Note that in an EUI analysis, items found to be better than code offset savings from items found to be
worse than code. These below-code items represent a savings opportunity regardless of the above-code
items. In this study, a significant portion of homes were found to not meet code in several key areas
impacting energy use, durability, and comfort. Thus, there is still a significant energy savings opportunity
(estimated at $500,000 annually) from energy code compliance enhancement activities in Idaho.

v
Acknowledgments
The following members comprised the Idaho project team:
David Freelove, Idaho Energy Code Circuit Rider
Jerica Stacey and Jolyn Green, Cadmus
The Idaho project team wishes to acknowledge the Northwest Energy Efficiency Alliance (NEEA) for
generously providing the funding for this project, as well as the Idaho Association of Building Officials
for its support.
The authors would also like to thank the following reviewers who provided insightful reviews of the
report:
Bing Liu, Steve Phoutrides, Dulane Moran and Christina Steinhoff, NEEA
Sharon Grant and Ken Baker, Idaho Energy Code Collaborative group
John Chatburn and Katie Pegan, Idaho Office of Energy and Mineral Resources
Northwest Energy Efficiency Alliance
NEEA is a non-profit organization working to effect market transformation through the acceleration and
adoption of energy-efficient products, services and practices. NEEA is an alliance of more than 140
Northwest utilities and energy efficiency organizations working on behalf of more than 13 million energy
consumers. For more information, visit neea.org.
Idaho Association of Building Officials
The Idaho Association of Building Officials (IDABO) was first recognized as a State organization in
1958. IDABO’s mission is to promote public health and welfare by facilitating safe and accessible
buildings and by educating citizens and elected officials on Idaho codes and standards. See more
information on IDABO at http://www.idabo.org/.
Cadmus
The Cadmus Group LLC was founded in 1983 in Watertown, MA. They provide services in the areas of
energy, climate, water, public health, international development, transportation, and safety, security, and
resiliency. See more information on Cadmus at https://www.cadmusgroup.com/.


vii
Acronyms and Abbreviations
AC air conditioning
ACCA Air Conditioning Contractors of America
ACH air changes per hour
AFUE annual fuel utilization efficiency
AIA American Institute of Architects
Btu British thermal unit
cfm cubic feet per minute
CZ climate zone
DOE U.S. Department of Energy
EDC electric distribution company
EERE Office of Energy Efficiency and Renewable Energy
EUI energy use intensity
FOA funding opportunity announcement
HERS home energy rating system
HSPF heating season performance factor
ICC International Code Council
ID Idaho
IDABO Idaho Association of Building Officials
IECC International Energy Conservation Code
kBtu thousand British thermal units
MMBtu million British thermal units
NA not applicable
NEEA Northwest Energy Efficiency Alliance
PNNL Pacific Northwest National Laboratory
RESNET Residential Energy Services Network
RFI request for information
SHGC solar heat gain coefficient


ix
Contents
Executive Summary ..................................................................................................................................... iii
Acknowledgments ......................................................................................................................................... v
Acronyms and Abbreviations ..................................................................................................................... vii
1.0 Introduction ....................................................................................................................................... 1.1
1.1 Background ............................................................................................................................... 1.1
1.2 Project Team ............................................................................................................................. 1.1
1.3 Stakeholder Interests ................................................................................................................. 1.2
2.0 Methodology ...................................................................................................................................... 2.1
2.1 Overview ................................................................................................................................... 2.1
2.2 State Study ................................................................................................................................ 2.2
2.2.1 Sampling ........................................................................................................................ 2.2
2.2.2 Data Collection ............................................................................................................... 2.2
2.3 Data Analysis ............................................................................................................................ 2.3
2.3.1 Statistical Analysis ......................................................................................................... 2.3
2.3.2 Energy Analysis ............................................................................................................. 2.4
2.3.3 Savings Analysis ............................................................................................................ 2.5
2.4 Limitations ................................................................................................................................ 2.6
2.4.1 Applicability of Results .................................................................................................. 2.6
2.4.2 Determination of Compliance ........................................................................................ 2.6
2.4.3 Sampling Substitutions ................................................................................................... 2.6
2.4.4 Site Access ..................................................................................................................... 2.6
2.4.5 Analysis Methods ........................................................................................................... 2.7
2.4.6 Presence of Tradeoffs ..................................................................................................... 2.7
3.0 State Results ...................................................................................................................................... 3.1
3.1 Field Observations..................................................................................................................... 3.1
3.1.1 Key Items ....................................................................................................................... 3.1
3.1.2 Additional Data Items .................................................................................................. 3.18
3.2 Energy Intensity ...................................................................................................................... 3.20
3.3 Savings Potential ..................................................................................................................... 3.21
4.0 Conclusions ....................................................................................................................................... 4.1
5.0 References ......................................................................................................................................... 5.1
Appendix A – State Sampling Plan ........................................................................................................... A.1
Appendix B – Additional Data...................................................................................................................B.1

x
Figures
Figure 2.1. Sample Graph .......................................................................................................................... 2.4
Figure 3.1. Envelope Tightness (ACH50) ................................................................................................. 3.2
Figure 3.2. Window SHGC ........................................................................................................................ 3.3
Figure 3.3. Window U-Factor .................................................................................................................... 3.4
Figure 3.4. Wall R-Values ......................................................................................................................... 3.5
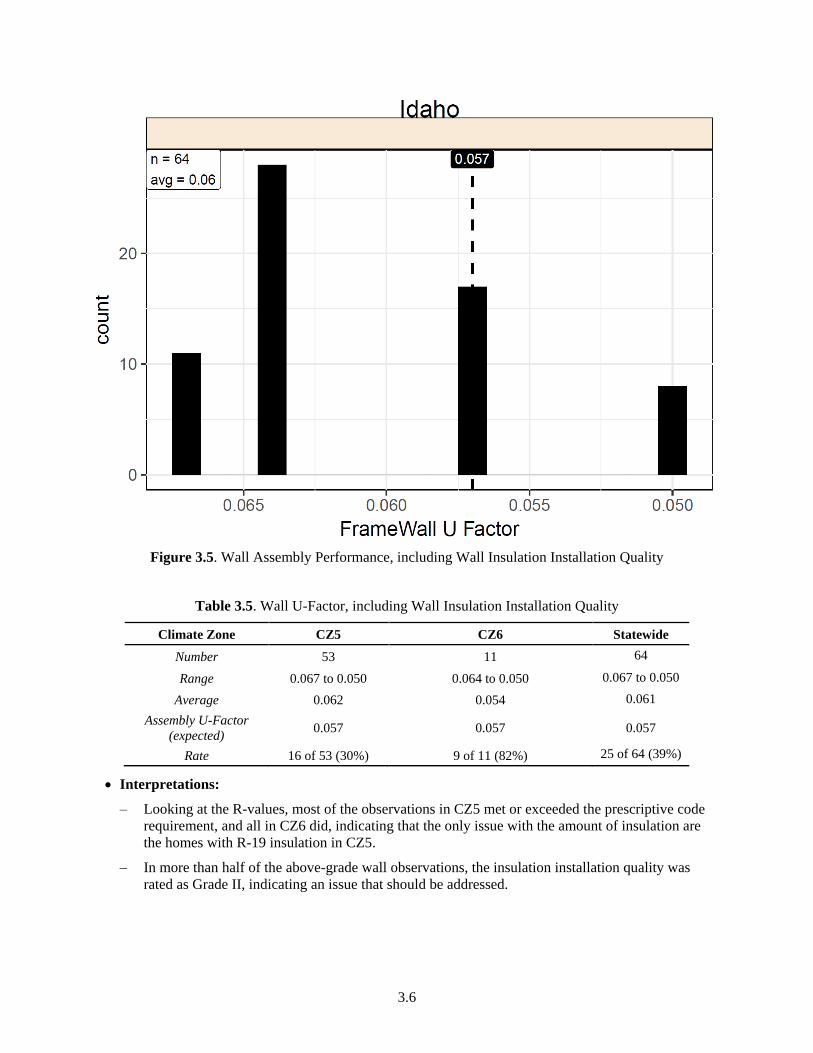
Figure 3.5. Wall Assembly Performance, including Wall Insulation Installation Quality ........................ 3.6
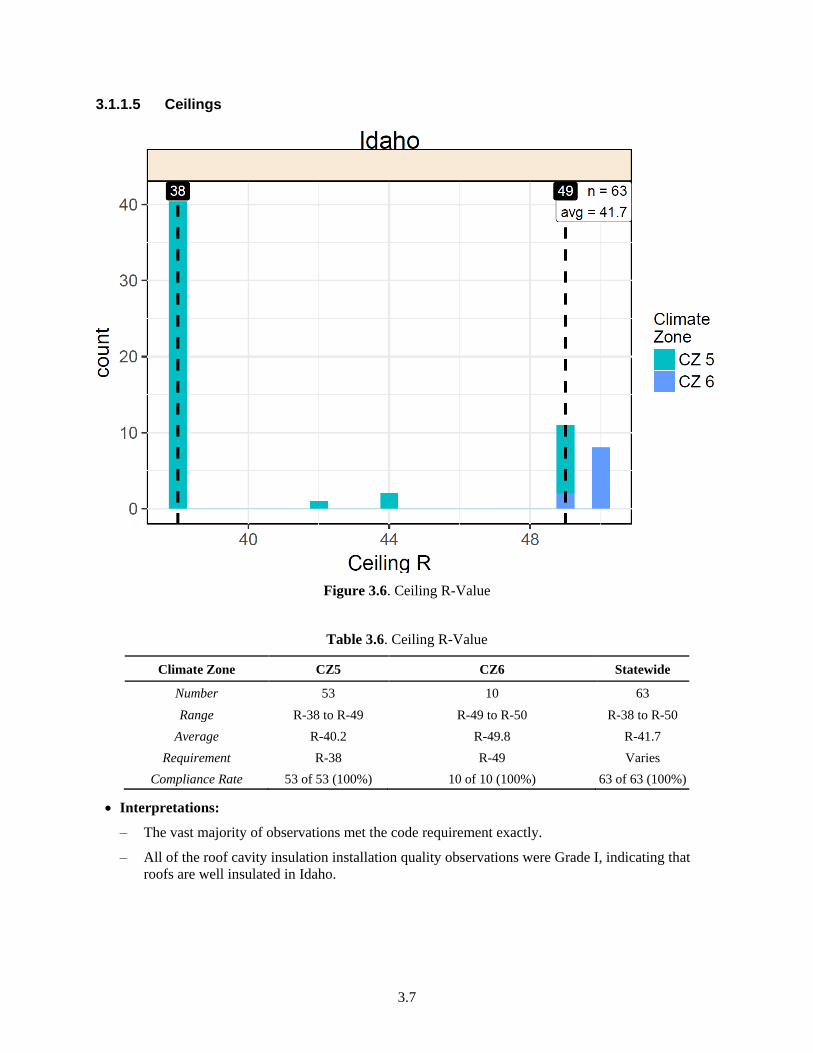
Figure 3.6. Ceiling R-Value ....................................................................................................................... 3.7
Figure 3.7. High-efficacy Lighting Percentage .......................................................................................... 3.8
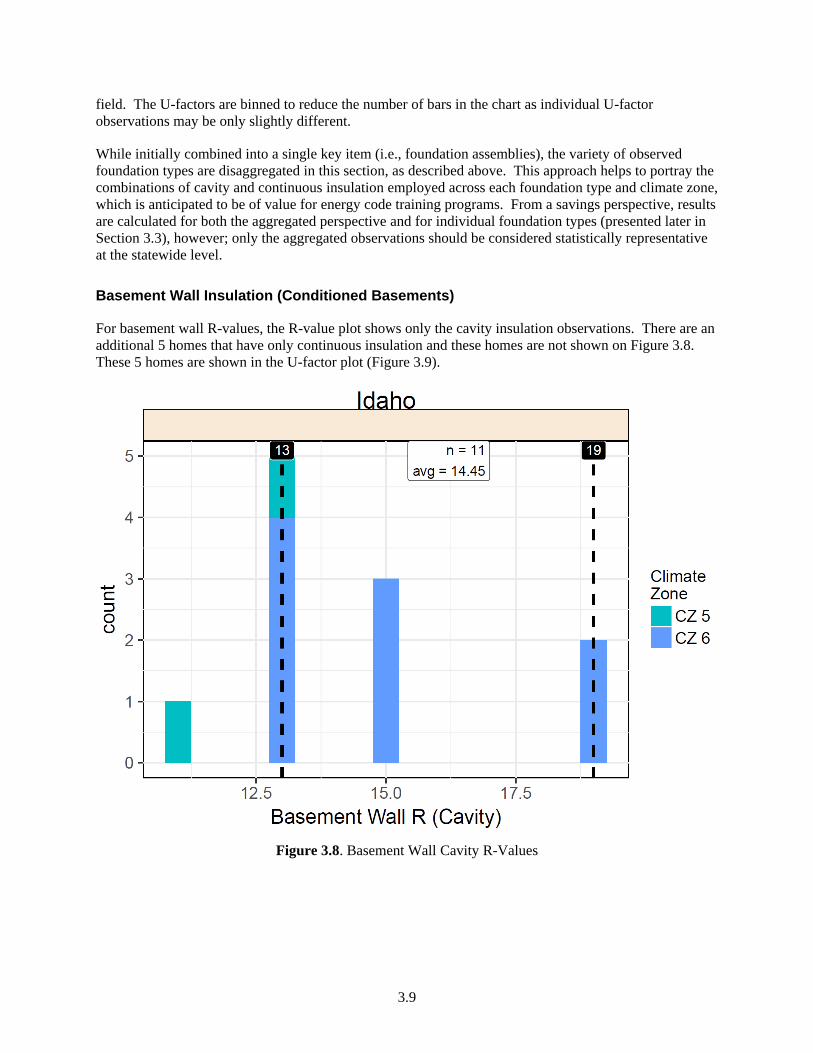
Figure 3.8. Basement Wall Cavity R-Values ............................................................................................. 3.9
Figure 3.9. Basement Wall Assembly Performance, including Wall Insulation Installation Quality ...... 3.10
Figure 3.10. Floor R-Values .................................................................................................................... 3.11
Figure 3.11. Floor Assembly Performance, including Insulation Installation Quality ............................ 3.12
Figure 3.12.Unvented Crawlspace Wall Continuous Insulation R-Value ............................................... 3.14
Figure 3.13. Unvented Crawlspace Wall Assembly Performance, including Insulation Installation
Quality ............................................................................................................................................. 3.15
Figure 3.14. Raw Duct Tightness (CFM25/100ft2 CFA) ........................................................................ 3.16
Figure 3.15. Adjusted Duct Tightness (CFM25/100ft2 CFA) ................................................................. 3.17
Figure 3.16. Statewide EUI Analysis for Idaho ....................................................................................... 3.21

xi
Tables
Table 3.1. Envelope Tightness (ACH50) ................................................................................................... 3.2
Table 3.2. Window SHGC ......................................................................................................................... 3.3
Table 3.3. Window U-Factor ..................................................................................................................... 3.4
Table 3.4. Wall R-Value ............................................................................................................................ 3.5
Table 3.5. Wall U-Factor, including Wall Insulation Installation Quality ................................................. 3.6
Table 3.6. Ceiling R-Value ........................................................................................................................ 3.7
Table 3.7. High-efficacy Lighting Percentage ........................................................................................... 3.8
Table 3.8. Basement Wall Cavity R-Values ............................................................................................ 3.10
Table 3.9. Basement Walls U-Factor ....................................................................................................... 3.11
Table 3.10. Floor R-Value ....................................................................................................................... 3.12
Table 3.11. Floor U-Factor ...................................................................................................................... 3.13
Table 3.12. Unvented Crawlspace Wall Continuous R-Value ................................................................. 3.14
Table 3.13. Unvented Crawlspace Wall U-Factor ................................................................................... 3.15
Table 3.14. Raw Duct Tightness (CFM25/100ft2 CFA) .......................................................................... 3.16
Table 3.15. Adjusted Duct Tightness (CFM25/100ft2 CFA) .................................................................. 3.17
Table 3.16. Insulation Installation Quality ............................................................................................... 3.18
Table 3.17. Statewide Annual Measure-Level Savings for Idaho ........................................................... 3.22
Table 3.18. Statewide Annual Measure-Level Savings by Foundation Type for Idaho .......................... 3.22
Table 3.19. Five-years, Ten-years, and Thirty-years Cumulative Annual Statewide Savings for Idaho . 3.23
Table 4.1. Annual Statewide Savings Potential in Idaho ........................................................................... 4.1

1.1
1.0 Introduction
A research project in the state of Idaho investigated the energy code-related aspects of unoccupied, newly
constructed, single family homes across the state. The study followed a DOE-developed and tested
methodology, which allowed the project team to build an empirical collection of data based on
observations made directly in the field. The data was then analyzed to identify compliance trends, their
impact on statewide energy consumption, and calculate savings that could be achieved through increased
code compliance.
The Idaho field study was initiated in January 2018; data collection began in March 2018 and continued
through June 2018. During this period, research teams visited 127 homes across the state during various
stages of construction. At the time of the study, the state had the Idaho Energy Conservation Code
effective from January 1, 2015. The study methodology, data analysis and resulting findings are
presented throughout this report.
1.1 Background
This project was built upon the U.S. Department of Energy (DOE)’s field study, “Strategies to Increase
Residential Energy Code Compliance Rates and Measure Results”.1 The purpose of this study is to gather
field data on energy code measures, as installed and observed in actual homes and through the subsequent
analysis to identify trends and issues, which eventually can inform energy code training and other
compliance- improvement programs.
Energy codes for residential buildings have advanced significantly in recent years, with today’s model
codes approximately 30% more efficient than codes adopted by the majority of U.S. states. 2,3 Hence, the
importance of ensuring code-intended energy savings, so that consumers reap the benefits of improved
codes—something which will happen only through high levels of compliance. More information on
overall DOE interest in compliance is available on the DOE Building Energy Codes Program website.4
1.2 Project Team
David Freelove, the Idaho Energy Code Circuit Rider, led the Idaho project team and collected the field
data; Cadmus and the Idaho Association of Building Officials (IDABO) provided support to Mr. Freelove
throughout the project. The Pacific Northwest National Laboratory (PNNL) defined the methodology,
conducted data analysis, and provided technical assistance to the project team. Funding for the project
was provided by the Northwest Energy Efficiency Alliance (NEEA), with technical analysis provided by
PNNL funded by DOE. More information on the organizations comprising the project team is included in
the Acknowledgements section of this report.
1 Available at https://www.energycodes.gov/compliance/residential-energy-code-field-study 2 National Energy and Cost Savings for New Single- and Multifamily Homes: A Comparison of the 2006, 2009, and
2012 Editions of the IECC, available at http://www.energycodes.gov/development 3 Available at http://www.energycodes.gov/adoption/states 4 Available at https://www.energycodes.gov/compliance

1.2
1.3 Stakeholder Interests
The project started with the formation of a stakeholder group comprised of interested and affected parties
within the state. Following an initial kickoff meeting, the project team maintained active communication
with the stakeholders throughout the course of the project. Stakeholders were sought from the following
groups:
Building officials
Homebuilders
Energy efficiency advocates
Utilities
Other important entities identified by the project team
Members of these and other groups are critical to the success of the project, as their buy-in to the results is
necessary for future activities. Such stakeholders hold important information (e.g., building officials have
the lists of homes under construction and are therefore key to the sampling process), control access to
homes needed for site visits, and are targets for training. The Idaho team most frequently communicated
with building officials and homebuilders, including the members of local IDABO chapters; local building
associations; and state and local building officials. Utilities were also identified as a crucial stakeholder
and were updated regularly on the progress of the study.

2.1
2.0 Methodology
2.1 Overview
The Idaho field study was based on a methodology developed by DOE to identify savings opportunities
associated with increased energy code compliance. This methodology involves gathering field data on
energy code measures, as installed and observed in actual homes. In the subsequent analysis, trends and
issues are identified, which can inform energy code training and other compliance- improvement
programs.
Highlights of the methodology:
Focuses on individual code requirements within new single-family homes
Based on a single site visit to reduce burden and minimize bias
Prioritizes key items with the greatest impact on energy consumption
Designed to produce statistically significant results
Data confidentiality built into the experiment—no occupied homes were visited, and no personal
data shared
Results based on an energy metric and reported at the state level
PNNL identified the code-requirements (and associated energy efficiency measures) with the greatest
direct impact on residential energy consumption. 1 These key items drive sampling, data analysis, and
eventual savings projections:
1. Envelope tightness (ACH at 50 Pascals)
2. Windows (U-factor & SHGC)
3. Wall insulation (assembly U-factor)
4. Ceiling insulation (R-value)
5. Lighting (% high-efficacy)
6. Foundation insulation (R-value)2
7. Duct tightness (expressed in cfm per 100 ft2 of conditioned floor area at 25 Pascals)
PNNL evaluated the variability associated with each key item and concluded that a minimum of 63
observations would be needed for each one to produce statistically significant results at the state level.
Both the key items themselves and the required number of observations were prescribed in the DOE
methodology.
The following sections describe how the methodology was implemented as part of the Idaho study,
including sampling, data collection, and resulting data analysis. More information on the full DOE
1 Based on the mandatory and prescriptive requirements of the International Energy Conservation Code (IECC). 2 Floor insulation, basement wall insulation, crawlspace wall insulation, and slab insulation were combined into a
single category of foundation insulation.

2.2
protocol and PNNL analysis is published separately from this report (DOE 2018) and is available on the
DOE Building Energy Codes Program website.3
2.2 State Study
The prescribed methodology was customized for Idaho to reflect circumstances unique to the state, such
as state-level code requirements and regional construction practices. Customization also ensured that the
results of the study would have credibility with stakeholders.
2.2.1 Sampling
PNNL developed a statewide sampling plan statistically representative of recent construction activity
within the state. The samples were apportioned to jurisdictions across the state in proportion to their
average level of construction compared to the overall construction activity statewide. This approach is a
proportional random sample, which PNNL based on the average of the three most recent years of Census
Bureau permit data.4 The plan specified the number of key item observations required in each selected
jurisdiction (totaling 63 of each key item across the entire project coverage area).
2.2.2 Data Collection
Following confirmation of the sample plan, the project team began contacting local building departments
to identify homes currently in the permitting process. Code officials responded by providing lists of
homes at various stages of construction within their jurisdiction. These lists were then sorted using a
random number generator and utilized by the team’s field personnel to contact builders to gain site access.
As prescribed by the methodology, each home was visited only once to avoid any bias associated with
multiple site visits. Only installed items directly observed by the field teams during site visits were
recorded. If access was denied for a particular home on the list, field personnel moved onto the next
home on the list.
2.2.2.1 Data Collection Form
The field teams relied on a data collection form customized to the mandatory and prescriptive
requirements of the state energy code, the Idaho Energy Conservation Code.5 The final data collection
form is available in spreadsheet format on the DOE Building Energy Codes Program website.6 The form
included all energy code requirements (i.e., not just the eight key items), as well as additional items
required under the prescribed methodology. For example, the field teams were required to conduct a
blower door test and duct leakage test on every home where such tests could be conducted, using
RESNET7 protocols.
The information beyond the key items was used during various phases of the analysis, or to supplement
the overall study findings. For example, insulation installation quality impacts the energy-efficiency of
insulation was used to modify that key item during the energy modeling and savings calculation.
3 Available at https://www.energycodes.gov/compliance/residential-energy-code-field-study. 4 Available at http://censtats.census.gov/ (select the “Building Permits” data). 5 Available at https://dbs.idaho.gov/rules/2018/2018_Building_Statutes_Rules_pkt.pdf. 6 Available at https://www.energycodes.gov/compliance/residential-energy-code-field-study and based on the forms
typically used by the REScheck compliance software. 7 See http://www.resnet.us/standards/RESNET_Mortgage_Industry_National_HERS_Standards.pdf

2.3
Equipment, including fuel type and efficiency rating, and basic home characteristics (e.g., foundation
type) helped validate the prototype models applied during energy simulation. Other questions, such as
whether the home participated in an above-code program, can assist in understanding whether other
influencing factors are at play beyond the code requirements.
The data collected were the energy values observed, rather than the compliance status. For insulation, for
example, the R-value was collected, for windows the U-factor. The alternative, such as was used in
DOE’s older work, simply stated whether an item did or did not comply. The current approach provides
an improved understanding of how compliance equates to energy consumption and gives more flexibility
during analysis since the field data can be compared to any energy code.
2.2.2.2 Data Management and Availability
Once the data collection effort was complete, the project team conducted a thorough quality assurance
review. This included an independent check of raw data compared to the information provided to PNNL
for analysis, and helped to ensure completeness, accuracy and consistency across the inputs. Prior to
submitting the data to PNNL, the team also removed all personally identifiable information, such as
project site locations and contact information. The final dataset is available in spreadsheet format on the
DOE Building Energy Codes Program website8.
2.3 Data Analysis
All data analysis in the study was performed by PNNL, and was applied through three basic stages:
1. Statistical Analysis: Examination of the data set and distribution of observations for individual
measures
2. Energy Analysis: Modeling of energy consumption for a simulated population of homes
3. Savings Analysis: Projection of savings associated with improved compliance
The first stage identified compliance trends within the state based on what was observed in the field for
each key item. The second stage modeled energy consumption (of the homes observed in the field)
relative to what would be expected if sampled homes just met minimum code requirements. The third
stage then calculated the potential energy savings and consumer cost savings associated with increased
code compliance. Together, these findings provide valuable insight on challenges facing energy code
implementation and enforcement, and are intended to inform future energy code education, training and
outreach activities.
The following sections provide an overview of the analysis methods applied to the field study data, with
the resulting state-level findings presented in Section 3.0, State Results.
2.3.1 Statistical Analysis
Standard statistical analysis was performed with distributions of each key item plotted by climate zone.
This approach enables a better understanding of the range of data and provides insight on what energy-
efficiency measures are most commonly installed in the field. It also allows for a comparison of installed
values to the applicable code requirement, and for identification of any problem areas where potential for
8 Available at https://www.energycodes.gov/compliance/residential-energy-code-field-study.

2.4
improvement exists. The graph below represents a sample key item distribution and is further explained
in the following paragraph.
Figure 2.1. Sample Graph
Each graph is set up in a similar fashion, identifying the state, climate zone, and specific item being
analyzed. The total sample size (n) is displayed in the top left or right corner of the graph, along with the
distribution average. The metric associated with the item is measured along the horizontal axis (e.g.,
window U-factor is measured in Btu/ft2-hr-F), and a count of the number of observations is measured
along the vertical axis. A vertical line is imposed on the graph representing the applicable code
requirement (e.g., the prescriptive requirement in climate zone 4 is 0.35)—values to the right-hand side of
this line are better than code. Values to the left-hand side represent areas for improvement.
For walls and foundations, two graphs are included – one for R-value observations and another for U-
factor observations. The R-value graphs show whether or not homes are being constructed with the
required amount of insulation for the climate zone. The U-factor graphs indicate whether or not the
combination of installed R-value and insulation installation quality meets the U-factor requirements in the
climate zone. The combination of these two graphs can be used to determine if there is an issue with the
amount of insulation, insulation installation quality, or both.
2.3.2 Energy Analysis
The next phase of the analysis leveraged the statistical analysis results to model average statewide energy
consumption. A consequence of the field study methodology allowing only one site visit per home to
Number of
observations Prescriptive
Requirement
Y-axis shows
count of field
observations at
a particular
value of x-axis
Distribution of Field Observations
X-axis shows the
observed values of
the metric
Observation Metric

2.5
minimize bias is that a full set of data cannot be gathered on any single home, as not all energy-efficiency
measures are in place or visible at any given point during the home construction process. This lack of
complete data for individual homes creates an analytical challenge, because energy modeling and
simulation protocols require a complete set of inputs to generate reliable results. To address this
challenge, a series of “pseudo homes” were created, comprised of over 1,500 models encompassing most
of the possible combinations of key item values found in the observed field data. In aggregate, the
models provide a statistical representation of the state’s population of newly constructed homes. This
approach is known in statistics as a Monte Carlo analysis.
Energy simulation was then conducted using the EnergyPlus™ software.9 Each of the 1,500 models was
run multiple times, to represent each combination of heating systems and foundation types commonly
found in the state. This resulted in upwards of 30,000 simulation runs for each climate zone within the
state. An EUI was calculated for each simulation run and these results were then weighted by the
frequency with which the heating system/foundation type combinations were observed in the field data.
Average EUI was calculated based on regulated end uses (heating, cooling, lighting and domestic hot
water) for two sets of homes—one as-built set based on the data collected in the field, and a second code-
minimum set (i.e., exactly meeting minimum code requirements). Comparing these values shows whether
the population of newly constructed homes in the state is using more or less energy than would be
expected based on minimum code requirements.
Further specifics of the energy analysis are available in the methodology report (DOE 2018).
2.3.3 Savings Analysis
To begin the third phase, each of the key items was examined individually to determine which had a
significant number of observed values that did not meet the associated code requirement10. For these
items, additional models were created to assess the savings potential, comparing what was observed in the
field to a scenario of full compliance (i.e., where all worse-than-code observations for a particular item
exactly met the corresponding code requirement)11. This was done by individually upgrading each worse-
than-code observation to the corresponding prescriptive code requirement, resulting in a second set of
models (full compliance) that could be compared to the first (as-built). All other components were
maintained at the corresponding prescriptive code value, allowing for the savings potential associated
with a key item to be evaluated in isolation.
All variations of observed heating systems and foundation types were included, and annual electric, gas
and total EUIs were extracted for each building. To calculate savings, the differences in energy use
calculated for each case were weighted by the corresponding frequency of each observation to arrive at an
average energy savings potential for each climate zone. Potential energy savings for each climate zone
were further weighted using construction starts in that zone to obtain the average statewide energy
savings potential. State-specific construction volumes and fuel prices were used to calculate the
maximum energy savings potential for the state in terms of energy (MMBtu) and energy cost ($).
Note that this approach results in the maximum theoretical savings potential for each measure as it does
not take “interaction effects” into account such as the increased amount of heating needed in the winter
9 See https://energyplus.net/ 10 “Significant” was defined as 15% or more of the observed values not meeting the associated code requirement.
Only the items above this threshold were analyzed. 11 Better-than-code items were not included in this analysis because the intent was to identify the maximum savings
potential for each measure. The preceding energy analysis included both better-than-code and worse-than-code
results, allowing them to offset each other.

2.6
when energy efficient lights are installed. A building’s energy consumption is a dynamic and interactive
process that includes all the building components present within a given home. In a typical real building,
the savings potential might be higher or lower; however, additional investigation indicated that the
relative impact of such interactions is very small, and could safely be ignored without changing the basic
conclusions of the analysis.
2.4 Limitations
The following sections address limitations of the project, some of which are inherent to the methodology,
itself, and other issues as identified in the field.
2.4.1 Applicability of Results
An inherent limitation of the study design is that the results (key item distributions, EUI, and measure-
level savings) can be considered statistically significant only at the state level. Other results, such as
analysis based on climate zone level, or reporting of non-key items (such as gas furnace efficiency), are
included but should not be considered statistically representative.
2.4.2 Determination of Compliance
The field study protocol is based upon a single site visit, which makes it impossible to know whether a
particular home complies with the energy code as not enough information can be gathered in a single visit
to know whether all code requirements have been met. For example, homes observed during the earlier
stages of construction often lack key features (e.g., walls with insulation), and in the later stages many of
these items may be covered and therefore unobservable. To gather all the data required in the sampling
plan, field teams therefore needed to visit homes in various stages of construction. The analytical
implications of this are described above in Section 2.3.2
2.4.3 Sampling Substitutions
As is often the case with field-based research, substitutions to the state sampling plan were sometimes
needed to fulfill the complete data set. If the required number of observations in a jurisdiction could not
be met because of a lack of access to homes or an insufficient number of homes (as can be the case in
rural areas), substitute jurisdictions were selected by the project team. In all cases, the alternative
selection was comparable to the original in terms of characteristics such as the level of construction
activity and general demographics. More information on the sampling plan and any state-specific
substitutions are discussed in Appendix B.
2.4.4 Site Access
Site access was purely voluntary and data was collected only in homes where access was granted, which
can be characterized as a self-selection bias. While every effort was made to limit this bias (i.e., sampling
randomization, outreach to builders, reducing the burden of site visits, etc.), it is inherent due to the
voluntary nature of the study. The impacts of this bias on the overall results are not known.

2.7
2.4.5 Analysis Methods
All energy analysis was conducted using prototype models; no individually visited homes were modeled,
as the self-imposed, one-visit-per-home limitation meant that not all necessary modeling inputs could be
collected from a single home. Thus, the impact of certain field-observable factors such as size, height,
orientation, window area, floor-to-ceiling height, equipment sizing, and equipment efficiency were not
included in the analysis. In addition, duct leakage was modeled separately from the other key items due
to limitations in the EnergyPlusTM software used for analysis. It should also be noted that the resulting
energy consumption and savings projections are based on modeled data, and not on utility bills or actual
home energy usage.
2.4.6 Presence of Tradeoffs
Field teams were able to gather only a minimal amount of data regarding which code compliance paths
were being pursued for homes included in the study; all analyses therefore assumed that the prescriptive
path was used. The project team agreed that this was a reasonable approach. The overall data set was
reviewed in an attempt to determine if common tradeoffs were present, but the ability to do this was
severely limited by the single site-visit principle which did not yield complete data sets for a given home.
To the extent it could be determined, it did not appear that there was a systematic presence of tradeoffs.


3.1
3.0 State Results
3.1 Field Observations
The key items form the basis of the study and are therefore the focus of this section. Idaho is comprised
of multiple climate zones; zone 5 (CZ 5) and zone 6 (CZ 6). Both climate zones are represented in the
sampling, data collection, and resulting analysis and statewide savings calculations. A discussion of other
findings is also covered in this section, including a description of how certain observations, such as
insulation installation quality, are used to modify key items. (See Section 2.3.1 for a sample graph and
explanation of how they should be interpreted.)
3.1.1 Key Items
The field study and underlying methodology are driven by key items that have a significant direct impact
on residential energy efficiency. The graphs presented in this section represent the key item results for
the state based on the measures observed in the field. Note that these key items are also the basis of the
results presented in the subsequent energy and savings phases of analysis.
The following key items were found applicable within the state:
1. Envelope tightness (ACH at 50 Pascals)
2. Window SHGC
3. Window U-factor
4. Exterior wall insulation (assembly U-factor)
5. Ceiling insulation (R-value)
6. Lighting (% high-efficacy)
7. Foundations – basement walls and floors (assembly U-factor)
8. Duct tightness (expressed in cfm per 100 ft2 of conditioned floor area at 25 Pascals)
The three main foundation types observed in Idaho were floors over vented crawlspaces (82
observations), heated basements (22 observations), and unvented crawlspaces. In addition there were four
slab observations, but due to that small number, a graphic is not provided for slabs. Note that these
counts are for the number of homes observed to have these foundation types. The graphs below report the
observed foundation insulation values and the number of observations will be less than or equal to the
number of homes that have a particular foundation type.

3.2
3.1.1.1 Envelope Tightness
Figure 3.1. Envelope Tightness (ACH50)
Table 3.1. Envelope Tightness (ACH50)
Climate Zone CZ5 CZ6 Statewide
Number 53 10 63
Range 1.4 to 6.4 2.3 to 3.8 1.4 to 6.4
Average 4.2 2.9 4.0
Requirement 7 7 7
Compliance Rate 53 of 53 (100%) 10 of 10 (100%) 63 of 63 (100%)
Interpretations:
– Overall, the distribution exhibits significantly lower air leakage than expected based on the
current code requirement.
– All the observations met or exceeded the prescriptive code requirement.

3.3
3.1.1.2 Window SHGC
Figure 3.2. Window SHGC
Table 3.2. Window SHGC
Climate Zone CZ5 CZ6 Statewide
Number 63 14 77
Range 0.20 to 0.41 0.27 to 0.33 0.20 to 0.41
Average 0.30 0.30 0.306
Requirement NA NA NA
Compliance Rate NA NA NA
Interpretations:
– SHGC values were very consistent, and nearly meet the prescriptive requirement for Climate
Zones 1-3, even though there are no SHGC requirements in Climate Zones 5 and 6.
– The vast majority of the observations were in the 0.26 to 0.34 SHGC range.

3.4
3.1.1.3 Window U-Factor
Figure 3.3. Window U-Factor
Table 3.3. Window U-Factor
Climate Zone CZ5 CZ6 Statewide
Number 63 14 77
Range 0.24 to 0.35 0.23 to 0.34 0.23 to 0.35
Average 0.31 0.29 0.31
Requirement 0.35 0.35 0.35
Compliance Rate 63 of 63 (100%) 14 of 14 (100%) 77 of 77 (100%)
Interpretations:
– There is an extremely high rate of compliance for fenestration products.
– This represents one of the most significant findings of the field study, with all of the observations
at or above the code requirement.
– Window U-factor requirements appear to have been implemented with a high rate of success.

3.5
3.1.1.4 Wall Insulation
Two graphs are shown for each climate zone for walls, cavity and continuous insulation (R-value) and
binned wall assembly (U-factor). The R-value graphs show both the cavity and continuous insulation R-
values observed, sorted in order of increasing cavity insulation R-value. The binned U-factor graphs
indicate the U-factor of the wall assembly, including both cavity and continuous insulation layers,
framing, and considering insulation installation quality, as observed in the field. The U-factors are binned
to reduce the number of bars in the chart as individual U-factor observations may be only slightly
different.
Figure 3.4. Wall R-Values
Table 3.4. Wall R-Value
Climate Zone CZ5 CZ6 Statewide
Number 53 11 64
Range R-19 to R-22 R-21 to R-22 R-19 to R-22
Average R-20.6 R-21.6 R-20.8
Requirement R-21 R-21 R-21
Compliance Rate 42 of 53 (21%) 11 of 11 (100%) 53 of 64 (83%)
3.6
Figure 3.5. Wall Assembly Performance, including Wall Insulation Installation Quality
Table 3.5. Wall U-Factor, including Wall Insulation Installation Quality
Climate Zone CZ5 CZ6 Statewide
Number 53 11 64
Range 0.067 to 0.050 0.064 to 0.050 0.067 to 0.050
Average 0.062 0.054 0.061
Assembly U-Factor
(expected) 0.057 0.057 0.057
Rate 16 of 53 (30%) 9 of 11 (82%) 25 of 64 (39%)
Interpretations:
– Looking at the R-values, most of the observations in CZ5 met or exceeded the prescriptive code
requirement, and all in CZ6 did, indicating that the only issue with the amount of insulation are
the homes with R-19 insulation in CZ5.
– In more than half of the above-grade wall observations, the insulation installation quality was
rated as Grade II, indicating an issue that should be addressed.
3.7
3.1.1.5 Ceilings
Figure 3.6. Ceiling R-Value
Table 3.6. Ceiling R-Value
Climate Zone CZ5 CZ6 Statewide
Number 53 10 63
Range R-38 to R-49 R-49 to R-50 R-38 to R-50
Average R-40.2 R-49.8 R-41.7
Requirement R-38 R-49 Varies
Compliance Rate 53 of 53 (100%) 10 of 10 (100%) 63 of 63 (100%)
Interpretations:
– The vast majority of observations met the code requirement exactly.
– All of the roof cavity insulation installation quality observations were Grade I, indicating that
roofs are well insulated in Idaho.

3.8
Figure 3.7. High-efficacy Lighting Percentage
Table 3.7. High-efficacy Lighting Percentage
Climate Zone CZ5 CZ6 Statewide
Number 53 10 63
Range 4 to 100 70 to 96 4 to 100
Average 89 83 88
Requirement 50 50 50
Compliance Rate 52 of 53 (98%) 10 of 10 (100%) 62 of 63 (98%)
Interpretations:
– Nearly all of the field observations met the requirement.
3.1.1.6 Foundation Assemblies
There were three predominant foundation types observed in Idaho, heated basements, floors over vented
crawlspaces and unvented crawlspaces. Two graphs are shown for each climate zone for foundations,
insulation (R-value) and binned assembly (U-factor). The R-value graphs show the insulation R-values
observed. The binned U-factor graphs indicate the U-factor of the assembly, including both cavity and
continuous insulation layers, framing, and considering insulation installation quality, as observed in the
3.9
field. The U-factors are binned to reduce the number of bars in the chart as individual U-factor
observations may be only slightly different.
While initially combined into a single key item (i.e., foundation assemblies), the variety of observed
foundation types are disaggregated in this section, as described above. This approach helps to portray the
combinations of cavity and continuous insulation employed across each foundation type and climate zone,
which is anticipated to be of value for energy code training programs. From a savings perspective, results
are calculated for both the aggregated perspective and for individual foundation types (presented later in
Section 3.3), however; only the aggregated observations should be considered statistically representative
at the statewide level.
Basement Wall Insulation (Conditioned Basements)
For basement wall R-values, the R-value plot shows only the cavity insulation observations. There are an
additional 5 homes that have only continuous insulation and these homes are not shown on Figure 3.8.
These 5 homes are shown in the U-factor plot (Figure 3.9).
Figure 3.8. Basement Wall Cavity R-Values

3.10
Table 3.8. Basement Wall Cavity R-Values
Climate Zone CZ5 CZ6 Statewide
Number 2 9 11
Range R-11 to R-13 R-13 to R-19 R-11 to R-19
Average R-12 R-15 R-14.5
Assembly U-Factor
(expected) R-13 R-19
R-13 in CZ5 and R-
19 in CZ6
Rate 1 of 2 (50%) 2 of 9 (22%) 3 of 11 (27%)
Figure 3.9. Basement Wall Assembly Performance, including Wall Insulation Installation Quality

3.11
Table 3.9. Basement Walls U-Factor
Climate Zone CZ5 CZ6 Statewide
Number 4 12 16
Range 0.069 to 0.031 0.081 to 0.038 0.081 to 0.031
Average 0.049 0.065 0.061
Assembly U-Factor
(expected) 0.059 0.051
0.059 in CZ5 and
0.051 in CZ6
Rate 2 of 4 (50%) 3 of 12 (25%) 5 of 16 (31%)
Interpretations:
– Comparison of the U-factor and R-value graphs for CZ5 indicates that insulation installation
quality may be an issue for basement walls with cavity insulation in CZ5. However, the two
homes with basement walls with continuous insulation did meet code. The sample size for CZ5
is very small.
– Comparison of the U-factor and R-value charts for CZ6 indicates that the main reason for the
poor performance on the U-factor chart is the amount of insulation. In CZ6, the presence of three
homes with continuous basement insulation again provided all of the homes that meet the code
requirement. This implies that for the two homes that meet the cavity insulation R-value, the
insulation installation quality for those homes raised their U-factor.
Insulation in Floors over Unconditioned Spaces
Figure 3.10. Floor R-Values

3.12
Table 3.10. Floor R-Value
Climate Zone CZ5 CZ6 Statewide
Number 58 0 58
Range 30 to 38 NA 30 to 38
Average 30.8 NA 30.8
Assembly U-Factor
(expected) 30 30 30
Rate 58 of 58 (100%) NA 58 of 58 (100%)
Figure 3.11. Floor Assembly Performance, including Insulation Installation Quality
3.13
Table 3.11. Floor U-Factor
Climate Zone CZ5 CZ6 Statewide
Number 58 0 58
Range 0.040 to 0.028 NA 0.040 to 0.028
Average 0.035 NA 0.035
Assembly U-Factor
(expected) 0.033 0.033 0.033
Rate 29 of 58 (50%) NA 29 of 58 (50%)
Interpretations:
– Comparison of the U-factor and R-value charts for CZ5 indicates that insulation installation
quality is an issue for floors in CZ5. The R-values all meet or exceed the code requirement, but
only half of the U-factors meet or exceed the code requirement.
Insulation in Walls of Unvented Crawlspaces
For this assembly, the majority of observations involved continuous insulation, so the R-value plot shown
is for vented crawlspace wall continuous R-value. There are an additional three observations of
crawlspace walls with cavity insulation, all of which meet prescriptive R-value requirements. These
observations are included in the vented crawlspace wall U-factor plot below.
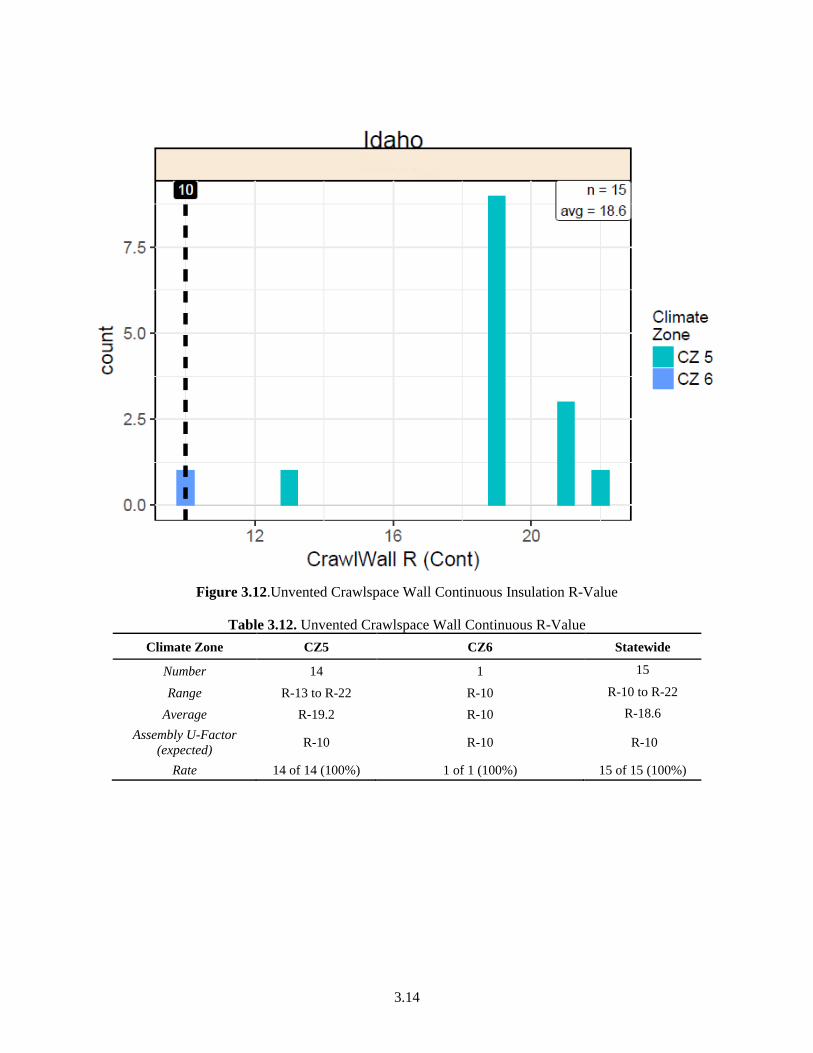
3.14
Figure 3.12.Unvented Crawlspace Wall Continuous Insulation R-Value
Table 3.12. Unvented Crawlspace Wall Continuous R-Value
Climate Zone CZ5 CZ6 Statewide
Number 14 1 15
Range R-13 to R-22 R-10 R-10 to R-22
Average R-19.2 R-10 R-18.6
Assembly U-Factor
(expected) R-10 R-10 R-10
Rate 14 of 14 (100%) 1 of 1 (100%) 15 of 15 (100%)

3.15
Figure 3.13. Unvented Crawlspace Wall Assembly Performance, including Insulation Installation Quality
Table 3.13. Unvented Crawlspace Wall U-Factor
Climate Zone CZ5 CZ6 Statewide
Number 17 1 18
Range 0.065 to 0.032 0.065 0.065 to 0.032
Average 0.040 0.065 0..041
Assembly U-Factor
(expected) 0.068 0.068 0.068
Rate 16 of 17 (94%) 1 of 1 (100%) 18 of 18 (100%)
Interpretations:
– All but one unvented crawlspace wall observation met the code requirement.
3.1.1.7 Duct Tightness
For ducts, this report presents both raw duct leakage and adjusted duct leakage. Raw duct leakage is
simply the values of duct leakage observed in the field. Adjusted duct leakage looks at the location of the
ducts and adjusts the leakage values for any ducts which are entirely in conditioned space by setting the
leakage of those ducts to zero (0). The adjustment reflects the fact that duct leakage tests are not required
if the ducts are entirely in conditioned space.

3.16
Figure 3.14. Raw Duct Tightness (CFM25/100ft2 CFA)
Table 3.14. Raw Duct Tightness (CFM25/100ft2 CFA)
Climate Zone CZ5 CZ6 Statewide
Number 53 11 64
Range 3.2 to 64.0 6.9 to 63.6 3.24 to 64.0
Average 8.9 35.9 13.6
Requirement 4 4 4
Compliance Rate 3 of 53 (6%) 0 of 11 (0%) 3 of 64 (5%)

3.17
Figure 3.15. Adjusted Duct Tightness (CFM25/100ft2 CFA)
Table 3.15. Adjusted Duct Tightness (CFM25/100ft2 CFA)
Climate Zone CZ5 CZ6 Statewide
Number 53 11 64
Range 0.0 to 64.0 0.0 to 63.61 3.24 to 64.0
Average 7.6 1.72 6.6
Requirement 4 4 4
Compliance Rate 17 of 53 (32%) 10 of 11 (91%) 26 of 64 (37%)
Interpretations:
– The average total duct leakage is 8.5 CFM 25/100 ft2 for the 50 systems with ducts in
unconditioned space, and 31.8 CFM 25/100 ft2 for the 14 systems located entirely in conditioned
space.
– The majority of raw observations do not meet the Idaho code requirement for duct leakage.
– The majority of adjusted observations do not meet the Idaho code requirement for duct leakage.
However, nearly all adjusted duct leakage values in CZ6 meet the requirement, indicating that
many homes in CZ6 are installing ducts entirely in conditioned space.

3.18
– Reductions in duct leakage represent a significant area for improvement and should be given
increased attention in future training and enforcement.
3.1.1.8 Impact of Insulation Installation Quality
While insulation installation quality is not an explicit energy code requirement, at the start of DOE’s FOA
projects, it was noted as a particular concern among project teams and stakeholders, as it plays an
important role in the energy performance of envelope assemblies. Insulation installation quality was
therefore collected by the project team whenever possible and applied as a modifier in the analyses for
applicable key items (i.e., ceiling insulation, wall insulation, and foundation insulation). The team
followed the RESNET1 assessment protocol which has three grades, Grade I being the best quality
installation and Grade III being the worst.
Table 3.16 shows the insulation installation quality levels for framed envelope assemblies, as observed in
the state. A slight majority of the observations (1247 of 243) were classified as Grade I, with remainder
Grade II, indicating that there is some improvement needed in insulation installation quality. Roof
insulation installation quality was all Grade I, but other assemblies show the majority of observations to
be Grade II.
Table 3.16. Insulation Installation Quality
Assembly Grade I Grade II Grade III Total Observations
Roof Cavity 63 0 0 63
Floor 27 31 0 58
Above Grade Wall 25 39 0 64
Basement Wall 2 9 0 11
Crawlspace Wall 0 3 0 3
Knee Wall 7 35 2 44
3.1.2 Additional Data Items
The project team collected data on all code requirements within the state as well as other areas to inform
the energy simulation and analysis for the project (e.g., home size, installed equipment systems, etc.).
While these items were not the focal point of the study, and many are not considered statistically
representative, they do provide some insight surrounding the energy code and residential construction
within the state.
The following represents a summary of this data and outlines some of the more significant findings, in
many cases including the observation or compliance rate associated with the specified item. A larger
selection of the additional data items collected as part of the state field study is contained in Appendix B.
3.1.2.1 Average Home
Size: 2,486 ft2 and 1.35 stories
1 See http://www.resnet.us/standards/RESNET_Mortgage_Industry_National_HERS_Standards.pdf
3.19
3.1.2.2 Compliance
Almost all homes (98%) were permitted under the Idaho Energy Conservation Code. Two percent
selected the 2015 edition of the International Energy Conservation Code to meet the local jurisdiction
requirements. (n=127)
Nine homes were noted as participating in an above-code program.
3.1.2.3 Envelope
Profile:
– Walls: All were wood-framed walls with 2x6” studs
– Foundations: Mix of vented crawlspaces (65%), basements (17%), unvented crawlspaces (15%),
and slab on grade (3%).
Successes (percentage of observations that complied):
– Insulation labeled (100%)
– IC-rated light fixtures sealed (100%)
– Utility penetrations sealed (98%)
Areas for Improvement:
– Attic access openings complied (54%)
– Knee walls sealed (55%)
– Envelope areas behind bathroom tubs & showers sealed (39%)
– Rim joists sealed (27%)
– Dropped ceilings sealed (49%)
3.1.2.4 Duct & Piping Systems
Profile:
– Ducts were generally located within conditioned space (percentage of duct system):
○ Supply: 41% (35 homes with 37 duct systems entirely within conditioned space)
○ Return: 31% (25 homes with 27 duct systems entirely within conditioned space)
– About 28% of duct systems located supply ducts entirely within conditioned space
– About 21% of duct systems located return ducts entirely within conditioned space
– About 19% of duct systems had the entire system within conditioned space.
– Pipe Insulation (R-value): 2.7
Successes:
– Air handlers sealed (88%)

3.20
3.1.2.5 HVAC Equipment
Profile:
– Heating: Mostly gas furnaces with an average efficiency of 90 AFUE.
– Cooling: Mostly central AC with an average efficiency of 13.1 SEER
– Water Heating: Mix of gas (92%) and electric (8%) storage (98%) with an average capacity of 50
gallons and average efficiency rating of EF 0.65.
Successes:
– User manuals for mechanical systems provided (100%)
3.2 Energy Intensity
The statewide energy analysis results are shown in the figure below, which compares the weighted
average energy consumption of the observed data set to the weighted average consumption based on the
state energy code. The observed data set (as gathered in the field) was compared against the same set of
homes meeting prescriptive code requirements. In terms of overall energy consumption, the average
home in Idaho appears to use less energy than would be expected relative to a home built to the current
minimum state code requirements.
Analysis of the collected field data indicates an average regulated EUI (dashed line in Figure 3.16) of
approximately 34.62 kBtu/ft2-yr compared to 40.51 kBtu/ft2-yr for homes exactly meeting minimum
prescriptive energy code requirements (black line in Figure 3.16). This suggests the EUI for a “typical”
home in the state is about 15% better than code.

3.21
Figure 3.16. Statewide EUI Analysis for Idaho
3.3 Savings Potential
Those key items with the greatest potential,1 shown below followed by the percent that did not meet code,
were analyzed further to calculate the associated savings potential, including energy and cost savings.
Duct Leakage (63% of adjusted observations),
Exterior Wall Insulation (61%),
Foundations
– Basement Wall Insulation (69%), and
– Floor Insulation (50%).
For analytical details refer to Section 2.3.3 (Savings Analysis) or the DOE methodology document
(2018).
Estimated savings resulting from the analysis are shown below in order of highest to lowest total energy
and cost savings (Table 3.17). As can be seen, there are significant savings opportunities, with the
greatest total savings potential associated with these measures. In addition,
1 Defined here as those with more than 15% of observations not meeting the prescriptive code requirement. For
insulated assemblies, the U-factor observations are used.
3.22
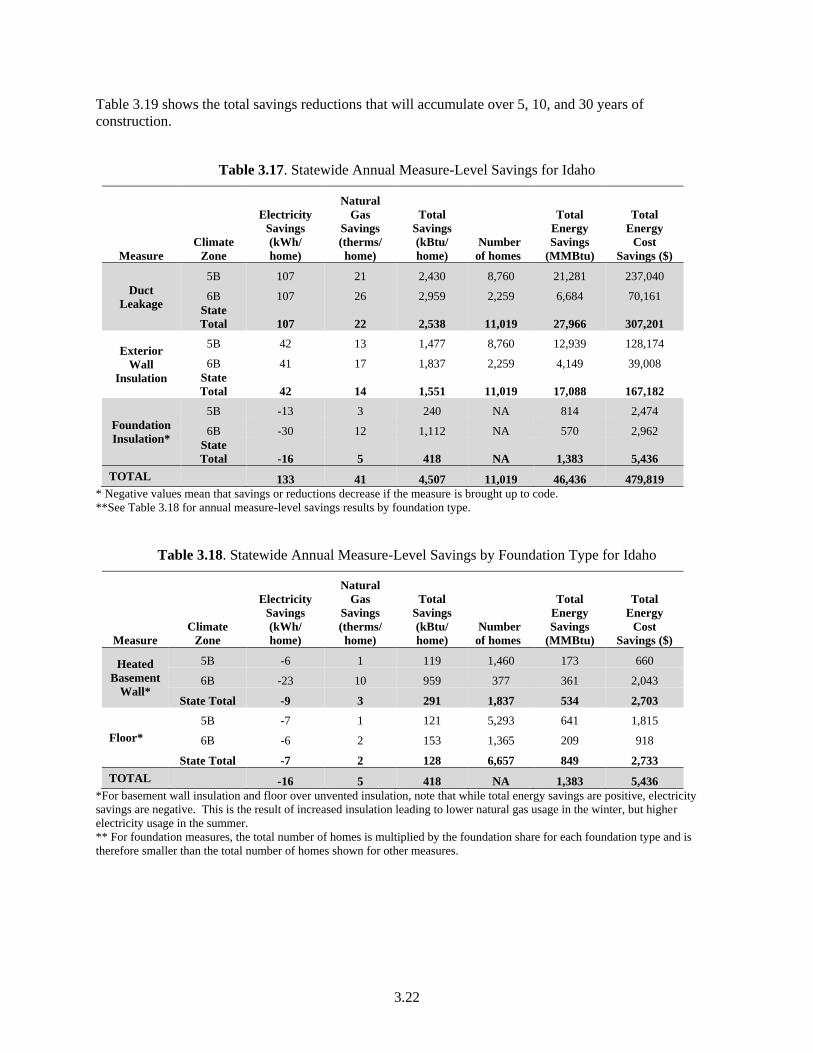
Table 3.19 shows the total savings reductions that will accumulate over 5, 10, and 30 years of
construction.
Table 3.17. Statewide Annual Measure-Level Savings for Idaho
Measure
Climate
Zone
Electricity
Savings
(kWh/
home)
Natural
Gas
Savings
(therms/
home)
Total
Savings
(kBtu/
home)
Number
of homes
Total
Energy
Savings
(MMBtu)
Total
Energy
Cost
Savings ($)
Duct
Leakage
5B 107 21 2,430 8,760 21,281 237,040
6B 107 26 2,959 2,259 6,684 70,161
State
Total 107 22 2,538 11,019 27,966 307,201
Exterior
Wall
Insulation
5B 42 13 1,477 8,760 12,939 128,174
6B 41 17 1,837 2,259 4,149 39,008
State
Total 42 14 1,551 11,019 17,088 167,182
Foundation
Insulation*
5B -13 3 240 NA 814 2,474
6B -30 12 1,112 NA 570 2,962
State
Total -16 5 418 NA 1,383 5,436
TOTAL 133 41 4,507 11,019 46,436 479,819
* Negative values mean that savings or reductions decrease if the measure is brought up to code.
**See Table 3.18 for annual measure-level savings results by foundation type.
Table 3.18. Statewide Annual Measure-Level Savings by Foundation Type for Idaho
Measure
Climate
Zone
Electricity
Savings
(kWh/
home)
Natural
Gas
Savings
(therms/
home)
Total
Savings
(kBtu/
home)
Number
of homes
Total
Energy
Savings
(MMBtu)
Total
Energy
Cost
Savings ($)
Heated
Basement
Wall*
5B -6 1 119 1,460 173 660
6B -23 10 959 377 361 2,043
State Total -9 3 291 1,837 534 2,703
Floor*
5B -7 1 121 5,293 641 1,815
6B -6 2 153 1,365 209 918
State Total -7 2 128 6,657 849 2,733
TOTAL -16 5 418 NA 1,383 5,436
*For basement wall insulation and floor over unvented insulation, note that while total energy savings are positive, electricity
savings are negative. This is the result of increased insulation leading to lower natural gas usage in the winter, but higher
electricity usage in the summer.
** For foundation measures, the total number of homes is multiplied by the foundation share for each foundation type and is
therefore smaller than the total number of homes shown for other measures.

3.23
Table 3.19. Five-years, Ten-years, and Thirty-years Cumulative Annual Statewide Savings for Idaho
Measure Total Energy Savings (MMBtu) Total Energy Cost Savings ($)
5yr 10yr 30yr 5yr 10yr 30yr
Duct
Leakage 419,483 1,538,104 13,003,973 4,608,019 16,896,069 142,848,583
Exterior
Wall
Insulation
256,313 939,815 7,945,707 2,507,730 9,195,009 77,739,624
Foundation
Insulation 20,748 76,077 643,197 81,541 298,985 2,527,781
TOTAL 696,544 2,553,996 21,592,877 $7,197,290 $26,390,063 $223,115,988


4.1
4.0 Conclusions
The Idaho field study provides an enhanced understanding of statewide code implementation and suggests
that potential savings are available through increased compliance. From a statewide perspective, the
average home in Idaho uses about 15% less energy than a home exactly meeting the state energy code.
However, savings potential remains through increased compliance with targeted measures. Potential
statewide annual energy savings are 46,436 MMBtu, which equates to $479,819 in cost savings. Over a
30-year period, these impacts grow to 21.6 million MMBtu and $223 million.
Several key measures directly contribute to these savings, and should be targeted through future
education, training and outreach activities. The savings associated with each are shown in Table 4.1
below.
Table 4.1. Annual Statewide Savings Potential in Idaho
Key Measure
Annual Savings
Energy (MMBtu) Cost ($)
Duct Leakage 27,966 307,201
Exterior Wall Insulation 17,088 167,182
Foundation Insulation 1,383 5,436
Total 46,436 MMBtu $479,819

5.1
5.0 References
Census Bureau. 2017. Censtats Building Permits Database. http://censtats.census.gov/
DOE. 2012. National Energy and Cost Savings for New Single- and Multifamily Homes: A Comparison
of the 2006, 2009, and 2012 Editions of the IECC, available at http://www.energycodes.gov/development
DOE Building Energy Codes Program’s residential field study website is available at
https://www.energycodes.gov/compliance/residential-energy-code-field-study (accessed August 8, 2016).
DOE/PNNL 2018. “Residential Building Energy Code Field Study: Data Collection & Analysis
Methodology” Available at https://www.energy.gov/sites/prod/files/2018/06/f52/bto-Res-Field-Study-
Methodology-060618-2.pdf
EnergyPlus. https://energyplus.net/.
Residential Energy Services Network. 2013. “Mortgage Industry National Home Energy Rating System
Standards.” Residential Energy Services Network, Oceanside, CA. www.resnet.us.


Appendix A –
State Sampling Plan


A.1
Appendix A
State Sampling Plan
A.1 State Sampling Plan
Table A.1. State Sampling Plan
Location (Place, County) Sample Actual
Kootenai County Unincorporated Area, Kootenai 4 4
Coeur d’Alene, Kootenai 3 3
Post Falls, Kootenai 4 4
Hayden, Kootenai 2 2
Rathdrum, Kootenai 1 1
Latah County Unincorporated Area, Latah 1 1
Ada County Unincorporated Area, Ada 5 5
Meridian, Ada 7 7
Eagle, Ada 5 5
Boise, Ada 3 3
Kuna, Ada 2 2
Star, Ada 1 1
Canyon County Unincorporated Area, Canyon 2 2
Nampa, Canyon 4 4
Caldwell, Canyon 2 2
Middleton, Canyon 1 1
Mountain Home, Elmore 1 1
Valley County Unincorporated Area, Valley 1 1
Bonneville County Unincorporated Area, Bonneville 1 1
Idaho Falls, Bonneville 2 2
Ammon, Bonneville 1 1
Jefferson County Unincorporated Area, Jefferson 1 1
Pocatello, Bannock 1 1
Chubbuck, Bannock 2 2
Rexburg, Madison 4 4
Fremont County Unincorporated Area, Fremont 1 1
Twin Falls, Twin Falls 1 1
Total 63 63

A.2
A.2 Substitutions
No substitutions to the state sampling plan were required.

Appendix B –
Additional Data


B.1
Appendix B
Additional Data
B.1 Additional Data Collected by Field Teams
The project team made observations on several energy efficiency measures beyond the key items alone.
The majority of these additional items are based on code requirements within the state, while others were
collected to inform the energy simulation and analysis for the project (e.g., installed equipment, whether
the home participated in an above-code program, etc.). While these items were not the focal point of the
study, and many are not considered statistically representative, they do provide some additional insight
surrounding the energy code and residential construction within the state.
The following is a sampling of the additional data items collected as part of the Idaho field study. Each
item is presented, along with a brief description and statistical summary based on the associated field
observations. The full data set is available on the DOE Building Energy Codes Program website.1
B.1.1 General
The following represents the general characteristics of the homes observed in the study:
B.1.1.1 Average Home
Size (n=127): 2486 ft2
Number of Stories (n=127): 1.35
Table B.1. Conditioned Floor Area (ft2)
Conditioned Floor Area (ft2) < 1000 1000 to 1999 2000 to 2999 3000 to 3999 4000+
Percentage 1% 35% 42% 17% 5%
Table B.2. Number of Stories
No. of Stories 1 2 3 4+
Percentage 65% 35% 0% 0%
B.1.1.2 Wall Profile
Framing Type (n=127):
– All were framed construction (100%)
Framing Material (n=127):
– Wood (100%)
1 Available at https://www.energycodes.gov/compliance/residential-energy-code-field-study

B.2
– Steel (0%)
Framing Depth (n=127):
– 6” (100%)
B.1.1.3 Foundation Profile
Foundation Type (n=127):
– Heated Basement (17%)
– Slab on Grade (3%)
– Unvented Crawlspace (15%)
– Vented Crawlspace (65%)
B.1.2 Compliance
The following summarizes information related to compliance, including the energy code associated with
individual homes, whether the home was participating in an above-code program, and which particular
programs were reported. The percentages provided in the sections below represent percentages of total
observations or the percentage of observations that complied.
B.1.2.1 Energy Code Used (n=127):
Table B.3, Energy Code Used
Energy Code Idaho Energy Conservation Code 2015 IECC
Percentage 98% 2%
Was the home participating in an above-code program (n=102)?
– Yes (9%)
– No (91%)
B.1.3 Envelope
The following list of questions focus on average characteristics of the thermal envelope:
B.1.3.1 Insulation Labels
Was insulation labeled (n=12)?
– Yes (100%)
– No (0%)
B.1.3.2 Ceilings
Did the attic hatch/door exhibit the correct insulation value (n=8)?

B.3
– Yes (100%)
– No (0%)
B.1.3.3 Air Sealing1
Thermal envelope sealed (n=64) (97%)
Openings around windows and doors sealed (n=64) (100%)
Utility penetrations sealed (n=95) (98%)
Dropped ceilings sealed (n=39) (49%)
Knee walls sealed (n=53) (55%)
Garage walls and ceilings sealed (n=68) (100%)
Envelope behind tubs and showers sealed (n=64) (39%)
Common walls sealed (n=0) (0%)
Attic access openings sealed (n=35) (54%)
Rim joists sealed (n=30) (27%)
Other sources of infiltration sealed (n=63) (97%)
IC-rated light fixtures sealed (n=127) (100%)
B.1.4 Duct & Piping Systems
The following represents an average profile of observed air ducting and water piping systems, followed
by a list of additional questions related to such systems:
B.1.4.1 System Profile
Duct Location in Conditioned Space (percentage):
– Supply (n=131): 28% (37 homes with systems located entirely within conditioned space)
– Return (n=131): 21% (27 homes with systems located entirely within conditioned space)
Duct Insulation (R-value):
– Supply (n=61): 7.93
– Return (n=15): 6.8
Air ducts sealed (n=114) (88%)
Air handlers sealed (n=123) (98%)
Filter boxes sealed (n=114) (94%)
1 Note that results in this section are from checklist items that are addressed via visual inspection. When comparing
these visual results with the actual tested results, it is clear that there can be significant differences in the two
methods.

B.4
B.1.5 HVAC Equipment
The following represents an average profile of observed HVAC equipment, followed by:
B.1.5.1 Heating
Fuel Source (n=127):
– Gas (96%)
– Electricity (4%)
System Type (n=122):
– Furnace (97%)
– Heat Pump (3%)
System Capacity (n=124):
– Furnace: 69,639 Btu
– Heat Pump: 38,800 Btu
System Efficiency (n=124):
– Furnace: 90 AFUE (many furnaces listed as 80 AFUE)
– Heat Pump: 8.3 HSPF
B.1.5.2 Cooling
System Type (n=110):
– Central AC (96%)
– Heat Pump (4%)
System Capacity (n=110):
– 33,350 (Btu/hr)
System Efficiency (n=64):
– 13.1 SEER (observations ranged from 13 to 14.5 SEER)
B.1.5.3 Water Heating
Fuel Source (n=127):
– Gas (92%)
– Electric (8%)
System Type (n=126):
– Storage (98%)
– Tankless (2%)
System Capacity (n=63):
– 52 gallons (observations ranged from 50 to 100 gallons)

B.5
Table B.4. Water Heating System Storage Capacity Distribution
Capacity < 50 gal 50-59 gal 60-69 gal 70-79 gal 80-89 gal 90+ gal
Percentage 0% 98% 0% 0% 0% 2%
System Efficiency (n=63):
– EF 0.65 (range from EF 0.62 to EF 0.92)
B.1.5.4 Ventilation
System Type (n=127):
– Exhaust Only (55%)
– AHU Integrated (45%)
Exhaust Fan Type (n=70):
– Dedicated Exhaust (4%)
– Bathroom Fan (96%)
B.1.5.5 Other
Mechanical manuals provided (n=54) (100%)