Embed Size (px)
Citation preview
Idaho Economic Forecast
C.L. “Butch” Otter, Governor DIVISION OF FINANCIAL MANAGEMENT Jani Revier, Administrator Executive Office of the Governor APRIL 2015 VOLUME XXXVII NO. 2
ISSN 8756-1840
Forecast 2015–2018 Why Is Wage Growth So Slow? Alternative Forecasts
611,684
638,841
656,228
648,913
610,005
603,691
610,735
622,253
638,075
655,877
671,454
687,384
702,787
718,553
580,000
600,000
620,000
640,000
660,000
680,000
700,000
720,000
740,000
580,000
600,000
620,000
640,000
660,000
680,000
700,000
720,000
740,000
2005 2006 2007 2008 2009 2010 2011 2012 2013 2014 2015 2016 2017 2018
Idaho Nonfarm Payrolls
Idaho Nonfarm Payrolls
Prerecession High

This page left blank intentionally.

IDAHO ECONOMIC FORECAST 2015–2018
State of Idaho C.L. “BUTCH” OTTER
Governor

Costs associated with this publication are available from the Idaho Division of Financial Management in accordance with Section 60-202, Idaho Code. 04-2015/010200-180-4001
1
TABLE OF CONTENTS
Introduction ....................................................................................................................................... 2 Executive Summary .......................................................................................................................... 5 Idaho and US Forecast Summary Tables .......................................................................................... 6 Forecast Description: National ............................................................................................................................... 8 Idaho ................................................................................................................................... 15 Forecasts Comparison ....................................................................................................................... 22 Alternative Forecasts ........................................................................................................................ 24 Feature Article Why Is Wage Growth So Slow? ......................................................................................... 27 Forecast Detail .................................................................................................................................. 33 Annual Forecast .................................................................................................................. 34 Quarterly Forecast .............................................................................................................. 48 Appendix ........................................................................................................................................... 63 IHS Economics US Macroeconomic Model ....................................................................... 64 Idaho Economic Model ....................................................................................................... 66 Equations .............................................................................................................. 68 Endogenous Variables .......................................................................................... 72 Exogenous Variables ............................................................................................ 74
2
INTRODUCTION The national forecast presented in this publication is the April 2015 IHS Economics baseline forecast of the US economy. The previous Idaho Economic Forecast was based on the November 2014 IHS Economics baseline national forecast. The historical and forecasted Idaho nonfarm payrolls are featured on the cover of this Idaho Economic Forecast. Idaho nonfarm payrolls exceeded 656,000 in 2007, before the weight of the recession took its toll on the Gem State’s employment. Payrolls decreased over the next few years, and by 2010 total nonfarm employment in Idaho was just over 603,000 jobs (a loss of nearly 50,000 jobs in three years). Payrolls have grown in almost every category since 2010, and nonfarm payrolls are estimated to have exceeded their prerecession peak late in 2014. Nonfarm employment is projected to grow in each year of the forecast, ultimately reaching an estimated level of 718,550 in 2018. FEATURE A prominent feature of the Great Recession and subsequent recovery has been the unusual behavior of wages. During the recession wage growth slowed much less than expected in response to the sharp increase in unemployment. And so far in the recovery, wage growth has remained slow, despite substantial decline in the unemployment rate. Both run counter to standard economic thought. One explanation for these phenomena is downward wage rigidity, which is hesitancy of employers to reduce wages and the reluctance of workers to accept pay cuts. This article explores whether wage rigidities over the last recession and recovery can also be seen across industries. In particular, it considers whether industries with higher or lower degrees of wage flexibility have different evolutions of wage growth and unemployment. This article was written by Mary C. Daly and Bart Hobijn, both of whom are with the Federal Reserve Bank of San Francisco. THE FORECAST Alternative assumptions concerning future movements of key economic variables can lead to major variations in national and/or regional outlooks. IHS Economics examines the effects of different economic scenarios, including the potential impacts of recessions, higher inflation, and future Federal Reserve Board decisions. Alternative Idaho economic forecasts were developed under different policy and growth scenarios at the national level. These forecasts are included in this report. Historical and forecast data for Idaho and the US are presented in the tables in the middle section of this report. Detail is provided for every year from 2001 through 2018 and for every quarter from 2012 through 2017. The solution of the Idaho Economic Model (IEM) for this forecast begins with the first quarter of 2015. Descriptions of the IHS Economics US Macroeconomic Model and the IEM are provided in the Appendix. Equations of the IEM and variable definitions are listed in the last pages of this publication.

3
CHANGES The Idaho Department of Labor provides monthly historical employment data that are seasonally adjusted and converted to quarterly frequencies by the Idaho Division of Financial Management (DFM). The current set contains nonfarm employment through the fourth quarter of 2014. These data show that employment in last year’s third quarter was about 1,800 jobs lower than was previously forecast. However, there were about 1,100 more jobs than expected in the fourth quarter of 2014. The Idaho quarterly personal income estimates contained in this report were released by the US Department of Commerce’s Bureau of Economic Analysis (BEA) on March 25, 2015. This release includes the first estimates for the fourth quarter of 2014, as well as revised estimates for the three previous quarters of that year. The next round of Idaho personal income estimates will be published by the BEA on June 22, 2015. These estimates will be included in DFM’s July 2015 Idaho Economic Forecast. Readers with any questions should contact Nathaniel L. Clayville at (208) 334-3900 or at [email protected]. Idaho Division of Financial Management Economic Analysis Bureau 304 N. 8th St. Derek E. Santos, Chief Economist P.O. Box 83720 Nathaniel L. Clayville, Economist Boise, ID 83720-0032 (208) 334-3900

This page left blank intentionally.
5
EXECUTIVE SUMMARY
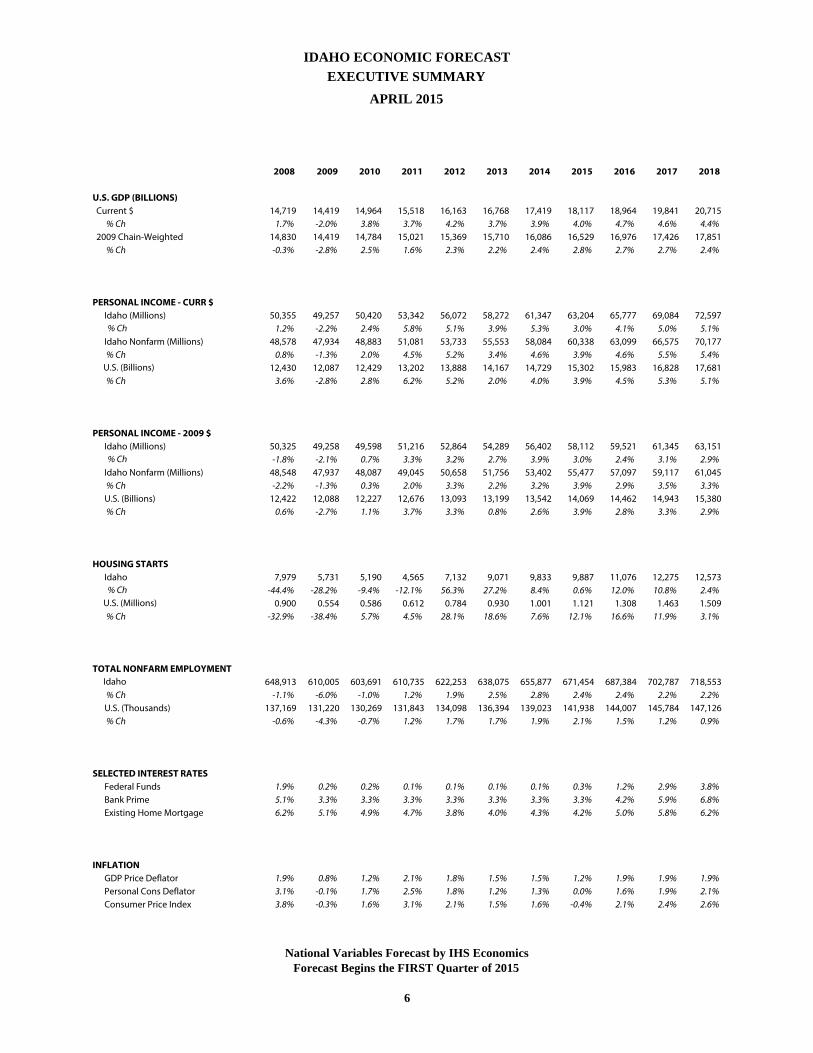
After the recession and slow recovery, Idaho’s economy appears to be fully back in expansion mode. While nonfarm employment began to show promising signs of growth in 2013, seasonally-adjusted nonfarm payrolls did not break their prerecession levels until the fourth quarter of 2014. Nonfarm payrolls in the state grew at an estimated pace of 2.8% in 2014 and are forecast to grow by 2.4% in both 2015 and 2016, and 2.2% in both 2017 and 2018. Higher employment in the state is expected to put some upward pressure on wages over the next few years, and this should propel Idaho personal income. Real personal income is anticipated to grow 3.0% in 2015, 2.4% in 2016, 3.1% in 2017, and 2.9% in 2018. Growth in the housing market stumbled in 2014, but it should return to a sustainable trajectory. When the housing market began to show more vitality in 2012, forecasts indicated that there would be strong growth in housing starts that would last for several years before the market would begin to equalize at a more sustainable level of growth. It now appears that the majority of the accelerated growth occurred in 2012 and 2013. The deceleration in Idaho housing starts in 2014 is not expected to derail the economic expansion that the state is currently experiencing. Through the last half of 2014 and the first part of 2015, the US economy has largely moved out of recovery mode and into sustained expansion mode. The drop in oil prices has had positive and negative effects on the economy. It led to a decrease in business investments on equipment, but it also freed up additional disposable income for many consumers in the US. So far, it appears that the good is mostly outweighing the bad. Some of the largest declines in the price for gasoline occurred close to the holidays, providing consumers with extra spending money during the largest shopping time of the year. Consumers accelerated spending on gift items like electronics in the fourth quarter, but they also spent more on big-ticket durable goods, like automobiles. Spending on nondurable goods and services was also up in the fourth quarter. Strength in the labor market has also added to higher levels of consumer spending over the last several months. The US unemployment rate averaged 6.2% in 2014 and is forecast to decrease to an average rate of 5.5% in 2015. The housing market, one of the key economic drivers in the US, had a brisk recovery in 2012 and 2013, but decelerated in 2014. While housing starts and new and existing home sales did continue to grow in 2014, the pace of growth was more modest than was previously expected. The housing market is expected to grow at a faster pace over the next few years, but a return to growth rates of the mid-2000s is not anticipated. United States real GDP growth is anticipated to accelerate from 2.4% in 2014 to 2.8% in 2015. Real GDP is then expected to grow by 2.7% in both 2016 and 2017 and 2.4% in 2018.
2008 2009 2010 2011 2012 2013 2014 2015 2016 2017 2018
U.S. GDP (BILLIONS) Current $ 14,719 14,419 14,964 15,518 16,163 16,768 17,419 18,117 18,964 19,841 20,715 % Ch 1.7% -2.0% 3.8% 3.7% 4.2% 3.7% 3.9% 4.0% 4.7% 4.6% 4.4% 2009 Chain-Weighted 14,830 14,419 14,784 15,021 15,369 15,710 16,086 16,529 16,976 17,426 17,851 % Ch -0.3% -2.8% 2.5% 1.6% 2.3% 2.2% 2.4% 2.8% 2.7% 2.7% 2.4%
PERSONAL INCOME - CURR $ Idaho (Millions) 50,355 49,257 50,420 53,342 56,072 58,272 61,347 63,204 65,777 69,084 72,597 % Ch 1.2% -2.2% 2.4% 5.8% 5.1% 3.9% 5.3% 3.0% 4.1% 5.0% 5.1% Idaho Nonfarm (Millions) 48,578 47,934 48,883 51,081 53,733 55,553 58,084 60,338 63,099 66,575 70,177 % Ch 0.8% -1.3% 2.0% 4.5% 5.2% 3.4% 4.6% 3.9% 4.6% 5.5% 5.4% U.S. (Billions) 12,430 12,087 12,429 13,202 13,888 14,167 14,729 15,302 15,983 16,828 17,681 % Ch 3.6% -2.8% 2.8% 6.2% 5.2% 2.0% 4.0% 3.9% 4.5% 5.3% 5.1%
PERSONAL INCOME - 2009 $ Idaho (Millions) 50,325 49,258 49,598 51,216 52,864 54,289 56,402 58,112 59,521 61,345 63,151 % Ch -1.8% -2.1% 0.7% 3.3% 3.2% 2.7% 3.9% 3.0% 2.4% 3.1% 2.9% Idaho Nonfarm (Millions) 48,548 47,937 48,087 49,045 50,658 51,756 53,402 55,477 57,097 59,117 61,045 % Ch -2.2% -1.3% 0.3% 2.0% 3.3% 2.2% 3.2% 3.9% 2.9% 3.5% 3.3% U.S. (Billions) 12,422 12,088 12,227 12,676 13,093 13,199 13,542 14,069 14,462 14,943 15,380 % Ch 0.6% -2.7% 1.1% 3.7% 3.3% 0.8% 2.6% 3.9% 2.8% 3.3% 2.9%
HOUSING STARTS Idaho 7,979 5,731 5,190 4,565 7,132 9,071 9,833 9,887 11,076 12,275 12,573 % Ch -44.4% -28.2% -9.4% -12.1% 56.3% 27.2% 8.4% 0.6% 12.0% 10.8% 2.4% U.S. (Millions) 0.900 0.554 0.586 0.612 0.784 0.930 1.001 1.121 1.308 1.463 1.509 % Ch -32.9% -38.4% 5.7% 4.5% 28.1% 18.6% 7.6% 12.1% 16.6% 11.9% 3.1%
TOTAL NONFARM EMPLOYMENT Idaho 648,913 610,005 603,691 610,735 622,253 638,075 655,877 671,454 687,384 702,787 718,553 % Ch -1.1% -6.0% -1.0% 1.2% 1.9% 2.5% 2.8% 2.4% 2.4% 2.2% 2.2% U.S. (Thousands) 137,169 131,220 130,269 131,843 134,098 136,394 139,023 141,938 144,007 145,784 147,126 % Ch -0.6% -4.3% -0.7% 1.2% 1.7% 1.7% 1.9% 2.1% 1.5% 1.2% 0.9%
SELECTED INTEREST RATES Federal Funds 1.9% 0.2% 0.2% 0.1% 0.1% 0.1% 0.1% 0.3% 1.2% 2.9% 3.8% Bank Prime 5.1% 3.3% 3.3% 3.3% 3.3% 3.3% 3.3% 3.3% 4.2% 5.9% 6.8% Existing Home Mortgage 6.2% 5.1% 4.9% 4.7% 3.8% 4.0% 4.3% 4.2% 5.0% 5.8% 6.2%
INFLATION GDP Price Deflator 1.9% 0.8% 1.2% 2.1% 1.8% 1.5% 1.5% 1.2% 1.9% 1.9% 1.9% Personal Cons Deflator 3.1% -0.1% 1.7% 2.5% 1.8% 1.2% 1.3% 0.0% 1.6% 1.9% 2.1% Consumer Price Index 3.8% -0.3% 1.6% 3.1% 2.1% 1.5% 1.6% -0.4% 2.1% 2.4% 2.6%
IDAHO ECONOMIC FORECAST
EXECUTIVE SUMMARY
APRIL 2015
National Variables Forecast by IHS EconomicsForecast Begins the FIRST Quarter of 2015
6
Q1 Q2 Q3 Q4 Q1 Q2 Q3 Q4 Q1 Q2 Q3 Q4
U.S. GDP (BILLIONS) Current $ 17,044 17,328 17,600 17,704 17,794 18,016 18,237 18,422 18,636 18,854 19,063 19,302 % Ch -0.8% 6.8% 6.4% 2.4% 2.0% 5.1% 5.0% 4.1% 4.7% 4.8% 4.5% 5.1% 2009 Chain-Weighted 15,832 16,010 16,206 16,295 16,343 16,480 16,601 16,692 16,810 16,917 17,023 17,154 % Ch -2.1% 4.6% 5.0% 2.2% 1.2% 3.4% 3.0% 2.2% 2.8% 2.6% 2.5% 3.1%
PERSONAL INCOME - CURR $ Idaho (Millions) 60,079 61,275 61,657 62,378 62,403 62,808 63,408 64,196 64,823 65,349 66,080 66,856 % Ch 6.5% 8.2% 2.5% 4.8% 0.2% 2.6% 3.9% 5.1% 4.0% 3.3% 4.6% 4.8% Idaho Nonfarm (Millions) 57,178 57,828 58,339 58,989 59,576 59,980 60,560 61,236 62,053 62,696 63,409 64,239 % Ch 5.0% 4.6% 3.6% 4.5% 4.0% 2.7% 3.9% 4.5% 5.4% 4.2% 4.6% 5.3% U.S. (Billions) 14,485 14,661 14,811 14,958 15,110 15,227 15,359 15,510 15,716 15,884 16,063 16,268 % Ch 4.9% 4.9% 4.2% 4.0% 4.1% 3.1% 3.5% 4.0% 5.4% 4.3% 4.6% 5.2%
PERSONAL INCOME - 2009 $ Idaho (Millions) 55,549 56,328 56,506 57,227 57,514 57,926 58,290 58,717 59,112 59,288 59,647 60,035 % Ch 5.1% 5.7% 1.3% 5.2% 2.0% 2.9% 2.5% 3.0% 2.7% 1.2% 2.4% 2.6% Idaho Nonfarm (Millions) 52,866 53,160 53,465 54,118 54,908 55,319 55,672 56,009 56,586 56,881 57,236 57,685 % Ch 3.6% 2.2% 2.3% 5.0% 6.0% 3.0% 2.6% 2.4% 4.2% 2.1% 2.5% 3.2% U.S. (Billions) 13,392 13,477 13,574 13,723 13,926 14,044 14,119 14,186 14,331 14,411 14,499 14,608 % Ch 3.5% 2.5% 2.9% 4.5% 6.1% 3.4% 2.2% 1.9% 4.1% 2.2% 2.5% 3.0%
HOUSING STARTS Idaho 10,385 9,635 8,887 10,423 9,577 9,705 9,984 10,283 10,565 10,835 11,206 11,700 % Ch 3.6% -25.9% -27.6% 89.2% -28.7% 5.5% 12.0% 12.5% 11.4% 10.6% 14.4% 18.8% U.S. (Millions) 0.925 0.985 1.030 1.063 0.995 1.103 1.171 1.216 1.238 1.274 1.320 1.399 % Ch -33.7% 28.8% 19.2% 13.4% -23.0% 50.6% 27.0% 16.4% 7.5% 11.9% 15.3% 26.2%
TOTAL NONFARM EMPLOYMENT Idaho 651,481 654,203 655,834 661,989 665,701 669,366 673,376 677,372 681,789 685,670 689,300 692,779 % Ch 4.6% 1.7% 1.0% 3.8% 2.3% 2.2% 2.4% 2.4% 2.6% 2.3% 2.1% 2.0% U.S. (Thousands) 137,842 138,638 139,381 140,232 141,011 141,674 142,292 142,775 143,278 143,801 144,227 144,723 % Ch 1.6% 2.3% 2.2% 2.5% 2.2% 1.9% 1.8% 1.4% 1.4% 1.5% 1.2% 1.4%
SELECTED INTEREST RATES Federal Funds 0.1% 0.1% 0.1% 0.1% 0.1% 0.1% 0.3% 0.5% 0.8% 1.0% 1.3% 1.7% Bank Prime 3.3% 3.3% 3.3% 3.3% 3.3% 3.3% 3.3% 3.5% 3.8% 4.0% 4.3% 4.7% Existing Home Mortgage 4.5% 4.3% 4.2% 4.2% 4.0% 4.1% 4.3% 4.4% 4.7% 4.9% 5.2% 5.3%
INFLATION GDP Price Deflator 1.3% 2.1% 1.4% 0.1% 0.7% 1.6% 1.9% 1.9% 1.8% 2.1% 1.9% 2.0% Personal Cons Deflator 1.4% 2.3% 1.2% -0.4% -1.8% -0.3% 1.3% 2.0% 1.2% 2.1% 2.1% 2.1% Consumer Price Index 2.1% 2.4% 1.2% -0.9% -3.1% -0.5% 1.7% 2.8% 1.4% 2.8% 2.7% 2.7%
2016
IDAHO ECONOMIC FORECAST
EXECUTIVE SUMMARY
APRIL 2015
20152014
National Variables Forecast by IHS EconomicsForecast Begins the FIRST Quarter of 2015
7
8
NATIONAL FORECAST DESCRIPTION
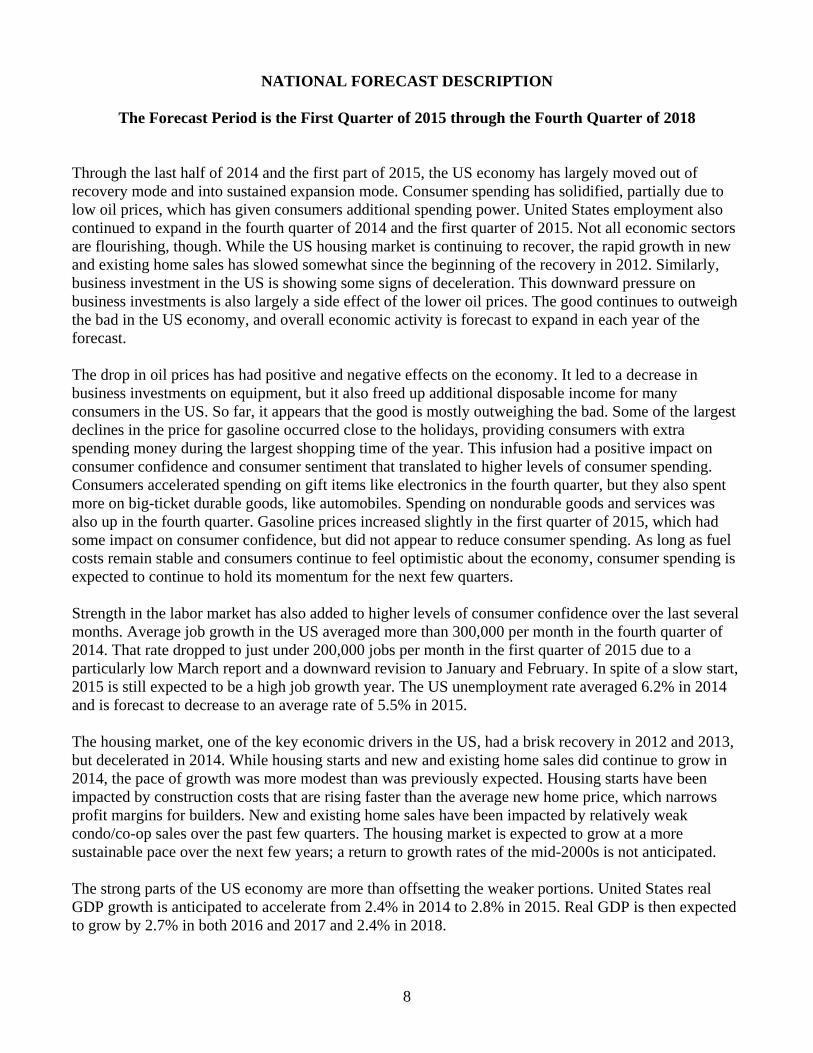
The Forecast Period is the First Quarter of 2015 through the Fourth Quarter of 2018 Through the last half of 2014 and the first part of 2015, the US economy has largely moved out of recovery mode and into sustained expansion mode. Consumer spending has solidified, partially due to low oil prices, which has given consumers additional spending power. United States employment also continued to expand in the fourth quarter of 2014 and the first quarter of 2015. Not all economic sectors are flourishing, though. While the US housing market is continuing to recover, the rapid growth in new and existing home sales has slowed somewhat since the beginning of the recovery in 2012. Similarly, business investment in the US is showing some signs of deceleration. This downward pressure on business investments is also largely a side effect of the lower oil prices. The good continues to outweigh the bad in the US economy, and overall economic activity is forecast to expand in each year of the forecast. The drop in oil prices has had positive and negative effects on the economy. It led to a decrease in business investments on equipment, but it also freed up additional disposable income for many consumers in the US. So far, it appears that the good is mostly outweighing the bad. Some of the largest declines in the price for gasoline occurred close to the holidays, providing consumers with extra spending money during the largest shopping time of the year. This infusion had a positive impact on consumer confidence and consumer sentiment that translated to higher levels of consumer spending. Consumers accelerated spending on gift items like electronics in the fourth quarter, but they also spent more on big-ticket durable goods, like automobiles. Spending on nondurable goods and services was also up in the fourth quarter. Gasoline prices increased slightly in the first quarter of 2015, which had some impact on consumer confidence, but did not appear to reduce consumer spending. As long as fuel costs remain stable and consumers continue to feel optimistic about the economy, consumer spending is expected to continue to hold its momentum for the next few quarters. Strength in the labor market has also added to higher levels of consumer confidence over the last several months. Average job growth in the US averaged more than 300,000 per month in the fourth quarter of 2014. That rate dropped to just under 200,000 jobs per month in the first quarter of 2015 due to a particularly low March report and a downward revision to January and February. In spite of a slow start, 2015 is still expected to be a high job growth year. The US unemployment rate averaged 6.2% in 2014 and is forecast to decrease to an average rate of 5.5% in 2015. The housing market, one of the key economic drivers in the US, had a brisk recovery in 2012 and 2013, but decelerated in 2014. While housing starts and new and existing home sales did continue to grow in 2014, the pace of growth was more modest than was previously expected. Housing starts have been impacted by construction costs that are rising faster than the average new home price, which narrows profit margins for builders. New and existing home sales have been impacted by relatively weak condo/co-op sales over the past few quarters. The housing market is expected to grow at a more sustainable pace over the next few years; a return to growth rates of the mid-2000s is not anticipated. The strong parts of the US economy are more than offsetting the weaker portions. United States real GDP growth is anticipated to accelerate from 2.4% in 2014 to 2.8% in 2015. Real GDP is then expected to grow by 2.7% in both 2016 and 2017 and 2.4% in 2018.
9
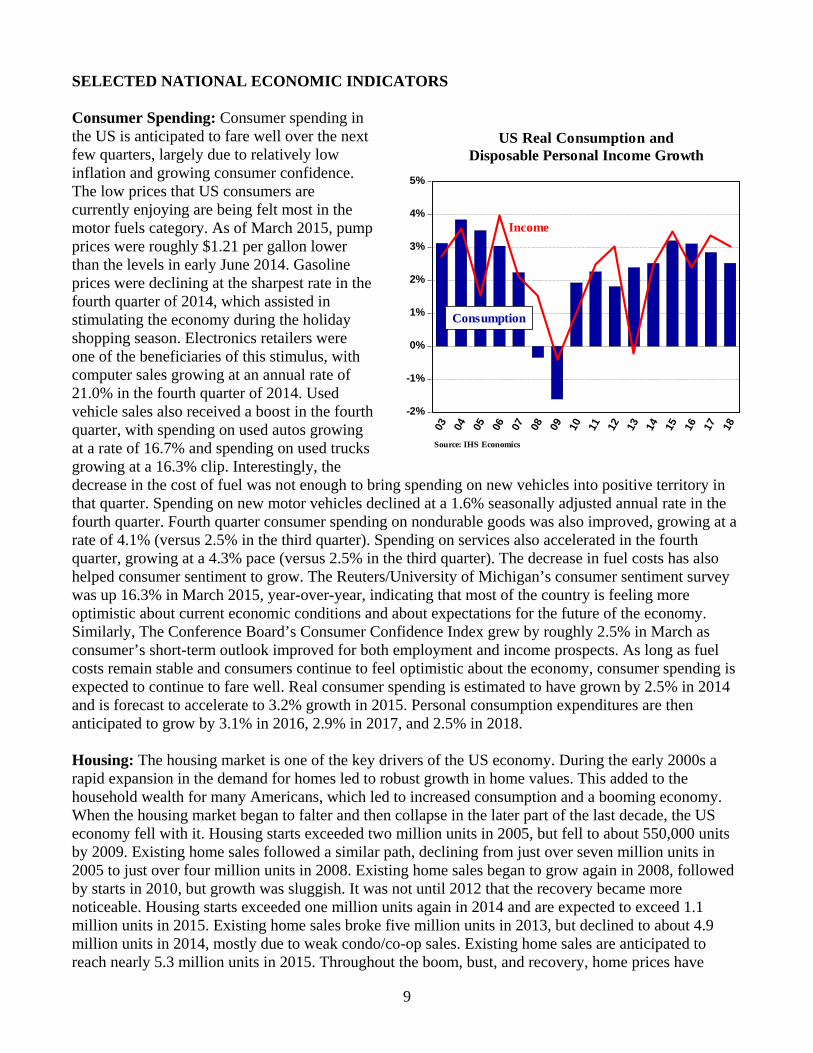
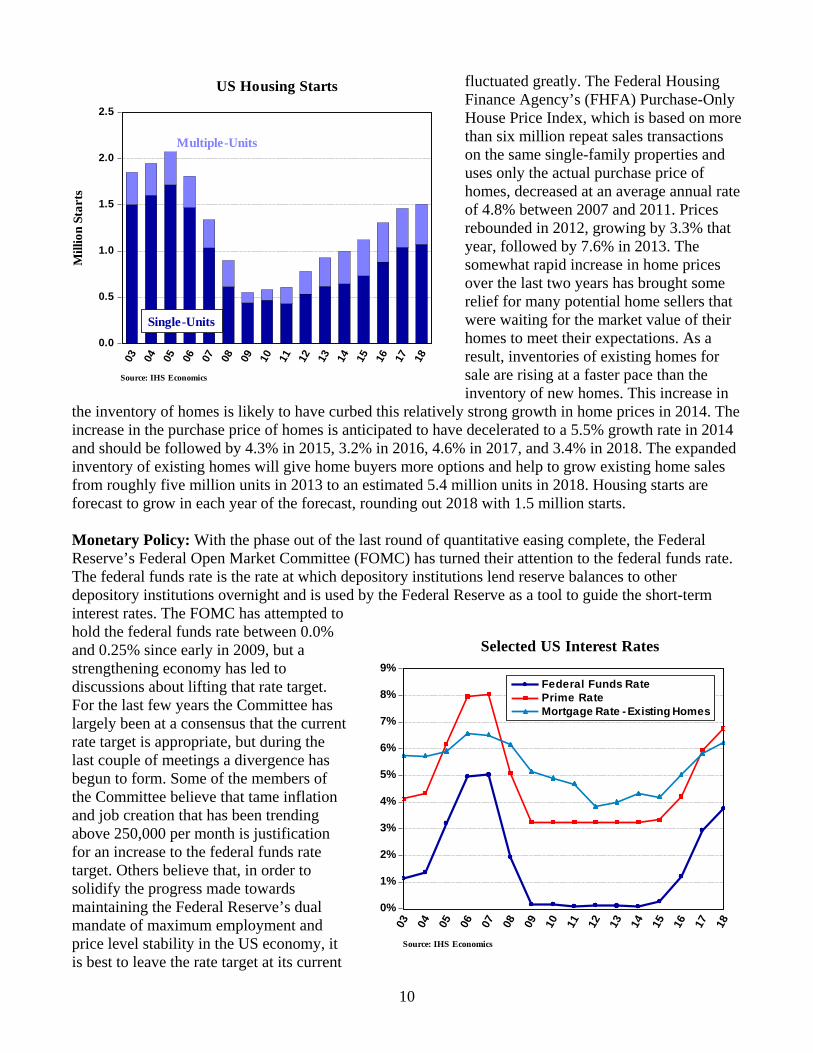
SELECTED NATIONAL ECONOMIC INDICATORS Consumer Spending: Consumer spending in the US is anticipated to fare well over the next few quarters, largely due to relatively low inflation and growing consumer confidence. The low prices that US consumers are currently enjoying are being felt most in the motor fuels category. As of March 2015, pump prices were roughly $1.21 per gallon lower than the levels in early June 2014. Gasoline prices were declining at the sharpest rate in the fourth quarter of 2014, which assisted in stimulating the economy during the holiday shopping season. Electronics retailers were one of the beneficiaries of this stimulus, with computer sales growing at an annual rate of 21.0% in the fourth quarter of 2014. Used vehicle sales also received a boost in the fourth quarter, with spending on used autos growing at a rate of 16.7% and spending on used trucks growing at a 16.3% clip. Interestingly, the decrease in the cost of fuel was not enough to bring spending on new vehicles into positive territory in that quarter. Spending on new motor vehicles declined at a 1.6% seasonally adjusted annual rate in the fourth quarter. Fourth quarter consumer spending on nondurable goods was also improved, growing at a rate of 4.1% (versus 2.5% in the third quarter). Spending on services also accelerated in the fourth quarter, growing at a 4.3% pace (versus 2.5% in the third quarter). The decrease in fuel costs has also helped consumer sentiment to grow. The Reuters/University of Michigan’s consumer sentiment survey was up 16.3% in March 2015, year-over-year, indicating that most of the country is feeling more optimistic about current economic conditions and about expectations for the future of the economy. Similarly, The Conference Board’s Consumer Confidence Index grew by roughly 2.5% in March as consumer’s short-term outlook improved for both employment and income prospects. As long as fuel costs remain stable and consumers continue to feel optimistic about the economy, consumer spending is expected to continue to fare well. Real consumer spending is estimated to have grown by 2.5% in 2014 and is forecast to accelerate to 3.2% growth in 2015. Personal consumption expenditures are then anticipated to grow by 3.1% in 2016, 2.9% in 2017, and 2.5% in 2018. Housing: The housing market is one of the key drivers of the US economy. During the early 2000s a rapid expansion in the demand for homes led to robust growth in home values. This added to the household wealth for many Americans, which led to increased consumption and a booming economy. When the housing market began to falter and then collapse in the later part of the last decade, the US economy fell with it. Housing starts exceeded two million units in 2005, but fell to about 550,000 units by 2009. Existing home sales followed a similar path, declining from just over seven million units in 2005 to just over four million units in 2008. Existing home sales began to grow again in 2008, followed by starts in 2010, but growth was sluggish. It was not until 2012 that the recovery became more noticeable. Housing starts exceeded one million units again in 2014 and are expected to exceed 1.1 million units in 2015. Existing home sales broke five million units in 2013, but declined to about 4.9 million units in 2014, mostly due to weak condo/co-op sales. Existing home sales are anticipated to reach nearly 5.3 million units in 2015. Throughout the boom, bust, and recovery, home prices have
-2%
-1%
0%
1%
2%
3%
4%
5%
03 04 05 06 07 08 09 10 11 12 13 14 15 16 17 18
US Real Consumption andDisposable Personal Income Growth
Consumption
Income
Source: IHS Economics
10
fluctuated greatly. The Federal Housing Finance Agency’s (FHFA) Purchase-Only House Price Index, which is based on more than six million repeat sales transactions on the same single-family properties and uses only the actual purchase price of homes, decreased at an average annual rate of 4.8% between 2007 and 2011. Prices rebounded in 2012, growing by 3.3% that year, followed by 7.6% in 2013. The somewhat rapid increase in home prices over the last two years has brought some relief for many potential home sellers that were waiting for the market value of their homes to meet their expectations. As a result, inventories of existing homes for sale are rising at a faster pace than the inventory of new homes. This increase in
the inventory of homes is likely to have curbed this relatively strong growth in home prices in 2014. The increase in the purchase price of homes is anticipated to have decelerated to a 5.5% growth rate in 2014 and should be followed by 4.3% in 2015, 3.2% in 2016, 4.6% in 2017, and 3.4% in 2018. The expanded inventory of existing homes will give home buyers more options and help to grow existing home sales from roughly five million units in 2013 to an estimated 5.4 million units in 2018. Housing starts are forecast to grow in each year of the forecast, rounding out 2018 with 1.5 million starts. Monetary Policy: With the phase out of the last round of quantitative easing complete, the Federal Reserve’s Federal Open Market Committee (FOMC) has turned their attention to the federal funds rate. The federal funds rate is the rate at which depository institutions lend reserve balances to other depository institutions overnight and is used by the Federal Reserve as a tool to guide the short-term interest rates. The FOMC has attempted to hold the federal funds rate between 0.0% and 0.25% since early in 2009, but a strengthening economy has led to discussions about lifting that rate target. For the last few years the Committee has largely been at a consensus that the current rate target is appropriate, but during the last couple of meetings a divergence has begun to form. Some of the members of the Committee believe that tame inflation and job creation that has been trending above 250,000 per month is justification for an increase to the federal funds rate target. Others believe that, in order to solidify the progress made towards maintaining the Federal Reserve’s dual mandate of maximum employment and price level stability in the US economy, it is best to leave the rate target at its current
0.0
0.5
1.0
1.5
2.0
2.5
03 04 05 06 07 08 09 10 11 12 13 14 15 16 17 18
US Housing Starts
Source: IHS Economics
Mill
ion
Star
ts
Single-Units
Multiple-Units
0%
1%
2%
3%
4%
5%
6%
7%
8%
9%
03 04 05 06 07 08 09 10 11 12 13 14 15 16 17 18
Federal Funds RatePrime RateMortgage Rate - Existing Homes
Selected US Interest Rates
Source: IHS Economics
11
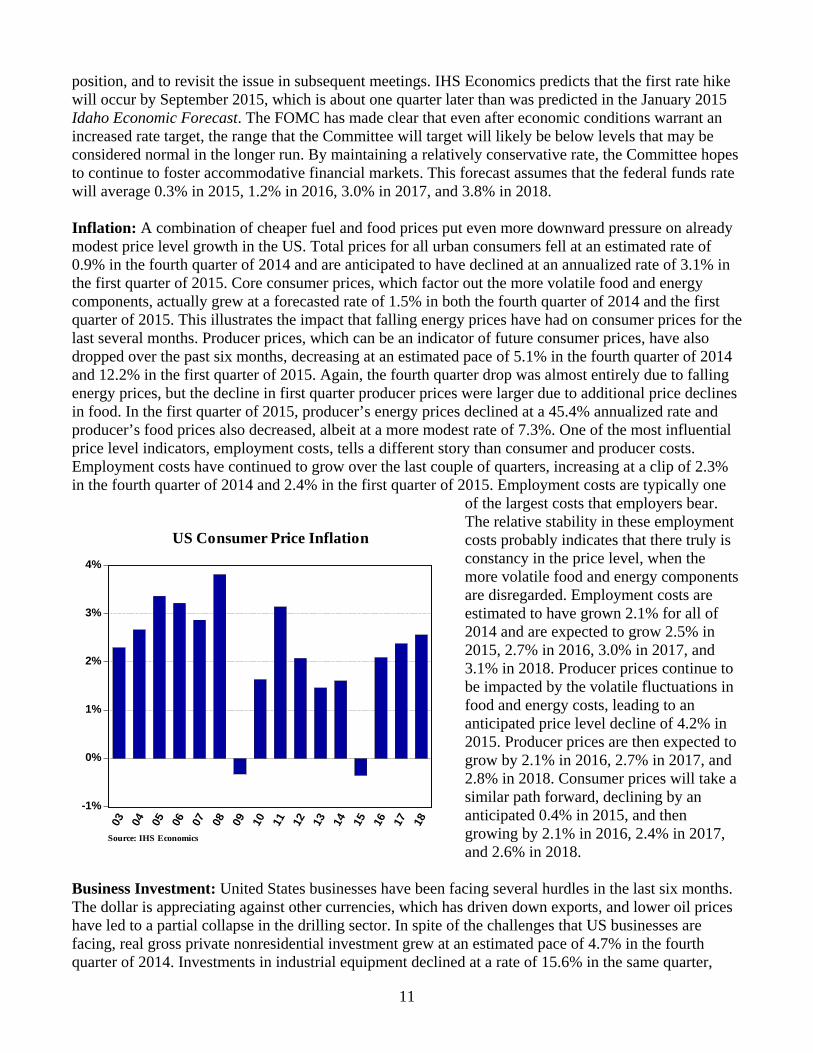
position, and to revisit the issue in subsequent meetings. IHS Economics predicts that the first rate hike will occur by September 2015, which is about one quarter later than was predicted in the January 2015 Idaho Economic Forecast. The FOMC has made clear that even after economic conditions warrant an increased rate target, the range that the Committee will target will likely be below levels that may be considered normal in the longer run. By maintaining a relatively conservative rate, the Committee hopes to continue to foster accommodative financial markets. This forecast assumes that the federal funds rate will average 0.3% in 2015, 1.2% in 2016, 3.0% in 2017, and 3.8% in 2018. Inflation: A combination of cheaper fuel and food prices put even more downward pressure on already modest price level growth in the US. Total prices for all urban consumers fell at an estimated rate of 0.9% in the fourth quarter of 2014 and are anticipated to have declined at an annualized rate of 3.1% in the first quarter of 2015. Core consumer prices, which factor out the more volatile food and energy components, actually grew at a forecasted rate of 1.5% in both the fourth quarter of 2014 and the first quarter of 2015. This illustrates the impact that falling energy prices have had on consumer prices for the last several months. Producer prices, which can be an indicator of future consumer prices, have also dropped over the past six months, decreasing at an estimated pace of 5.1% in the fourth quarter of 2014 and 12.2% in the first quarter of 2015. Again, the fourth quarter drop was almost entirely due to falling energy prices, but the decline in first quarter producer prices were larger due to additional price declines in food. In the first quarter of 2015, producer’s energy prices declined at a 45.4% annualized rate and producer’s food prices also decreased, albeit at a more modest rate of 7.3%. One of the most influential price level indicators, employment costs, tells a different story than consumer and producer costs. Employment costs have continued to grow over the last couple of quarters, increasing at a clip of 2.3% in the fourth quarter of 2014 and 2.4% in the first quarter of 2015. Employment costs are typically one
of the largest costs that employers bear. The relative stability in these employment costs probably indicates that there truly is constancy in the price level, when the more volatile food and energy components are disregarded. Employment costs are estimated to have grown 2.1% for all of 2014 and are expected to grow 2.5% in 2015, 2.7% in 2016, 3.0% in 2017, and 3.1% in 2018. Producer prices continue to be impacted by the volatile fluctuations in food and energy costs, leading to an anticipated price level decline of 4.2% in 2015. Producer prices are then expected to grow by 2.1% in 2016, 2.7% in 2017, and 2.8% in 2018. Consumer prices will take a similar path forward, declining by an anticipated 0.4% in 2015, and then growing by 2.1% in 2016, 2.4% in 2017, and 2.6% in 2018.
Business Investment: United States businesses have been facing several hurdles in the last six months. The dollar is appreciating against other currencies, which has driven down exports, and lower oil prices have led to a partial collapse in the drilling sector. In spite of the challenges that US businesses are facing, real gross private nonresidential investment grew at an estimated pace of 4.7% in the fourth quarter of 2014. Investments in industrial equipment declined at a rate of 15.6% in the same quarter,
-1%
0%
1%
2%
3%
4%
03 04 05 06 07 08 09 10 11 12 13 14 15 16 17 18
US Consumer Price Inflation
Source: IHS Economics
12
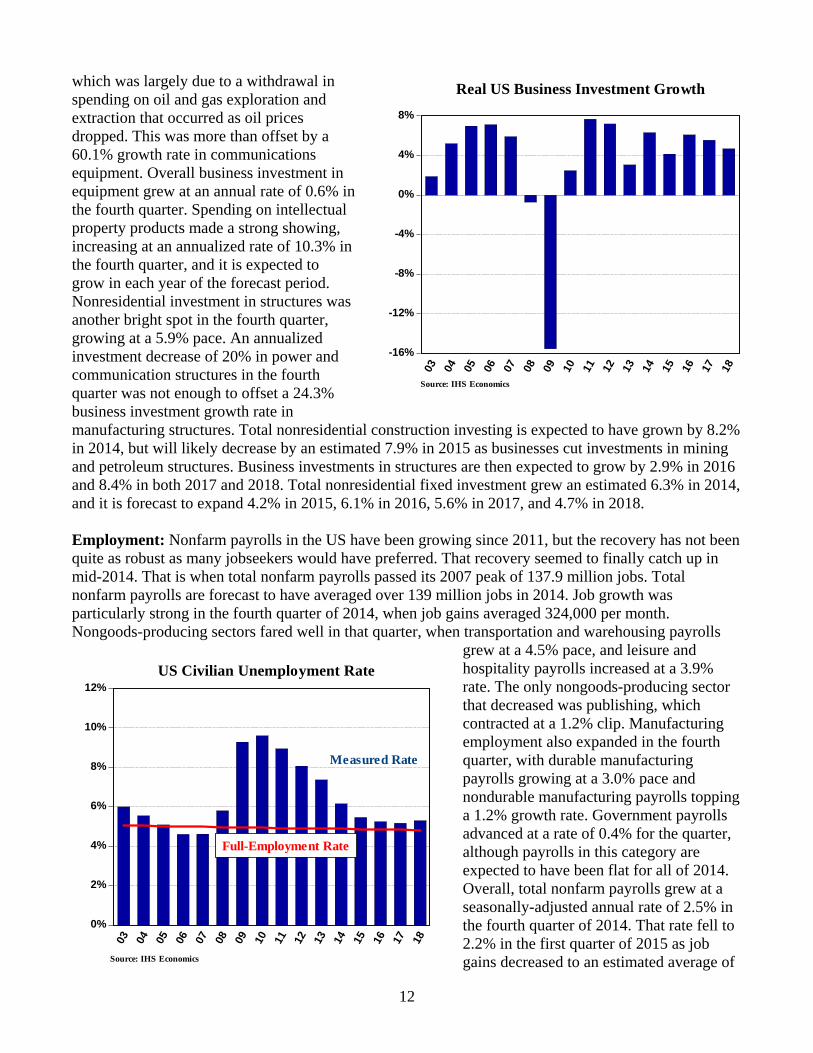
which was largely due to a withdrawal in spending on oil and gas exploration and extraction that occurred as oil prices dropped. This was more than offset by a 60.1% growth rate in communications equipment. Overall business investment in equipment grew at an annual rate of 0.6% in the fourth quarter. Spending on intellectual property products made a strong showing, increasing at an annualized rate of 10.3% in the fourth quarter, and it is expected to grow in each year of the forecast period. Nonresidential investment in structures was another bright spot in the fourth quarter, growing at a 5.9% pace. An annualized investment decrease of 20% in power and communication structures in the fourth quarter was not enough to offset a 24.3% business investment growth rate in manufacturing structures. Total nonresidential construction investing is expected to have grown by 8.2% in 2014, but will likely decrease by an estimated 7.9% in 2015 as businesses cut investments in mining and petroleum structures. Business investments in structures are then expected to grow by 2.9% in 2016 and 8.4% in both 2017 and 2018. Total nonresidential fixed investment grew an estimated 6.3% in 2014, and it is forecast to expand 4.2% in 2015, 6.1% in 2016, 5.6% in 2017, and 4.7% in 2018. Employment: Nonfarm payrolls in the US have been growing since 2011, but the recovery has not been quite as robust as many jobseekers would have preferred. That recovery seemed to finally catch up in mid-2014. That is when total nonfarm payrolls passed its 2007 peak of 137.9 million jobs. Total nonfarm payrolls are forecast to have averaged over 139 million jobs in 2014. Job growth was particularly strong in the fourth quarter of 2014, when job gains averaged 324,000 per month. Nongoods-producing sectors fared well in that quarter, when transportation and warehousing payrolls
grew at a 4.5% pace, and leisure and hospitality payrolls increased at a 3.9% rate. The only nongoods-producing sector that decreased was publishing, which contracted at a 1.2% clip. Manufacturing employment also expanded in the fourth quarter, with durable manufacturing payrolls growing at a 3.0% pace and nondurable manufacturing payrolls topping a 1.2% growth rate. Government payrolls advanced at a rate of 0.4% for the quarter, although payrolls in this category are expected to have been flat for all of 2014. Overall, total nonfarm payrolls grew at a seasonally-adjusted annual rate of 2.5% in the fourth quarter of 2014. That rate fell to 2.2% in the first quarter of 2015 as job gains decreased to an estimated average of
-16%
-12%
-8%
-4%
0%
4%
8%
03 04 05 06 07 08 09 10 11 12 13 14 15 16 17 18
Real US Business Investment Growth
Source: IHS Economics
0%
2%
4%
6%
8%
10%
12%
03 04 05 06 07 08 09 10 11 12 13 14 15 16 17 18
US Civilian Unemployment Rate
Full-Employment Rate
Measured Rate
Source: IHS Economics
13
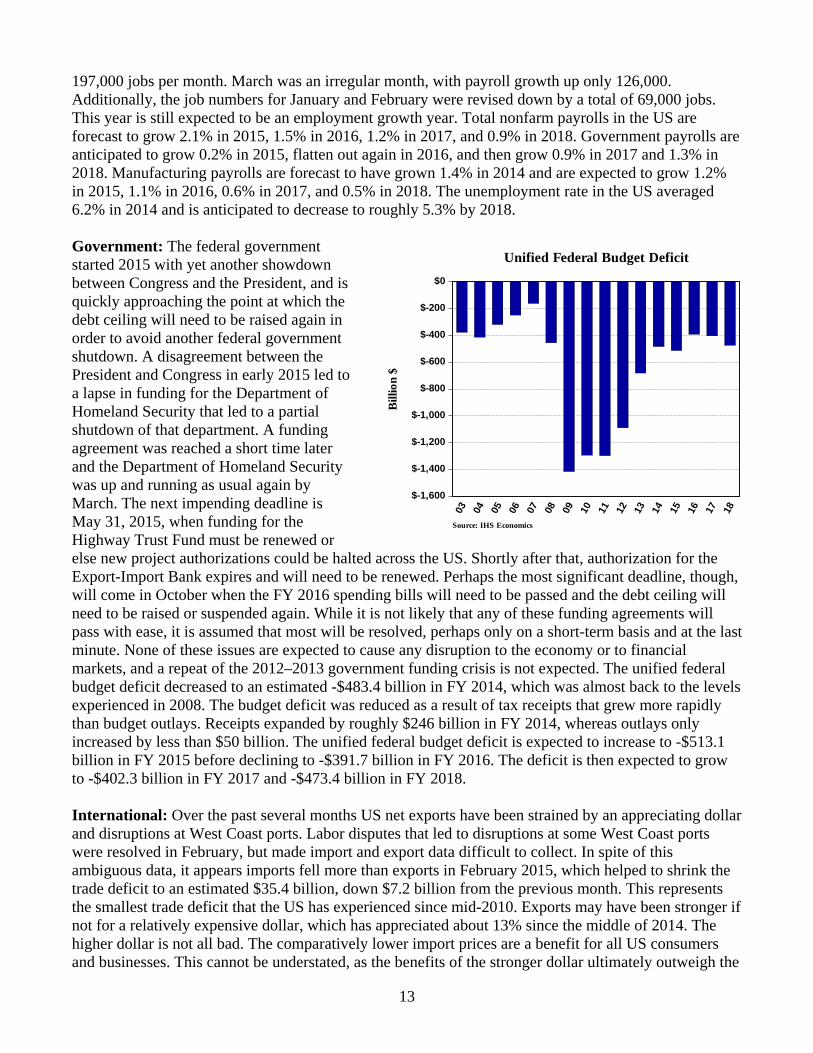
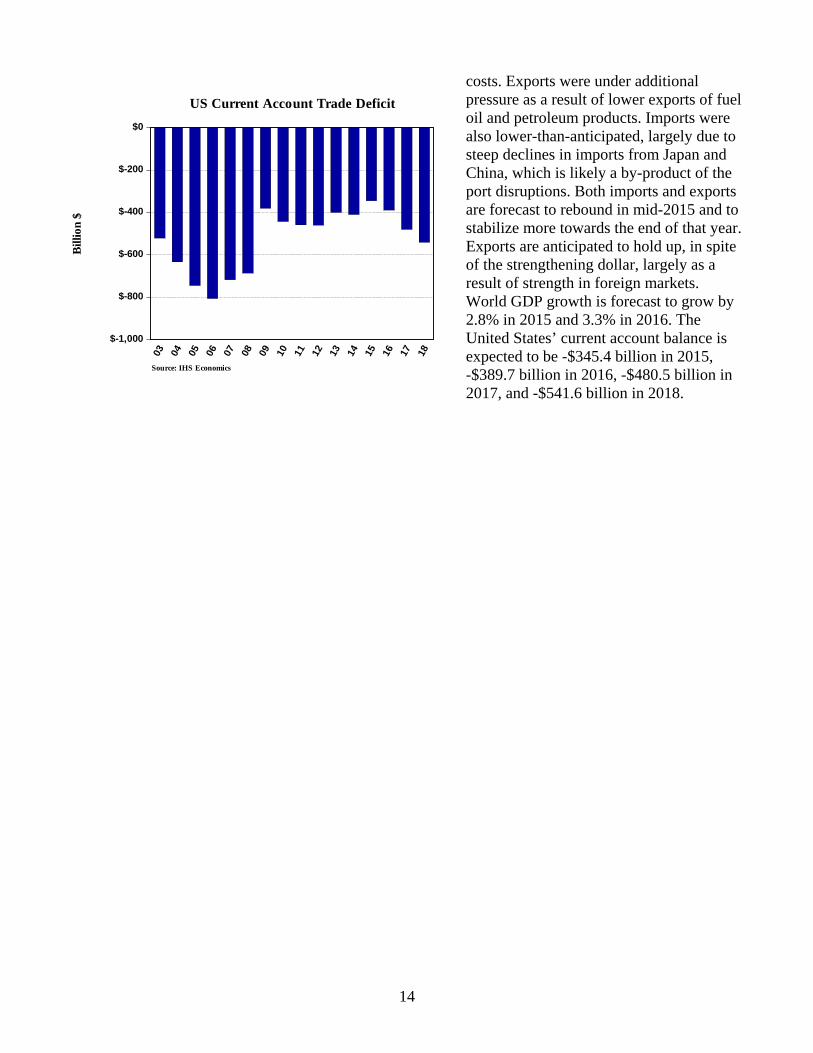
197,000 jobs per month. March was an irregular month, with payroll growth up only 126,000. Additionally, the job numbers for January and February were revised down by a total of 69,000 jobs. This year is still expected to be an employment growth year. Total nonfarm payrolls in the US are forecast to grow 2.1% in 2015, 1.5% in 2016, 1.2% in 2017, and 0.9% in 2018. Government payrolls are anticipated to grow 0.2% in 2015, flatten out again in 2016, and then grow 0.9% in 2017 and 1.3% in 2018. Manufacturing payrolls are forecast to have grown 1.4% in 2014 and are expected to grow 1.2% in 2015, 1.1% in 2016, 0.6% in 2017, and 0.5% in 2018. The unemployment rate in the US averaged 6.2% in 2014 and is anticipated to decrease to roughly 5.3% by 2018. Government: The federal government started 2015 with yet another showdown between Congress and the President, and is quickly approaching the point at which the debt ceiling will need to be raised again in order to avoid another federal government shutdown. A disagreement between the President and Congress in early 2015 led to a lapse in funding for the Department of Homeland Security that led to a partial shutdown of that department. A funding agreement was reached a short time later and the Department of Homeland Security was up and running as usual again by March. The next impending deadline is May 31, 2015, when funding for the Highway Trust Fund must be renewed or else new project authorizations could be halted across the US. Shortly after that, authorization for the Export-Import Bank expires and will need to be renewed. Perhaps the most significant deadline, though, will come in October when the FY 2016 spending bills will need to be passed and the debt ceiling will need to be raised or suspended again. While it is not likely that any of these funding agreements will pass with ease, it is assumed that most will be resolved, perhaps only on a short-term basis and at the last minute. None of these issues are expected to cause any disruption to the economy or to financial markets, and a repeat of the 2012–2013 government funding crisis is not expected. The unified federal budget deficit decreased to an estimated -$483.4 billion in FY 2014, which was almost back to the levels experienced in 2008. The budget deficit was reduced as a result of tax receipts that grew more rapidly than budget outlays. Receipts expanded by roughly $246 billion in FY 2014, whereas outlays only increased by less than $50 billion. The unified federal budget deficit is expected to increase to -$513.1 billion in FY 2015 before declining to -$391.7 billion in FY 2016. The deficit is then expected to grow to -$402.3 billion in FY 2017 and -$473.4 billion in FY 2018. International: Over the past several months US net exports have been strained by an appreciating dollar and disruptions at West Coast ports. Labor disputes that led to disruptions at some West Coast ports were resolved in February, but made import and export data difficult to collect. In spite of this ambiguous data, it appears imports fell more than exports in February 2015, which helped to shrink the trade deficit to an estimated $35.4 billion, down $7.2 billion from the previous month. This represents the smallest trade deficit that the US has experienced since mid-2010. Exports may have been stronger if not for a relatively expensive dollar, which has appreciated about 13% since the middle of 2014. The higher dollar is not all bad. The comparatively lower import prices are a benefit for all US consumers and businesses. This cannot be understated, as the benefits of the stronger dollar ultimately outweigh the
$-1,600
$-1,400
$-1,200
$-1,000
$-800
$-600
$-400
$-200
$0
03 04 05 06 07 08 09 10 11 12 13 14 15 16 17 18
Unified Federal Budget Deficit
Bill
ion
$
Source: IHS Economics
14
costs. Exports were under additional pressure as a result of lower exports of fuel oil and petroleum products. Imports were also lower-than-anticipated, largely due to steep declines in imports from Japan and China, which is likely a by-product of the port disruptions. Both imports and exports are forecast to rebound in mid-2015 and to stabilize more towards the end of that year. Exports are anticipated to hold up, in spite of the strengthening dollar, largely as a result of strength in foreign markets. World GDP growth is forecast to grow by 2.8% in 2015 and 3.3% in 2016. The United States’ current account balance is expected to be -$345.4 billion in 2015, -$389.7 billion in 2016, -$480.5 billion in 2017, and -$541.6 billion in 2018.
$-1,000
$-800
$-600
$-400
$-200
$0
03 04 05 06 07 08 09 10 11 12 13 14 15 16 17 18
US Current Account Trade Deficit
Bill
ion
$
Source: IHS Economics
15
IDAHO FORECAST DESCRIPTION
The Forecast Period is the First Quarter of 2015 through the Fourth Quarter of 2018
Idaho’s economy was a beneficiary of the economic expansion that preceded the 2007–2009 recession, but Idaho also took a disproportionately large hit during the recession and in the slow recovery. Fortunately, the state’s economy is back in expansion mode. Nonfarm employment in the state has surpassed the prerecession levels and income growth is beginning to show more sustained growth. Growth in the housing market has slowed over the last year but appears to still be moving forward on a sustainable trajectory. Nonfarm employment in the state exceeded 650,000 in 2007, before the effects of the recession began to take hold. By 2010 that number had decreased by more than 50,000, with the bulk of the job loss coming from the goods-producing sectors, such as construction and computer manufacturing. Even though the recession officially ended in 2009, the recovery was slow between 2009 and 2012. Nonfarm employment began to show more promising signs of growth again in 2013, and by the fourth quarter of 2014 seasonally-adjusted nonfarm payrolls broke their prerecession levels. The decrease in nonfarm employment during the recession led to an oversupply of labor in the state that had a cooling effect on wages and income. The average annual wage growth in Idaho slipped beneath 1.0% in 2008 and 2009. Idaho personal income, adjusted for inflation, contracted in both 2008 and 2009 before growing once again in 2010. As employment has come back in line with the prerecession levels, wages have begun to rise again, and are expected to continue to increase at an average annual rate of 3.1% through 2018. One of the leading causes of the recession, the housing market, was also the engine that sputtered back to life in 2012 and put the US back into expansion mode. Idaho’s housing market followed a similar pattern. When the housing market began to show more vitality in 2012, forecasts indicated that there would be strong growth in housing starts that would last for several years before the market would begin to equalize at a more sustainable level of growth. It now appears that the majority of the accelerated growth occurred in 2012 and 2013, and that equalization likely occurred in 2014. The slowing in housing starts growth was due to a combination of factors. First, the inventory of existing homes increased as home prices began to rebound. Second, sluggish new household formations, an important driver of housing starts, undercut housing demand. Third, increased builder’s costs led to higher prices for new homes, sending some buyers looking for alternatives to new home construction, such as rentals. Total Idaho housing starts are still expected to grow, year-over-year, but the growth will be less robust than was previously expected. The deceleration in Idaho housing starts is not expected to derail the economic expansion that the state is currently experiencing. Nonfarm payrolls in the state grew at an estimated pace of 2.8% in 2014 and are forecast to grow by 2.4% in both 2015 and 2016, and 2.2% in both 2017 and 2018. Higher employment in the state is expected to put some upward pressure on wages over the next few years, and this should propel Idaho personal income. Real personal income is anticipated to grow 3.0% in 2015, 2.4% in 2016, 3.1% in 2017, and 2.9% in 2018.
16
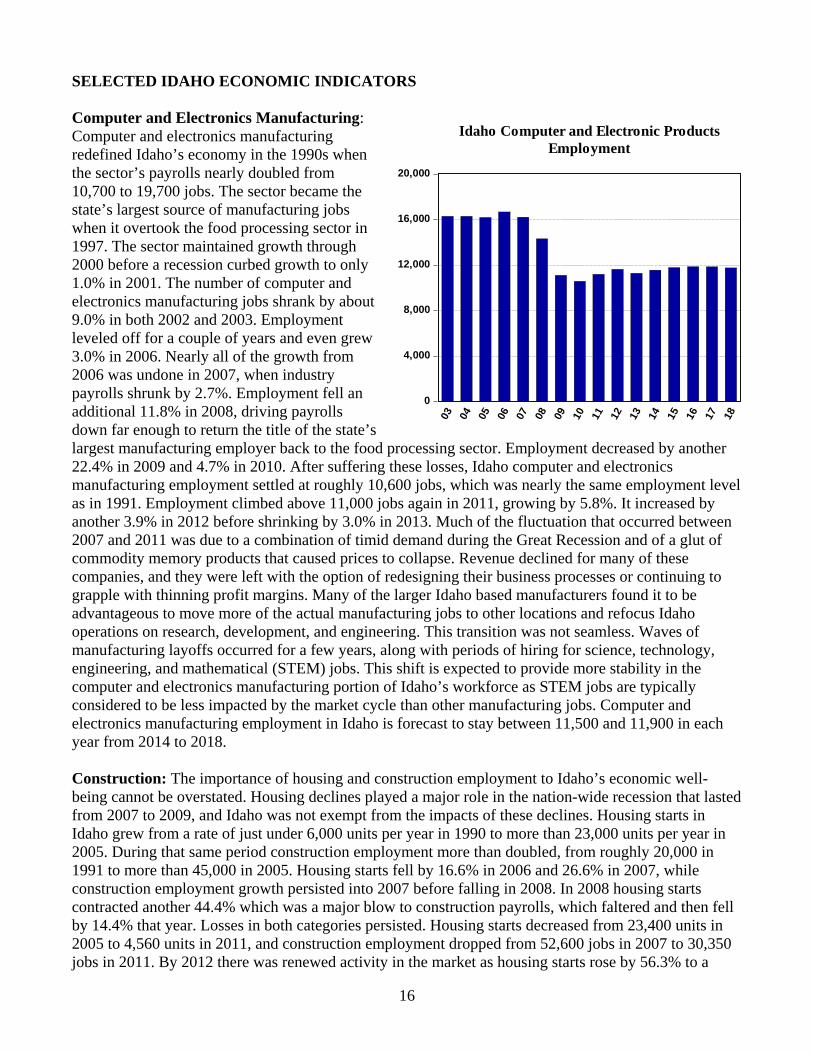
SELECTED IDAHO ECONOMIC INDICATORS Computer and Electronics Manufacturing: Computer and electronics manufacturing redefined Idaho’s economy in the 1990s when the sector’s payrolls nearly doubled from 10,700 to 19,700 jobs. The sector became the state’s largest source of manufacturing jobs when it overtook the food processing sector in 1997. The sector maintained growth through 2000 before a recession curbed growth to only 1.0% in 2001. The number of computer and electronics manufacturing jobs shrank by about 9.0% in both 2002 and 2003. Employment leveled off for a couple of years and even grew 3.0% in 2006. Nearly all of the growth from 2006 was undone in 2007, when industry payrolls shrunk by 2.7%. Employment fell an additional 11.8% in 2008, driving payrolls down far enough to return the title of the state’s largest manufacturing employer back to the food processing sector. Employment decreased by another 22.4% in 2009 and 4.7% in 2010. After suffering these losses, Idaho computer and electronics manufacturing employment settled at roughly 10,600 jobs, which was nearly the same employment level as in 1991. Employment climbed above 11,000 jobs again in 2011, growing by 5.8%. It increased by another 3.9% in 2012 before shrinking by 3.0% in 2013. Much of the fluctuation that occurred between 2007 and 2011 was due to a combination of timid demand during the Great Recession and of a glut of commodity memory products that caused prices to collapse. Revenue declined for many of these companies, and they were left with the option of redesigning their business processes or continuing to grapple with thinning profit margins. Many of the larger Idaho based manufacturers found it to be advantageous to move more of the actual manufacturing jobs to other locations and refocus Idaho operations on research, development, and engineering. This transition was not seamless. Waves of manufacturing layoffs occurred for a few years, along with periods of hiring for science, technology, engineering, and mathematical (STEM) jobs. This shift is expected to provide more stability in the computer and electronics manufacturing portion of Idaho’s workforce as STEM jobs are typically considered to be less impacted by the market cycle than other manufacturing jobs. Computer and electronics manufacturing employment in Idaho is forecast to stay between 11,500 and 11,900 in each year from 2014 to 2018. Construction: The importance of housing and construction employment to Idaho’s economic well-being cannot be overstated. Housing declines played a major role in the nation-wide recession that lasted from 2007 to 2009, and Idaho was not exempt from the impacts of these declines. Housing starts in Idaho grew from a rate of just under 6,000 units per year in 1990 to more than 23,000 units per year in 2005. During that same period construction employment more than doubled, from roughly 20,000 in 1991 to more than 45,000 in 2005. Housing starts fell by 16.6% in 2006 and 26.6% in 2007, while construction employment growth persisted into 2007 before falling in 2008. In 2008 housing starts contracted another 44.4% which was a major blow to construction payrolls, which faltered and then fell by 14.4% that year. Losses in both categories persisted. Housing starts decreased from 23,400 units in 2005 to 4,560 units in 2011, and construction employment dropped from 52,600 jobs in 2007 to 30,350 jobs in 2011. By 2012 there was renewed activity in the market as housing starts rose by 56.3% to a
0
4,000
8,000
12,000
16,000
20,000
03 04 05 06 07 08 09 10 11 12 13 14 15 16 17 18
Idaho Computer and Electronic ProductsEmployment
17
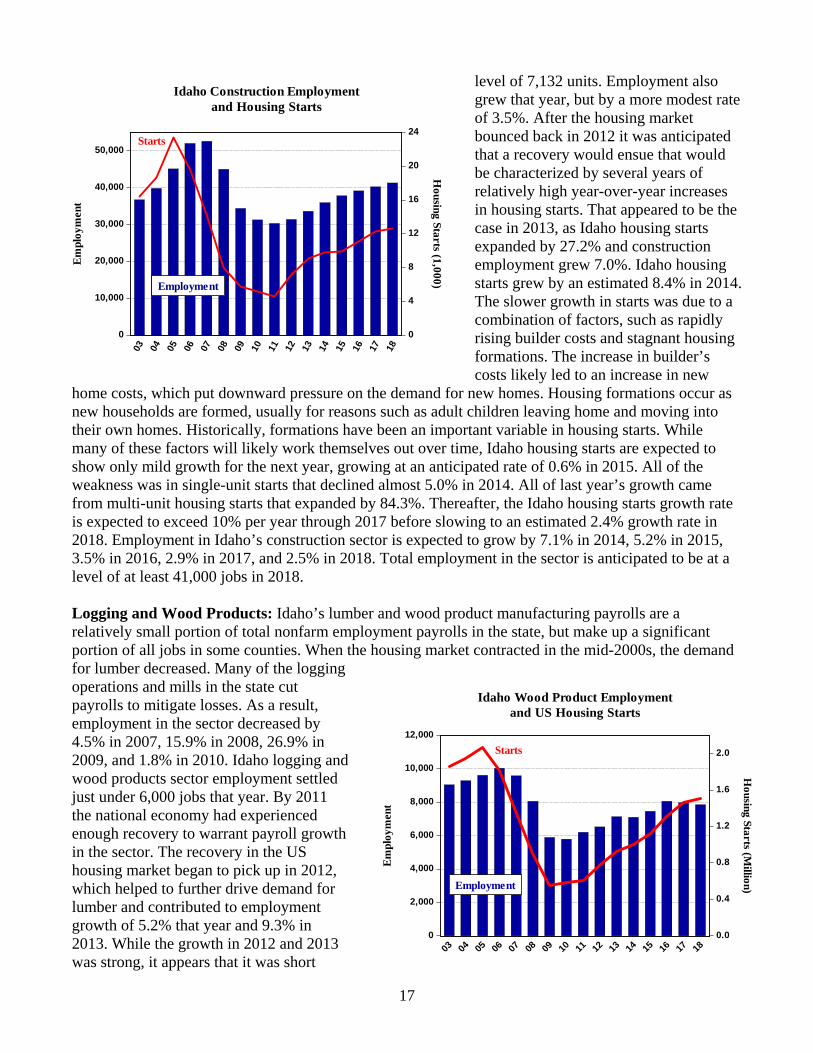
level of 7,132 units. Employment also grew that year, but by a more modest rate of 3.5%. After the housing market bounced back in 2012 it was anticipated that a recovery would ensue that would be characterized by several years of relatively high year-over-year increases in housing starts. That appeared to be the case in 2013, as Idaho housing starts expanded by 27.2% and construction employment grew 7.0%. Idaho housing starts grew by an estimated 8.4% in 2014. The slower growth in starts was due to a combination of factors, such as rapidly rising builder costs and stagnant housing formations. The increase in builder’s costs likely led to an increase in new
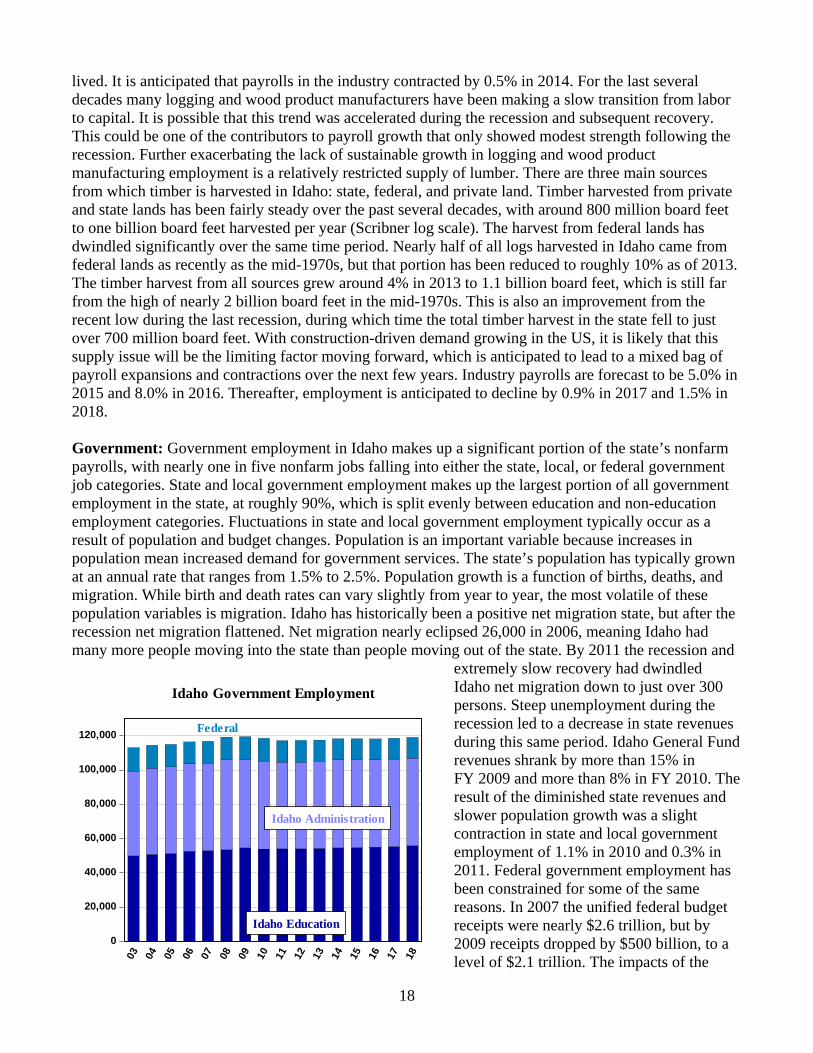
home costs, which put downward pressure on the demand for new homes. Housing formations occur as new households are formed, usually for reasons such as adult children leaving home and moving into their own homes. Historically, formations have been an important variable in housing starts. While many of these factors will likely work themselves out over time, Idaho housing starts are expected to show only mild growth for the next year, growing at an anticipated rate of 0.6% in 2015. All of the weakness was in single-unit starts that declined almost 5.0% in 2014. All of last year’s growth came from multi-unit housing starts that expanded by 84.3%. Thereafter, the Idaho housing starts growth rate is expected to exceed 10% per year through 2017 before slowing to an estimated 2.4% growth rate in 2018. Employment in Idaho’s construction sector is expected to grow by 7.1% in 2014, 5.2% in 2015, 3.5% in 2016, 2.9% in 2017, and 2.5% in 2018. Total employment in the sector is anticipated to be at a level of at least 41,000 jobs in 2018. Logging and Wood Products: Idaho’s lumber and wood product manufacturing payrolls are a relatively small portion of total nonfarm employment payrolls in the state, but make up a significant portion of all jobs in some counties. When the housing market contracted in the mid-2000s, the demand for lumber decreased. Many of the logging operations and mills in the state cut payrolls to mitigate losses. As a result, employment in the sector decreased by 4.5% in 2007, 15.9% in 2008, 26.9% in 2009, and 1.8% in 2010. Idaho logging and wood products sector employment settled just under 6,000 jobs that year. By 2011 the national economy had experienced enough recovery to warrant payroll growth in the sector. The recovery in the US housing market began to pick up in 2012, which helped to further drive demand for lumber and contributed to employment growth of 5.2% that year and 9.3% in 2013. While the growth in 2012 and 2013 was strong, it appears that it was short
0
10,000
20,000
30,000
40,000
50,000
0
4
8
12
16
20
2403 04 05 06 07 08 09 10 11 12 13 14 15 16 17 18
Idaho Construction Employmentand Housing Starts
Em
ploy
men
t
Housing Starts (1,000)Employment
Starts
0
2,000
4,000
6,000
8,000
10,000
12,000
0.0
0.4
0.8
1.2
1.6
2.0
03 04 05 06 07 08 09 10 11 12 13 14 15 16 17 18
Idaho Wood Product Employmentand US Housing Starts
Em
ploy
men
t
Housing Starts (M
illion)
Starts
Employment
18
lived. It is anticipated that payrolls in the industry contracted by 0.5% in 2014. For the last several decades many logging and wood product manufacturers have been making a slow transition from labor to capital. It is possible that this trend was accelerated during the recession and subsequent recovery. This could be one of the contributors to payroll growth that only showed modest strength following the recession. Further exacerbating the lack of sustainable growth in logging and wood product manufacturing employment is a relatively restricted supply of lumber. There are three main sources from which timber is harvested in Idaho: state, federal, and private land. Timber harvested from private and state lands has been fairly steady over the past several decades, with around 800 million board feet to one billion board feet harvested per year (Scribner log scale). The harvest from federal lands has dwindled significantly over the same time period. Nearly half of all logs harvested in Idaho came from federal lands as recently as the mid-1970s, but that portion has been reduced to roughly 10% as of 2013. The timber harvest from all sources grew around 4% in 2013 to 1.1 billion board feet, which is still far from the high of nearly 2 billion board feet in the mid-1970s. This is also an improvement from the recent low during the last recession, during which time the total timber harvest in the state fell to just over 700 million board feet. With construction-driven demand growing in the US, it is likely that this supply issue will be the limiting factor moving forward, which is anticipated to lead to a mixed bag of payroll expansions and contractions over the next few years. Industry payrolls are forecast to be 5.0% in 2015 and 8.0% in 2016. Thereafter, employment is anticipated to decline by 0.9% in 2017 and 1.5% in 2018. Government: Government employment in Idaho makes up a significant portion of the state’s nonfarm payrolls, with nearly one in five nonfarm jobs falling into either the state, local, or federal government job categories. State and local government employment makes up the largest portion of all government employment in the state, at roughly 90%, which is split evenly between education and non-education employment categories. Fluctuations in state and local government employment typically occur as a result of population and budget changes. Population is an important variable because increases in population mean increased demand for government services. The state’s population has typically grown at an annual rate that ranges from 1.5% to 2.5%. Population growth is a function of births, deaths, and migration. While birth and death rates can vary slightly from year to year, the most volatile of these population variables is migration. Idaho has historically been a positive net migration state, but after the recession net migration flattened. Net migration nearly eclipsed 26,000 in 2006, meaning Idaho had many more people moving into the state than people moving out of the state. By 2011 the recession and
extremely slow recovery had dwindled Idaho net migration down to just over 300 persons. Steep unemployment during the recession led to a decrease in state revenues during this same period. Idaho General Fund revenues shrank by more than 15% in FY 2009 and more than 8% in FY 2010. The result of the diminished state revenues and slower population growth was a slight contraction in state and local government employment of 1.1% in 2010 and 0.3% in 2011. Federal government employment has been constrained for some of the same reasons. In 2007 the unified federal budget receipts were nearly $2.6 trillion, but by 2009 receipts dropped by $500 billion, to a level of $2.1 trillion. The impacts of the
0
20,000
40,000
60,000
80,000
100,000
120,000
03 04 05 06 07 08 09 10 11 12 13 14 15 16 17 18
Idaho Government Employment
Idaho Education
Idaho Administration
Federal
19
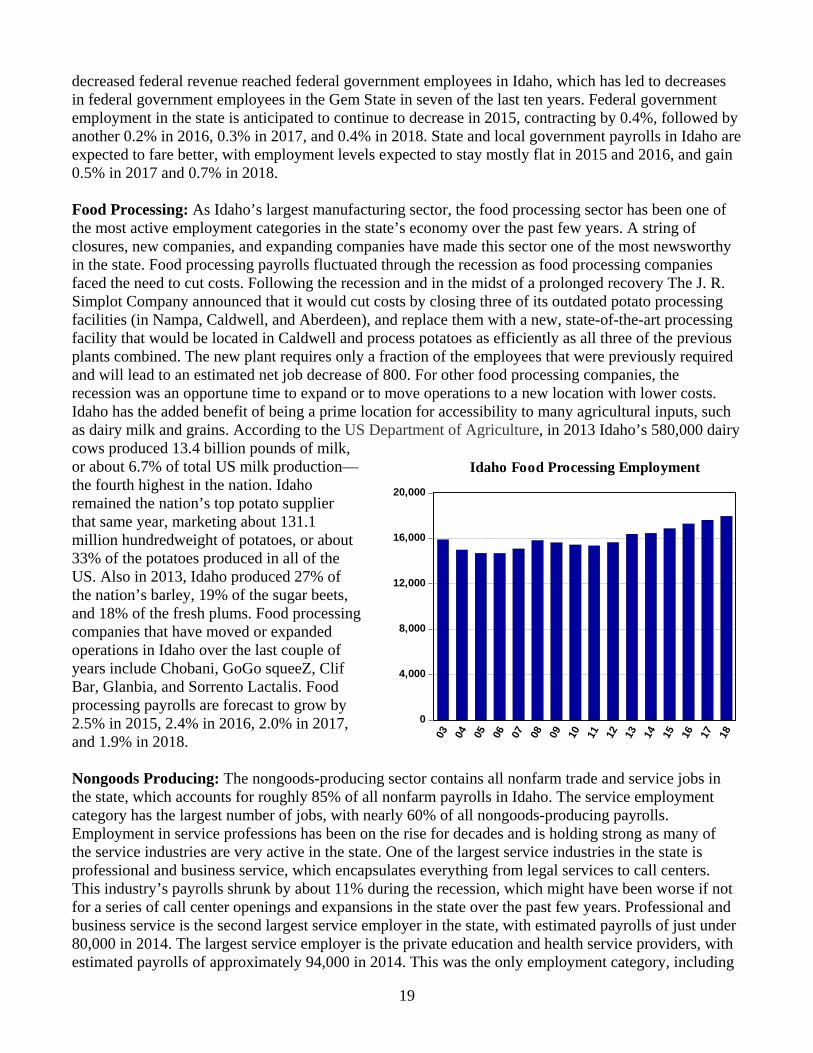
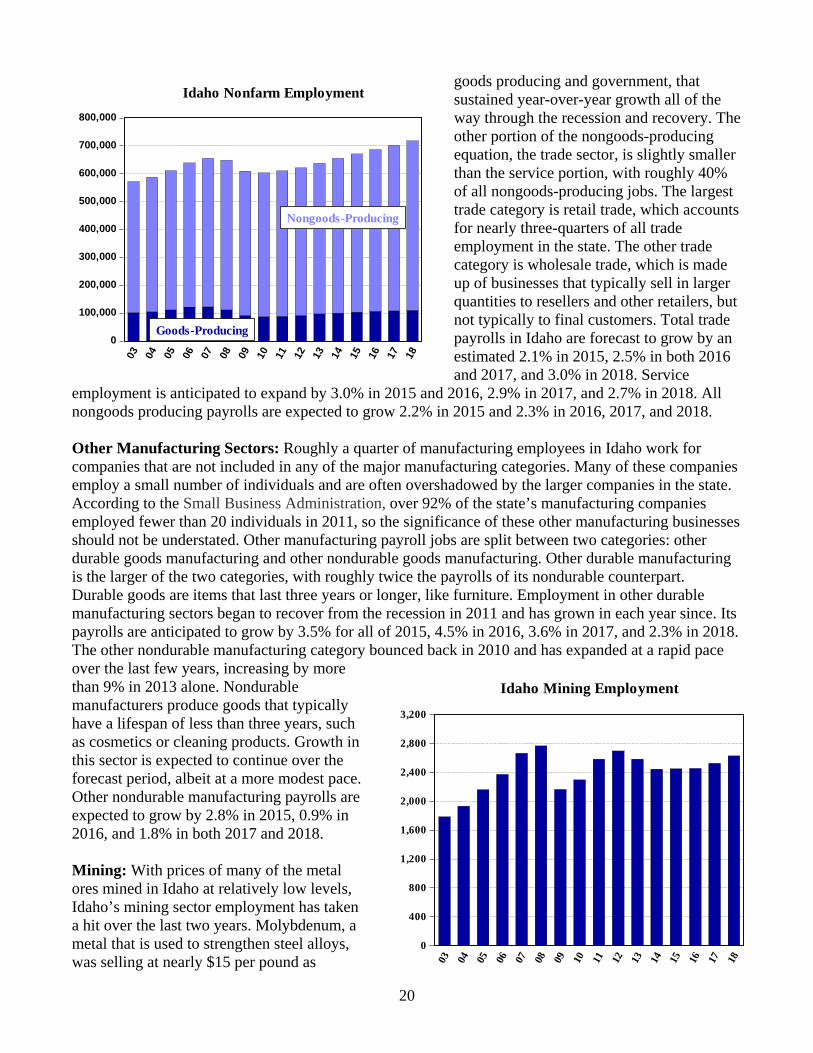
decreased federal revenue reached federal government employees in Idaho, which has led to decreases in federal government employees in the Gem State in seven of the last ten years. Federal government employment in the state is anticipated to continue to decrease in 2015, contracting by 0.4%, followed by another 0.2% in 2016, 0.3% in 2017, and 0.4% in 2018. State and local government payrolls in Idaho are expected to fare better, with employment levels expected to stay mostly flat in 2015 and 2016, and gain 0.5% in 2017 and 0.7% in 2018. Food Processing: As Idaho’s largest manufacturing sector, the food processing sector has been one of the most active employment categories in the state’s economy over the past few years. A string of closures, new companies, and expanding companies have made this sector one of the most newsworthy in the state. Food processing payrolls fluctuated through the recession as food processing companies faced the need to cut costs. Following the recession and in the midst of a prolonged recovery The J. R. Simplot Company announced that it would cut costs by closing three of its outdated potato processing facilities (in Nampa, Caldwell, and Aberdeen), and replace them with a new, state-of-the-art processing facility that would be located in Caldwell and process potatoes as efficiently as all three of the previous plants combined. The new plant requires only a fraction of the employees that were previously required and will lead to an estimated net job decrease of 800. For other food processing companies, the recession was an opportune time to expand or to move operations to a new location with lower costs. Idaho has the added benefit of being a prime location for accessibility to many agricultural inputs, such as dairy milk and grains. According to the US Department of Agriculture, in 2013 Idaho’s 580,000 dairy cows produced 13.4 billion pounds of milk, or about 6.7% of total US milk production—the fourth highest in the nation. Idaho remained the nation’s top potato supplier that same year, marketing about 131.1 million hundredweight of potatoes, or about 33% of the potatoes produced in all of the US. Also in 2013, Idaho produced 27% of the nation’s barley, 19% of the sugar beets, and 18% of the fresh plums. Food processing companies that have moved or expanded operations in Idaho over the last couple of years include Chobani, GoGo squeeZ, Clif Bar, Glanbia, and Sorrento Lactalis. Food processing payrolls are forecast to grow by 2.5% in 2015, 2.4% in 2016, 2.0% in 2017, and 1.9% in 2018. Nongoods Producing: The nongoods-producing sector contains all nonfarm trade and service jobs in the state, which accounts for roughly 85% of all nonfarm payrolls in Idaho. The service employment category has the largest number of jobs, with nearly 60% of all nongoods-producing payrolls. Employment in service professions has been on the rise for decades and is holding strong as many of the service industries are very active in the state. One of the largest service industries in the state is professional and business service, which encapsulates everything from legal services to call centers. This industry’s payrolls shrunk by about 11% during the recession, which might have been worse if not for a series of call center openings and expansions in the state over the past few years. Professional and business service is the second largest service employer in the state, with estimated payrolls of just under 80,000 in 2014. The largest service employer is the private education and health service providers, with estimated payrolls of approximately 94,000 in 2014. This was the only employment category, including
0
4,000
8,000
12,000
16,000
20,000
03 04 05 06 07 08 09 10 11 12 13 14 15 16 17 18
Idaho Food Processing Employment
20
goods producing and government, that sustained year-over-year growth all of the way through the recession and recovery. The other portion of the nongoods-producing equation, the trade sector, is slightly smaller than the service portion, with roughly 40% of all nongoods-producing jobs. The largest trade category is retail trade, which accounts for nearly three-quarters of all trade employment in the state. The other trade category is wholesale trade, which is made up of businesses that typically sell in larger quantities to resellers and other retailers, but not typically to final customers. Total trade payrolls in Idaho are forecast to grow by an estimated 2.1% in 2015, 2.5% in both 2016 and 2017, and 3.0% in 2018. Service
employment is anticipated to expand by 3.0% in 2015 and 2016, 2.9% in 2017, and 2.7% in 2018. All nongoods producing payrolls are expected to grow 2.2% in 2015 and 2.3% in 2016, 2017, and 2018. Other Manufacturing Sectors: Roughly a quarter of manufacturing employees in Idaho work for companies that are not included in any of the major manufacturing categories. Many of these companies employ a small number of individuals and are often overshadowed by the larger companies in the state. According to the Small Business Administration, over 92% of the state’s manufacturing companies employed fewer than 20 individuals in 2011, so the significance of these other manufacturing businesses should not be understated. Other manufacturing payroll jobs are split between two categories: other durable goods manufacturing and other nondurable goods manufacturing. Other durable manufacturing is the larger of the two categories, with roughly twice the payrolls of its nondurable counterpart. Durable goods are items that last three years or longer, like furniture. Employment in other durable manufacturing sectors began to recover from the recession in 2011 and has grown in each year since. Its payrolls are anticipated to grow by 3.5% for all of 2015, 4.5% in 2016, 3.6% in 2017, and 2.3% in 2018. The other nondurable manufacturing category bounced back in 2010 and has expanded at a rapid pace over the last few years, increasing by more than 9% in 2013 alone. Nondurable manufacturers produce goods that typically have a lifespan of less than three years, such as cosmetics or cleaning products. Growth in this sector is expected to continue over the forecast period, albeit at a more modest pace. Other nondurable manufacturing payrolls are expected to grow by 2.8% in 2015, 0.9% in 2016, and 1.8% in both 2017 and 2018. Mining: With prices of many of the metal ores mined in Idaho at relatively low levels, Idaho’s mining sector employment has taken a hit over the last two years. Molybdenum, a metal that is used to strengthen steel alloys, was selling at nearly $15 per pound as
0
100,000
200,000
300,000
400,000
500,000
600,000
700,000
800,00003 04 05 06 07 08 09 10 11 12 13 14 15 16 17 18
Idaho Nonfarm Employment
Nongoods-Producing
Goods-Producing
0
400
800
1,200
1,600
2,000
2,400
2,800
3,200
03 04 05 06 07 08 09 10 11 12 13 14 15 16 17 18
Idaho Mining Employment
21
recently as June 2014, but has sunk to a level of less than $8 per pound as of April 2015. This has made it difficult for Idaho molybdenum mines to remain profitable. Thompson Creek Mine, near Challis, Idaho, has decreased staff to just a skeleton crew that performs backlogged waste stripping. With weak global demand for molybdenum, there is no major price increase expected in the near term that would help to lift employment in molybdenum mining. Precious metals, such as gold and silver, prices are also down. It is possible that some silver mines in the state are operating at a loss, which is not necessary atypical. It can be less expensive to operate at a loss for a short period of time than it would be to incur the costs of halting operations when prices are low and ramping production back up when higher prices return. There are even some mining operations in the state that are in the beginning stages of exploring for new metal deposits, which could become more valuable when prices increase. Mining employment in Idaho is expected to grow by a modest 0.2% in 2015 and 0.3% in 2016 before an anticipated increase in the prices of some ores begin to set in. This is expected to grow mining payrolls by 2.8% in 2016 and 4.1% in 2018.
22
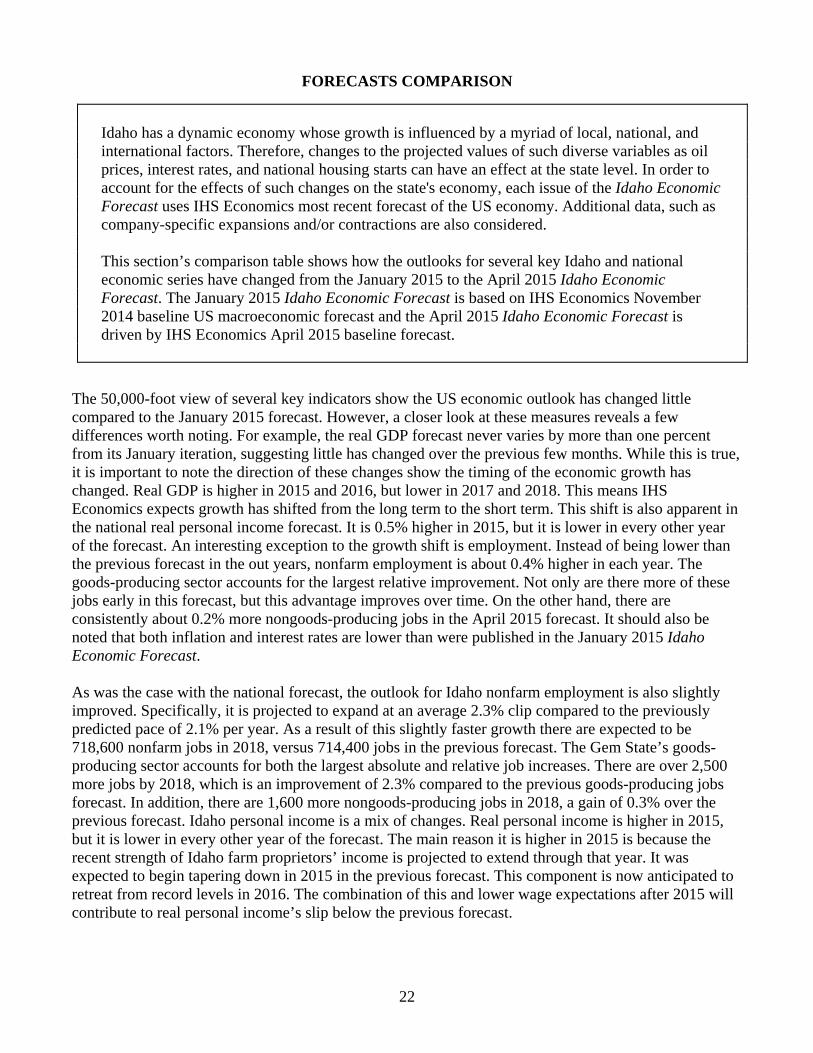
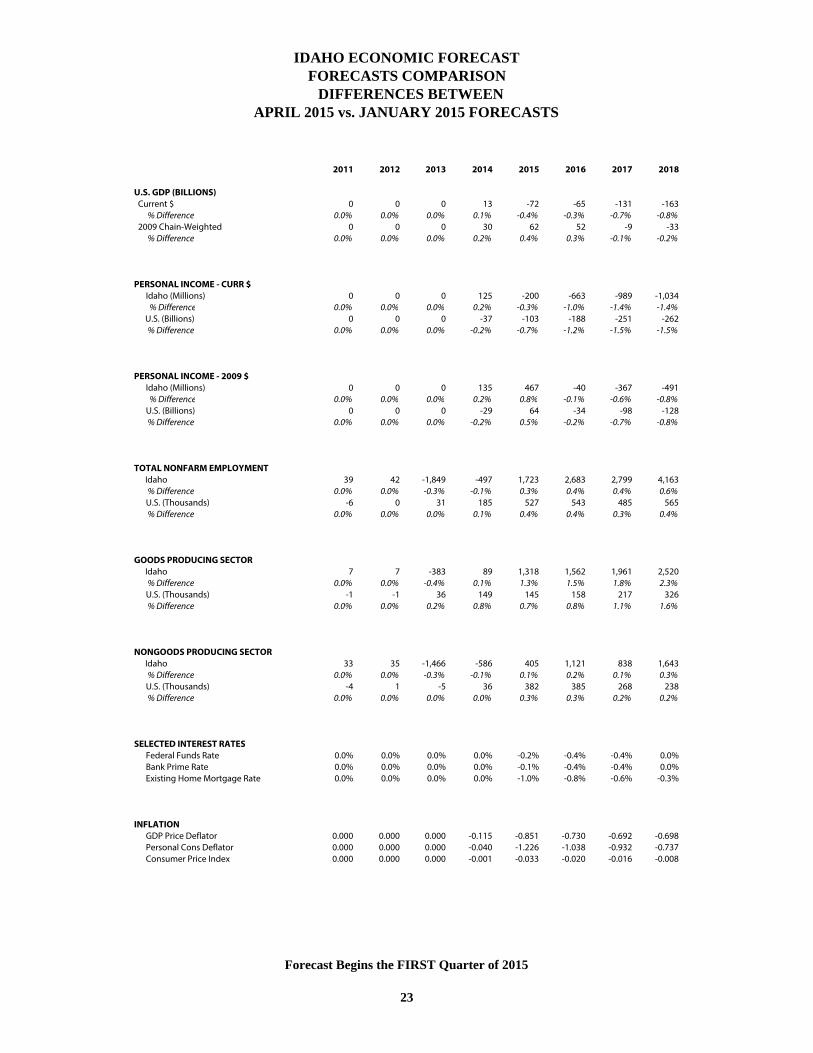
FORECASTS COMPARISON
The 50,000-foot view of several key indicators show the US economic outlook has changed little compared to the January 2015 forecast. However, a closer look at these measures reveals a few differences worth noting. For example, the real GDP forecast never varies by more than one percent from its January iteration, suggesting little has changed over the previous few months. While this is true, it is important to note the direction of these changes show the timing of the economic growth has changed. Real GDP is higher in 2015 and 2016, but lower in 2017 and 2018. This means IHS Economics expects growth has shifted from the long term to the short term. This shift is also apparent in the national real personal income forecast. It is 0.5% higher in 2015, but it is lower in every other year of the forecast. An interesting exception to the growth shift is employment. Instead of being lower than the previous forecast in the out years, nonfarm employment is about 0.4% higher in each year. The goods-producing sector accounts for the largest relative improvement. Not only are there more of these jobs early in this forecast, but this advantage improves over time. On the other hand, there are consistently about 0.2% more nongoods-producing jobs in the April 2015 forecast. It should also be noted that both inflation and interest rates are lower than were published in the January 2015 Idaho Economic Forecast. As was the case with the national forecast, the outlook for Idaho nonfarm employment is also slightly improved. Specifically, it is projected to expand at an average 2.3% clip compared to the previously predicted pace of 2.1% per year. As a result of this slightly faster growth there are expected to be 718,600 nonfarm jobs in 2018, versus 714,400 jobs in the previous forecast. The Gem State’s goods-producing sector accounts for both the largest absolute and relative job increases. There are over 2,500 more jobs by 2018, which is an improvement of 2.3% compared to the previous goods-producing jobs forecast. In addition, there are 1,600 more nongoods-producing jobs in 2018, a gain of 0.3% over the previous forecast. Idaho personal income is a mix of changes. Real personal income is higher in 2015, but it is lower in every other year of the forecast. The main reason it is higher in 2015 is because the recent strength of Idaho farm proprietors’ income is projected to extend through that year. It was expected to begin tapering down in 2015 in the previous forecast. This component is now anticipated to retreat from record levels in 2016. The combination of this and lower wage expectations after 2015 will contribute to real personal income’s slip below the previous forecast.
Idaho has a dynamic economy whose growth is influenced by a myriad of local, national, and international factors. Therefore, changes to the projected values of such diverse variables as oil prices, interest rates, and national housing starts can have an effect at the state level. In order to account for the effects of such changes on the state's economy, each issue of the Idaho Economic Forecast uses IHS Economics most recent forecast of the US economy. Additional data, such as company-specific expansions and/or contractions are also considered. This section’s comparison table shows how the outlooks for several key Idaho and national economic series have changed from the January 2015 to the April 2015 Idaho Economic Forecast. The January 2015 Idaho Economic Forecast is based on IHS Economics November 2014 baseline US macroeconomic forecast and the April 2015 Idaho Economic Forecast is driven by IHS Economics April 2015 baseline forecast.
2011 2012 2013 2014 2015 2016 2017 2018
U.S. GDP (BILLIONS) Current $ 0 0 0 13 -72 -65 -131 -163 % Difference 0.0% 0.0% 0.0% 0.1% -0.4% -0.3% -0.7% -0.8% 2009 Chain-Weighted 0 0 0 30 62 52 -9 -33 % Difference 0.0% 0.0% 0.0% 0.2% 0.4% 0.3% -0.1% -0.2%
PERSONAL INCOME - CURR $ Idaho (Millions) 0 0 0 125 -200 -663 -989 -1,034 % Difference 0.0% 0.0% 0.0% 0.2% -0.3% -1.0% -1.4% -1.4% U.S. (Billions) 0 0 0 -37 -103 -188 -251 -262 % Difference 0.0% 0.0% 0.0% -0.2% -0.7% -1.2% -1.5% -1.5%
PERSONAL INCOME - 2009 $ Idaho (Millions) 0 0 0 135 467 -40 -367 -491 % Difference 0.0% 0.0% 0.0% 0.2% 0.8% -0.1% -0.6% -0.8% U.S. (Billions) 0 0 0 -29 64 -34 -98 -128 % Difference 0.0% 0.0% 0.0% -0.2% 0.5% -0.2% -0.7% -0.8%
TOTAL NONFARM EMPLOYMENT Idaho 39 42 -1,849 -497 1,723 2,683 2,799 4,163 % Difference 0.0% 0.0% -0.3% -0.1% 0.3% 0.4% 0.4% 0.6% U.S. (Thousands) -6 0 31 185 527 543 485 565 % Difference 0.0% 0.0% 0.0% 0.1% 0.4% 0.4% 0.3% 0.4%
GOODS PRODUCING SECTOR Idaho 7 7 -383 89 1,318 1,562 1,961 2,520 % Difference 0.0% 0.0% -0.4% 0.1% 1.3% 1.5% 1.8% 2.3% U.S. (Thousands) -1 -1 36 149 145 158 217 326 % Difference 0.0% 0.0% 0.2% 0.8% 0.7% 0.8% 1.1% 1.6%
NONGOODS PRODUCING SECTOR Idaho 33 35 -1,466 -586 405 1,121 838 1,643 % Difference 0.0% 0.0% -0.3% -0.1% 0.1% 0.2% 0.1% 0.3% U.S. (Thousands) -4 1 -5 36 382 385 268 238 % Difference 0.0% 0.0% 0.0% 0.0% 0.3% 0.3% 0.2% 0.2%
SELECTED INTEREST RATES Federal Funds Rate 0.0% 0.0% 0.0% 0.0% -0.2% -0.4% -0.4% 0.0% Bank Prime Rate 0.0% 0.0% 0.0% 0.0% -0.1% -0.4% -0.4% 0.0% Existing Home Mortgage Rate 0.0% 0.0% 0.0% 0.0% -1.0% -0.8% -0.6% -0.3%
INFLATION GDP Price Deflator 0.000 0.000 0.000 -0.115 -0.851 -0.730 -0.692 -0.698 Personal Cons Deflator 0.000 0.000 0.000 -0.040 -1.226 -1.038 -0.932 -0.737 Consumer Price Index 0.000 0.000 0.000 -0.001 -0.033 -0.020 -0.016 -0.008
IDAHO ECONOMIC FORECAST
APRIL 2015 vs. JANUARY 2015 FORECASTS DIFFERENCES BETWEENFORECASTS COMPARISON
Forecast Begins the FIRST Quarter of 2015
23
24
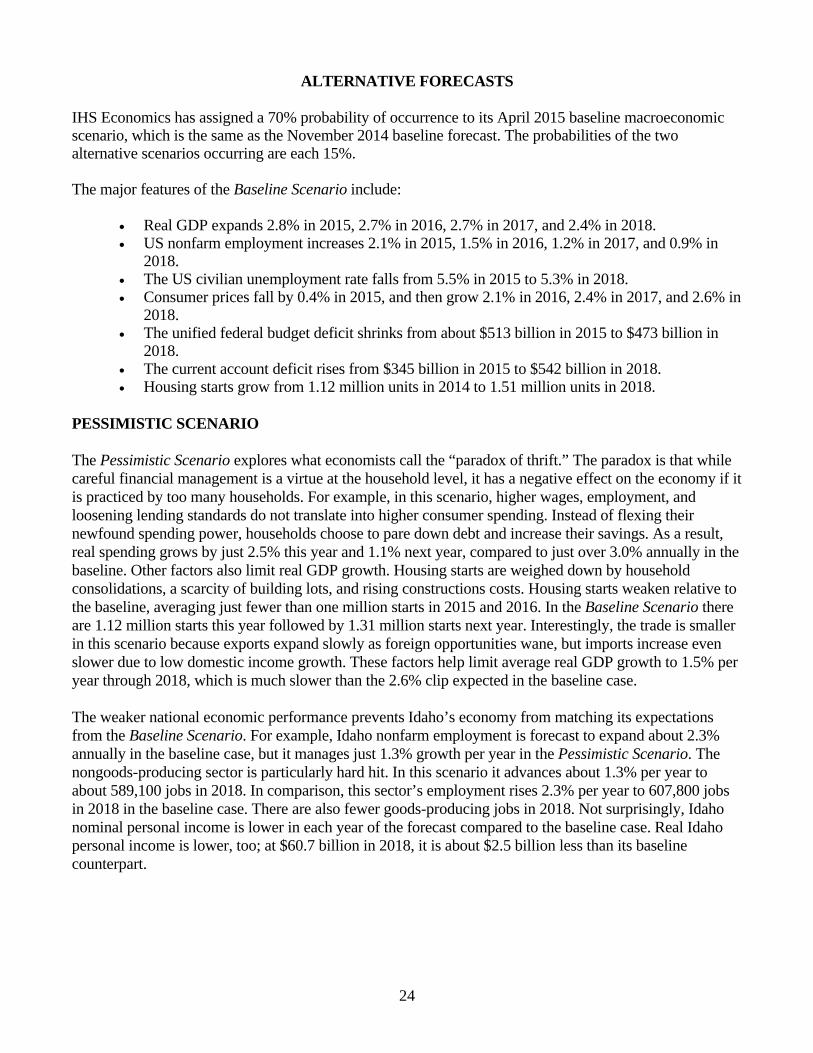
ALTERNATIVE FORECASTS IHS Economics has assigned a 70% probability of occurrence to its April 2015 baseline macroeconomic scenario, which is the same as the November 2014 baseline forecast. The probabilities of the two alternative scenarios occurring are each 15%. The major features of the Baseline Scenario include:
Real GDP expands 2.8% in 2015, 2.7% in 2016, 2.7% in 2017, and 2.4% in 2018. US nonfarm employment increases 2.1% in 2015, 1.5% in 2016, 1.2% in 2017, and 0.9% in
2018. The US civilian unemployment rate falls from 5.5% in 2015 to 5.3% in 2018. Consumer prices fall by 0.4% in 2015, and then grow 2.1% in 2016, 2.4% in 2017, and 2.6% in
2018. The unified federal budget deficit shrinks from about $513 billion in 2015 to $473 billion in
2018. The current account deficit rises from $345 billion in 2015 to $542 billion in 2018. Housing starts grow from 1.12 million units in 2014 to 1.51 million units in 2018.
PESSIMISTIC SCENARIO The Pessimistic Scenario explores what economists call the “paradox of thrift.” The paradox is that while careful financial management is a virtue at the household level, it has a negative effect on the economy if it is practiced by too many households. For example, in this scenario, higher wages, employment, and loosening lending standards do not translate into higher consumer spending. Instead of flexing their newfound spending power, households choose to pare down debt and increase their savings. As a result, real spending grows by just 2.5% this year and 1.1% next year, compared to just over 3.0% annually in the baseline. Other factors also limit real GDP growth. Housing starts are weighed down by household consolidations, a scarcity of building lots, and rising constructions costs. Housing starts weaken relative to the baseline, averaging just fewer than one million starts in 2015 and 2016. In the Baseline Scenario there are 1.12 million starts this year followed by 1.31 million starts next year. Interestingly, the trade is smaller in this scenario because exports expand slowly as foreign opportunities wane, but imports increase even slower due to low domestic income growth. These factors help limit average real GDP growth to 1.5% per year through 2018, which is much slower than the 2.6% clip expected in the baseline case. The weaker national economic performance prevents Idaho’s economy from matching its expectations from the Baseline Scenario. For example, Idaho nonfarm employment is forecast to expand about 2.3% annually in the baseline case, but it manages just 1.3% growth per year in the Pessimistic Scenario. The nongoods-producing sector is particularly hard hit. In this scenario it advances about 1.3% per year to about 589,100 jobs in 2018. In comparison, this sector’s employment rises 2.3% per year to 607,800 jobs in 2018 in the baseline case. There are also fewer goods-producing jobs in 2018. Not surprisingly, Idaho nominal personal income is lower in each year of the forecast compared to the baseline case. Real Idaho personal income is lower, too; at $60.7 billion in 2018, it is about $2.5 billion less than its baseline counterpart.
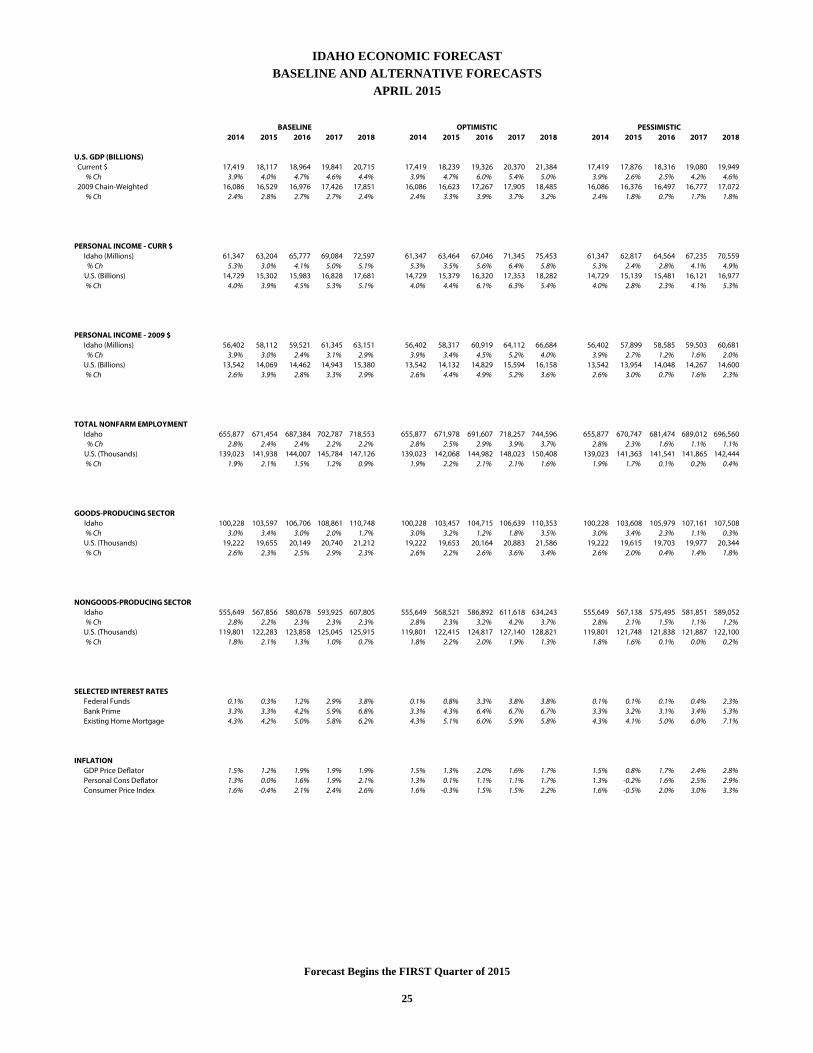
2014 2015 2016 2017 2018 2014 2015 2016 2017 2018 2014 2015 2016 2017 2018
U.S. GDP (BILLIONS) Current $ 17,419 18,117 18,964 19,841 20,715 17,419 18,239 19,326 20,370 21,384 17,419 17,876 18,316 19,080 19,949 % Ch 3.9% 4.0% 4.7% 4.6% 4.4% 3.9% 4.7% 6.0% 5.4% 5.0% 3.9% 2.6% 2.5% 4.2% 4.6% 2009 Chain-Weighted 16,086 16,529 16,976 17,426 17,851 16,086 16,623 17,267 17,905 18,485 16,086 16,376 16,497 16,777 17,072 % Ch 2.4% 2.8% 2.7% 2.7% 2.4% 2.4% 3.3% 3.9% 3.7% 3.2% 2.4% 1.8% 0.7% 1.7% 1.8%
PERSONAL INCOME - CURR $ Idaho (Millions) 61,347 63,204 65,777 69,084 72,597 61,347 63,464 67,046 71,345 75,453 61,347 62,817 64,564 67,235 70,559 % Ch 5.3% 3.0% 4.1% 5.0% 5.1% 5.3% 3.5% 5.6% 6.4% 5.8% 5.3% 2.4% 2.8% 4.1% 4.9% U.S. (Billions) 14,729 15,302 15,983 16,828 17,681 14,729 15,379 16,320 17,353 18,282 14,729 15,139 15,481 16,121 16,977 % Ch 4.0% 3.9% 4.5% 5.3% 5.1% 4.0% 4.4% 6.1% 6.3% 5.4% 4.0% 2.8% 2.3% 4.1% 5.3%
PERSONAL INCOME - 2009 $ Idaho (Millions) 56,402 58,112 59,521 61,345 63,151 56,402 58,317 60,919 64,112 66,684 56,402 57,899 58,585 59,503 60,681 % Ch 3.9% 3.0% 2.4% 3.1% 2.9% 3.9% 3.4% 4.5% 5.2% 4.0% 3.9% 2.7% 1.2% 1.6% 2.0% U.S. (Billions) 13,542 14,069 14,462 14,943 15,380 13,542 14,132 14,829 15,594 16,158 13,542 13,954 14,048 14,267 14,600 % Ch 2.6% 3.9% 2.8% 3.3% 2.9% 2.6% 4.4% 4.9% 5.2% 3.6% 2.6% 3.0% 0.7% 1.6% 2.3%
TOTAL NONFARM EMPLOYMENT Idaho 655,877 671,454 687,384 702,787 718,553 655,877 671,978 691,607 718,257 744,596 655,877 670,747 681,474 689,012 696,560 % Ch 2.8% 2.4% 2.4% 2.2% 2.2% 2.8% 2.5% 2.9% 3.9% 3.7% 2.8% 2.3% 1.6% 1.1% 1.1% U.S. (Thousands) 139,023 141,938 144,007 145,784 147,126 139,023 142,068 144,982 148,023 150,408 139,023 141,363 141,541 141,865 142,444 % Ch 1.9% 2.1% 1.5% 1.2% 0.9% 1.9% 2.2% 2.1% 2.1% 1.6% 1.9% 1.7% 0.1% 0.2% 0.4%
GOODS-PRODUCING SECTOR Idaho 100,228 103,597 106,706 108,861 110,748 100,228 103,457 104,715 106,639 110,353 100,228 103,608 105,979 107,161 107,508 % Ch 3.0% 3.4% 3.0% 2.0% 1.7% 3.0% 3.2% 1.2% 1.8% 3.5% 3.0% 3.4% 2.3% 1.1% 0.3% U.S. (Thousands) 19,222 19,655 20,149 20,740 21,212 19,222 19,653 20,164 20,883 21,586 19,222 19,615 19,703 19,977 20,344 % Ch 2.6% 2.3% 2.5% 2.9% 2.3% 2.6% 2.2% 2.6% 3.6% 3.4% 2.6% 2.0% 0.4% 1.4% 1.8%
NONGOODS-PRODUCING SECTOR Idaho 555,649 567,856 580,678 593,925 607,805 555,649 568,521 586,892 611,618 634,243 555,649 567,138 575,495 581,851 589,052 % Ch 2.8% 2.2% 2.3% 2.3% 2.3% 2.8% 2.3% 3.2% 4.2% 3.7% 2.8% 2.1% 1.5% 1.1% 1.2% U.S. (Thousands) 119,801 122,283 123,858 125,045 125,915 119,801 122,415 124,817 127,140 128,821 119,801 121,748 121,838 121,887 122,100 % Ch 1.8% 2.1% 1.3% 1.0% 0.7% 1.8% 2.2% 2.0% 1.9% 1.3% 1.8% 1.6% 0.1% 0.0% 0.2%
SELECTED INTEREST RATES Federal Funds 0.1% 0.3% 1.2% 2.9% 3.8% 0.1% 0.8% 3.3% 3.8% 3.8% 0.1% 0.1% 0.1% 0.4% 2.3% Bank Prime 3.3% 3.3% 4.2% 5.9% 6.8% 3.3% 4.3% 6.4% 6.7% 6.7% 3.3% 3.2% 3.1% 3.4% 5.3% Existing Home Mortgage 4.3% 4.2% 5.0% 5.8% 6.2% 4.3% 5.1% 6.0% 5.9% 5.8% 4.3% 4.1% 5.0% 6.0% 7.1%
INFLATION GDP Price Deflator 1.5% 1.2% 1.9% 1.9% 1.9% 1.5% 1.3% 2.0% 1.6% 1.7% 1.5% 0.8% 1.7% 2.4% 2.8% Personal Cons Deflator 1.3% 0.0% 1.6% 1.9% 2.1% 1.3% 0.1% 1.1% 1.1% 1.7% 1.3% -0.2% 1.6% 2.5% 2.9% Consumer Price Index 1.6% -0.4% 2.1% 2.4% 2.6% 1.6% -0.3% 1.5% 1.5% 2.2% 1.6% -0.5% 2.0% 3.0% 3.3%
APRIL 2015BASELINE AND ALTERNATIVE FORECASTS
IDAHO ECONOMIC FORECAST
PESSIMISTICOPTIMISTICBASELINE
Forecast Begins the FIRST Quarter of 2015
25
26
OPTIMISTIC SCENARIO In the Optimistic Scenario, global growth is stronger than in the baseline. The European Central Bank’s quantitative easing successfully steers the Eurozone away from its current economic malaise. Eurozone growth strengthens more than in the baseline as fiscal conditions improve, credit conditions ease, and pent-up demand is released. Emerging-market GDP growth accelerates as these markets implement structural reforms to increase labor productivity. As global growth picks up, the dollar appreciates by 15.6% in 2015 (compared with 16.6% in the baseline). In 2016, the dollar appreciates by 5.6% against most major currencies, while the baseline forecast indicates a 0.8% depreciation of the dollar. The Standard and Poor’s 500 stock market index grows 14.7% (versus 9.1% in the baseline) in 2015 as a whole, staying above the baseline level throughout the forecast period. Greatly increased domestic production brings significant wage and payroll gains. As employment and wage growth both pick up, they lift the pace of US consumption growth. Real consumption grows 3.8% in 2015 (versus 3.2% in the baseline) and 4.5% in 2016 (versus 3.1% in the baseline). This stronger spending helps lift real GDP growth to 3.3% in 2015, 3.9% in 2016, 3.7% in 2017, and 3.2% in 2018. The stronger national growth boosts the state’s near-term economic prospects. For example, Idaho nonfarm employment was forecast to increase an average of 2.3% per year in the baseline case, but advances 3.5% in this scenario. This stronger growth results in 744,600 jobs in 2018, which is about 26,000 more jobs than in the baseline case. Interestingly, all of this gain is in the nongoods-producing sector. Idaho goods-producing employment is down slightly in 2018 from its baseline counterpart, as the projected stronger dollar challenges the state’s export industries. Idaho personal income measures, nominal and real, grow faster in this scenario than in the baseline. Nominal income averages 5.9% annual growth through 2018 and real income advances 4.6% per year.
27
Why Is Wage Growth So Slow? Mary C. Daly1
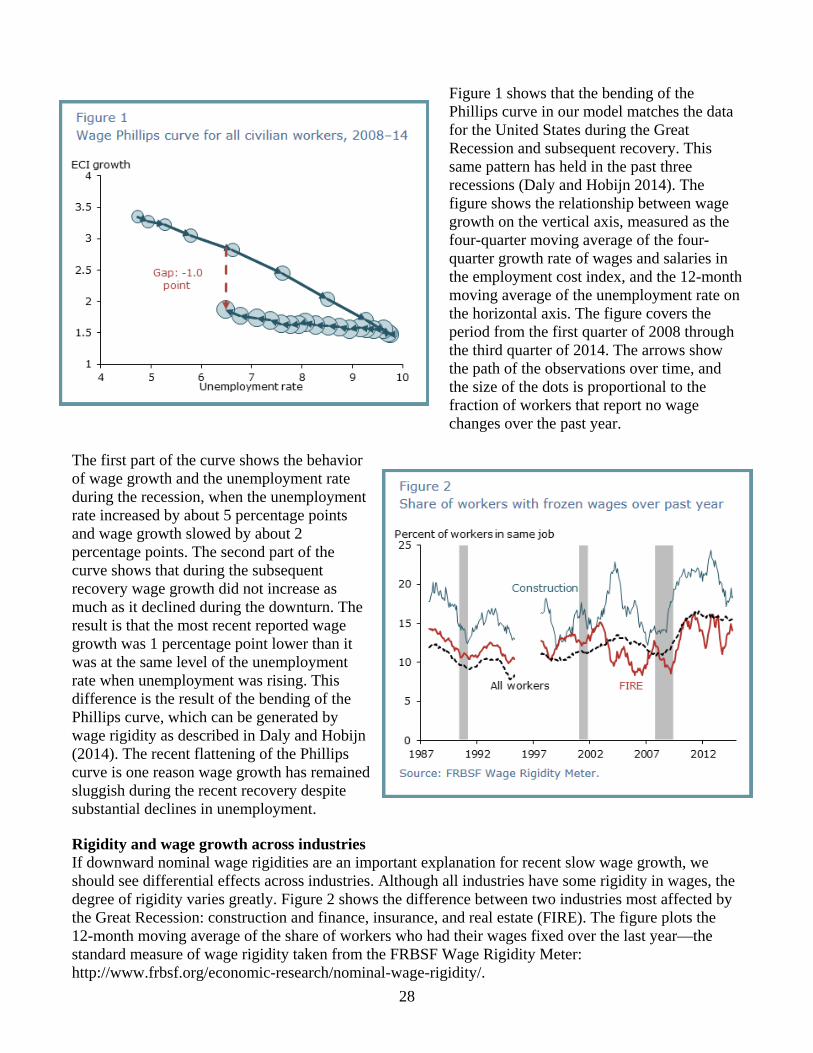
Bart Hobijn A prominent feature of the Great Recession and subsequent recovery has been the unusual behavior of wages. In standard economic models, unemployment and wage growth are tightly connected, moving at nearly the same time in opposite directions: As unemployment rises, wage growth slows, and vice versa. Since 2008 this relationship has slipped. During the recession, wage growth slowed much less than expected in response to the sharp increase in unemployment (Daly, Hobijn, and Lucking 2012). And so far in the recovery, wage growth has remained slow, despite substantial declines in the unemployment rate (Daly, Hobijn, and Ni 2013). One explanation for this pattern is the hesitancy of employers to reduce wages and the reluctance of workers to accept wage cuts, even during recessions, a behavior known as downward nominal wage rigidity. Daly and Hobijn (2014) argue that this behavior affected the aggregate relationship between the unemployment rate and wage growth during the past three recessions and recoveries and has been especially pronounced during and after the Great Recession. This Economic Letter examines whether the effects of wage rigidities over the recent recession and recovery can also be seen across industries. In particular, we consider whether industries with higher or lower degrees of wage flexibility have seen different evolutions of wage growth and unemployment. Our findings suggest that industries with the most downwardly rigid wage structures before the recession have seen the slowest wage growth during the recovery, conditional on changes in unemployment. In contrast, industries with fairly flexible wage structures have seen unemployment and wage growth move more closely together. These findings provide cross-industry evidence that downward nominal wage rigidities have played an important role in the modest recovery of wages in recent years. Downward nominal wage rigidities, wage growth, and unemployment Downward nominal wage rigidities are a well-documented feature of the U.S. labor market (see, for example, Akerlof, Dickens, and Perry 1996 and Card and Hyslop 1996). With that in mind, Daly and Hobijn (2014) introduce a model to illustrate how such rigidities can affect the relationship between unemployment and wage growth. Downward rigidities prevent businesses from reducing wages as much as they would like following a negative shock to the economy. This keeps wages from falling, but it also further reduces the demand for workers, contributing to the rise in unemployment. Accordingly, the higher wages come with more unemployment than would occur if wages were flexible and could be fully reduced. As the economy recovers, the situation reverses and the pressure to cut wages dissipates. However, the accumulated stockpile of pent-up wage cuts remains and must be worked off to put the labor market back in balance. In response, businesses hold back wage increases and wait for inflation and productivity growth to bring wages closer to their desired level. Since it takes some time to fully exhaust the pool of wage cuts, wage growth remains low even as the economy expands and the unemployment rate declines. Daly and Hobijn (2014) show that this mechanism causes a bending of the wage Phillips curve—the curve that characterizes the relationship between unemployment and wage growth.
1This article originally appeared in the Number 2015-01; January 5, 2015 FRBSF Economic Letter. Opinions expressed in this article are those of the authors and do not necessarily reflect the views of the management of the Federal Reserve Bank of San Francisco or of the Board of Governors of the Federal Reserve System.
28
Figure 1 shows that the bending of the Phillips curve in our model matches the data for the United States during the Great Recession and subsequent recovery. This same pattern has held in the past three recessions (Daly and Hobijn 2014). The figure shows the relationship between wage growth on the vertical axis, measured as the four-quarter moving average of the four-quarter growth rate of wages and salaries in the employment cost index, and the 12-month moving average of the unemployment rate on the horizontal axis. The figure covers the period from the first quarter of 2008 through the third quarter of 2014. The arrows show the path of the observations over time, and the size of the dots is proportional to the fraction of workers that report no wage changes over the past year.
The first part of the curve shows the behavior of wage growth and the unemployment rate during the recession, when the unemployment rate increased by about 5 percentage points and wage growth slowed by about 2 percentage points. The second part of the curve shows that during the subsequent recovery wage growth did not increase as much as it declined during the downturn. The result is that the most recent reported wage growth was 1 percentage point lower than it was at the same level of the unemployment rate when unemployment was rising. This difference is the result of the bending of the Phillips curve, which can be generated by wage rigidity as described in Daly and Hobijn (2014). The recent flattening of the Phillips curve is one reason wage growth has remained sluggish during the recent recovery despite substantial declines in unemployment. Rigidity and wage growth across industries If downward nominal wage rigidities are an important explanation for recent slow wage growth, we should see differential effects across industries. Although all industries have some rigidity in wages, the degree of rigidity varies greatly. Figure 2 shows the difference between two industries most affected by the Great Recession: construction and finance, insurance, and real estate (FIRE). The figure plots the 12-month moving average of the share of workers who had their wages fixed over the last year—the standard measure of wage rigidity taken from the FRBSF Wage Rigidity Meter: http://www.frbsf.org/economic-research/nominal-wage-rigidity/.
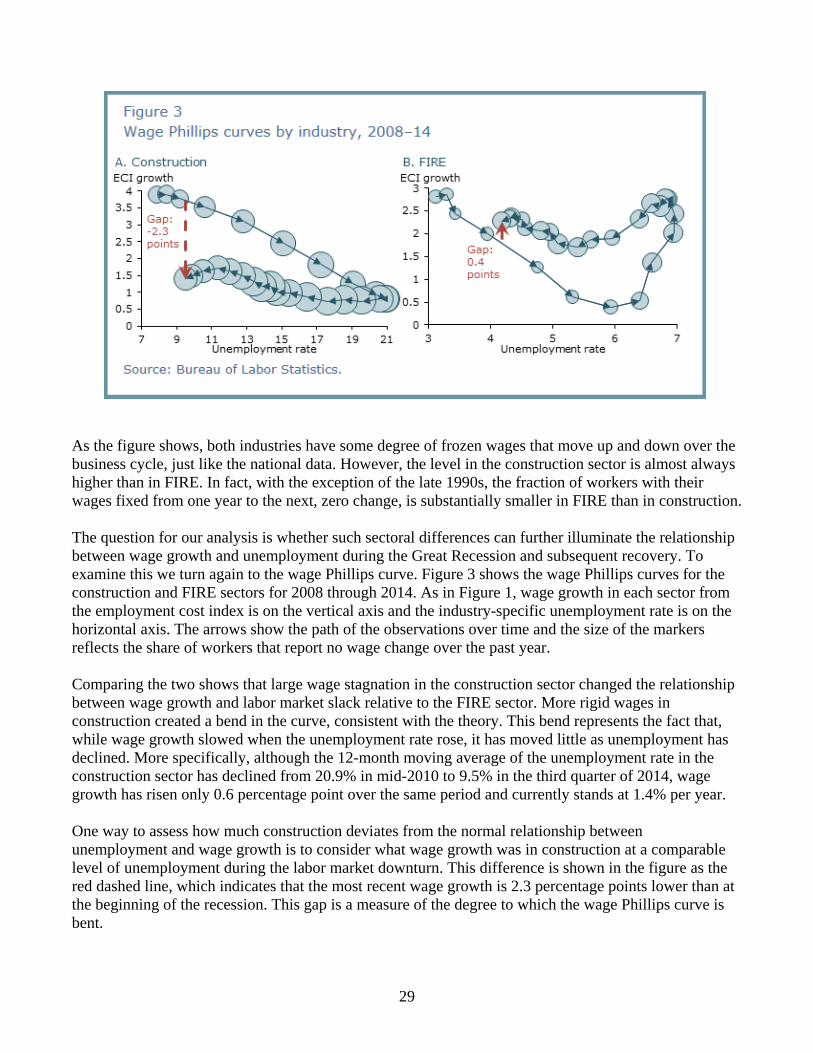
29
As the figure shows, both industries have some degree of frozen wages that move up and down over the business cycle, just like the national data. However, the level in the construction sector is almost always higher than in FIRE. In fact, with the exception of the late 1990s, the fraction of workers with their wages fixed from one year to the next, zero change, is substantially smaller in FIRE than in construction. The question for our analysis is whether such sectoral differences can further illuminate the relationship between wage growth and unemployment during the Great Recession and subsequent recovery. To examine this we turn again to the wage Phillips curve. Figure 3 shows the wage Phillips curves for the construction and FIRE sectors for 2008 through 2014. As in Figure 1, wage growth in each sector from the employment cost index is on the vertical axis and the industry-specific unemployment rate is on the horizontal axis. The arrows show the path of the observations over time and the size of the markers reflects the share of workers that report no wage change over the past year. Comparing the two shows that large wage stagnation in the construction sector changed the relationship between wage growth and labor market slack relative to the FIRE sector. More rigid wages in construction created a bend in the curve, consistent with the theory. This bend represents the fact that, while wage growth slowed when the unemployment rate rose, it has moved little as unemployment has declined. More specifically, although the 12-month moving average of the unemployment rate in the construction sector has declined from 20.9% in mid-2010 to 9.5% in the third quarter of 2014, wage growth has risen only 0.6 percentage point over the same period and currently stands at 1.4% per year. One way to assess how much construction deviates from the normal relationship between unemployment and wage growth is to consider what wage growth was in construction at a comparable level of unemployment during the labor market downturn. This difference is shown in the figure as the red dashed line, which indicates that the most recent wage growth is 2.3 percentage points lower than at the beginning of the recession. This gap is a measure of the degree to which the wage Phillips curve is bent.
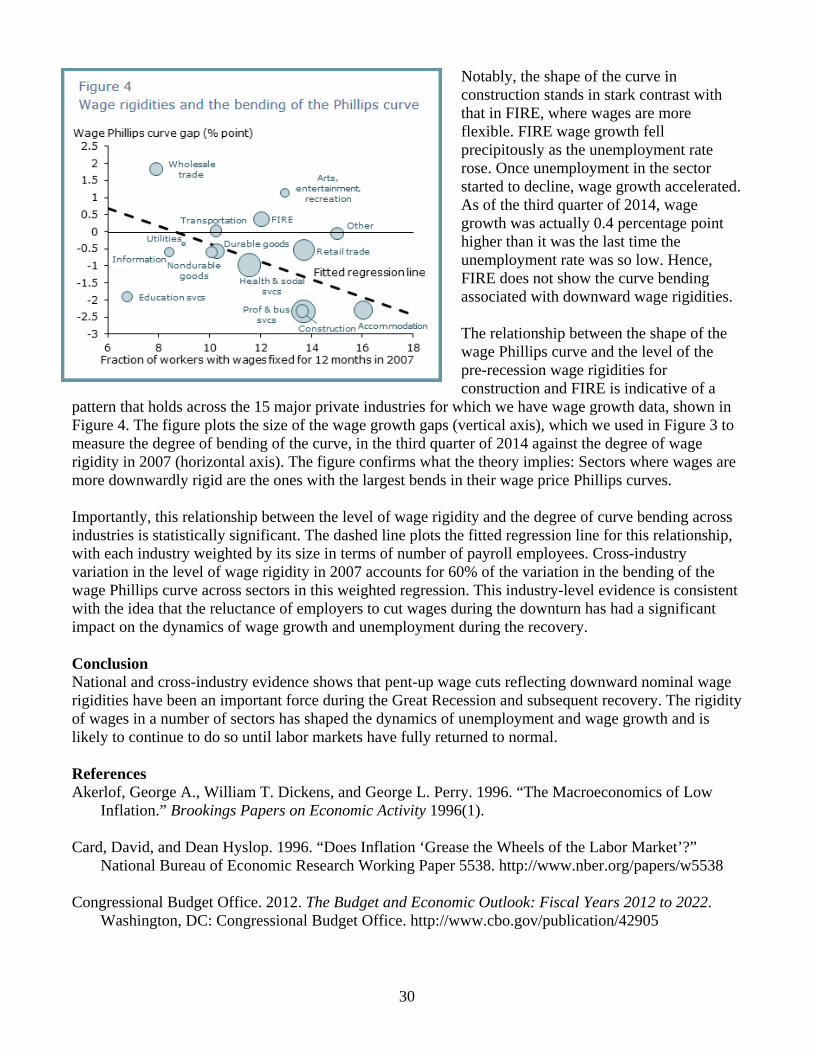
30
Notably, the shape of the curve in construction stands in stark contrast with that in FIRE, where wages are more flexible. FIRE wage growth fell precipitously as the unemployment rate rose. Once unemployment in the sector started to decline, wage growth accelerated. As of the third quarter of 2014, wage growth was actually 0.4 percentage point higher than it was the last time the unemployment rate was so low. Hence, FIRE does not show the curve bending associated with downward wage rigidities. The relationship between the shape of the wage Phillips curve and the level of the pre-recession wage rigidities for construction and FIRE is indicative of a
pattern that holds across the 15 major private industries for which we have wage growth data, shown in Figure 4. The figure plots the size of the wage growth gaps (vertical axis), which we used in Figure 3 to measure the degree of bending of the curve, in the third quarter of 2014 against the degree of wage rigidity in 2007 (horizontal axis). The figure confirms what the theory implies: Sectors where wages are more downwardly rigid are the ones with the largest bends in their wage price Phillips curves. Importantly, this relationship between the level of wage rigidity and the degree of curve bending across industries is statistically significant. The dashed line plots the fitted regression line for this relationship, with each industry weighted by its size in terms of number of payroll employees. Cross-industry variation in the level of wage rigidity in 2007 accounts for 60% of the variation in the bending of the wage Phillips curve across sectors in this weighted regression. This industry-level evidence is consistent with the idea that the reluctance of employers to cut wages during the downturn has had a significant impact on the dynamics of wage growth and unemployment during the recovery. Conclusion National and cross-industry evidence shows that pent-up wage cuts reflecting downward nominal wage rigidities have been an important force during the Great Recession and subsequent recovery. The rigidity of wages in a number of sectors has shaped the dynamics of unemployment and wage growth and is likely to continue to do so until labor markets have fully returned to normal. References Akerlof, George A., William T. Dickens, and George L. Perry. 1996. “The Macroeconomics of Low
Inflation.” Brookings Papers on Economic Activity 1996(1). Card, David, and Dean Hyslop. 1996. “Does Inflation ‘Grease the Wheels of the Labor Market’?”
National Bureau of Economic Research Working Paper 5538. http://www.nber.org/papers/w5538 Congressional Budget Office. 2012. The Budget and Economic Outlook: Fiscal Years 2012 to 2022.
Washington, DC: Congressional Budget Office. http://www.cbo.gov/publication/42905
31
Daly, Mary C., and Bart Hobijn. 2014. “Downward Nominal Wage Rigidities Bend the Phillips Curve.” FRB San Francisco Working Paper 2013-08. http://www.frbsf.org/economic-research/files/wp2013-08.pdf
Daly, Mary C., Bart Hobijn, and Brian Lucking. 2012. “Why Has Wage Growth Stayed Strong?”
FRBSF Economic Letter 2012-10 (April 2). http://www.frbsf.org/economic-research/publications/economicletter/2012/april/strong-wage-growth/
Daly, Mary C., Bart Hobijn, and Timothy Ni. 2013. “The Path of Wage Growth and Unemployment”
FRBSF Economic Letter 2013-20 (July 15). http://www.frbsf.org/economic-research/publications/economic-letter/2013/july/wages-unemployment-rate/

This page left blank intentionally.
33
IDAHO ECONOMIC FORECAST
April 2015
FORECAST DETAIL Annual Forecast 2001–2018 ........................................ Page 34 Quarterly Forecast 2012–2017 ..................................... Page 48 Reporting Conventions Units of measurement are presented in the individual reports. The percentage change numbers given in the annual reports are simple period-to-period percent changes. Since the periods are years, they are thus simple annual changes. The percentage changes given in the quarterly report are period-to-period changes at compound annual rates, following standard practice. A large change in a given quarter can seem to be exaggerated since the calculation assumes the change is compounded over an entire year. Data Sources National forecast data is provided by IHS Economics, as well as the Food and Agricultural Policy Research Institute (FAPRI). Historical data for the models are obtained from the following agencies: Bureau of the Census (demographic), Bureau of Economic Analysis (income), Bureau of Labor Statistics (employment), Federal Reserve Board of Governors (production), and US Department of Agriculture (farm). Idaho historical data is obtained from the Department of Labor (employment and hourly earnings), Bureau of Vital Statistics (births and deaths), Division of Financial Management (migration), and the Bureau of Economic Analysis (income). The Idaho average annual wage is calculated by the Division of Financial Management from Bureau of Economic Analysis and Idaho Department of Labor data. Because of the different methodology used and data available, this figure may not match those published by other sources.
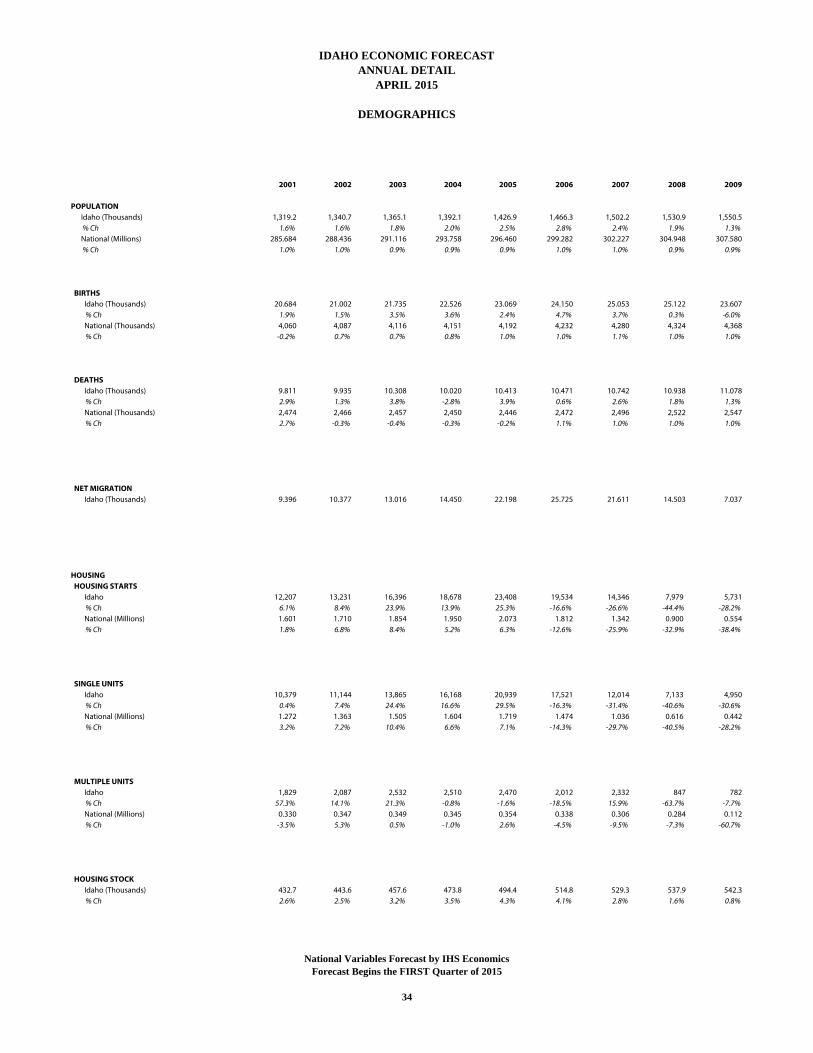
2001 2002 2003 2004 2005 2006 2007 2008 2009
POPULATION Idaho (Thousands) 1,319.2 1,340.7 1,365.1 1,392.1 1,426.9 1,466.3 1,502.2 1,530.9 1,550.5 % Ch 1.6% 1.6% 1.8% 2.0% 2.5% 2.8% 2.4% 1.9% 1.3% National (Millions) 285.684 288.436 291.116 293.758 296.460 299.282 302.227 304.948 307.580 % Ch 1.0% 1.0% 0.9% 0.9% 0.9% 1.0% 1.0% 0.9% 0.9%
BIRTHS Idaho (Thousands) 20.684 21.002 21.735 22.526 23.069 24.150 25.053 25.122 23.607 % Ch 1.9% 1.5% 3.5% 3.6% 2.4% 4.7% 3.7% 0.3% -6.0% National (Thousands) 4,060 4,087 4,116 4,151 4,192 4,232 4,280 4,324 4,368 % Ch -0.2% 0.7% 0.7% 0.8% 1.0% 1.0% 1.1% 1.0% 1.0%
DEATHS Idaho (Thousands) 9.811 9.935 10.308 10.020 10.413 10.471 10.742 10.938 11.078 % Ch 2.9% 1.3% 3.8% -2.8% 3.9% 0.6% 2.6% 1.8% 1.3% National (Thousands) 2,474 2,466 2,457 2,450 2,446 2,472 2,496 2,522 2,547 % Ch 2.7% -0.3% -0.4% -0.3% -0.2% 1.1% 1.0% 1.0% 1.0%
NET MIGRATION Idaho (Thousands) 9.396 10.377 13.016 14.450 22.198 25.725 21.611 14.503 7.037
HOUSING HOUSING STARTS Idaho 12,207 13,231 16,396 18,678 23,408 19,534 14,346 7,979 5,731 % Ch 6.1% 8.4% 23.9% 13.9% 25.3% -16.6% -26.6% -44.4% -28.2% National (Millions) 1.601 1.710 1.854 1.950 2.073 1.812 1.342 0.900 0.554 % Ch 1.8% 6.8% 8.4% 5.2% 6.3% -12.6% -25.9% -32.9% -38.4%
SINGLE UNITS Idaho 10,379 11,144 13,865 16,168 20,939 17,521 12,014 7,133 4,950 % Ch 0.4% 7.4% 24.4% 16.6% 29.5% -16.3% -31.4% -40.6% -30.6% National (Millions) 1.272 1.363 1.505 1.604 1.719 1.474 1.036 0.616 0.442 % Ch 3.2% 7.2% 10.4% 6.6% 7.1% -14.3% -29.7% -40.5% -28.2%
MULTIPLE UNITS Idaho 1,829 2,087 2,532 2,510 2,470 2,012 2,332 847 782 % Ch 57.3% 14.1% 21.3% -0.8% -1.6% -18.5% 15.9% -63.7% -7.7% National (Millions) 0.330 0.347 0.349 0.345 0.354 0.338 0.306 0.284 0.112 % Ch -3.5% 5.3% 0.5% -1.0% 2.6% -4.5% -9.5% -7.3% -60.7%
HOUSING STOCK Idaho (Thousands) 432.7 443.6 457.6 473.8 494.4 514.8 529.3 537.9 542.3 % Ch 2.6% 2.5% 3.2% 3.5% 4.3% 4.1% 2.8% 1.6% 0.8%
DEMOGRAPHICS
APRIL 2015ANNUAL DETAIL
IDAHO ECONOMIC FORECAST
National Variables Forecast by IHS EconomicsForecast Begins the FIRST Quarter of 2015
34
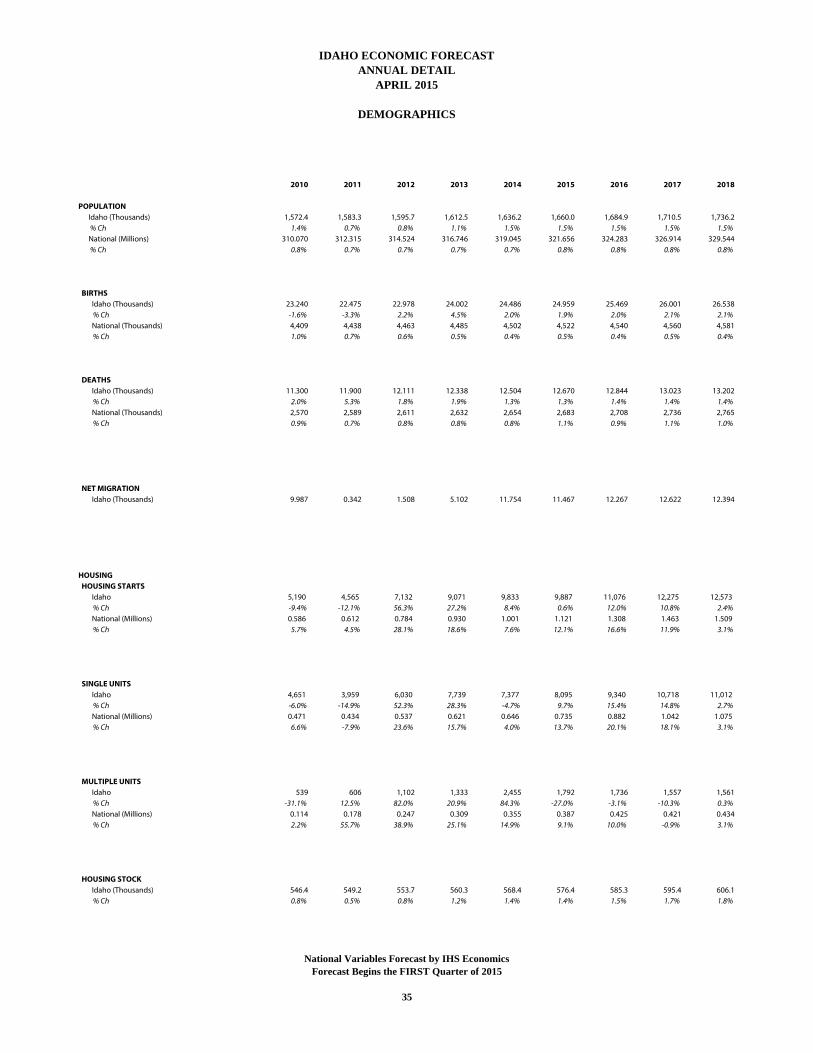
2010 2011 2012 2013 2014 2015 2016 2017 2018
POPULATION Idaho (Thousands) 1,572.4 1,583.3 1,595.7 1,612.5 1,636.2 1,660.0 1,684.9 1,710.5 1,736.2 % Ch 1.4% 0.7% 0.8% 1.1% 1.5% 1.5% 1.5% 1.5% 1.5% National (Millions) 310.070 312.315 314.524 316.746 319.045 321.656 324.283 326.914 329.544 % Ch 0.8% 0.7% 0.7% 0.7% 0.7% 0.8% 0.8% 0.8% 0.8%
BIRTHS Idaho (Thousands) 23.240 22.475 22.978 24.002 24.486 24.959 25.469 26.001 26.538 % Ch -1.6% -3.3% 2.2% 4.5% 2.0% 1.9% 2.0% 2.1% 2.1% National (Thousands) 4,409 4,438 4,463 4,485 4,502 4,522 4,540 4,560 4,581 % Ch 1.0% 0.7% 0.6% 0.5% 0.4% 0.5% 0.4% 0.5% 0.4%
DEATHS Idaho (Thousands) 11.300 11.900 12.111 12.338 12.504 12.670 12.844 13.023 13.202 % Ch 2.0% 5.3% 1.8% 1.9% 1.3% 1.3% 1.4% 1.4% 1.4% National (Thousands) 2,570 2,589 2,611 2,632 2,654 2,683 2,708 2,736 2,765 % Ch 0.9% 0.7% 0.8% 0.8% 0.8% 1.1% 0.9% 1.1% 1.0%
NET MIGRATION Idaho (Thousands) 9.987 0.342 1.508 5.102 11.754 11.467 12.267 12.622 12.394
HOUSING HOUSING STARTS Idaho 5,190 4,565 7,132 9,071 9,833 9,887 11,076 12,275 12,573 % Ch -9.4% -12.1% 56.3% 27.2% 8.4% 0.6% 12.0% 10.8% 2.4% National (Millions) 0.586 0.612 0.784 0.930 1.001 1.121 1.308 1.463 1.509 % Ch 5.7% 4.5% 28.1% 18.6% 7.6% 12.1% 16.6% 11.9% 3.1%
SINGLE UNITS Idaho 4,651 3,959 6,030 7,739 7,377 8,095 9,340 10,718 11,012 % Ch -6.0% -14.9% 52.3% 28.3% -4.7% 9.7% 15.4% 14.8% 2.7% National (Millions) 0.471 0.434 0.537 0.621 0.646 0.735 0.882 1.042 1.075 % Ch 6.6% -7.9% 23.6% 15.7% 4.0% 13.7% 20.1% 18.1% 3.1%
MULTIPLE UNITS Idaho 539 606 1,102 1,333 2,455 1,792 1,736 1,557 1,561 % Ch -31.1% 12.5% 82.0% 20.9% 84.3% -27.0% -3.1% -10.3% 0.3% National (Millions) 0.114 0.178 0.247 0.309 0.355 0.387 0.425 0.421 0.434 % Ch 2.2% 55.7% 38.9% 25.1% 14.9% 9.1% 10.0% -0.9% 3.1%
HOUSING STOCK Idaho (Thousands) 546.4 549.2 553.7 560.3 568.4 576.4 585.3 595.4 606.1 % Ch 0.8% 0.5% 0.8% 1.2% 1.4% 1.4% 1.5% 1.7% 1.8%
DEMOGRAPHICS
APRIL 2015ANNUAL DETAIL
IDAHO ECONOMIC FORECAST
National Variables Forecast by IHS EconomicsForecast Begins the FIRST Quarter of 2015
35
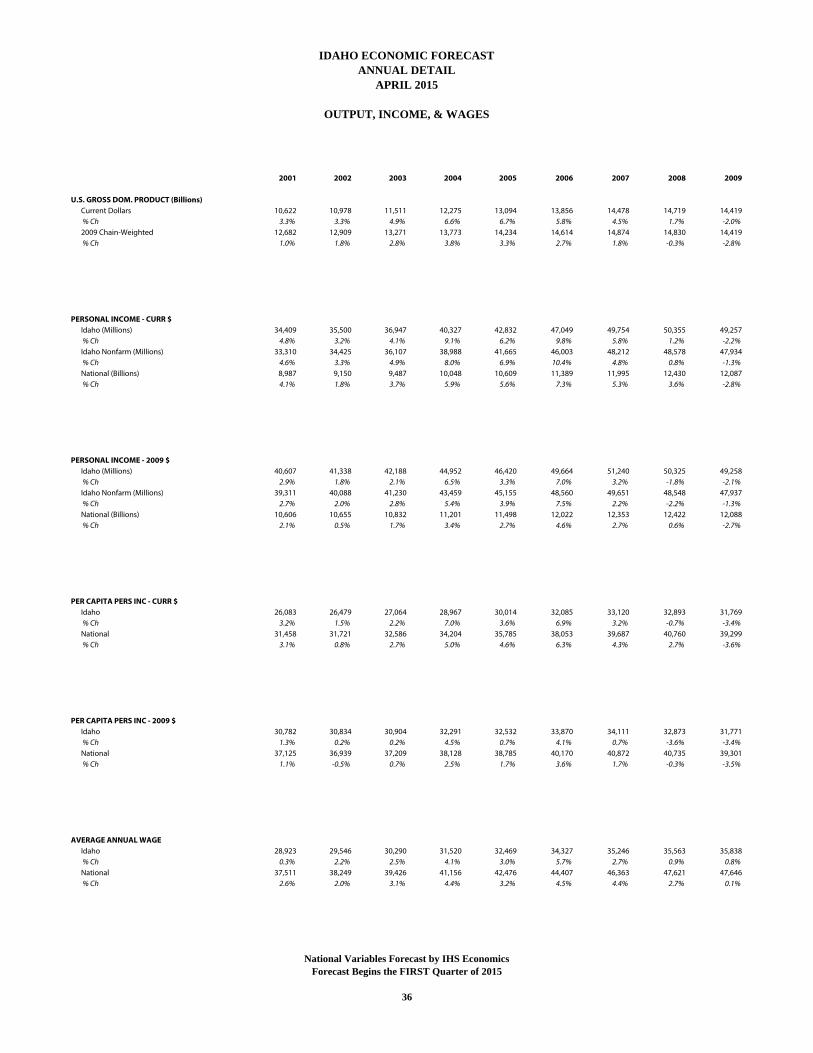
2001 2002 2003 2004 2005 2006 2007 2008 2009
U.S. GROSS DOM. PRODUCT (Billions) Current Dollars 10,622 10,978 11,511 12,275 13,094 13,856 14,478 14,719 14,419 % Ch 3.3% 3.3% 4.9% 6.6% 6.7% 5.8% 4.5% 1.7% -2.0% 2009 Chain-Weighted 12,682 12,909 13,271 13,773 14,234 14,614 14,874 14,830 14,419 % Ch 1.0% 1.8% 2.8% 3.8% 3.3% 2.7% 1.8% -0.3% -2.8%
PERSONAL INCOME - CURR $ Idaho (Millions) 34,409 35,500 36,947 40,327 42,832 47,049 49,754 50,355 49,257 % Ch 4.8% 3.2% 4.1% 9.1% 6.2% 9.8% 5.8% 1.2% -2.2% Idaho Nonfarm (Millions) 33,310 34,425 36,107 38,988 41,665 46,003 48,212 48,578 47,934 % Ch 4.6% 3.3% 4.9% 8.0% 6.9% 10.4% 4.8% 0.8% -1.3% National (Billions) 8,987 9,150 9,487 10,048 10,609 11,389 11,995 12,430 12,087 % Ch 4.1% 1.8% 3.7% 5.9% 5.6% 7.3% 5.3% 3.6% -2.8%
PERSONAL INCOME - 2009 $ Idaho (Millions) 40,607 41,338 42,188 44,952 46,420 49,664 51,240 50,325 49,258 % Ch 2.9% 1.8% 2.1% 6.5% 3.3% 7.0% 3.2% -1.8% -2.1% Idaho Nonfarm (Millions) 39,311 40,088 41,230 43,459 45,155 48,560 49,651 48,548 47,937 % Ch 2.7% 2.0% 2.8% 5.4% 3.9% 7.5% 2.2% -2.2% -1.3% National (Billions) 10,606 10,655 10,832 11,201 11,498 12,022 12,353 12,422 12,088 % Ch 2.1% 0.5% 1.7% 3.4% 2.7% 4.6% 2.7% 0.6% -2.7%
PER CAPITA PERS INC - CURR $ Idaho 26,083 26,479 27,064 28,967 30,014 32,085 33,120 32,893 31,769 % Ch 3.2% 1.5% 2.2% 7.0% 3.6% 6.9% 3.2% -0.7% -3.4% National 31,458 31,721 32,586 34,204 35,785 38,053 39,687 40,760 39,299 % Ch 3.1% 0.8% 2.7% 5.0% 4.6% 6.3% 4.3% 2.7% -3.6%
PER CAPITA PERS INC - 2009 $ Idaho 30,782 30,834 30,904 32,291 32,532 33,870 34,111 32,873 31,771 % Ch 1.3% 0.2% 0.2% 4.5% 0.7% 4.1% 0.7% -3.6% -3.4% National 37,125 36,939 37,209 38,128 38,785 40,170 40,872 40,735 39,301 % Ch 1.1% -0.5% 0.7% 2.5% 1.7% 3.6% 1.7% -0.3% -3.5%
AVERAGE ANNUAL WAGE Idaho 28,923 29,546 30,290 31,520 32,469 34,327 35,246 35,563 35,838 % Ch 0.3% 2.2% 2.5% 4.1% 3.0% 5.7% 2.7% 0.9% 0.8% National 37,511 38,249 39,426 41,156 42,476 44,407 46,363 47,621 47,646 % Ch 2.6% 2.0% 3.1% 4.4% 3.2% 4.5% 4.4% 2.7% 0.1%
ANNUAL DETAILAPRIL 2015
OUTPUT, INCOME, & WAGES
IDAHO ECONOMIC FORECAST
National Variables Forecast by IHS EconomicsForecast Begins the FIRST Quarter of 2015
36
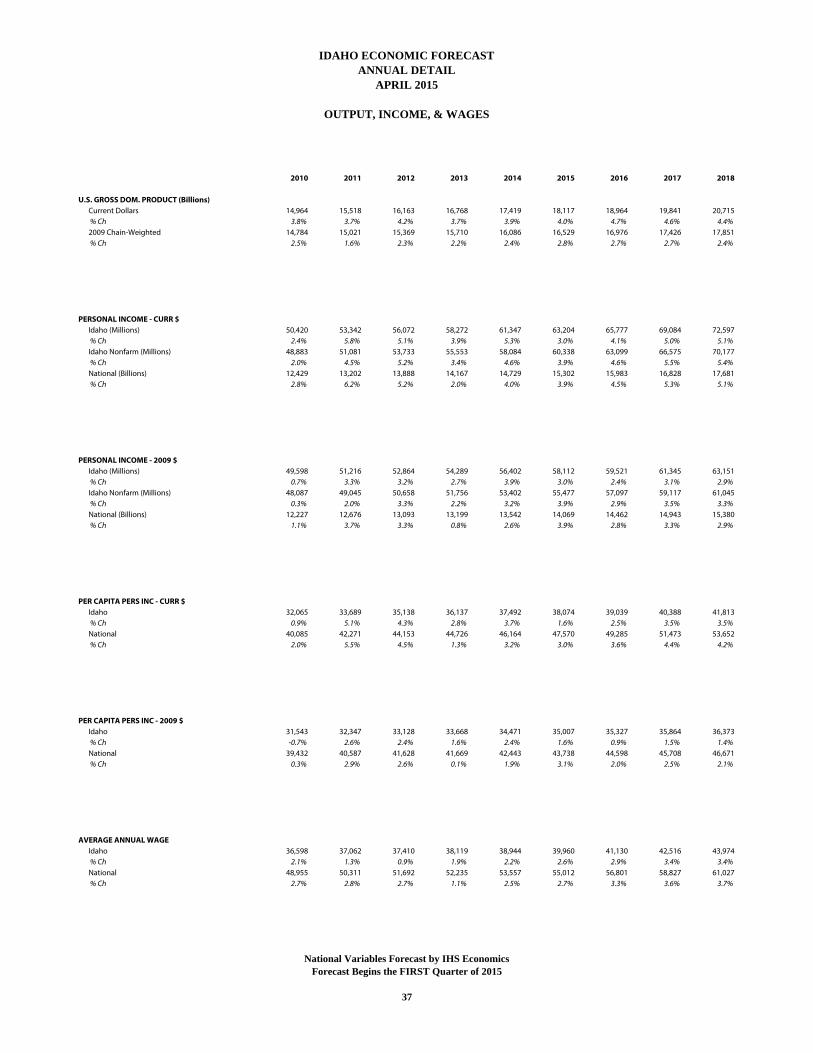
2010 2011 2012 2013 2014 2015 2016 2017 2018
U.S. GROSS DOM. PRODUCT (Billions) Current Dollars 14,964 15,518 16,163 16,768 17,419 18,117 18,964 19,841 20,715 % Ch 3.8% 3.7% 4.2% 3.7% 3.9% 4.0% 4.7% 4.6% 4.4% 2009 Chain-Weighted 14,784 15,021 15,369 15,710 16,086 16,529 16,976 17,426 17,851 % Ch 2.5% 1.6% 2.3% 2.2% 2.4% 2.8% 2.7% 2.7% 2.4%
PERSONAL INCOME - CURR $ Idaho (Millions) 50,420 53,342 56,072 58,272 61,347 63,204 65,777 69,084 72,597 % Ch 2.4% 5.8% 5.1% 3.9% 5.3% 3.0% 4.1% 5.0% 5.1% Idaho Nonfarm (Millions) 48,883 51,081 53,733 55,553 58,084 60,338 63,099 66,575 70,177 % Ch 2.0% 4.5% 5.2% 3.4% 4.6% 3.9% 4.6% 5.5% 5.4% National (Billions) 12,429 13,202 13,888 14,167 14,729 15,302 15,983 16,828 17,681 % Ch 2.8% 6.2% 5.2% 2.0% 4.0% 3.9% 4.5% 5.3% 5.1%
PERSONAL INCOME - 2009 $ Idaho (Millions) 49,598 51,216 52,864 54,289 56,402 58,112 59,521 61,345 63,151 % Ch 0.7% 3.3% 3.2% 2.7% 3.9% 3.0% 2.4% 3.1% 2.9% Idaho Nonfarm (Millions) 48,087 49,045 50,658 51,756 53,402 55,477 57,097 59,117 61,045 % Ch 0.3% 2.0% 3.3% 2.2% 3.2% 3.9% 2.9% 3.5% 3.3% National (Billions) 12,227 12,676 13,093 13,199 13,542 14,069 14,462 14,943 15,380 % Ch 1.1% 3.7% 3.3% 0.8% 2.6% 3.9% 2.8% 3.3% 2.9%
PER CAPITA PERS INC - CURR $ Idaho 32,065 33,689 35,138 36,137 37,492 38,074 39,039 40,388 41,813 % Ch 0.9% 5.1% 4.3% 2.8% 3.7% 1.6% 2.5% 3.5% 3.5% National 40,085 42,271 44,153 44,726 46,164 47,570 49,285 51,473 53,652 % Ch 2.0% 5.5% 4.5% 1.3% 3.2% 3.0% 3.6% 4.4% 4.2%
PER CAPITA PERS INC - 2009 $ Idaho 31,543 32,347 33,128 33,668 34,471 35,007 35,327 35,864 36,373 % Ch -0.7% 2.6% 2.4% 1.6% 2.4% 1.6% 0.9% 1.5% 1.4% National 39,432 40,587 41,628 41,669 42,443 43,738 44,598 45,708 46,671 % Ch 0.3% 2.9% 2.6% 0.1% 1.9% 3.1% 2.0% 2.5% 2.1%
AVERAGE ANNUAL WAGE Idaho 36,598 37,062 37,410 38,119 38,944 39,960 41,130 42,516 43,974 % Ch 2.1% 1.3% 0.9% 1.9% 2.2% 2.6% 2.9% 3.4% 3.4% National 48,955 50,311 51,692 52,235 53,557 55,012 56,801 58,827 61,027 % Ch 2.7% 2.8% 2.7% 1.1% 2.5% 2.7% 3.3% 3.6% 3.7%
ANNUAL DETAILAPRIL 2015
OUTPUT, INCOME, & WAGES
IDAHO ECONOMIC FORECAST
National Variables Forecast by IHS EconomicsForecast Begins the FIRST Quarter of 2015
37
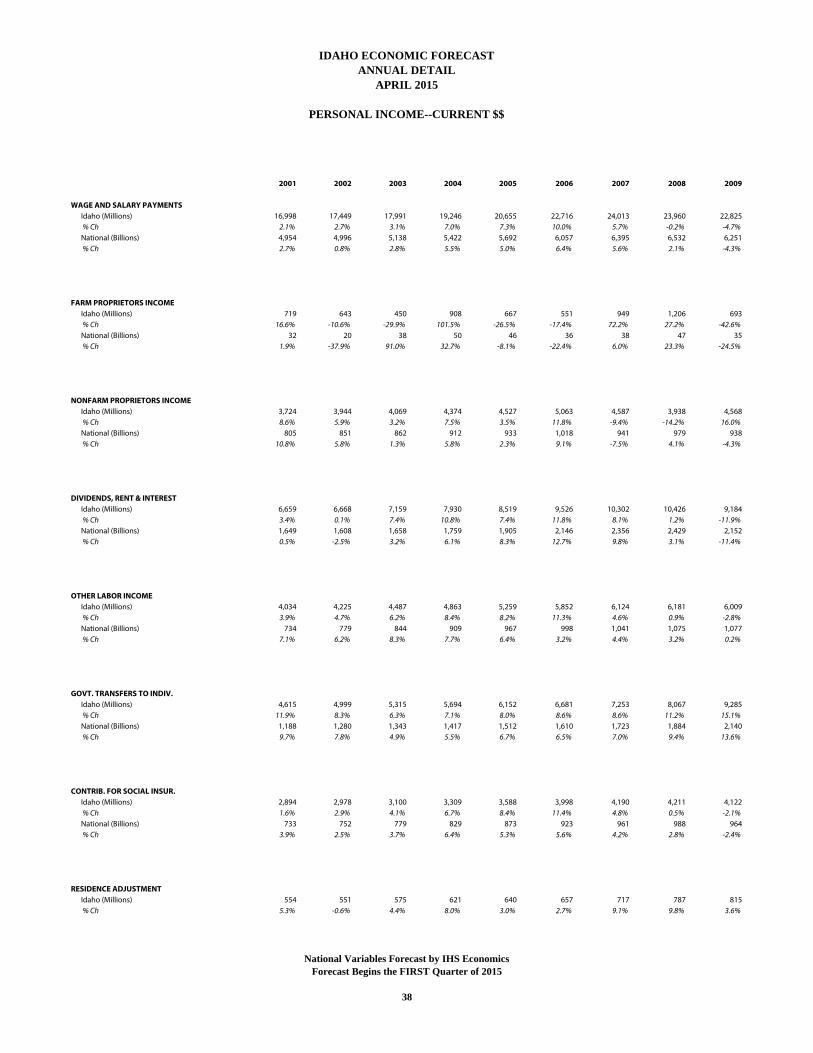
2001 2002 2003 2004 2005 2006 2007 2008 2009
WAGE AND SALARY PAYMENTS Idaho (Millions) 16,998 17,449 17,991 19,246 20,655 22,716 24,013 23,960 22,825 % Ch 2.1% 2.7% 3.1% 7.0% 7.3% 10.0% 5.7% -0.2% -4.7% National (Billions) 4,954 4,996 5,138 5,422 5,692 6,057 6,395 6,532 6,251 % Ch 2.7% 0.8% 2.8% 5.5% 5.0% 6.4% 5.6% 2.1% -4.3%
FARM PROPRIETORS INCOME Idaho (Millions) 719 643 450 908 667 551 949 1,206 693 % Ch 16.6% -10.6% -29.9% 101.5% -26.5% -17.4% 72.2% 27.2% -42.6% National (Billions) 32 20 38 50 46 36 38 47 35 % Ch 1.9% -37.9% 91.0% 32.7% -8.1% -22.4% 6.0% 23.3% -24.5%
NONFARM PROPRIETORS INCOME Idaho (Millions) 3,724 3,944 4,069 4,374 4,527 5,063 4,587 3,938 4,568 % Ch 8.6% 5.9% 3.2% 7.5% 3.5% 11.8% -9.4% -14.2% 16.0% National (Billions) 805 851 862 912 933 1,018 941 979 938 % Ch 10.8% 5.8% 1.3% 5.8% 2.3% 9.1% -7.5% 4.1% -4.3%
DIVIDENDS, RENT & INTEREST Idaho (Millions) 6,659 6,668 7,159 7,930 8,519 9,526 10,302 10,426 9,184 % Ch 3.4% 0.1% 7.4% 10.8% 7.4% 11.8% 8.1% 1.2% -11.9% National (Billions) 1,649 1,608 1,658 1,759 1,905 2,146 2,356 2,429 2,152 % Ch 0.5% -2.5% 3.2% 6.1% 8.3% 12.7% 9.8% 3.1% -11.4%
OTHER LABOR INCOME Idaho (Millions) 4,034 4,225 4,487 4,863 5,259 5,852 6,124 6,181 6,009 % Ch 3.9% 4.7% 6.2% 8.4% 8.2% 11.3% 4.6% 0.9% -2.8% National (Billions) 734 779 844 909 967 998 1,041 1,075 1,077 % Ch 7.1% 6.2% 8.3% 7.7% 6.4% 3.2% 4.4% 3.2% 0.2%
GOVT. TRANSFERS TO INDIV. Idaho (Millions) 4,615 4,999 5,315 5,694 6,152 6,681 7,253 8,067 9,285 % Ch 11.9% 8.3% 6.3% 7.1% 8.0% 8.6% 8.6% 11.2% 15.1% National (Billions) 1,188 1,280 1,343 1,417 1,512 1,610 1,723 1,884 2,140 % Ch 9.7% 7.8% 4.9% 5.5% 6.7% 6.5% 7.0% 9.4% 13.6%
CONTRIB. FOR SOCIAL INSUR. Idaho (Millions) 2,894 2,978 3,100 3,309 3,588 3,998 4,190 4,211 4,122 % Ch 1.6% 2.9% 4.1% 6.7% 8.4% 11.4% 4.8% 0.5% -2.1% National (Billions) 733 752 779 829 873 923 961 988 964 % Ch 3.9% 2.5% 3.7% 6.4% 5.3% 5.6% 4.2% 2.8% -2.4%
RESIDENCE ADJUSTMENT Idaho (Millions) 554 551 575 621 640 657 717 787 815 % Ch 5.3% -0.6% 4.4% 8.0% 3.0% 2.7% 9.1% 9.8% 3.6%
PERSONAL INCOME--CURRENT $$
IDAHO ECONOMIC FORECASTANNUAL DETAIL
APRIL 2015
National Variables Forecast by IHS EconomicsForecast Begins the FIRST Quarter of 2015
38
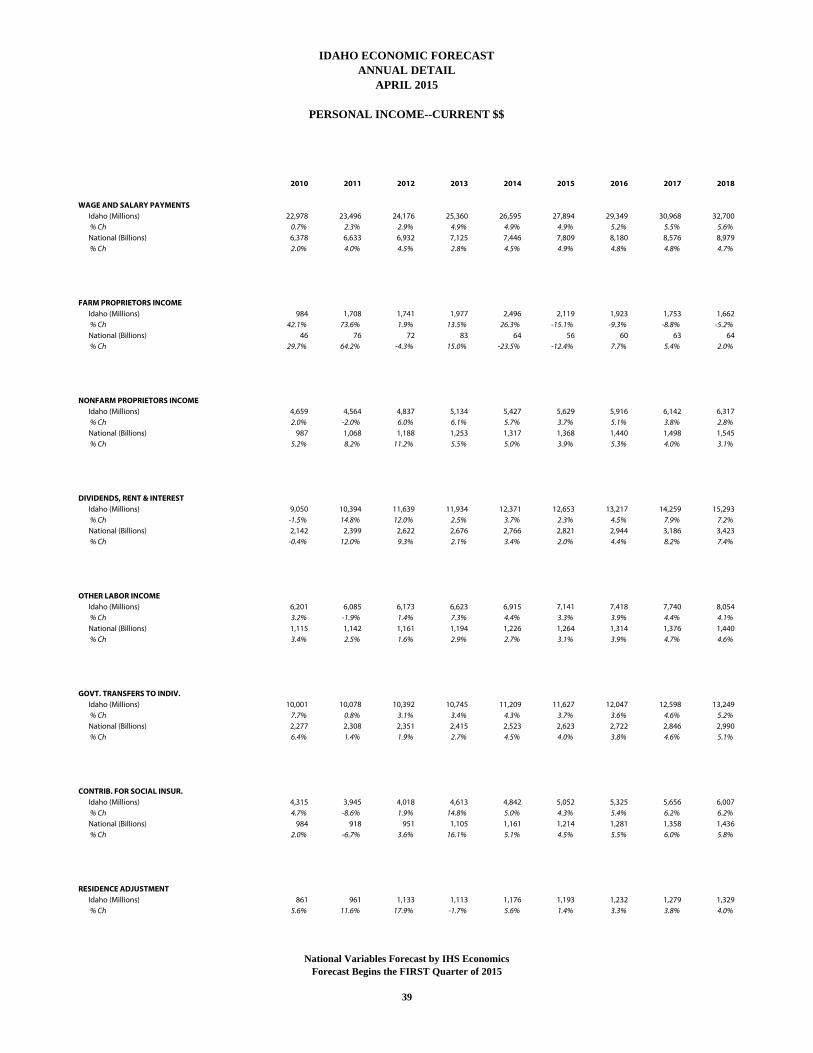
2010 2011 2012 2013 2014 2015 2016 2017 2018
WAGE AND SALARY PAYMENTS Idaho (Millions) 22,978 23,496 24,176 25,360 26,595 27,894 29,349 30,968 32,700 % Ch 0.7% 2.3% 2.9% 4.9% 4.9% 4.9% 5.2% 5.5% 5.6% National (Billions) 6,378 6,633 6,932 7,125 7,446 7,809 8,180 8,576 8,979 % Ch 2.0% 4.0% 4.5% 2.8% 4.5% 4.9% 4.8% 4.8% 4.7%
FARM PROPRIETORS INCOME Idaho (Millions) 984 1,708 1,741 1,977 2,496 2,119 1,923 1,753 1,662 % Ch 42.1% 73.6% 1.9% 13.5% 26.3% -15.1% -9.3% -8.8% -5.2% National (Billions) 46 76 72 83 64 56 60 63 64 % Ch 29.7% 64.2% -4.3% 15.0% -23.5% -12.4% 7.7% 5.4% 2.0%
NONFARM PROPRIETORS INCOME Idaho (Millions) 4,659 4,564 4,837 5,134 5,427 5,629 5,916 6,142 6,317 % Ch 2.0% -2.0% 6.0% 6.1% 5.7% 3.7% 5.1% 3.8% 2.8% National (Billions) 987 1,068 1,188 1,253 1,317 1,368 1,440 1,498 1,545 % Ch 5.2% 8.2% 11.2% 5.5% 5.0% 3.9% 5.3% 4.0% 3.1%
DIVIDENDS, RENT & INTEREST Idaho (Millions) 9,050 10,394 11,639 11,934 12,371 12,653 13,217 14,259 15,293 % Ch -1.5% 14.8% 12.0% 2.5% 3.7% 2.3% 4.5% 7.9% 7.2% National (Billions) 2,142 2,399 2,622 2,676 2,766 2,821 2,944 3,186 3,423 % Ch -0.4% 12.0% 9.3% 2.1% 3.4% 2.0% 4.4% 8.2% 7.4%
OTHER LABOR INCOME Idaho (Millions) 6,201 6,085 6,173 6,623 6,915 7,141 7,418 7,740 8,054 % Ch 3.2% -1.9% 1.4% 7.3% 4.4% 3.3% 3.9% 4.4% 4.1% National (Billions) 1,115 1,142 1,161 1,194 1,226 1,264 1,314 1,376 1,440 % Ch 3.4% 2.5% 1.6% 2.9% 2.7% 3.1% 3.9% 4.7% 4.6%
GOVT. TRANSFERS TO INDIV. Idaho (Millions) 10,001 10,078 10,392 10,745 11,209 11,627 12,047 12,598 13,249 % Ch 7.7% 0.8% 3.1% 3.4% 4.3% 3.7% 3.6% 4.6% 5.2% National (Billions) 2,277 2,308 2,351 2,415 2,523 2,623 2,722 2,846 2,990 % Ch 6.4% 1.4% 1.9% 2.7% 4.5% 4.0% 3.8% 4.6% 5.1%
CONTRIB. FOR SOCIAL INSUR. Idaho (Millions) 4,315 3,945 4,018 4,613 4,842 5,052 5,325 5,656 6,007 % Ch 4.7% -8.6% 1.9% 14.8% 5.0% 4.3% 5.4% 6.2% 6.2% National (Billions) 984 918 951 1,105 1,161 1,214 1,281 1,358 1,436 % Ch 2.0% -6.7% 3.6% 16.1% 5.1% 4.5% 5.5% 6.0% 5.8%
RESIDENCE ADJUSTMENT Idaho (Millions) 861 961 1,133 1,113 1,176 1,193 1,232 1,279 1,329 % Ch 5.6% 11.6% 17.9% -1.7% 5.6% 1.4% 3.3% 3.8% 4.0%
PERSONAL INCOME--CURRENT $$
IDAHO ECONOMIC FORECASTANNUAL DETAIL
APRIL 2015
National Variables Forecast by IHS EconomicsForecast Begins the FIRST Quarter of 2015
39
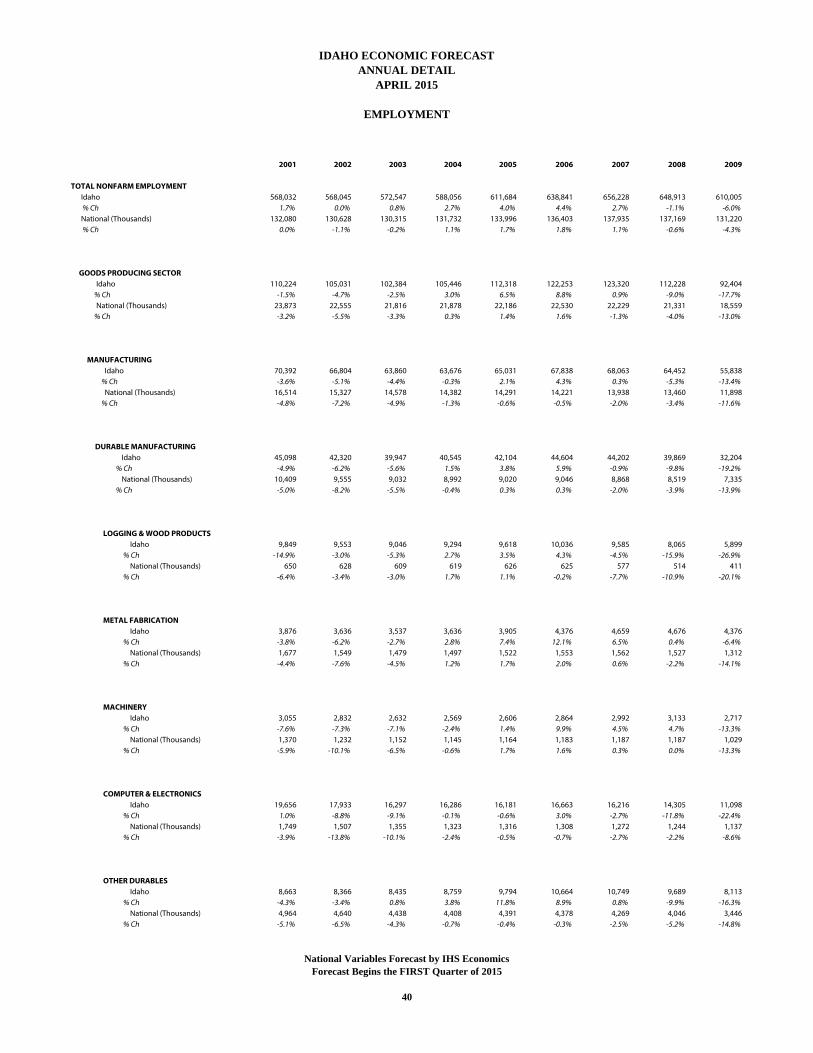
2001 2002 2003 2004 2005 2006 2007 2008 2009
TOTAL NONFARM EMPLOYMENT Idaho 568,032 568,045 572,547 588,056 611,684 638,841 656,228 648,913 610,005 % Ch 1.7% 0.0% 0.8% 2.7% 4.0% 4.4% 2.7% -1.1% -6.0% National (Thousands) 132,080 130,628 130,315 131,732 133,996 136,403 137,935 137,169 131,220 % Ch 0.0% -1.1% -0.2% 1.1% 1.7% 1.8% 1.1% -0.6% -4.3%
GOODS PRODUCING SECTOR Idaho 110,224 105,031 102,384 105,446 112,318 122,253 123,320 112,228 92,404 % Ch -1.5% -4.7% -2.5% 3.0% 6.5% 8.8% 0.9% -9.0% -17.7% National (Thousands) 23,873 22,555 21,816 21,878 22,186 22,530 22,229 21,331 18,559 % Ch -3.2% -5.5% -3.3% 0.3% 1.4% 1.6% -1.3% -4.0% -13.0%
MANUFACTURING Idaho 70,392 66,804 63,860 63,676 65,031 67,838 68,063 64,452 55,838 % Ch -3.6% -5.1% -4.4% -0.3% 2.1% 4.3% 0.3% -5.3% -13.4% National (Thousands) 16,514 15,327 14,578 14,382 14,291 14,221 13,938 13,460 11,898 % Ch -4.8% -7.2% -4.9% -1.3% -0.6% -0.5% -2.0% -3.4% -11.6%
DURABLE MANUFACTURING Idaho 45,098 42,320 39,947 40,545 42,104 44,604 44,202 39,869 32,204 % Ch -4.9% -6.2% -5.6% 1.5% 3.8% 5.9% -0.9% -9.8% -19.2% National (Thousands) 10,409 9,555 9,032 8,992 9,020 9,046 8,868 8,519 7,335 % Ch -5.0% -8.2% -5.5% -0.4% 0.3% 0.3% -2.0% -3.9% -13.9%
LOGGING & WOOD PRODUCTS Idaho 9,849 9,553 9,046 9,294 9,618 10,036 9,585 8,065 5,899 % Ch -14.9% -3.0% -5.3% 2.7% 3.5% 4.3% -4.5% -15.9% -26.9% National (Thousands) 650 628 609 619 626 625 577 514 411 % Ch -6.4% -3.4% -3.0% 1.7% 1.1% -0.2% -7.7% -10.9% -20.1%
METAL FABRICATION Idaho 3,876 3,636 3,537 3,636 3,905 4,376 4,659 4,676 4,376 % Ch -3.8% -6.2% -2.7% 2.8% 7.4% 12.1% 6.5% 0.4% -6.4% National (Thousands) 1,677 1,549 1,479 1,497 1,522 1,553 1,562 1,527 1,312 % Ch -4.4% -7.6% -4.5% 1.2% 1.7% 2.0% 0.6% -2.2% -14.1%
MACHINERY Idaho 3,055 2,832 2,632 2,569 2,606 2,864 2,992 3,133 2,717 % Ch -7.6% -7.3% -7.1% -2.4% 1.4% 9.9% 4.5% 4.7% -13.3% National (Thousands) 1,370 1,232 1,152 1,145 1,164 1,183 1,187 1,187 1,029 % Ch -5.9% -10.1% -6.5% -0.6% 1.7% 1.6% 0.3% 0.0% -13.3%
COMPUTER & ELECTRONICS Idaho 19,656 17,933 16,297 16,286 16,181 16,663 16,216 14,305 11,098 % Ch 1.0% -8.8% -9.1% -0.1% -0.6% 3.0% -2.7% -11.8% -22.4% National (Thousands) 1,749 1,507 1,355 1,323 1,316 1,308 1,272 1,244 1,137 % Ch -3.9% -13.8% -10.1% -2.4% -0.5% -0.7% -2.7% -2.2% -8.6%
OTHER DURABLES Idaho 8,663 8,366 8,435 8,759 9,794 10,664 10,749 9,689 8,113 % Ch -4.3% -3.4% 0.8% 3.8% 11.8% 8.9% 0.8% -9.9% -16.3% National (Thousands) 4,964 4,640 4,438 4,408 4,391 4,378 4,269 4,046 3,446 % Ch -5.1% -6.5% -4.3% -0.7% -0.4% -0.3% -2.5% -5.2% -14.8%
EMPLOYMENT
APRIL 2015
IDAHO ECONOMIC FORECASTANNUAL DETAIL
National Variables Forecast by IHS EconomicsForecast Begins the FIRST Quarter of 2015
40
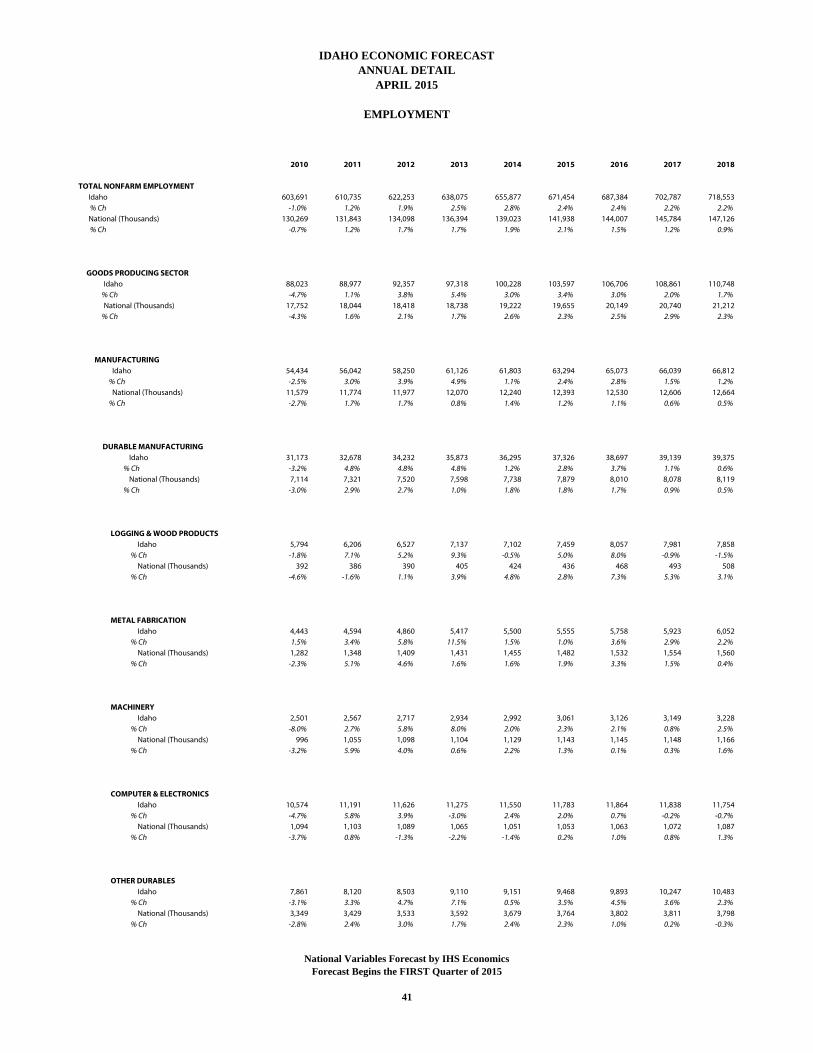
2010 2011 2012 2013 2014 2015 2016 2017 2018
TOTAL NONFARM EMPLOYMENT Idaho 603,691 610,735 622,253 638,075 655,877 671,454 687,384 702,787 718,553 % Ch -1.0% 1.2% 1.9% 2.5% 2.8% 2.4% 2.4% 2.2% 2.2% National (Thousands) 130,269 131,843 134,098 136,394 139,023 141,938 144,007 145,784 147,126 % Ch -0.7% 1.2% 1.7% 1.7% 1.9% 2.1% 1.5% 1.2% 0.9%
GOODS PRODUCING SECTOR Idaho 88,023 88,977 92,357 97,318 100,228 103,597 106,706 108,861 110,748 % Ch -4.7% 1.1% 3.8% 5.4% 3.0% 3.4% 3.0% 2.0% 1.7% National (Thousands) 17,752 18,044 18,418 18,738 19,222 19,655 20,149 20,740 21,212 % Ch -4.3% 1.6% 2.1% 1.7% 2.6% 2.3% 2.5% 2.9% 2.3%
MANUFACTURING Idaho 54,434 56,042 58,250 61,126 61,803 63,294 65,073 66,039 66,812 % Ch -2.5% 3.0% 3.9% 4.9% 1.1% 2.4% 2.8% 1.5% 1.2% National (Thousands) 11,579 11,774 11,977 12,070 12,240 12,393 12,530 12,606 12,664 % Ch -2.7% 1.7% 1.7% 0.8% 1.4% 1.2% 1.1% 0.6% 0.5%
DURABLE MANUFACTURING Idaho 31,173 32,678 34,232 35,873 36,295 37,326 38,697 39,139 39,375 % Ch -3.2% 4.8% 4.8% 4.8% 1.2% 2.8% 3.7% 1.1% 0.6% National (Thousands) 7,114 7,321 7,520 7,598 7,738 7,879 8,010 8,078 8,119 % Ch -3.0% 2.9% 2.7% 1.0% 1.8% 1.8% 1.7% 0.9% 0.5%
LOGGING & WOOD PRODUCTS Idaho 5,794 6,206 6,527 7,137 7,102 7,459 8,057 7,981 7,858 % Ch -1.8% 7.1% 5.2% 9.3% -0.5% 5.0% 8.0% -0.9% -1.5% National (Thousands) 392 386 390 405 424 436 468 493 508 % Ch -4.6% -1.6% 1.1% 3.9% 4.8% 2.8% 7.3% 5.3% 3.1%
METAL FABRICATION Idaho 4,443 4,594 4,860 5,417 5,500 5,555 5,758 5,923 6,052 % Ch 1.5% 3.4% 5.8% 11.5% 1.5% 1.0% 3.6% 2.9% 2.2% National (Thousands) 1,282 1,348 1,409 1,431 1,455 1,482 1,532 1,554 1,560 % Ch -2.3% 5.1% 4.6% 1.6% 1.6% 1.9% 3.3% 1.5% 0.4%
MACHINERY Idaho 2,501 2,567 2,717 2,934 2,992 3,061 3,126 3,149 3,228 % Ch -8.0% 2.7% 5.8% 8.0% 2.0% 2.3% 2.1% 0.8% 2.5% National (Thousands) 996 1,055 1,098 1,104 1,129 1,143 1,145 1,148 1,166 % Ch -3.2% 5.9% 4.0% 0.6% 2.2% 1.3% 0.1% 0.3% 1.6%
COMPUTER & ELECTRONICS Idaho 10,574 11,191 11,626 11,275 11,550 11,783 11,864 11,838 11,754 % Ch -4.7% 5.8% 3.9% -3.0% 2.4% 2.0% 0.7% -0.2% -0.7% National (Thousands) 1,094 1,103 1,089 1,065 1,051 1,053 1,063 1,072 1,087 % Ch -3.7% 0.8% -1.3% -2.2% -1.4% 0.2% 1.0% 0.8% 1.3%
OTHER DURABLES Idaho 7,861 8,120 8,503 9,110 9,151 9,468 9,893 10,247 10,483 % Ch -3.1% 3.3% 4.7% 7.1% 0.5% 3.5% 4.5% 3.6% 2.3% National (Thousands) 3,349 3,429 3,533 3,592 3,679 3,764 3,802 3,811 3,798 % Ch -2.8% 2.4% 3.0% 1.7% 2.4% 2.3% 1.0% 0.2% -0.3%
APRIL 2015
EMPLOYMENT
IDAHO ECONOMIC FORECASTANNUAL DETAIL
National Variables Forecast by IHS EconomicsForecast Begins the FIRST Quarter of 2015
41
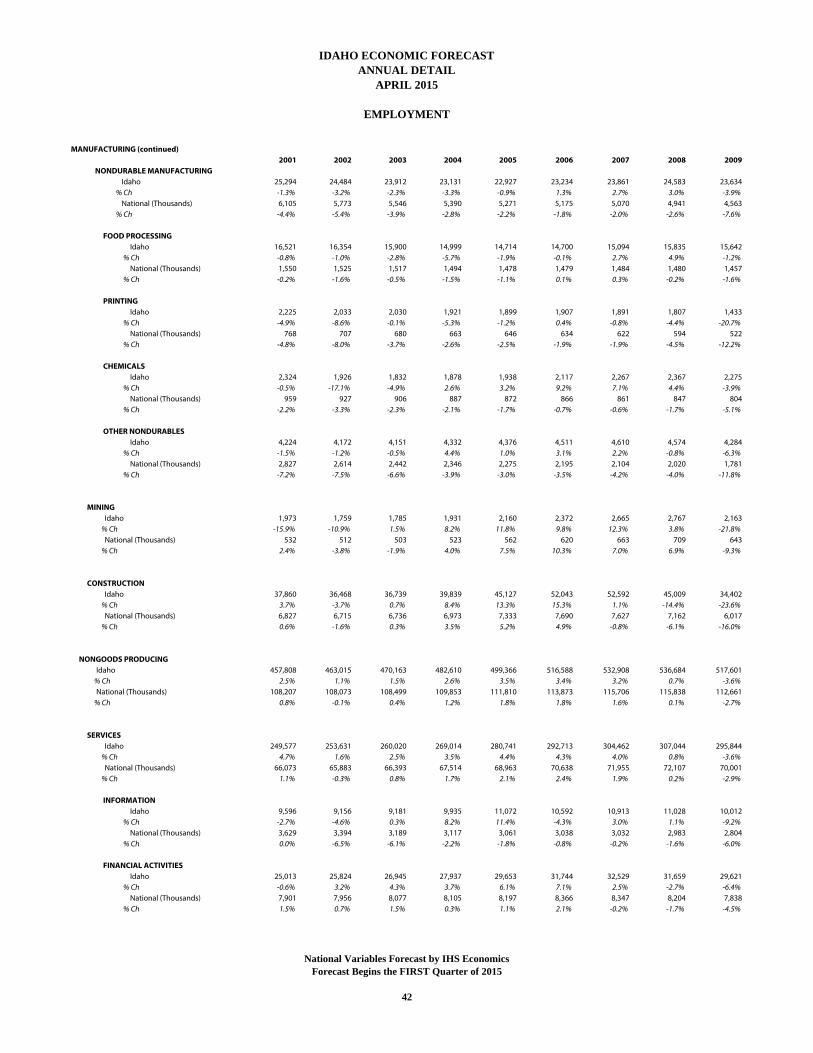
MANUFACTURING (continued)2001 2002 2003 2004 2005 2006 2007 2008 2009
NONDURABLE MANUFACTURING Idaho 25,294 24,484 23,912 23,131 22,927 23,234 23,861 24,583 23,634 % Ch -1.3% -3.2% -2.3% -3.3% -0.9% 1.3% 2.7% 3.0% -3.9% National (Thousands) 6,105 5,773 5,546 5,390 5,271 5,175 5,070 4,941 4,563 % Ch -4.4% -5.4% -3.9% -2.8% -2.2% -1.8% -2.0% -2.6% -7.6%
FOOD PROCESSING Idaho 16,521 16,354 15,900 14,999 14,714 14,700 15,094 15,835 15,642 % Ch -0.8% -1.0% -2.8% -5.7% -1.9% -0.1% 2.7% 4.9% -1.2% National (Thousands) 1,550 1,525 1,517 1,494 1,478 1,479 1,484 1,480 1,457 % Ch -0.2% -1.6% -0.5% -1.5% -1.1% 0.1% 0.3% -0.2% -1.6%
PRINTING Idaho 2,225 2,033 2,030 1,921 1,899 1,907 1,891 1,807 1,433 % Ch -4.9% -8.6% -0.1% -5.3% -1.2% 0.4% -0.8% -4.4% -20.7% National (Thousands) 768 707 680 663 646 634 622 594 522 % Ch -4.8% -8.0% -3.7% -2.6% -2.5% -1.9% -1.9% -4.5% -12.2%
CHEMICALS Idaho 2,324 1,926 1,832 1,878 1,938 2,117 2,267 2,367 2,275 % Ch -0.5% -17.1% -4.9% 2.6% 3.2% 9.2% 7.1% 4.4% -3.9% National (Thousands) 959 927 906 887 872 866 861 847 804 % Ch -2.2% -3.3% -2.3% -2.1% -1.7% -0.7% -0.6% -1.7% -5.1%
OTHER NONDURABLES Idaho 4,224 4,172 4,151 4,332 4,376 4,511 4,610 4,574 4,284 % Ch -1.5% -1.2% -0.5% 4.4% 1.0% 3.1% 2.2% -0.8% -6.3% National (Thousands) 2,827 2,614 2,442 2,346 2,275 2,195 2,104 2,020 1,781 % Ch -7.2% -7.5% -6.6% -3.9% -3.0% -3.5% -4.2% -4.0% -11.8%
MINING Idaho 1,973 1,759 1,785 1,931 2,160 2,372 2,665 2,767 2,163 % Ch -15.9% -10.9% 1.5% 8.2% 11.8% 9.8% 12.3% 3.8% -21.8% National (Thousands) 532 512 503 523 562 620 663 709 643 % Ch 2.4% -3.8% -1.9% 4.0% 7.5% 10.3% 7.0% 6.9% -9.3%
CONSTRUCTION Idaho 37,860 36,468 36,739 39,839 45,127 52,043 52,592 45,009 34,402 % Ch 3.7% -3.7% 0.7% 8.4% 13.3% 15.3% 1.1% -14.4% -23.6% National (Thousands) 6,827 6,715 6,736 6,973 7,333 7,690 7,627 7,162 6,017 % Ch 0.6% -1.6% 0.3% 3.5% 5.2% 4.9% -0.8% -6.1% -16.0%
NONGOODS PRODUCING Idaho 457,808 463,015 470,163 482,610 499,366 516,588 532,908 536,684 517,601 % Ch 2.5% 1.1% 1.5% 2.6% 3.5% 3.4% 3.2% 0.7% -3.6% National (Thousands) 108,207 108,073 108,499 109,853 111,810 113,873 115,706 115,838 112,661 % Ch 0.8% -0.1% 0.4% 1.2% 1.8% 1.8% 1.6% 0.1% -2.7%
SERVICES Idaho 249,577 253,631 260,020 269,014 280,741 292,713 304,462 307,044 295,844 % Ch 4.7% 1.6% 2.5% 3.5% 4.4% 4.3% 4.0% 0.8% -3.6% National (Thousands) 66,073 65,883 66,393 67,514 68,963 70,638 71,955 72,107 70,001 % Ch 1.1% -0.3% 0.8% 1.7% 2.1% 2.4% 1.9% 0.2% -2.9%
INFORMATION Idaho 9,596 9,156 9,181 9,935 11,072 10,592 10,913 11,028 10,012 % Ch -2.7% -4.6% 0.3% 8.2% 11.4% -4.3% 3.0% 1.1% -9.2% National (Thousands) 3,629 3,394 3,189 3,117 3,061 3,038 3,032 2,983 2,804 % Ch 0.0% -6.5% -6.1% -2.2% -1.8% -0.8% -0.2% -1.6% -6.0%
FINANCIAL ACTIVITIES Idaho 25,013 25,824 26,945 27,937 29,653 31,744 32,529 31,659 29,621 % Ch -0.6% 3.2% 4.3% 3.7% 6.1% 7.1% 2.5% -2.7% -6.4% National (Thousands) 7,901 7,956 8,077 8,105 8,197 8,366 8,347 8,204 7,838 % Ch 1.5% 0.7% 1.5% 0.3% 1.1% 2.1% -0.2% -1.7% -4.5%
APRIL 2015
EMPLOYMENT
ANNUAL DETAILIDAHO ECONOMIC FORECAST
National Variables Forecast by IHS EconomicsForecast Begins the FIRST Quarter of 2015
42
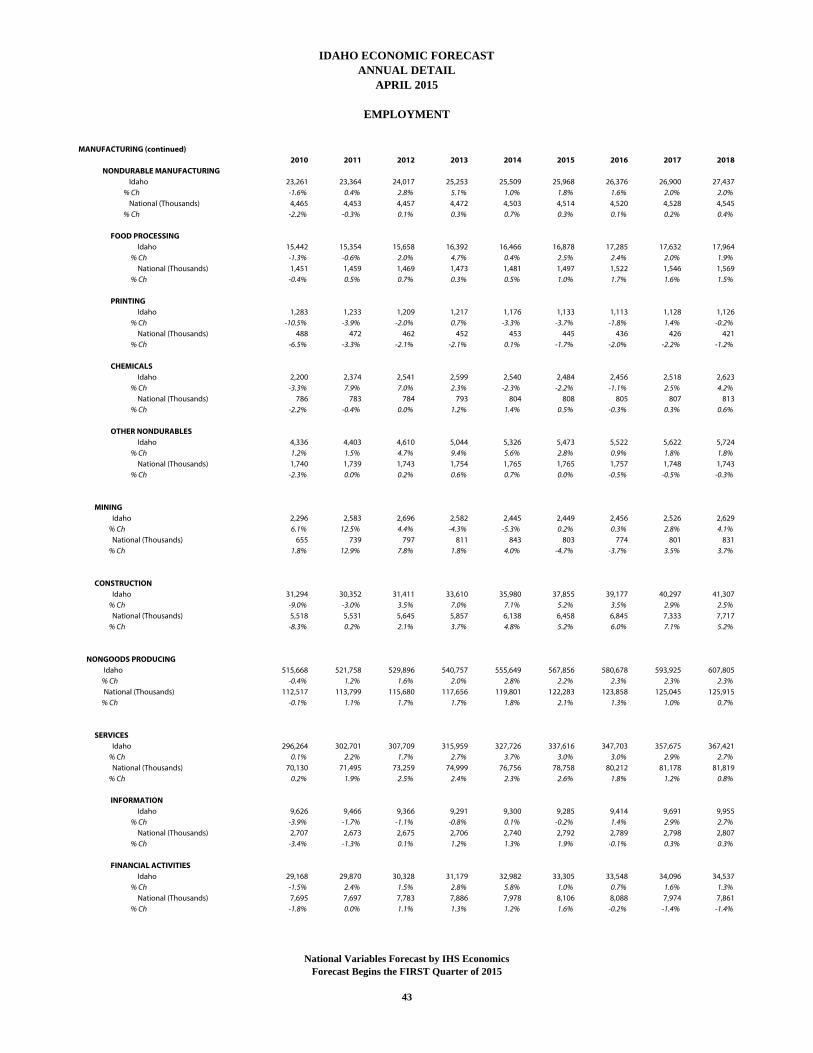
MANUFACTURING (continued)2010 2011 2012 2013 2014 2015 2016 2017 2018
NONDURABLE MANUFACTURING Idaho 23,261 23,364 24,017 25,253 25,509 25,968 26,376 26,900 27,437 % Ch -1.6% 0.4% 2.8% 5.1% 1.0% 1.8% 1.6% 2.0% 2.0% National (Thousands) 4,465 4,453 4,457 4,472 4,503 4,514 4,520 4,528 4,545 % Ch -2.2% -0.3% 0.1% 0.3% 0.7% 0.3% 0.1% 0.2% 0.4%
FOOD PROCESSING Idaho 15,442 15,354 15,658 16,392 16,466 16,878 17,285 17,632 17,964 % Ch -1.3% -0.6% 2.0% 4.7% 0.4% 2.5% 2.4% 2.0% 1.9% National (Thousands) 1,451 1,459 1,469 1,473 1,481 1,497 1,522 1,546 1,569 % Ch -0.4% 0.5% 0.7% 0.3% 0.5% 1.0% 1.7% 1.6% 1.5%
PRINTING Idaho 1,283 1,233 1,209 1,217 1,176 1,133 1,113 1,128 1,126 % Ch -10.5% -3.9% -2.0% 0.7% -3.3% -3.7% -1.8% 1.4% -0.2% National (Thousands) 488 472 462 452 453 445 436 426 421 % Ch -6.5% -3.3% -2.1% -2.1% 0.1% -1.7% -2.0% -2.2% -1.2%
CHEMICALS Idaho 2,200 2,374 2,541 2,599 2,540 2,484 2,456 2,518 2,623 % Ch -3.3% 7.9% 7.0% 2.3% -2.3% -2.2% -1.1% 2.5% 4.2% National (Thousands) 786 783 784 793 804 808 805 807 813 % Ch -2.2% -0.4% 0.0% 1.2% 1.4% 0.5% -0.3% 0.3% 0.6%
OTHER NONDURABLES Idaho 4,336 4,403 4,610 5,044 5,326 5,473 5,522 5,622 5,724 % Ch 1.2% 1.5% 4.7% 9.4% 5.6% 2.8% 0.9% 1.8% 1.8% National (Thousands) 1,740 1,739 1,743 1,754 1,765 1,765 1,757 1,748 1,743 % Ch -2.3% 0.0% 0.2% 0.6% 0.7% 0.0% -0.5% -0.5% -0.3%
MINING Idaho 2,296 2,583 2,696 2,582 2,445 2,449 2,456 2,526 2,629 % Ch 6.1% 12.5% 4.4% -4.3% -5.3% 0.2% 0.3% 2.8% 4.1% National (Thousands) 655 739 797 811 843 803 774 801 831 % Ch 1.8% 12.9% 7.8% 1.8% 4.0% -4.7% -3.7% 3.5% 3.7%
CONSTRUCTION Idaho 31,294 30,352 31,411 33,610 35,980 37,855 39,177 40,297 41,307 % Ch -9.0% -3.0% 3.5% 7.0% 7.1% 5.2% 3.5% 2.9% 2.5% National (Thousands) 5,518 5,531 5,645 5,857 6,138 6,458 6,845 7,333 7,717 % Ch -8.3% 0.2% 2.1% 3.7% 4.8% 5.2% 6.0% 7.1% 5.2%
NONGOODS PRODUCING Idaho 515,668 521,758 529,896 540,757 555,649 567,856 580,678 593,925 607,805 % Ch -0.4% 1.2% 1.6% 2.0% 2.8% 2.2% 2.3% 2.3% 2.3% National (Thousands) 112,517 113,799 115,680 117,656 119,801 122,283 123,858 125,045 125,915 % Ch -0.1% 1.1% 1.7% 1.7% 1.8% 2.1% 1.3% 1.0% 0.7%
SERVICES Idaho 296,264 302,701 307,709 315,959 327,726 337,616 347,703 357,675 367,421 % Ch 0.1% 2.2% 1.7% 2.7% 3.7% 3.0% 3.0% 2.9% 2.7% National (Thousands) 70,130 71,495 73,259 74,999 76,756 78,758 80,212 81,178 81,819 % Ch 0.2% 1.9% 2.5% 2.4% 2.3% 2.6% 1.8% 1.2% 0.8%
INFORMATION Idaho 9,626 9,466 9,366 9,291 9,300 9,285 9,414 9,691 9,955 % Ch -3.9% -1.7% -1.1% -0.8% 0.1% -0.2% 1.4% 2.9% 2.7% National (Thousands) 2,707 2,673 2,675 2,706 2,740 2,792 2,789 2,798 2,807 % Ch -3.4% -1.3% 0.1% 1.2% 1.3% 1.9% -0.1% 0.3% 0.3%
FINANCIAL ACTIVITIES Idaho 29,168 29,870 30,328 31,179 32,982 33,305 33,548 34,096 34,537 % Ch -1.5% 2.4% 1.5% 2.8% 5.8% 1.0% 0.7% 1.6% 1.3% National (Thousands) 7,695 7,697 7,783 7,886 7,978 8,106 8,088 7,974 7,861 % Ch -1.8% 0.0% 1.1% 1.3% 1.2% 1.6% -0.2% -1.4% -1.4%
ANNUAL DETAILAPRIL 2015
EMPLOYMENT
IDAHO ECONOMIC FORECAST
National Variables Forecast by IHS EconomicsForecast Begins the FIRST Quarter of 2015
43
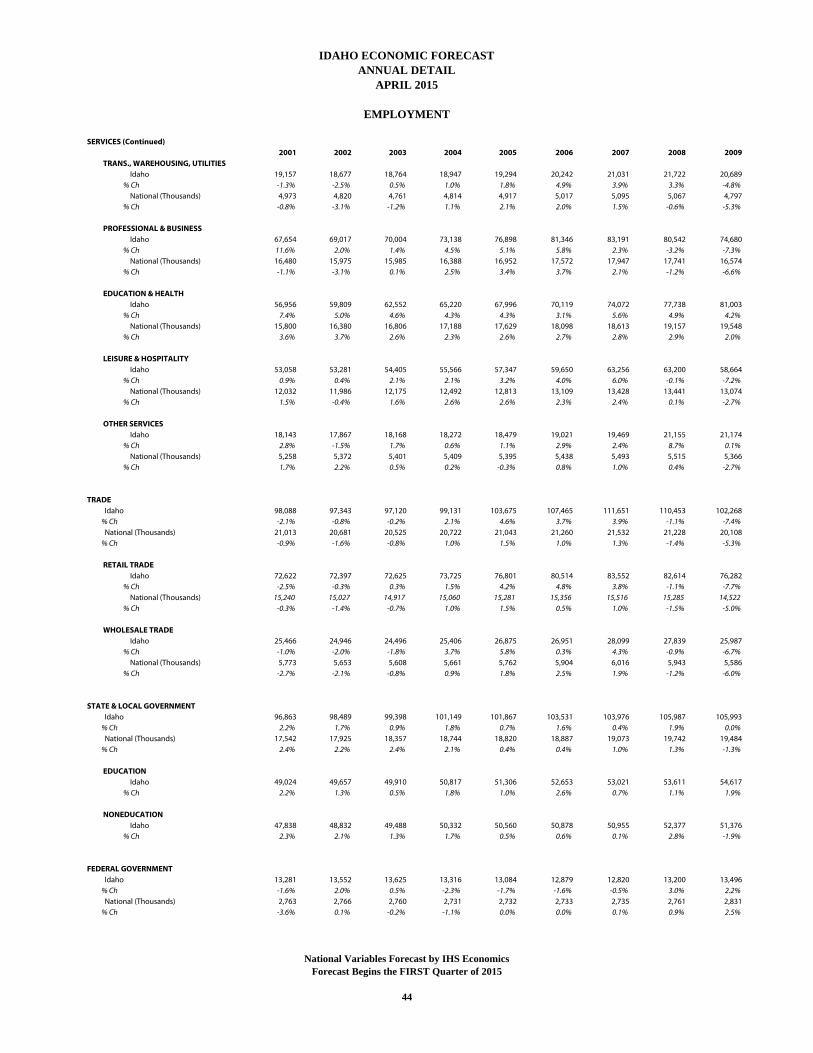
SERVICES (Continued)2001 2002 2003 2004 2005 2006 2007 2008 2009
TRANS., WAREHOUSING, UTILITIES Idaho 19,157 18,677 18,764 18,947 19,294 20,242 21,031 21,722 20,689 % Ch -1.3% -2.5% 0.5% 1.0% 1.8% 4.9% 3.9% 3.3% -4.8% National (Thousands) 4,973 4,820 4,761 4,814 4,917 5,017 5,095 5,067 4,797 % Ch -0.8% -3.1% -1.2% 1.1% 2.1% 2.0% 1.5% -0.6% -5.3%
PROFESSIONAL & BUSINESS Idaho 67,654 69,017 70,004 73,138 76,898 81,346 83,191 80,542 74,680 % Ch 11.6% 2.0% 1.4% 4.5% 5.1% 5.8% 2.3% -3.2% -7.3% National (Thousands) 16,480 15,975 15,985 16,388 16,952 17,572 17,947 17,741 16,574 % Ch -1.1% -3.1% 0.1% 2.5% 3.4% 3.7% 2.1% -1.2% -6.6%
EDUCATION & HEALTH Idaho 56,956 59,809 62,552 65,220 67,996 70,119 74,072 77,738 81,003 % Ch 7.4% 5.0% 4.6% 4.3% 4.3% 3.1% 5.6% 4.9% 4.2% National (Thousands) 15,800 16,380 16,806 17,188 17,629 18,098 18,613 19,157 19,548 % Ch 3.6% 3.7% 2.6% 2.3% 2.6% 2.7% 2.8% 2.9% 2.0%
LEISURE & HOSPITALITY Idaho 53,058 53,281 54,405 55,566 57,347 59,650 63,256 63,200 58,664 % Ch 0.9% 0.4% 2.1% 2.1% 3.2% 4.0% 6.0% -0.1% -7.2% National (Thousands) 12,032 11,986 12,175 12,492 12,813 13,109 13,428 13,441 13,074 % Ch 1.5% -0.4% 1.6% 2.6% 2.6% 2.3% 2.4% 0.1% -2.7%
OTHER SERVICES Idaho 18,143 17,867 18,168 18,272 18,479 19,021 19,469 21,155 21,174 % Ch 2.8% -1.5% 1.7% 0.6% 1.1% 2.9% 2.4% 8.7% 0.1% National (Thousands) 5,258 5,372 5,401 5,409 5,395 5,438 5,493 5,515 5,366 % Ch 1.7% 2.2% 0.5% 0.2% -0.3% 0.8% 1.0% 0.4% -2.7%
TRADE Idaho 98,088 97,343 97,120 99,131 103,675 107,465 111,651 110,453 102,268 % Ch -2.1% -0.8% -0.2% 2.1% 4.6% 3.7% 3.9% -1.1% -7.4% National (Thousands) 21,013 20,681 20,525 20,722 21,043 21,260 21,532 21,228 20,108 % Ch -0.9% -1.6% -0.8% 1.0% 1.5% 1.0% 1.3% -1.4% -5.3%
RETAIL TRADE Idaho 72,622 72,397 72,625 73,725 76,801 80,514 83,552 82,614 76,282 % Ch -2.5% -0.3% 0.3% 1.5% 4.2% 4.8% 3.8% -1.1% -7.7% National (Thousands) 15,240 15,027 14,917 15,060 15,281 15,356 15,516 15,285 14,522 % Ch -0.3% -1.4% -0.7% 1.0% 1.5% 0.5% 1.0% -1.5% -5.0%
WHOLESALE TRADE Idaho 25,466 24,946 24,496 25,406 26,875 26,951 28,099 27,839 25,987 % Ch -1.0% -2.0% -1.8% 3.7% 5.8% 0.3% 4.3% -0.9% -6.7% National (Thousands) 5,773 5,653 5,608 5,661 5,762 5,904 6,016 5,943 5,586 % Ch -2.7% -2.1% -0.8% 0.9% 1.8% 2.5% 1.9% -1.2% -6.0%
STATE & LOCAL GOVERNMENT Idaho 96,863 98,489 99,398 101,149 101,867 103,531 103,976 105,987 105,993 % Ch 2.2% 1.7% 0.9% 1.8% 0.7% 1.6% 0.4% 1.9% 0.0% National (Thousands) 17,542 17,925 18,357 18,744 18,820 18,887 19,073 19,742 19,484 % Ch 2.4% 2.2% 2.4% 2.1% 0.4% 0.4% 1.0% 1.3% -1.3%
EDUCATION Idaho 49,024 49,657 49,910 50,817 51,306 52,653 53,021 53,611 54,617 % Ch 2.2% 1.3% 0.5% 1.8% 1.0% 2.6% 0.7% 1.1% 1.9%
NONEDUCATION Idaho 47,838 48,832 49,488 50,332 50,560 50,878 50,955 52,377 51,376 % Ch 2.3% 2.1% 1.3% 1.7% 0.5% 0.6% 0.1% 2.8% -1.9%
FEDERAL GOVERNMENT Idaho 13,281 13,552 13,625 13,316 13,084 12,879 12,820 13,200 13,496 % Ch -1.6% 2.0% 0.5% -2.3% -1.7% -1.6% -0.5% 3.0% 2.2% National (Thousands) 2,763 2,766 2,760 2,731 2,732 2,733 2,735 2,761 2,831 % Ch -3.6% 0.1% -0.2% -1.1% 0.0% 0.0% 0.1% 0.9% 2.5%
IDAHO ECONOMIC FORECASTANNUAL DETAIL
APRIL 2015
EMPLOYMENT
National Variables Forecast by IHS EconomicsForecast Begins the FIRST Quarter of 2015
44
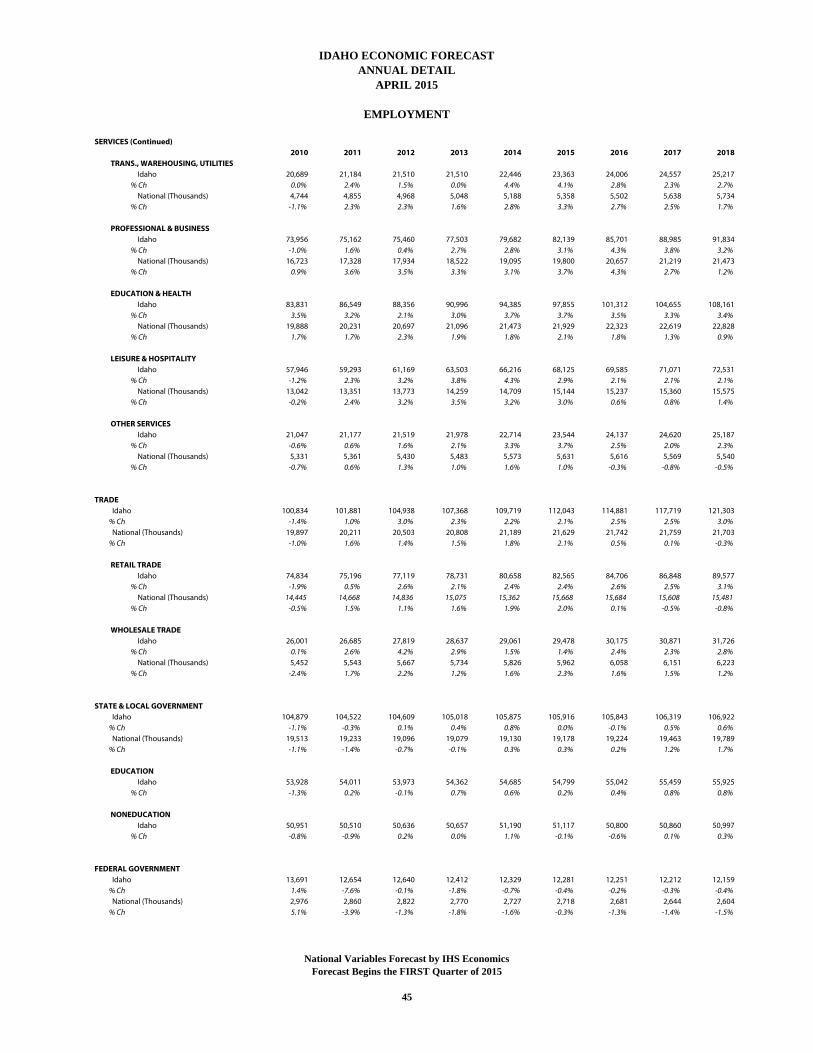
SERVICES (Continued)2010 2011 2012 2013 2014 2015 2016 2017 2018
TRANS., WAREHOUSING, UTILITIES Idaho 20,689 21,184 21,510 21,510 22,446 23,363 24,006 24,557 25,217 % Ch 0.0% 2.4% 1.5% 0.0% 4.4% 4.1% 2.8% 2.3% 2.7% National (Thousands) 4,744 4,855 4,968 5,048 5,188 5,358 5,502 5,638 5,734 % Ch -1.1% 2.3% 2.3% 1.6% 2.8% 3.3% 2.7% 2.5% 1.7%
PROFESSIONAL & BUSINESS Idaho 73,956 75,162 75,460 77,503 79,682 82,139 85,701 88,985 91,834 % Ch -1.0% 1.6% 0.4% 2.7% 2.8% 3.1% 4.3% 3.8% 3.2% National (Thousands) 16,723 17,328 17,934 18,522 19,095 19,800 20,657 21,219 21,473 % Ch 0.9% 3.6% 3.5% 3.3% 3.1% 3.7% 4.3% 2.7% 1.2%
EDUCATION & HEALTH Idaho 83,831 86,549 88,356 90,996 94,385 97,855 101,312 104,655 108,161 % Ch 3.5% 3.2% 2.1% 3.0% 3.7% 3.7% 3.5% 3.3% 3.4% National (Thousands) 19,888 20,231 20,697 21,096 21,473 21,929 22,323 22,619 22,828 % Ch 1.7% 1.7% 2.3% 1.9% 1.8% 2.1% 1.8% 1.3% 0.9%
LEISURE & HOSPITALITY Idaho 57,946 59,293 61,169 63,503 66,216 68,125 69,585 71,071 72,531 % Ch -1.2% 2.3% 3.2% 3.8% 4.3% 2.9% 2.1% 2.1% 2.1% National (Thousands) 13,042 13,351 13,773 14,259 14,709 15,144 15,237 15,360 15,575 % Ch -0.2% 2.4% 3.2% 3.5% 3.2% 3.0% 0.6% 0.8% 1.4%
OTHER SERVICES Idaho 21,047 21,177 21,519 21,978 22,714 23,544 24,137 24,620 25,187 % Ch -0.6% 0.6% 1.6% 2.1% 3.3% 3.7% 2.5% 2.0% 2.3% National (Thousands) 5,331 5,361 5,430 5,483 5,573 5,631 5,616 5,569 5,540 % Ch -0.7% 0.6% 1.3% 1.0% 1.6% 1.0% -0.3% -0.8% -0.5%
TRADE Idaho 100,834 101,881 104,938 107,368 109,719 112,043 114,881 117,719 121,303 % Ch -1.4% 1.0% 3.0% 2.3% 2.2% 2.1% 2.5% 2.5% 3.0% National (Thousands) 19,897 20,211 20,503 20,808 21,189 21,629 21,742 21,759 21,703 % Ch -1.0% 1.6% 1.4% 1.5% 1.8% 2.1% 0.5% 0.1% -0.3%
RETAIL TRADE Idaho 74,834 75,196 77,119 78,731 80,658 82,565 84,706 86,848 89,577 % Ch -1.9% 0.5% 2.6% 2.1% 2.4% 2.4% 2.6% 2.5% 3.1% National (Thousands) 14,445 14,668 14,836 15,075 15,362 15,668 15,684 15,608 15,481 % Ch -0.5% 1.5% 1.1% 1.6% 1.9% 2.0% 0.1% -0.5% -0.8%
WHOLESALE TRADE Idaho 26,001 26,685 27,819 28,637 29,061 29,478 30,175 30,871 31,726 % Ch 0.1% 2.6% 4.2% 2.9% 1.5% 1.4% 2.4% 2.3% 2.8% National (Thousands) 5,452 5,543 5,667 5,734 5,826 5,962 6,058 6,151 6,223 % Ch -2.4% 1.7% 2.2% 1.2% 1.6% 2.3% 1.6% 1.5% 1.2%
STATE & LOCAL GOVERNMENT Idaho 104,879 104,522 104,609 105,018 105,875 105,916 105,843 106,319 106,922 % Ch -1.1% -0.3% 0.1% 0.4% 0.8% 0.0% -0.1% 0.5% 0.6% National (Thousands) 19,513 19,233 19,096 19,079 19,130 19,178 19,224 19,463 19,789 % Ch -1.1% -1.4% -0.7% -0.1% 0.3% 0.3% 0.2% 1.2% 1.7%
EDUCATION Idaho 53,928 54,011 53,973 54,362 54,685 54,799 55,042 55,459 55,925 % Ch -1.3% 0.2% -0.1% 0.7% 0.6% 0.2% 0.4% 0.8% 0.8%
NONEDUCATION Idaho 50,951 50,510 50,636 50,657 51,190 51,117 50,800 50,860 50,997 % Ch -0.8% -0.9% 0.2% 0.0% 1.1% -0.1% -0.6% 0.1% 0.3%
FEDERAL GOVERNMENT Idaho 13,691 12,654 12,640 12,412 12,329 12,281 12,251 12,212 12,159 % Ch 1.4% -7.6% -0.1% -1.8% -0.7% -0.4% -0.2% -0.3% -0.4% National (Thousands) 2,976 2,860 2,822 2,770 2,727 2,718 2,681 2,644 2,604 % Ch 5.1% -3.9% -1.3% -1.8% -1.6% -0.3% -1.3% -1.4% -1.5%
IDAHO ECONOMIC FORECASTANNUAL DETAIL
APRIL 2015
EMPLOYMENT
National Variables Forecast by IHS EconomicsForecast Begins the FIRST Quarter of 2015
45
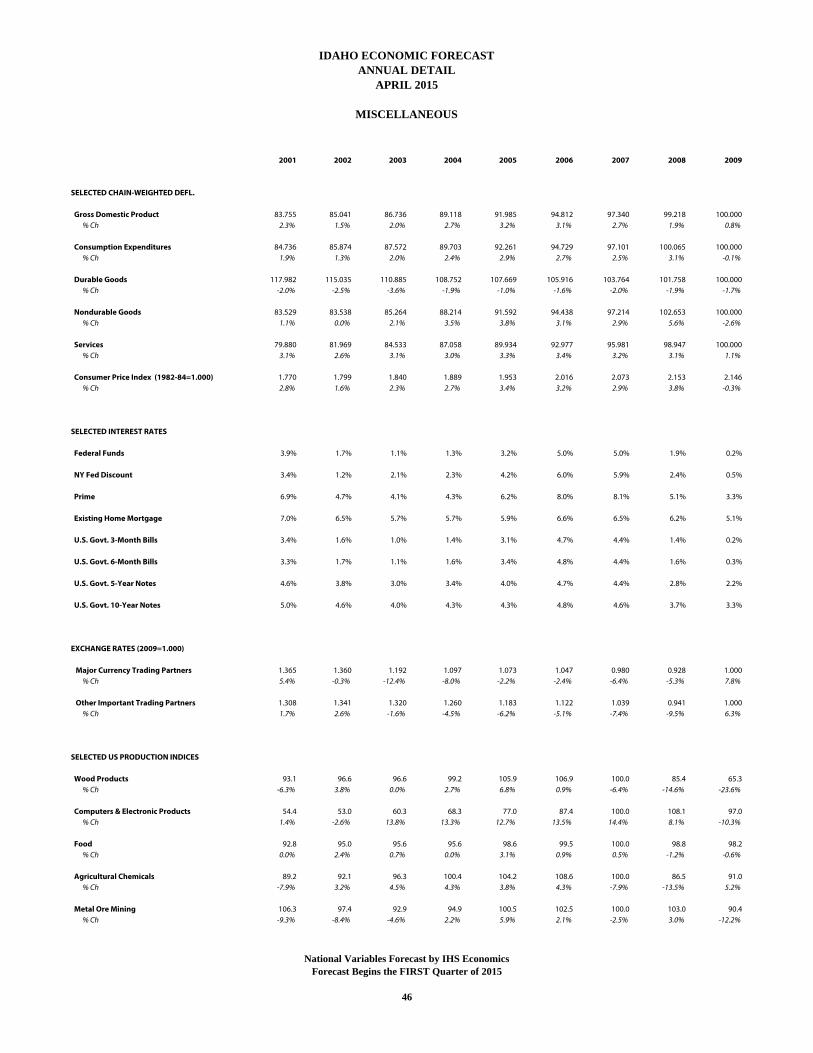
2001 2002 2003 2004 2005 2006 2007 2008 2009
SELECTED CHAIN-WEIGHTED DEFL.
Gross Domestic Product 83.755 85.041 86.736 89.118 91.985 94.812 97.340 99.218 100.000 % Ch 2.3% 1.5% 2.0% 2.7% 3.2% 3.1% 2.7% 1.9% 0.8%
Consumption Expenditures 84.736 85.874 87.572 89.703 92.261 94.729 97.101 100.065 100.000 % Ch 1.9% 1.3% 2.0% 2.4% 2.9% 2.7% 2.5% 3.1% -0.1%
Durable Goods 117.982 115.035 110.885 108.752 107.669 105.916 103.764 101.758 100.000 % Ch -2.0% -2.5% -3.6% -1.9% -1.0% -1.6% -2.0% -1.9% -1.7%
Nondurable Goods 83.529 83.538 85.264 88.214 91.592 94.438 97.214 102.653 100.000 % Ch 1.1% 0.0% 2.1% 3.5% 3.8% 3.1% 2.9% 5.6% -2.6%
Services 79.880 81.969 84.533 87.058 89.934 92.977 95.981 98.947 100.000 % Ch 3.1% 2.6% 3.1% 3.0% 3.3% 3.4% 3.2% 3.1% 1.1%
Consumer Price Index (1982-84=1.000) 1.770 1.799 1.840 1.889 1.953 2.016 2.073 2.153 2.146 % Ch 2.8% 1.6% 2.3% 2.7% 3.4% 3.2% 2.9% 3.8% -0.3%
SELECTED INTEREST RATES
Federal Funds 3.9% 1.7% 1.1% 1.3% 3.2% 5.0% 5.0% 1.9% 0.2%
NY Fed Discount 3.4% 1.2% 2.1% 2.3% 4.2% 6.0% 5.9% 2.4% 0.5%
Prime 6.9% 4.7% 4.1% 4.3% 6.2% 8.0% 8.1% 5.1% 3.3%
Existing Home Mortgage 7.0% 6.5% 5.7% 5.7% 5.9% 6.6% 6.5% 6.2% 5.1%
U.S. Govt. 3-Month Bills 3.4% 1.6% 1.0% 1.4% 3.1% 4.7% 4.4% 1.4% 0.2%
U.S. Govt. 6-Month Bills 3.3% 1.7% 1.1% 1.6% 3.4% 4.8% 4.4% 1.6% 0.3%
U.S. Govt. 5-Year Notes 4.6% 3.8% 3.0% 3.4% 4.0% 4.7% 4.4% 2.8% 2.2%
U.S. Govt. 10-Year Notes 5.0% 4.6% 4.0% 4.3% 4.3% 4.8% 4.6% 3.7% 3.3%
EXCHANGE RATES (2009=1.000)
Major Currency Trading Partners 1.365 1.360 1.192 1.097 1.073 1.047 0.980 0.928 1.000 % Ch 5.4% -0.3% -12.4% -8.0% -2.2% -2.4% -6.4% -5.3% 7.8%
Other Important Trading Partners 1.308 1.341 1.320 1.260 1.183 1.122 1.039 0.941 1.000 % Ch 1.7% 2.6% -1.6% -4.5% -6.2% -5.1% -7.4% -9.5% 6.3%
SELECTED US PRODUCTION INDICES
Wood Products 93.1 96.6 96.6 99.2 105.9 106.9 100.0 85.4 65.3 % Ch -6.3% 3.8% 0.0% 2.7% 6.8% 0.9% -6.4% -14.6% -23.6%
Computers & Electronic Products 54.4 53.0 60.3 68.3 77.0 87.4 100.0 108.1 97.0 % Ch 1.4% -2.6% 13.8% 13.3% 12.7% 13.5% 14.4% 8.1% -10.3%
Food 92.8 95.0 95.6 95.6 98.6 99.5 100.0 98.8 98.2 % Ch 0.0% 2.4% 0.7% 0.0% 3.1% 0.9% 0.5% -1.2% -0.6%
Agricultural Chemicals 89.2 92.1 96.3 100.4 104.2 108.6 100.0 86.5 91.0 % Ch -7.9% 3.2% 4.5% 4.3% 3.8% 4.3% -7.9% -13.5% 5.2%
Metal Ore Mining 106.3 97.4 92.9 94.9 100.5 102.5 100.0 103.0 90.4 % Ch -9.3% -8.4% -4.6% 2.2% 5.9% 2.1% -2.5% 3.0% -12.2%
APRIL 2015
MISCELLANEOUS
ANNUAL DETAILIDAHO ECONOMIC FORECAST
National Variables Forecast by IHS EconomicsForecast Begins the FIRST Quarter of 2015
46
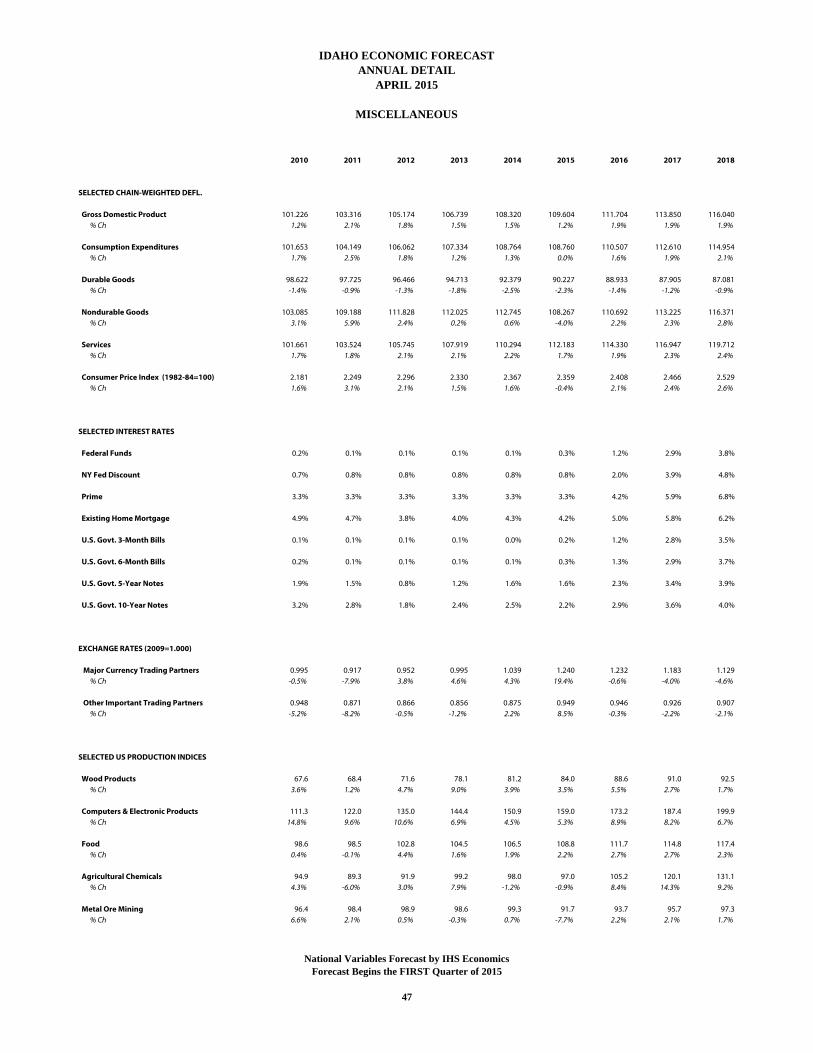
2010 2011 2012 2013 2014 2015 2016 2017 2018
SELECTED CHAIN-WEIGHTED DEFL.
Gross Domestic Product 101.226 103.316 105.174 106.739 108.320 109.604 111.704 113.850 116.040 % Ch 1.2% 2.1% 1.8% 1.5% 1.5% 1.2% 1.9% 1.9% 1.9%
Consumption Expenditures 101.653 104.149 106.062 107.334 108.764 108.760 110.507 112.610 114.954 % Ch 1.7% 2.5% 1.8% 1.2% 1.3% 0.0% 1.6% 1.9% 2.1%
Durable Goods 98.622 97.725 96.466 94.713 92.379 90.227 88.933 87.905 87.081 % Ch -1.4% -0.9% -1.3% -1.8% -2.5% -2.3% -1.4% -1.2% -0.9%
Nondurable Goods 103.085 109.188 111.828 112.025 112.745 108.267 110.692 113.225 116.371 % Ch 3.1% 5.9% 2.4% 0.2% 0.6% -4.0% 2.2% 2.3% 2.8%
Services 101.661 103.524 105.745 107.919 110.294 112.183 114.330 116.947 119.712 % Ch 1.7% 1.8% 2.1% 2.1% 2.2% 1.7% 1.9% 2.3% 2.4%
Consumer Price Index (1982-84=100) 2.181 2.249 2.296 2.330 2.367 2.359 2.408 2.466 2.529 % Ch 1.6% 3.1% 2.1% 1.5% 1.6% -0.4% 2.1% 2.4% 2.6%
SELECTED INTEREST RATES
Federal Funds 0.2% 0.1% 0.1% 0.1% 0.1% 0.3% 1.2% 2.9% 3.8%
NY Fed Discount 0.7% 0.8% 0.8% 0.8% 0.8% 0.8% 2.0% 3.9% 4.8%
Prime 3.3% 3.3% 3.3% 3.3% 3.3% 3.3% 4.2% 5.9% 6.8%
Existing Home Mortgage 4.9% 4.7% 3.8% 4.0% 4.3% 4.2% 5.0% 5.8% 6.2%
U.S. Govt. 3-Month Bills 0.1% 0.1% 0.1% 0.1% 0.0% 0.2% 1.2% 2.8% 3.5%
U.S. Govt. 6-Month Bills 0.2% 0.1% 0.1% 0.1% 0.1% 0.3% 1.3% 2.9% 3.7%
U.S. Govt. 5-Year Notes 1.9% 1.5% 0.8% 1.2% 1.6% 1.6% 2.3% 3.4% 3.9%
U.S. Govt. 10-Year Notes 3.2% 2.8% 1.8% 2.4% 2.5% 2.2% 2.9% 3.6% 4.0%
EXCHANGE RATES (2009=1.000)
Major Currency Trading Partners 0.995 0.917 0.952 0.995 1.039 1.240 1.232 1.183 1.129 % Ch -0.5% -7.9% 3.8% 4.6% 4.3% 19.4% -0.6% -4.0% -4.6%
Other Important Trading Partners 0.948 0.871 0.866 0.856 0.875 0.949 0.946 0.926 0.907 % Ch -5.2% -8.2% -0.5% -1.2% 2.2% 8.5% -0.3% -2.2% -2.1%
SELECTED US PRODUCTION INDICES
Wood Products 67.6 68.4 71.6 78.1 81.2 84.0 88.6 91.0 92.5 % Ch 3.6% 1.2% 4.7% 9.0% 3.9% 3.5% 5.5% 2.7% 1.7%
Computers & Electronic Products 111.3 122.0 135.0 144.4 150.9 159.0 173.2 187.4 199.9 % Ch 14.8% 9.6% 10.6% 6.9% 4.5% 5.3% 8.9% 8.2% 6.7%
Food 98.6 98.5 102.8 104.5 106.5 108.8 111.7 114.8 117.4 % Ch 0.4% -0.1% 4.4% 1.6% 1.9% 2.2% 2.7% 2.7% 2.3%
Agricultural Chemicals 94.9 89.3 91.9 99.2 98.0 97.0 105.2 120.1 131.1 % Ch 4.3% -6.0% 3.0% 7.9% -1.2% -0.9% 8.4% 14.3% 9.2%
Metal Ore Mining 96.4 98.4 98.9 98.6 99.3 91.7 93.7 95.7 97.3 % Ch 6.6% 2.1% 0.5% -0.3% 0.7% -7.7% 2.2% 2.1% 1.7%
ANNUAL DETAILAPRIL 2015
MISCELLANEOUS
IDAHO ECONOMIC FORECAST
National Variables Forecast by IHS EconomicsForecast Begins the FIRST Quarter of 2015
47
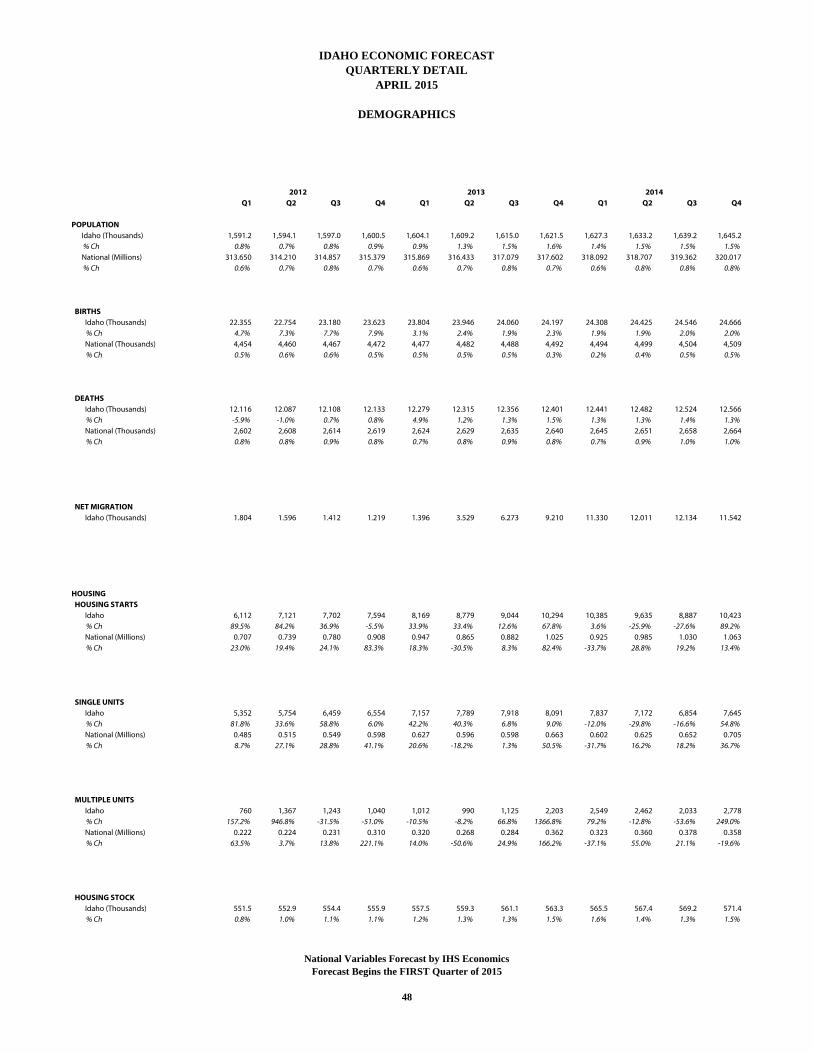
Q1 Q2 Q3 Q4 Q1 Q2 Q3 Q4 Q1 Q2 Q3 Q4
POPULATION Idaho (Thousands) 1,591.2 1,594.1 1,597.0 1,600.5 1,604.1 1,609.2 1,615.0 1,621.5 1,627.3 1,633.2 1,639.2 1,645.2 % Ch 0.8% 0.7% 0.8% 0.9% 0.9% 1.3% 1.5% 1.6% 1.4% 1.5% 1.5% 1.5% National (Millions) 313.650 314.210 314.857 315.379 315.869 316.433 317.079 317.602 318.092 318.707 319.362 320.017 % Ch 0.6% 0.7% 0.8% 0.7% 0.6% 0.7% 0.8% 0.7% 0.6% 0.8% 0.8% 0.8%
BIRTHS Idaho (Thousands) 22.355 22.754 23.180 23.623 23.804 23.946 24.060 24.197 24.308 24.425 24.546 24.666 % Ch 4.7% 7.3% 7.7% 7.9% 3.1% 2.4% 1.9% 2.3% 1.9% 1.9% 2.0% 2.0% National (Thousands) 4,454 4,460 4,467 4,472 4,477 4,482 4,488 4,492 4,494 4,499 4,504 4,509 % Ch 0.5% 0.6% 0.6% 0.5% 0.5% 0.5% 0.5% 0.3% 0.2% 0.4% 0.5% 0.5%
DEATHS Idaho (Thousands) 12.116 12.087 12.108 12.133 12.279 12.315 12.356 12.401 12.441 12.482 12.524 12.566 % Ch -5.9% -1.0% 0.7% 0.8% 4.9% 1.2% 1.3% 1.5% 1.3% 1.3% 1.4% 1.3% National (Thousands) 2,602 2,608 2,614 2,619 2,624 2,629 2,635 2,640 2,645 2,651 2,658 2,664 % Ch 0.8% 0.8% 0.9% 0.8% 0.7% 0.8% 0.9% 0.8% 0.7% 0.9% 1.0% 1.0%
NET MIGRATION Idaho (Thousands) 1.804 1.596 1.412 1.219 1.396 3.529 6.273 9.210 11.330 12.011 12.134 11.542
HOUSING HOUSING STARTS Idaho 6,112 7,121 7,702 7,594 8,169 8,779 9,044 10,294 10,385 9,635 8,887 10,423 % Ch 89.5% 84.2% 36.9% -5.5% 33.9% 33.4% 12.6% 67.8% 3.6% -25.9% -27.6% 89.2% National (Millions) 0.707 0.739 0.780 0.908 0.947 0.865 0.882 1.025 0.925 0.985 1.030 1.063 % Ch 23.0% 19.4% 24.1% 83.3% 18.3% -30.5% 8.3% 82.4% -33.7% 28.8% 19.2% 13.4%
SINGLE UNITS Idaho 5,352 5,754 6,459 6,554 7,157 7,789 7,918 8,091 7,837 7,172 6,854 7,645 % Ch 81.8% 33.6% 58.8% 6.0% 42.2% 40.3% 6.8% 9.0% -12.0% -29.8% -16.6% 54.8% National (Millions) 0.485 0.515 0.549 0.598 0.627 0.596 0.598 0.663 0.602 0.625 0.652 0.705 % Ch 8.7% 27.1% 28.8% 41.1% 20.6% -18.2% 1.3% 50.5% -31.7% 16.2% 18.2% 36.7%
MULTIPLE UNITS Idaho 760 1,367 1,243 1,040 1,012 990 1,125 2,203 2,549 2,462 2,033 2,778 % Ch 157.2% 946.8% -31.5% -51.0% -10.5% -8.2% 66.8% 1366.8% 79.2% -12.8% -53.6% 249.0% National (Millions) 0.222 0.224 0.231 0.310 0.320 0.268 0.284 0.362 0.323 0.360 0.378 0.358 % Ch 63.5% 3.7% 13.8% 221.1% 14.0% -50.6% 24.9% 166.2% -37.1% 55.0% 21.1% -19.6%
HOUSING STOCK Idaho (Thousands) 551.5 552.9 554.4 555.9 557.5 559.3 561.1 563.3 565.5 567.4 569.2 571.4 % Ch 0.8% 1.0% 1.1% 1.1% 1.2% 1.3% 1.3% 1.5% 1.6% 1.4% 1.3% 1.5%
20132012 2014
DEMOGRAPHICS
APRIL 2015QUARTERLY DETAIL
IDAHO ECONOMIC FORECAST
National Variables Forecast by IHS EconomicsForecast Begins the FIRST Quarter of 2015
48
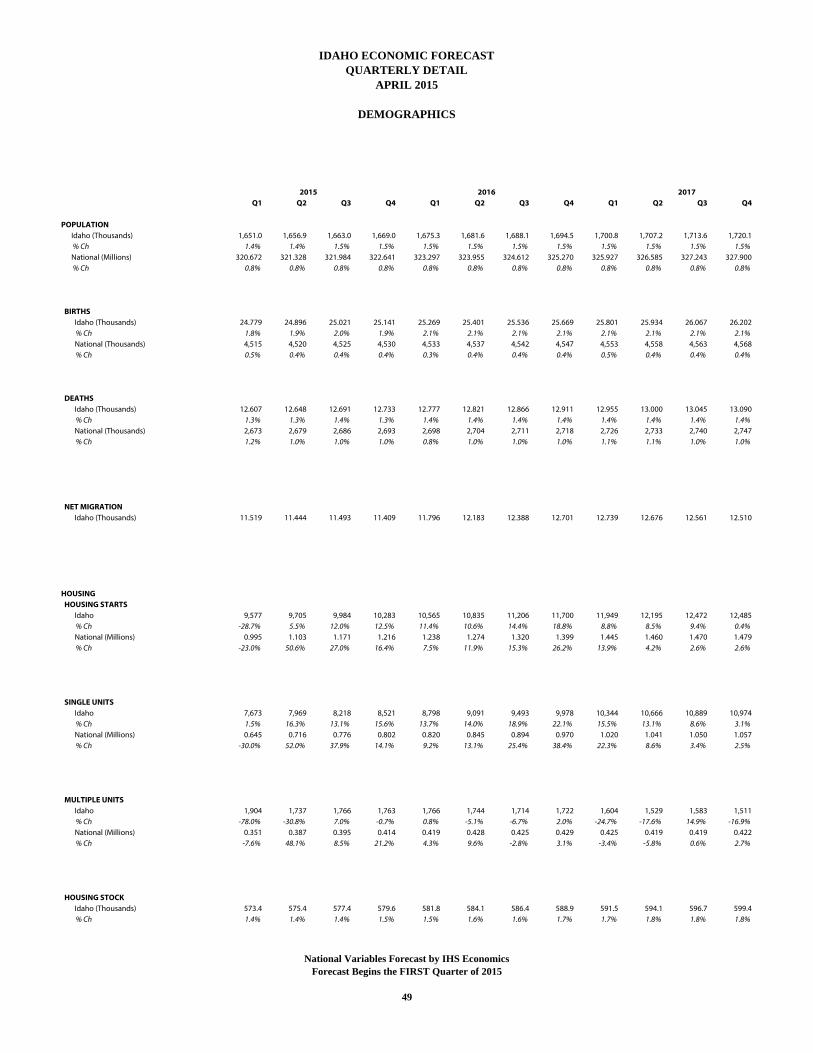
Q1 Q2 Q3 Q4 Q1 Q2 Q3 Q4 Q1 Q2 Q3 Q4
POPULATION Idaho (Thousands) 1,651.0 1,656.9 1,663.0 1,669.0 1,675.3 1,681.6 1,688.1 1,694.5 1,700.8 1,707.2 1,713.6 1,720.1 % Ch 1.4% 1.4% 1.5% 1.5% 1.5% 1.5% 1.5% 1.5% 1.5% 1.5% 1.5% 1.5% National (Millions) 320.672 321.328 321.984 322.641 323.297 323.955 324.612 325.270 325.927 326.585 327.243 327.900 % Ch 0.8% 0.8% 0.8% 0.8% 0.8% 0.8% 0.8% 0.8% 0.8% 0.8% 0.8% 0.8%
BIRTHS Idaho (Thousands) 24.779 24.896 25.021 25.141 25.269 25.401 25.536 25.669 25.801 25.934 26.067 26.202 % Ch 1.8% 1.9% 2.0% 1.9% 2.1% 2.1% 2.1% 2.1% 2.1% 2.1% 2.1% 2.1% National (Thousands) 4,515 4,520 4,525 4,530 4,533 4,537 4,542 4,547 4,553 4,558 4,563 4,568 % Ch 0.5% 0.4% 0.4% 0.4% 0.3% 0.4% 0.4% 0.4% 0.5% 0.4% 0.4% 0.4%
DEATHS Idaho (Thousands) 12.607 12.648 12.691 12.733 12.777 12.821 12.866 12.911 12.955 13.000 13.045 13.090 % Ch 1.3% 1.3% 1.4% 1.3% 1.4% 1.4% 1.4% 1.4% 1.4% 1.4% 1.4% 1.4% National (Thousands) 2,673 2,679 2,686 2,693 2,698 2,704 2,711 2,718 2,726 2,733 2,740 2,747 % Ch 1.2% 1.0% 1.0% 1.0% 0.8% 1.0% 1.0% 1.0% 1.1% 1.1% 1.0% 1.0%
NET MIGRATION Idaho (Thousands) 11.519 11.444 11.493 11.409 11.796 12.183 12.388 12.701 12.739 12.676 12.561 12.510
HOUSING HOUSING STARTS Idaho 9,577 9,705 9,984 10,283 10,565 10,835 11,206 11,700 11,949 12,195 12,472 12,485 % Ch -28.7% 5.5% 12.0% 12.5% 11.4% 10.6% 14.4% 18.8% 8.8% 8.5% 9.4% 0.4% National (Millions) 0.995 1.103 1.171 1.216 1.238 1.274 1.320 1.399 1.445 1.460 1.470 1.479 % Ch -23.0% 50.6% 27.0% 16.4% 7.5% 11.9% 15.3% 26.2% 13.9% 4.2% 2.6% 2.6%
SINGLE UNITS Idaho 7,673 7,969 8,218 8,521 8,798 9,091 9,493 9,978 10,344 10,666 10,889 10,974 % Ch 1.5% 16.3% 13.1% 15.6% 13.7% 14.0% 18.9% 22.1% 15.5% 13.1% 8.6% 3.1% National (Millions) 0.645 0.716 0.776 0.802 0.820 0.845 0.894 0.970 1.020 1.041 1.050 1.057 % Ch -30.0% 52.0% 37.9% 14.1% 9.2% 13.1% 25.4% 38.4% 22.3% 8.6% 3.4% 2.5%
MULTIPLE UNITS Idaho 1,904 1,737 1,766 1,763 1,766 1,744 1,714 1,722 1,604 1,529 1,583 1,511 % Ch -78.0% -30.8% 7.0% -0.7% 0.8% -5.1% -6.7% 2.0% -24.7% -17.6% 14.9% -16.9% National (Millions) 0.351 0.387 0.395 0.414 0.419 0.428 0.425 0.429 0.425 0.419 0.419 0.422 % Ch -7.6% 48.1% 8.5% 21.2% 4.3% 9.6% -2.8% 3.1% -3.4% -5.8% 0.6% 2.7%
HOUSING STOCK Idaho (Thousands) 573.4 575.4 577.4 579.6 581.8 584.1 586.4 588.9 591.5 594.1 596.7 599.4 % Ch 1.4% 1.4% 1.4% 1.5% 1.5% 1.6% 1.6% 1.7% 1.7% 1.8% 1.8% 1.8%
2017
IDAHO ECONOMIC FORECASTQUARTERLY DETAIL
APRIL 2015
DEMOGRAPHICS
2015 2016
National Variables Forecast by IHS EconomicsForecast Begins the FIRST Quarter of 2015
49
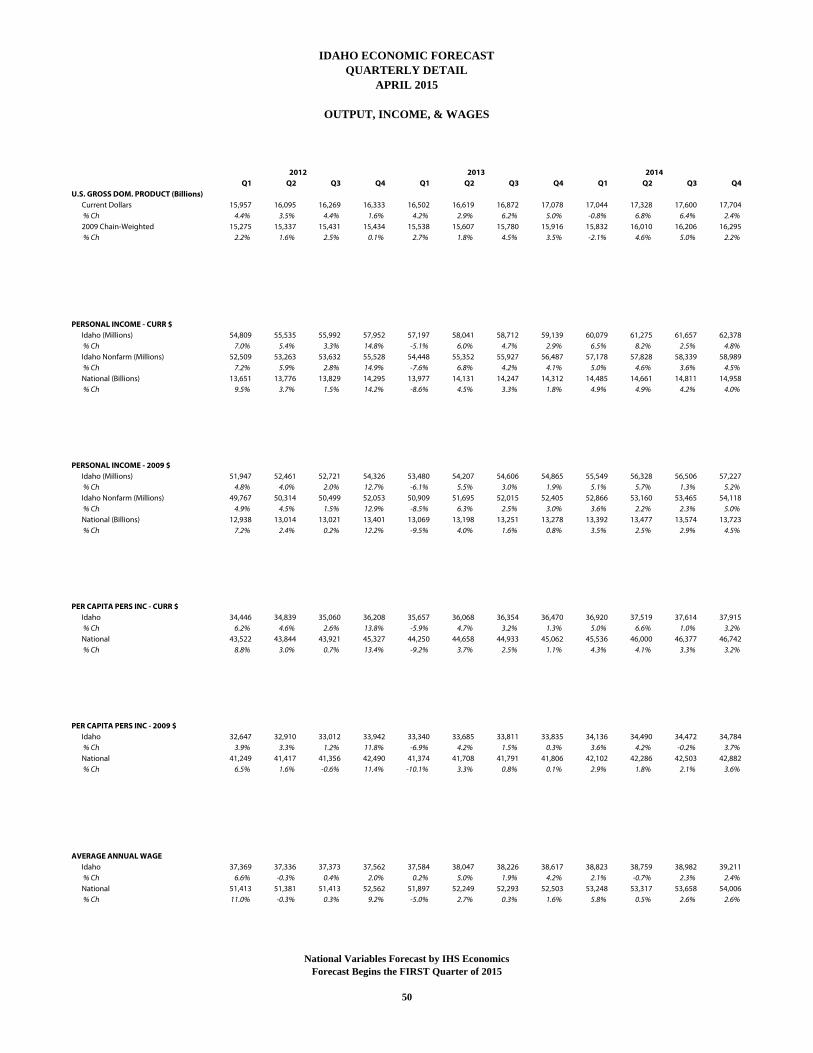
Q1 Q2 Q3 Q4 Q1 Q2 Q3 Q4 Q1 Q2 Q3 Q4U.S. GROSS DOM. PRODUCT (Billions) Current Dollars 15,957 16,095 16,269 16,333 16,502 16,619 16,872 17,078 17,044 17,328 17,600 17,704 % Ch 4.4% 3.5% 4.4% 1.6% 4.2% 2.9% 6.2% 5.0% -0.8% 6.8% 6.4% 2.4% 2009 Chain-Weighted 15,275 15,337 15,431 15,434 15,538 15,607 15,780 15,916 15,832 16,010 16,206 16,295 % Ch 2.2% 1.6% 2.5% 0.1% 2.7% 1.8% 4.5% 3.5% -2.1% 4.6% 5.0% 2.2%
PERSONAL INCOME - CURR $ Idaho (Millions) 54,809 55,535 55,992 57,952 57,197 58,041 58,712 59,139 60,079 61,275 61,657 62,378 % Ch 7.0% 5.4% 3.3% 14.8% -5.1% 6.0% 4.7% 2.9% 6.5% 8.2% 2.5% 4.8% Idaho Nonfarm (Millions) 52,509 53,263 53,632 55,528 54,448 55,352 55,927 56,487 57,178 57,828 58,339 58,989 % Ch 7.2% 5.9% 2.8% 14.9% -7.6% 6.8% 4.2% 4.1% 5.0% 4.6% 3.6% 4.5% National (Billions) 13,651 13,776 13,829 14,295 13,977 14,131 14,247 14,312 14,485 14,661 14,811 14,958 % Ch 9.5% 3.7% 1.5% 14.2% -8.6% 4.5% 3.3% 1.8% 4.9% 4.9% 4.2% 4.0%
PERSONAL INCOME - 2009 $ Idaho (Millions) 51,947 52,461 52,721 54,326 53,480 54,207 54,606 54,865 55,549 56,328 56,506 57,227 % Ch 4.8% 4.0% 2.0% 12.7% -6.1% 5.5% 3.0% 1.9% 5.1% 5.7% 1.3% 5.2% Idaho Nonfarm (Millions) 49,767 50,314 50,499 52,053 50,909 51,695 52,015 52,405 52,866 53,160 53,465 54,118 % Ch 4.9% 4.5% 1.5% 12.9% -8.5% 6.3% 2.5% 3.0% 3.6% 2.2% 2.3% 5.0% National (Billions) 12,938 13,014 13,021 13,401 13,069 13,198 13,251 13,278 13,392 13,477 13,574 13,723 % Ch 7.2% 2.4% 0.2% 12.2% -9.5% 4.0% 1.6% 0.8% 3.5% 2.5% 2.9% 4.5%
PER CAPITA PERS INC - CURR $ Idaho 34,446 34,839 35,060 36,208 35,657 36,068 36,354 36,470 36,920 37,519 37,614 37,915 % Ch 6.2% 4.6% 2.6% 13.8% -5.9% 4.7% 3.2% 1.3% 5.0% 6.6% 1.0% 3.2% National 43,522 43,844 43,921 45,327 44,250 44,658 44,933 45,062 45,536 46,000 46,377 46,742 % Ch 8.8% 3.0% 0.7% 13.4% -9.2% 3.7% 2.5% 1.1% 4.3% 4.1% 3.3% 3.2%
PER CAPITA PERS INC - 2009 $ Idaho 32,647 32,910 33,012 33,942 33,340 33,685 33,811 33,835 34,136 34,490 34,472 34,784 % Ch 3.9% 3.3% 1.2% 11.8% -6.9% 4.2% 1.5% 0.3% 3.6% 4.2% -0.2% 3.7% National 41,249 41,417 41,356 42,490 41,374 41,708 41,791 41,806 42,102 42,286 42,503 42,882 % Ch 6.5% 1.6% -0.6% 11.4% -10.1% 3.3% 0.8% 0.1% 2.9% 1.8% 2.1% 3.6%
AVERAGE ANNUAL WAGE Idaho 37,369 37,336 37,373 37,562 37,584 38,047 38,226 38,617 38,823 38,759 38,982 39,211 % Ch 6.6% -0.3% 0.4% 2.0% 0.2% 5.0% 1.9% 4.2% 2.1% -0.7% 2.3% 2.4% National 51,413 51,381 51,413 52,562 51,897 52,249 52,293 52,503 53,248 53,317 53,658 54,006 % Ch 11.0% -0.3% 0.3% 9.2% -5.0% 2.7% 0.3% 1.6% 5.8% 0.5% 2.6% 2.6%
APRIL 2015
OUTPUT, INCOME, & WAGES
2012
IDAHO ECONOMIC FORECASTQUARTERLY DETAIL
20142013
National Variables Forecast by IHS EconomicsForecast Begins the FIRST Quarter of 2015
50
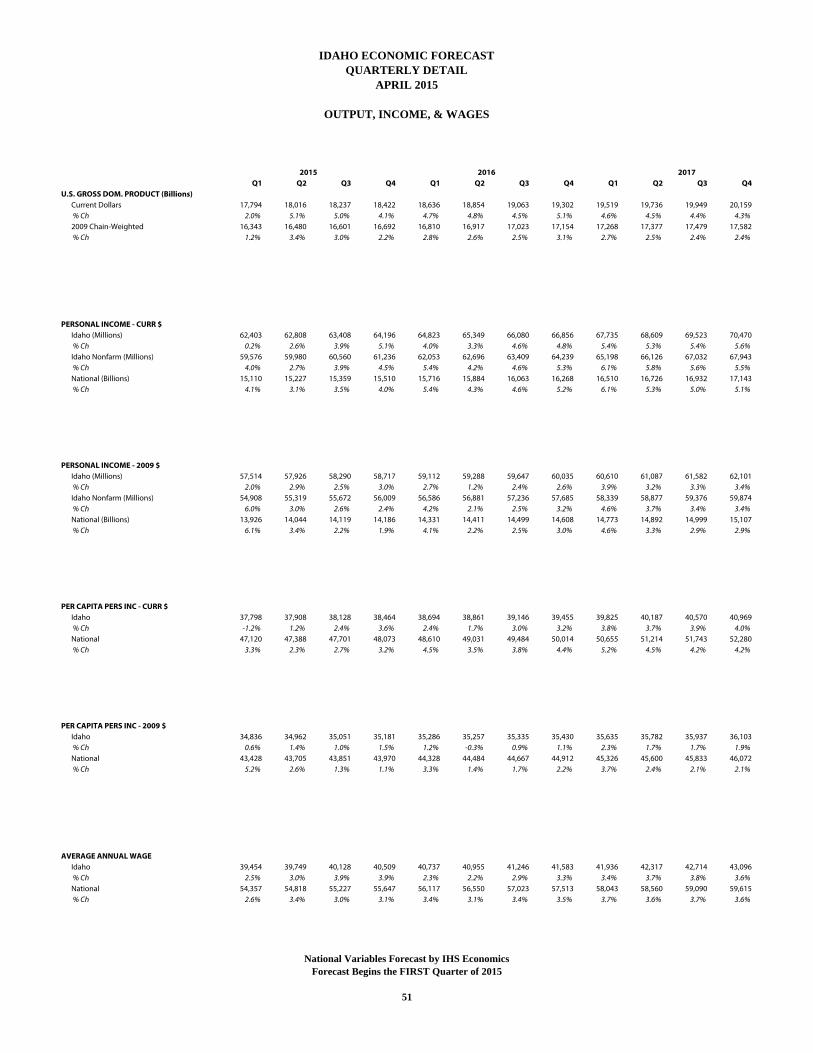
Q1 Q2 Q3 Q4 Q1 Q2 Q3 Q4 Q1 Q2 Q3 Q4U.S. GROSS DOM. PRODUCT (Billions) Current Dollars 17,794 18,016 18,237 18,422 18,636 18,854 19,063 19,302 19,519 19,736 19,949 20,159 % Ch 2.0% 5.1% 5.0% 4.1% 4.7% 4.8% 4.5% 5.1% 4.6% 4.5% 4.4% 4.3% 2009 Chain-Weighted 16,343 16,480 16,601 16,692 16,810 16,917 17,023 17,154 17,268 17,377 17,479 17,582 % Ch 1.2% 3.4% 3.0% 2.2% 2.8% 2.6% 2.5% 3.1% 2.7% 2.5% 2.4% 2.4%
PERSONAL INCOME - CURR $ Idaho (Millions) 62,403 62,808 63,408 64,196 64,823 65,349 66,080 66,856 67,735 68,609 69,523 70,470 % Ch 0.2% 2.6% 3.9% 5.1% 4.0% 3.3% 4.6% 4.8% 5.4% 5.3% 5.4% 5.6% Idaho Nonfarm (Millions) 59,576 59,980 60,560 61,236 62,053 62,696 63,409 64,239 65,198 66,126 67,032 67,943 % Ch 4.0% 2.7% 3.9% 4.5% 5.4% 4.2% 4.6% 5.3% 6.1% 5.8% 5.6% 5.5% National (Billions) 15,110 15,227 15,359 15,510 15,716 15,884 16,063 16,268 16,510 16,726 16,932 17,143 % Ch 4.1% 3.1% 3.5% 4.0% 5.4% 4.3% 4.6% 5.2% 6.1% 5.3% 5.0% 5.1%
PERSONAL INCOME - 2009 $ Idaho (Millions) 57,514 57,926 58,290 58,717 59,112 59,288 59,647 60,035 60,610 61,087 61,582 62,101 % Ch 2.0% 2.9% 2.5% 3.0% 2.7% 1.2% 2.4% 2.6% 3.9% 3.2% 3.3% 3.4% Idaho Nonfarm (Millions) 54,908 55,319 55,672 56,009 56,586 56,881 57,236 57,685 58,339 58,877 59,376 59,874 % Ch 6.0% 3.0% 2.6% 2.4% 4.2% 2.1% 2.5% 3.2% 4.6% 3.7% 3.4% 3.4% National (Billions) 13,926 14,044 14,119 14,186 14,331 14,411 14,499 14,608 14,773 14,892 14,999 15,107 % Ch 6.1% 3.4% 2.2% 1.9% 4.1% 2.2% 2.5% 3.0% 4.6% 3.3% 2.9% 2.9%
PER CAPITA PERS INC - CURR $ Idaho 37,798 37,908 38,128 38,464 38,694 38,861 39,146 39,455 39,825 40,187 40,570 40,969 % Ch -1.2% 1.2% 2.4% 3.6% 2.4% 1.7% 3.0% 3.2% 3.8% 3.7% 3.9% 4.0% National 47,120 47,388 47,701 48,073 48,610 49,031 49,484 50,014 50,655 51,214 51,743 52,280 % Ch 3.3% 2.3% 2.7% 3.2% 4.5% 3.5% 3.8% 4.4% 5.2% 4.5% 4.2% 4.2%
PER CAPITA PERS INC - 2009 $ Idaho 34,836 34,962 35,051 35,181 35,286 35,257 35,335 35,430 35,635 35,782 35,937 36,103 % Ch 0.6% 1.4% 1.0% 1.5% 1.2% -0.3% 0.9% 1.1% 2.3% 1.7% 1.7% 1.9% National 43,428 43,705 43,851 43,970 44,328 44,484 44,667 44,912 45,326 45,600 45,833 46,072 % Ch 5.2% 2.6% 1.3% 1.1% 3.3% 1.4% 1.7% 2.2% 3.7% 2.4% 2.1% 2.1%
AVERAGE ANNUAL WAGE Idaho 39,454 39,749 40,128 40,509 40,737 40,955 41,246 41,583 41,936 42,317 42,714 43,096 % Ch 2.5% 3.0% 3.9% 3.9% 2.3% 2.2% 2.9% 3.3% 3.4% 3.7% 3.8% 3.6% National 54,357 54,818 55,227 55,647 56,117 56,550 57,023 57,513 58,043 58,560 59,090 59,615 % Ch 2.6% 3.4% 3.0% 3.1% 3.4% 3.1% 3.4% 3.5% 3.7% 3.6% 3.7% 3.6%
2017
IDAHO ECONOMIC FORECASTQUARTERLY DETAIL
APRIL 2015
OUTPUT, INCOME, & WAGES
2015 2016
National Variables Forecast by IHS EconomicsForecast Begins the FIRST Quarter of 2015
51
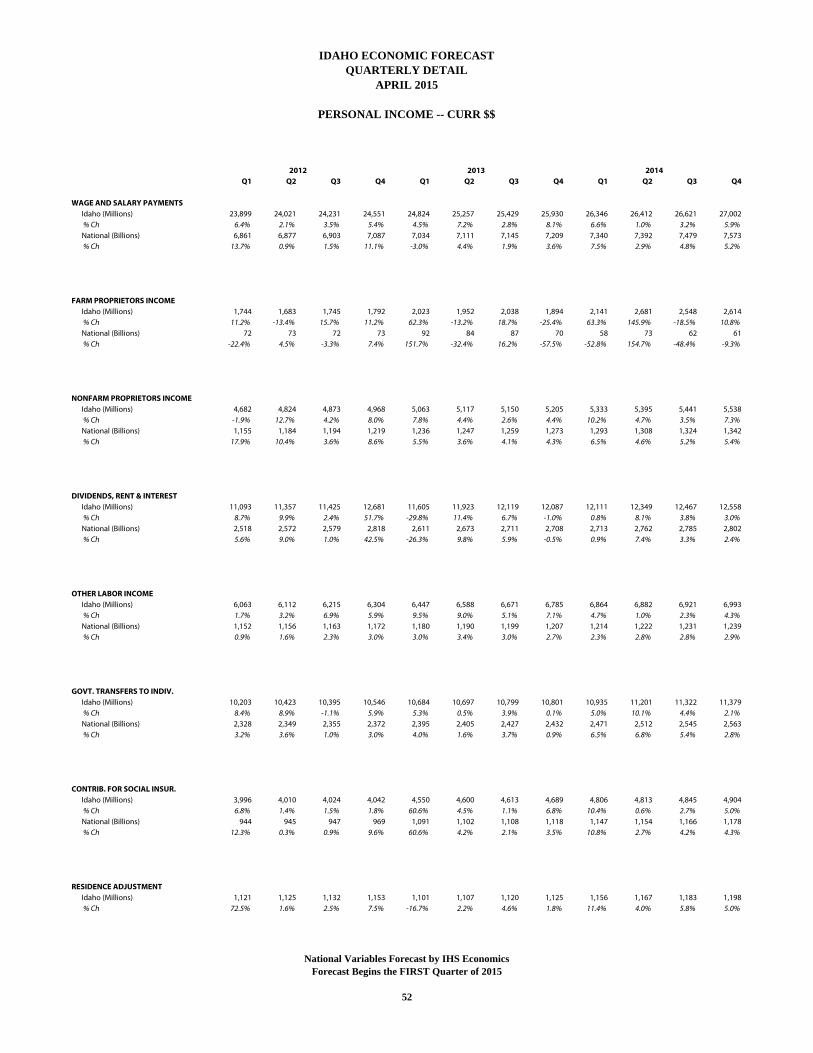
Q1 Q2 Q3 Q4 Q1 Q2 Q3 Q4 Q1 Q2 Q3 Q4
WAGE AND SALARY PAYMENTS Idaho (Millions) 23,899 24,021 24,231 24,551 24,824 25,257 25,429 25,930 26,346 26,412 26,621 27,002 % Ch 6.4% 2.1% 3.5% 5.4% 4.5% 7.2% 2.8% 8.1% 6.6% 1.0% 3.2% 5.9% National (Billions) 6,861 6,877 6,903 7,087 7,034 7,111 7,145 7,209 7,340 7,392 7,479 7,573 % Ch 13.7% 0.9% 1.5% 11.1% -3.0% 4.4% 1.9% 3.6% 7.5% 2.9% 4.8% 5.2%
FARM PROPRIETORS INCOME Idaho (Millions) 1,744 1,683 1,745 1,792 2,023 1,952 2,038 1,894 2,141 2,681 2,548 2,614 % Ch 11.2% -13.4% 15.7% 11.2% 62.3% -13.2% 18.7% -25.4% 63.3% 145.9% -18.5% 10.8% National (Billions) 72 73 72 73 92 84 87 70 58 73 62 61 % Ch -22.4% 4.5% -3.3% 7.4% 151.7% -32.4% 16.2% -57.5% -52.8% 154.7% -48.4% -9.3%
NONFARM PROPRIETORS INCOME Idaho (Millions) 4,682 4,824 4,873 4,968 5,063 5,117 5,150 5,205 5,333 5,395 5,441 5,538 % Ch -1.9% 12.7% 4.2% 8.0% 7.8% 4.4% 2.6% 4.4% 10.2% 4.7% 3.5% 7.3% National (Billions) 1,155 1,184 1,194 1,219 1,236 1,247 1,259 1,273 1,293 1,308 1,324 1,342 % Ch 17.9% 10.4% 3.6% 8.6% 5.5% 3.6% 4.1% 4.3% 6.5% 4.6% 5.2% 5.4%
DIVIDENDS, RENT & INTEREST Idaho (Millions) 11,093 11,357 11,425 12,681 11,605 11,923 12,119 12,087 12,111 12,349 12,467 12,558 % Ch 8.7% 9.9% 2.4% 51.7% -29.8% 11.4% 6.7% -1.0% 0.8% 8.1% 3.8% 3.0% National (Billions) 2,518 2,572 2,579 2,818 2,611 2,673 2,711 2,708 2,713 2,762 2,785 2,802 % Ch 5.6% 9.0% 1.0% 42.5% -26.3% 9.8% 5.9% -0.5% 0.9% 7.4% 3.3% 2.4%
OTHER LABOR INCOME Idaho (Millions) 6,063 6,112 6,215 6,304 6,447 6,588 6,671 6,785 6,864 6,882 6,921 6,993 % Ch 1.7% 3.2% 6.9% 5.9% 9.5% 9.0% 5.1% 7.1% 4.7% 1.0% 2.3% 4.3% National (Billions) 1,152 1,156 1,163 1,172 1,180 1,190 1,199 1,207 1,214 1,222 1,231 1,239 % Ch 0.9% 1.6% 2.3% 3.0% 3.0% 3.4% 3.0% 2.7% 2.3% 2.8% 2.8% 2.9%
GOVT. TRANSFERS TO INDIV. Idaho (Millions) 10,203 10,423 10,395 10,546 10,684 10,697 10,799 10,801 10,935 11,201 11,322 11,379 % Ch 8.4% 8.9% -1.1% 5.9% 5.3% 0.5% 3.9% 0.1% 5.0% 10.1% 4.4% 2.1% National (Billions) 2,328 2,349 2,355 2,372 2,395 2,405 2,427 2,432 2,471 2,512 2,545 2,563 % Ch 3.2% 3.6% 1.0% 3.0% 4.0% 1.6% 3.7% 0.9% 6.5% 6.8% 5.4% 2.8%
CONTRIB. FOR SOCIAL INSUR. Idaho (Millions) 3,996 4,010 4,024 4,042 4,550 4,600 4,613 4,689 4,806 4,813 4,845 4,904 % Ch 6.8% 1.4% 1.5% 1.8% 60.6% 4.5% 1.1% 6.8% 10.4% 0.6% 2.7% 5.0% National (Billions) 944 945 947 969 1,091 1,102 1,108 1,118 1,147 1,154 1,166 1,178 % Ch 12.3% 0.3% 0.9% 9.6% 60.6% 4.2% 2.1% 3.5% 10.8% 2.7% 4.2% 4.3%
RESIDENCE ADJUSTMENT Idaho (Millions) 1,121 1,125 1,132 1,153 1,101 1,107 1,120 1,125 1,156 1,167 1,183 1,198 % Ch 72.5% 1.6% 2.5% 7.5% -16.7% 2.2% 4.6% 1.8% 11.4% 4.0% 5.8% 5.0%
IDAHO ECONOMIC FORECASTQUARTERLY DETAIL
APRIL 2015
PERSONAL INCOME -- CURR $$
2012 20142013
National Variables Forecast by IHS EconomicsForecast Begins the FIRST Quarter of 2015
52
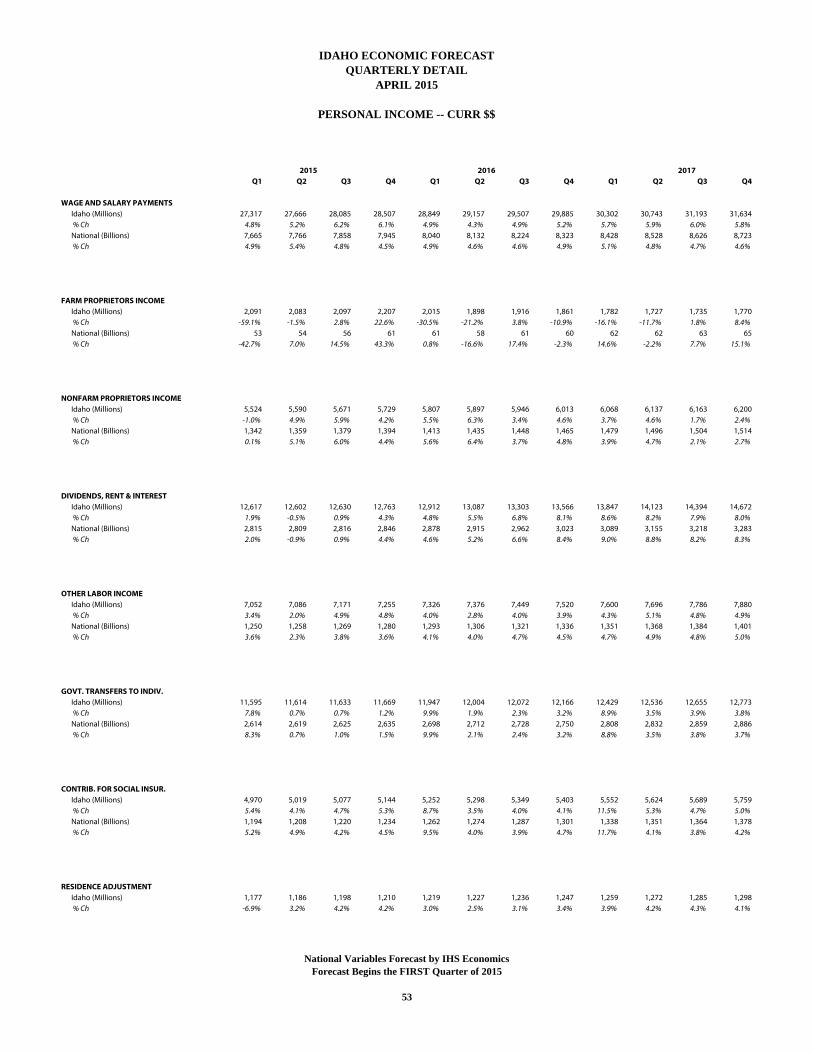
Q1 Q2 Q3 Q4 Q1 Q2 Q3 Q4 Q1 Q2 Q3 Q4
WAGE AND SALARY PAYMENTS Idaho (Millions) 27,317 27,666 28,085 28,507 28,849 29,157 29,507 29,885 30,302 30,743 31,193 31,634 % Ch 4.8% 5.2% 6.2% 6.1% 4.9% 4.3% 4.9% 5.2% 5.7% 5.9% 6.0% 5.8% National (Billions) 7,665 7,766 7,858 7,945 8,040 8,132 8,224 8,323 8,428 8,528 8,626 8,723 % Ch 4.9% 5.4% 4.8% 4.5% 4.9% 4.6% 4.6% 4.9% 5.1% 4.8% 4.7% 4.6%
FARM PROPRIETORS INCOME Idaho (Millions) 2,091 2,083 2,097 2,207 2,015 1,898 1,916 1,861 1,782 1,727 1,735 1,770 % Ch -59.1% -1.5% 2.8% 22.6% -30.5% -21.2% 3.8% -10.9% -16.1% -11.7% 1.8% 8.4% National (Billions) 53 54 56 61 61 58 61 60 62 62 63 65 % Ch -42.7% 7.0% 14.5% 43.3% 0.8% -16.6% 17.4% -2.3% 14.6% -2.2% 7.7% 15.1%
NONFARM PROPRIETORS INCOME Idaho (Millions) 5,524 5,590 5,671 5,729 5,807 5,897 5,946 6,013 6,068 6,137 6,163 6,200 % Ch -1.0% 4.9% 5.9% 4.2% 5.5% 6.3% 3.4% 4.6% 3.7% 4.6% 1.7% 2.4% National (Billions) 1,342 1,359 1,379 1,394 1,413 1,435 1,448 1,465 1,479 1,496 1,504 1,514 % Ch 0.1% 5.1% 6.0% 4.4% 5.6% 6.4% 3.7% 4.8% 3.9% 4.7% 2.1% 2.7%
DIVIDENDS, RENT & INTEREST Idaho (Millions) 12,617 12,602 12,630 12,763 12,912 13,087 13,303 13,566 13,847 14,123 14,394 14,672 % Ch 1.9% -0.5% 0.9% 4.3% 4.8% 5.5% 6.8% 8.1% 8.6% 8.2% 7.9% 8.0% National (Billions) 2,815 2,809 2,816 2,846 2,878 2,915 2,962 3,023 3,089 3,155 3,218 3,283 % Ch 2.0% -0.9% 0.9% 4.4% 4.6% 5.2% 6.6% 8.4% 9.0% 8.8% 8.2% 8.3%
OTHER LABOR INCOME Idaho (Millions) 7,052 7,086 7,171 7,255 7,326 7,376 7,449 7,520 7,600 7,696 7,786 7,880 % Ch 3.4% 2.0% 4.9% 4.8% 4.0% 2.8% 4.0% 3.9% 4.3% 5.1% 4.8% 4.9% National (Billions) 1,250 1,258 1,269 1,280 1,293 1,306 1,321 1,336 1,351 1,368 1,384 1,401 % Ch 3.6% 2.3% 3.8% 3.6% 4.1% 4.0% 4.7% 4.5% 4.7% 4.9% 4.8% 5.0%
GOVT. TRANSFERS TO INDIV. Idaho (Millions) 11,595 11,614 11,633 11,669 11,947 12,004 12,072 12,166 12,429 12,536 12,655 12,773 % Ch 7.8% 0.7% 0.7% 1.2% 9.9% 1.9% 2.3% 3.2% 8.9% 3.5% 3.9% 3.8% National (Billions) 2,614 2,619 2,625 2,635 2,698 2,712 2,728 2,750 2,808 2,832 2,859 2,886 % Ch 8.3% 0.7% 1.0% 1.5% 9.9% 2.1% 2.4% 3.2% 8.8% 3.5% 3.8% 3.7%
CONTRIB. FOR SOCIAL INSUR. Idaho (Millions) 4,970 5,019 5,077 5,144 5,252 5,298 5,349 5,403 5,552 5,624 5,689 5,759 % Ch 5.4% 4.1% 4.7% 5.3% 8.7% 3.5% 4.0% 4.1% 11.5% 5.3% 4.7% 5.0% National (Billions) 1,194 1,208 1,220 1,234 1,262 1,274 1,287 1,301 1,338 1,351 1,364 1,378 % Ch 5.2% 4.9% 4.2% 4.5% 9.5% 4.0% 3.9% 4.7% 11.7% 4.1% 3.8% 4.2%
RESIDENCE ADJUSTMENT Idaho (Millions) 1,177 1,186 1,198 1,210 1,219 1,227 1,236 1,247 1,259 1,272 1,285 1,298 % Ch -6.9% 3.2% 4.2% 4.2% 3.0% 2.5% 3.1% 3.4% 3.9% 4.2% 4.3% 4.1%
20172015 2016
PERSONAL INCOME -- CURR $$
IDAHO ECONOMIC FORECASTQUARTERLY DETAIL
APRIL 2015
National Variables Forecast by IHS EconomicsForecast Begins the FIRST Quarter of 2015
53
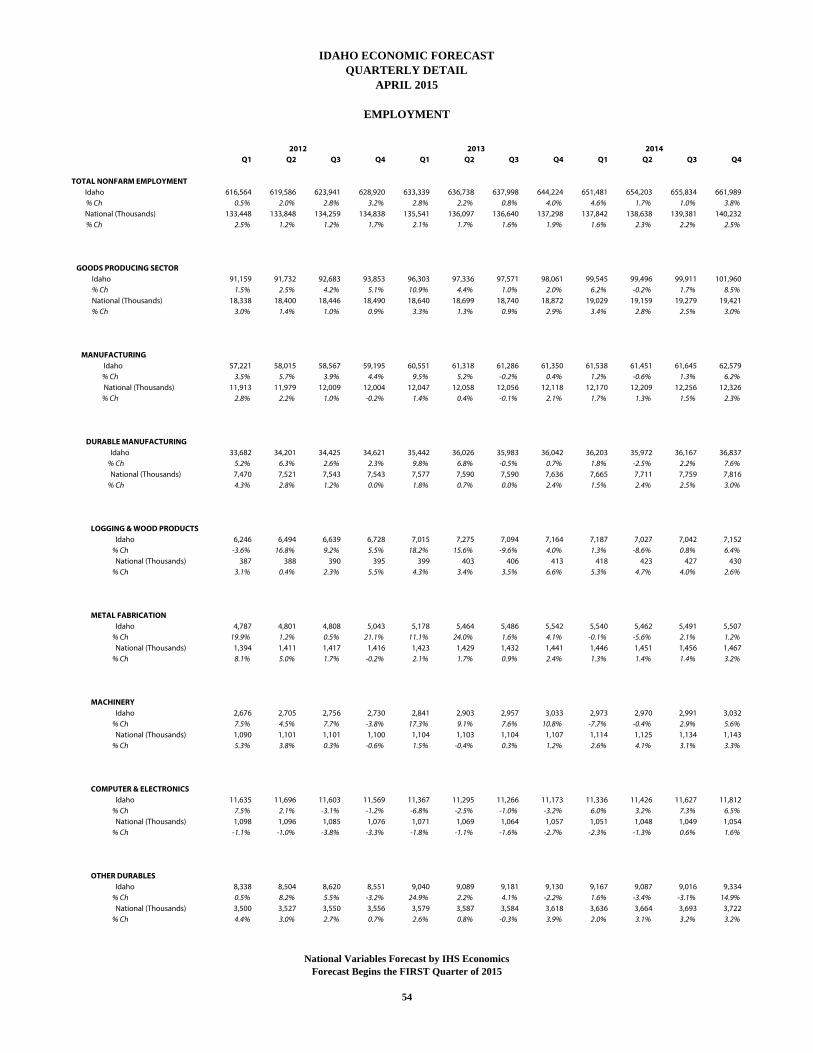
Q1 Q2 Q3 Q4 Q1 Q2 Q3 Q4 Q1 Q2 Q3 Q4
TOTAL NONFARM EMPLOYMENT Idaho 616,564 619,586 623,941 628,920 633,339 636,738 637,998 644,224 651,481 654,203 655,834 661,989 % Ch 0.5% 2.0% 2.8% 3.2% 2.8% 2.2% 0.8% 4.0% 4.6% 1.7% 1.0% 3.8% National (Thousands) 133,448 133,848 134,259 134,838 135,541 136,097 136,640 137,298 137,842 138,638 139,381 140,232 % Ch 2.5% 1.2% 1.2% 1.7% 2.1% 1.7% 1.6% 1.9% 1.6% 2.3% 2.2% 2.5%
GOODS PRODUCING SECTOR Idaho 91,159 91,732 92,683 93,853 96,303 97,336 97,571 98,061 99,545 99,496 99,911 101,960 % Ch 1.5% 2.5% 4.2% 5.1% 10.9% 4.4% 1.0% 2.0% 6.2% -0.2% 1.7% 8.5% National (Thousands) 18,338 18,400 18,446 18,490 18,640 18,699 18,740 18,872 19,029 19,159 19,279 19,421 % Ch 3.0% 1.4% 1.0% 0.9% 3.3% 1.3% 0.9% 2.9% 3.4% 2.8% 2.5% 3.0%
MANUFACTURING Idaho 57,221 58,015 58,567 59,195 60,551 61,318 61,286 61,350 61,538 61,451 61,645 62,579 % Ch 3.5% 5.7% 3.9% 4.4% 9.5% 5.2% -0.2% 0.4% 1.2% -0.6% 1.3% 6.2% National (Thousands) 11,913 11,979 12,009 12,004 12,047 12,058 12,056 12,118 12,170 12,209 12,256 12,326 % Ch 2.8% 2.2% 1.0% -0.2% 1.4% 0.4% -0.1% 2.1% 1.7% 1.3% 1.5% 2.3%
DURABLE MANUFACTURING Idaho 33,682 34,201 34,425 34,621 35,442 36,026 35,983 36,042 36,203 35,972 36,167 36,837 % Ch 5.2% 6.3% 2.6% 2.3% 9.8% 6.8% -0.5% 0.7% 1.8% -2.5% 2.2% 7.6% National (Thousands) 7,470 7,521 7,543 7,543 7,577 7,590 7,590 7,636 7,665 7,711 7,759 7,816 % Ch 4.3% 2.8% 1.2% 0.0% 1.8% 0.7% 0.0% 2.4% 1.5% 2.4% 2.5% 3.0%
LOGGING & WOOD PRODUCTS Idaho 6,246 6,494 6,639 6,728 7,015 7,275 7,094 7,164 7,187 7,027 7,042 7,152 % Ch -3.6% 16.8% 9.2% 5.5% 18.2% 15.6% -9.6% 4.0% 1.3% -8.6% 0.8% 6.4% National (Thousands) 387 388 390 395 399 403 406 413 418 423 427 430 % Ch 3.1% 0.4% 2.3% 5.5% 4.3% 3.4% 3.5% 6.6% 5.3% 4.7% 4.0% 2.6%
METAL FABRICATION Idaho 4,787 4,801 4,808 5,043 5,178 5,464 5,486 5,542 5,540 5,462 5,491 5,507 % Ch 19.9% 1.2% 0.5% 21.1% 11.1% 24.0% 1.6% 4.1% -0.1% -5.6% 2.1% 1.2% National (Thousands) 1,394 1,411 1,417 1,416 1,423 1,429 1,432 1,441 1,446 1,451 1,456 1,467 % Ch 8.1% 5.0% 1.7% -0.2% 2.1% 1.7% 0.9% 2.4% 1.3% 1.4% 1.4% 3.2%
MACHINERY Idaho 2,676 2,705 2,756 2,730 2,841 2,903 2,957 3,033 2,973 2,970 2,991 3,032 % Ch 7.5% 4.5% 7.7% -3.8% 17.3% 9.1% 7.6% 10.8% -7.7% -0.4% 2.9% 5.6% National (Thousands) 1,090 1,101 1,101 1,100 1,104 1,103 1,104 1,107 1,114 1,125 1,134 1,143 % Ch 5.3% 3.8% 0.3% -0.6% 1.5% -0.4% 0.3% 1.2% 2.6% 4.1% 3.1% 3.3%
COMPUTER & ELECTRONICS Idaho 11,635 11,696 11,603 11,569 11,367 11,295 11,266 11,173 11,336 11,426 11,627 11,812 % Ch 7.5% 2.1% -3.1% -1.2% -6.8% -2.5% -1.0% -3.2% 6.0% 3.2% 7.3% 6.5% National (Thousands) 1,098 1,096 1,085 1,076 1,071 1,069 1,064 1,057 1,051 1,048 1,049 1,054 % Ch -1.1% -1.0% -3.8% -3.3% -1.8% -1.1% -1.6% -2.7% -2.3% -1.3% 0.6% 1.6%
OTHER DURABLES Idaho 8,338 8,504 8,620 8,551 9,040 9,089 9,181 9,130 9,167 9,087 9,016 9,334 % Ch 0.5% 8.2% 5.5% -3.2% 24.9% 2.2% 4.1% -2.2% 1.6% -3.4% -3.1% 14.9% National (Thousands) 3,500 3,527 3,550 3,556 3,579 3,587 3,584 3,618 3,636 3,664 3,693 3,722 % Ch 4.4% 3.0% 2.7% 0.7% 2.6% 0.8% -0.3% 3.9% 2.0% 3.1% 3.2% 3.2%
IDAHO ECONOMIC FORECASTQUARTERLY DETAIL
APRIL 2015
EMPLOYMENT
20142012 2013
National Variables Forecast by IHS EconomicsForecast Begins the FIRST Quarter of 2015
54
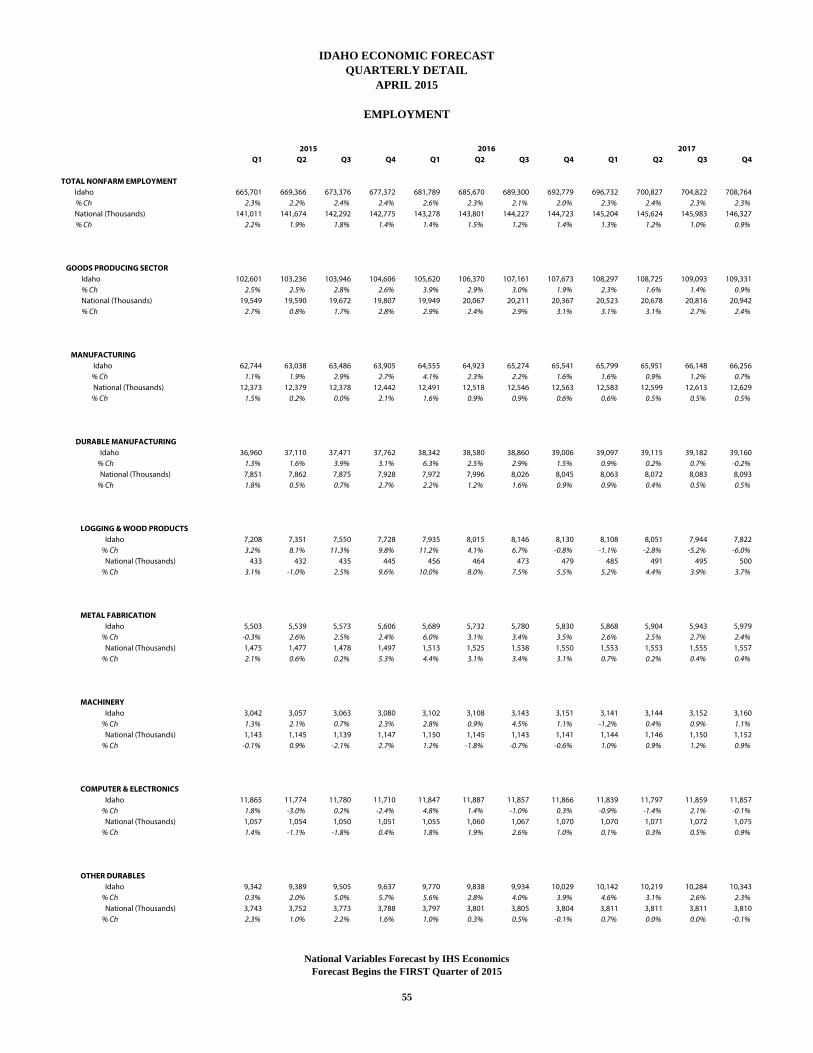
Q1 Q2 Q3 Q4 Q1 Q2 Q3 Q4 Q1 Q2 Q3 Q4
TOTAL NONFARM EMPLOYMENT Idaho 665,701 669,366 673,376 677,372 681,789 685,670 689,300 692,779 696,732 700,827 704,822 708,764 % Ch 2.3% 2.2% 2.4% 2.4% 2.6% 2.3% 2.1% 2.0% 2.3% 2.4% 2.3% 2.3% National (Thousands) 141,011 141,674 142,292 142,775 143,278 143,801 144,227 144,723 145,204 145,624 145,983 146,327 % Ch 2.2% 1.9% 1.8% 1.4% 1.4% 1.5% 1.2% 1.4% 1.3% 1.2% 1.0% 0.9%
GOODS PRODUCING SECTOR Idaho 102,601 103,236 103,946 104,606 105,620 106,370 107,161 107,673 108,297 108,725 109,093 109,331 % Ch 2.5% 2.5% 2.8% 2.6% 3.9% 2.9% 3.0% 1.9% 2.3% 1.6% 1.4% 0.9% National (Thousands) 19,549 19,590 19,672 19,807 19,949 20,067 20,211 20,367 20,523 20,678 20,816 20,942 % Ch 2.7% 0.8% 1.7% 2.8% 2.9% 2.4% 2.9% 3.1% 3.1% 3.1% 2.7% 2.4%
MANUFACTURING Idaho 62,744 63,038 63,486 63,905 64,555 64,923 65,274 65,541 65,799 65,951 66,148 66,256 % Ch 1.1% 1.9% 2.9% 2.7% 4.1% 2.3% 2.2% 1.6% 1.6% 0.9% 1.2% 0.7% National (Thousands) 12,373 12,379 12,378 12,442 12,491 12,518 12,546 12,563 12,583 12,599 12,613 12,629 % Ch 1.5% 0.2% 0.0% 2.1% 1.6% 0.9% 0.9% 0.6% 0.6% 0.5% 0.5% 0.5%
DURABLE MANUFACTURING Idaho 36,960 37,110 37,471 37,762 38,342 38,580 38,860 39,006 39,097 39,115 39,182 39,160 % Ch 1.3% 1.6% 3.9% 3.1% 6.3% 2.5% 2.9% 1.5% 0.9% 0.2% 0.7% -0.2% National (Thousands) 7,851 7,862 7,875 7,928 7,972 7,996 8,026 8,045 8,063 8,072 8,083 8,093 % Ch 1.8% 0.5% 0.7% 2.7% 2.2% 1.2% 1.6% 0.9% 0.9% 0.4% 0.5% 0.5%
LOGGING & WOOD PRODUCTS Idaho 7,208 7,351 7,550 7,728 7,935 8,015 8,146 8,130 8,108 8,051 7,944 7,822 % Ch 3.2% 8.1% 11.3% 9.8% 11.2% 4.1% 6.7% -0.8% -1.1% -2.8% -5.2% -6.0% National (Thousands) 433 432 435 445 456 464 473 479 485 491 495 500 % Ch 3.1% -1.0% 2.5% 9.6% 10.0% 8.0% 7.5% 5.5% 5.2% 4.4% 3.9% 3.7%
METAL FABRICATION Idaho 5,503 5,539 5,573 5,606 5,689 5,732 5,780 5,830 5,868 5,904 5,943 5,979 % Ch -0.3% 2.6% 2.5% 2.4% 6.0% 3.1% 3.4% 3.5% 2.6% 2.5% 2.7% 2.4% National (Thousands) 1,475 1,477 1,478 1,497 1,513 1,525 1,538 1,550 1,553 1,553 1,555 1,557 % Ch 2.1% 0.6% 0.2% 5.3% 4.4% 3.1% 3.4% 3.1% 0.7% 0.2% 0.4% 0.4%
MACHINERY Idaho 3,042 3,057 3,063 3,080 3,102 3,108 3,143 3,151 3,141 3,144 3,152 3,160 % Ch 1.3% 2.1% 0.7% 2.3% 2.8% 0.9% 4.5% 1.1% -1.2% 0.4% 0.9% 1.1% National (Thousands) 1,143 1,145 1,139 1,147 1,150 1,145 1,143 1,141 1,144 1,146 1,150 1,152 % Ch -0.1% 0.9% -2.1% 2.7% 1.2% -1.8% -0.7% -0.6% 1.0% 0.9% 1.2% 0.9%
COMPUTER & ELECTRONICS Idaho 11,865 11,774 11,780 11,710 11,847 11,887 11,857 11,866 11,839 11,797 11,859 11,857 % Ch 1.8% -3.0% 0.2% -2.4% 4.8% 1.4% -1.0% 0.3% -0.9% -1.4% 2.1% -0.1% National (Thousands) 1,057 1,054 1,050 1,051 1,055 1,060 1,067 1,070 1,070 1,071 1,072 1,075 % Ch 1.4% -1.1% -1.8% 0.4% 1.8% 1.9% 2.6% 1.0% 0.1% 0.3% 0.5% 0.9%
OTHER DURABLES Idaho 9,342 9,389 9,505 9,637 9,770 9,838 9,934 10,029 10,142 10,219 10,284 10,343 % Ch 0.3% 2.0% 5.0% 5.7% 5.6% 2.8% 4.0% 3.9% 4.6% 3.1% 2.6% 2.3% National (Thousands) 3,743 3,752 3,773 3,788 3,797 3,801 3,805 3,804 3,811 3,811 3,811 3,810 % Ch 2.3% 1.0% 2.2% 1.6% 1.0% 0.3% 0.5% -0.1% 0.7% 0.0% 0.0% -0.1%
20172015 2016
IDAHO ECONOMIC FORECASTQUARTERLY DETAIL
APRIL 2015
EMPLOYMENT
National Variables Forecast by IHS EconomicsForecast Begins the FIRST Quarter of 2015
55
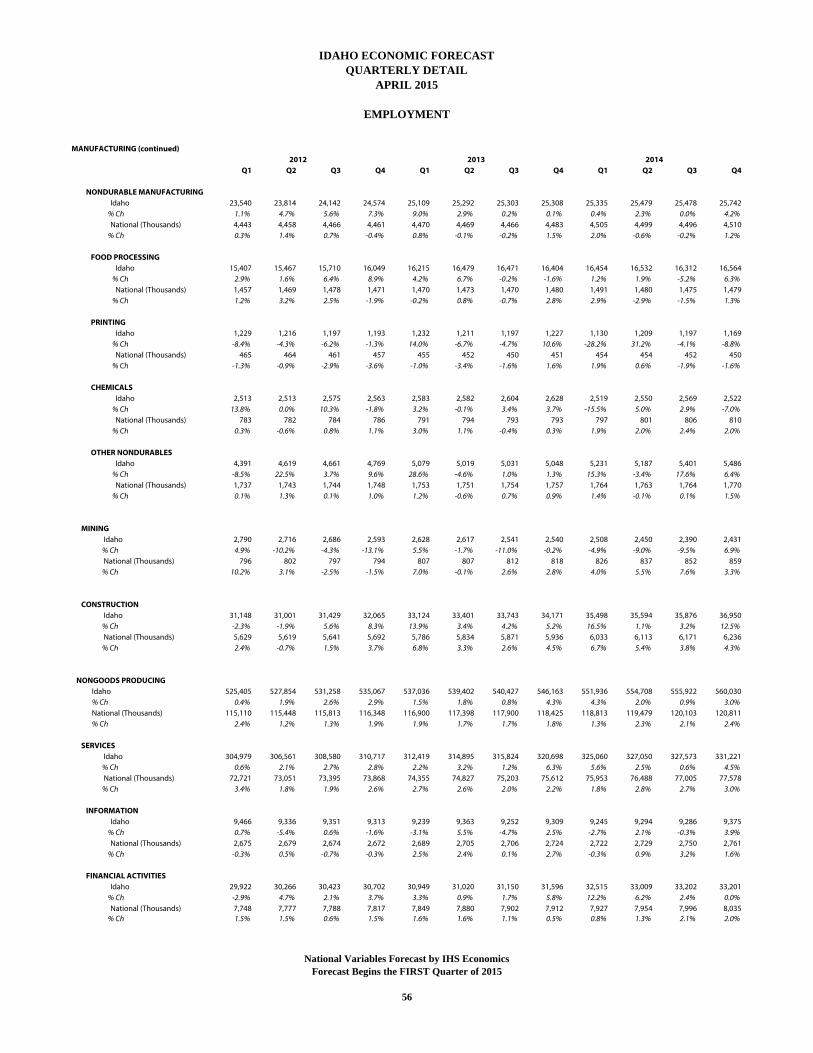
MANUFACTURING (continued)
Q1 Q2 Q3 Q4 Q1 Q2 Q3 Q4 Q1 Q2 Q3 Q4
NONDURABLE MANUFACTURING Idaho 23,540 23,814 24,142 24,574 25,109 25,292 25,303 25,308 25,335 25,479 25,478 25,742 % Ch 1.1% 4.7% 5.6% 7.3% 9.0% 2.9% 0.2% 0.1% 0.4% 2.3% 0.0% 4.2% National (Thousands) 4,443 4,458 4,466 4,461 4,470 4,469 4,466 4,483 4,505 4,499 4,496 4,510 % Ch 0.3% 1.4% 0.7% -0.4% 0.8% -0.1% -0.2% 1.5% 2.0% -0.6% -0.2% 1.2%
FOOD PROCESSING Idaho 15,407 15,467 15,710 16,049 16,215 16,479 16,471 16,404 16,454 16,532 16,312 16,564 % Ch 2.9% 1.6% 6.4% 8.9% 4.2% 6.7% -0.2% -1.6% 1.2% 1.9% -5.2% 6.3% National (Thousands) 1,457 1,469 1,478 1,471 1,470 1,473 1,470 1,480 1,491 1,480 1,475 1,479 % Ch 1.2% 3.2% 2.5% -1.9% -0.2% 0.8% -0.7% 2.8% 2.9% -2.9% -1.5% 1.3%
PRINTING Idaho 1,229 1,216 1,197 1,193 1,232 1,211 1,197 1,227 1,130 1,209 1,197 1,169 % Ch -8.4% -4.3% -6.2% -1.3% 14.0% -6.7% -4.7% 10.6% -28.2% 31.2% -4.1% -8.8% National (Thousands) 465 464 461 457 455 452 450 451 454 454 452 450 % Ch -1.3% -0.9% -2.9% -3.6% -1.0% -3.4% -1.6% 1.6% 1.9% 0.6% -1.9% -1.6%
CHEMICALS Idaho 2,513 2,513 2,575 2,563 2,583 2,582 2,604 2,628 2,519 2,550 2,569 2,522 % Ch 13.8% 0.0% 10.3% -1.8% 3.2% -0.1% 3.4% 3.7% -15.5% 5.0% 2.9% -7.0% National (Thousands) 783 782 784 786 791 794 793 793 797 801 806 810 % Ch 0.3% -0.6% 0.8% 1.1% 3.0% 1.1% -0.4% 0.3% 1.9% 2.0% 2.4% 2.0%
OTHER NONDURABLES Idaho 4,391 4,619 4,661 4,769 5,079 5,019 5,031 5,048 5,231 5,187 5,401 5,486 % Ch -8.5% 22.5% 3.7% 9.6% 28.6% -4.6% 1.0% 1.3% 15.3% -3.4% 17.6% 6.4% National (Thousands) 1,737 1,743 1,744 1,748 1,753 1,751 1,754 1,757 1,764 1,763 1,764 1,770 % Ch 0.1% 1.3% 0.1% 1.0% 1.2% -0.6% 0.7% 0.9% 1.4% -0.1% 0.1% 1.5%
MINING Idaho 2,790 2,716 2,686 2,593 2,628 2,617 2,541 2,540 2,508 2,450 2,390 2,431 % Ch 4.9% -10.2% -4.3% -13.1% 5.5% -1.7% -11.0% -0.2% -4.9% -9.0% -9.5% 6.9% National (Thousands) 796 802 797 794 807 807 812 818 826 837 852 859 % Ch 10.2% 3.1% -2.5% -1.5% 7.0% -0.1% 2.6% 2.8% 4.0% 5.5% 7.6% 3.3%
CONSTRUCTION Idaho 31,148 31,001 31,429 32,065 33,124 33,401 33,743 34,171 35,498 35,594 35,876 36,950 % Ch -2.3% -1.9% 5.6% 8.3% 13.9% 3.4% 4.2% 5.2% 16.5% 1.1% 3.2% 12.5% National (Thousands) 5,629 5,619 5,641 5,692 5,786 5,834 5,871 5,936 6,033 6,113 6,171 6,236 % Ch 2.4% -0.7% 1.5% 3.7% 6.8% 3.3% 2.6% 4.5% 6.7% 5.4% 3.8% 4.3%
NONGOODS PRODUCING Idaho 525,405 527,854 531,258 535,067 537,036 539,402 540,427 546,163 551,936 554,708 555,922 560,030 % Ch 0.4% 1.9% 2.6% 2.9% 1.5% 1.8% 0.8% 4.3% 4.3% 2.0% 0.9% 3.0% National (Thousands) 115,110 115,448 115,813 116,348 116,900 117,398 117,900 118,425 118,813 119,479 120,103 120,811 % Ch 2.4% 1.2% 1.3% 1.9% 1.9% 1.7% 1.7% 1.8% 1.3% 2.3% 2.1% 2.4%
SERVICES Idaho 304,979 306,561 308,580 310,717 312,419 314,895 315,824 320,698 325,060 327,050 327,573 331,221 % Ch 0.6% 2.1% 2.7% 2.8% 2.2% 3.2% 1.2% 6.3% 5.6% 2.5% 0.6% 4.5% National (Thousands) 72,721 73,051 73,395 73,868 74,355 74,827 75,203 75,612 75,953 76,488 77,005 77,578 % Ch 3.4% 1.8% 1.9% 2.6% 2.7% 2.6% 2.0% 2.2% 1.8% 2.8% 2.7% 3.0%
INFORMATION Idaho 9,466 9,336 9,351 9,313 9,239 9,363 9,252 9,309 9,245 9,294 9,286 9,375 % Ch 0.7% -5.4% 0.6% -1.6% -3.1% 5.5% -4.7% 2.5% -2.7% 2.1% -0.3% 3.9% National (Thousands) 2,675 2,679 2,674 2,672 2,689 2,705 2,706 2,724 2,722 2,729 2,750 2,761 % Ch -0.3% 0.5% -0.7% -0.3% 2.5% 2.4% 0.1% 2.7% -0.3% 0.9% 3.2% 1.6%
FINANCIAL ACTIVITIES Idaho 29,922 30,266 30,423 30,702 30,949 31,020 31,150 31,596 32,515 33,009 33,202 33,201 % Ch -2.9% 4.7% 2.1% 3.7% 3.3% 0.9% 1.7% 5.8% 12.2% 6.2% 2.4% 0.0% National (Thousands) 7,748 7,777 7,788 7,817 7,849 7,880 7,902 7,912 7,927 7,954 7,996 8,035 % Ch 1.5% 1.5% 0.6% 1.5% 1.6% 1.6% 1.1% 0.5% 0.8% 1.3% 2.1% 2.0%
IDAHO ECONOMIC FORECASTQUARTERLY DETAIL
APRIL 2015
EMPLOYMENT
2012 2013 2014
National Variables Forecast by IHS EconomicsForecast Begins the FIRST Quarter of 2015
56
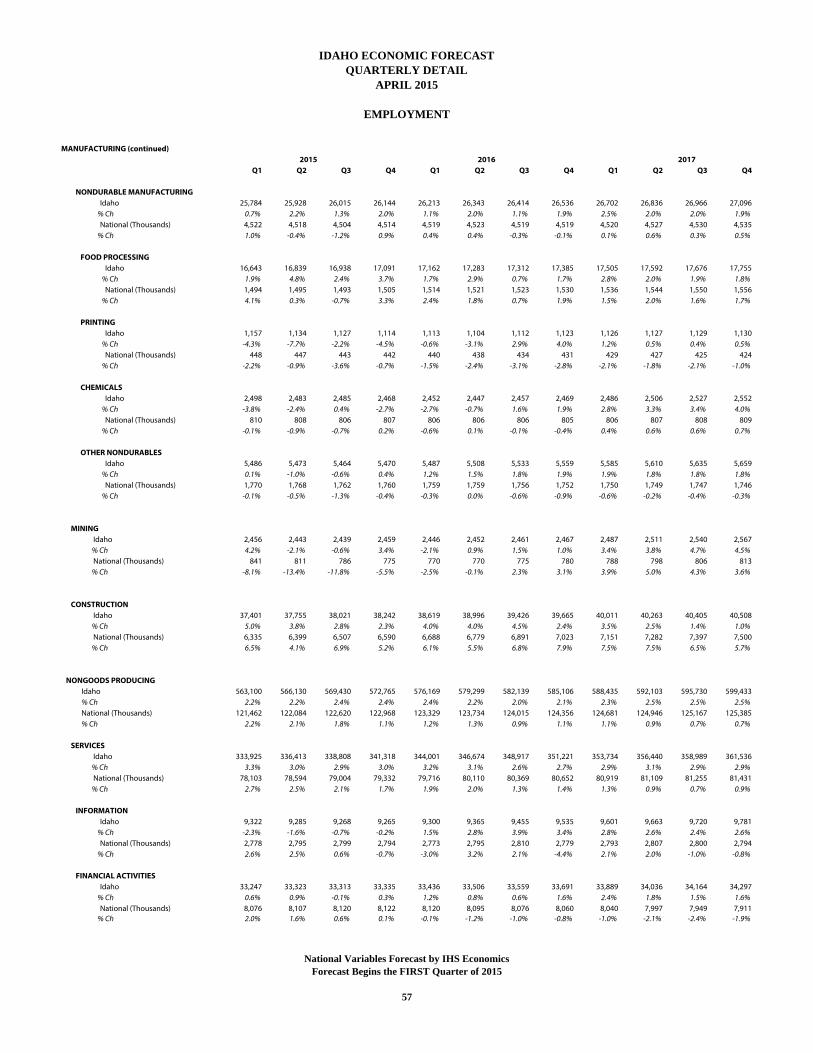
MANUFACTURING (continued)
Q1 Q2 Q3 Q4 Q1 Q2 Q3 Q4 Q1 Q2 Q3 Q4
NONDURABLE MANUFACTURING Idaho 25,784 25,928 26,015 26,144 26,213 26,343 26,414 26,536 26,702 26,836 26,966 27,096 % Ch 0.7% 2.2% 1.3% 2.0% 1.1% 2.0% 1.1% 1.9% 2.5% 2.0% 2.0% 1.9% National (Thousands) 4,522 4,518 4,504 4,514 4,519 4,523 4,519 4,519 4,520 4,527 4,530 4,535 % Ch 1.0% -0.4% -1.2% 0.9% 0.4% 0.4% -0.3% -0.1% 0.1% 0.6% 0.3% 0.5%
FOOD PROCESSING Idaho 16,643 16,839 16,938 17,091 17,162 17,283 17,312 17,385 17,505 17,592 17,676 17,755 % Ch 1.9% 4.8% 2.4% 3.7% 1.7% 2.9% 0.7% 1.7% 2.8% 2.0% 1.9% 1.8% National (Thousands) 1,494 1,495 1,493 1,505 1,514 1,521 1,523 1,530 1,536 1,544 1,550 1,556 % Ch 4.1% 0.3% -0.7% 3.3% 2.4% 1.8% 0.7% 1.9% 1.5% 2.0% 1.6% 1.7%
PRINTING Idaho 1,157 1,134 1,127 1,114 1,113 1,104 1,112 1,123 1,126 1,127 1,129 1,130 % Ch -4.3% -7.7% -2.2% -4.5% -0.6% -3.1% 2.9% 4.0% 1.2% 0.5% 0.4% 0.5% National (Thousands) 448 447 443 442 440 438 434 431 429 427 425 424 % Ch -2.2% -0.9% -3.6% -0.7% -1.5% -2.4% -3.1% -2.8% -2.1% -1.8% -2.1% -1.0%
CHEMICALS Idaho 2,498 2,483 2,485 2,468 2,452 2,447 2,457 2,469 2,486 2,506 2,527 2,552 % Ch -3.8% -2.4% 0.4% -2.7% -2.7% -0.7% 1.6% 1.9% 2.8% 3.3% 3.4% 4.0% National (Thousands) 810 808 806 807 806 806 806 805 806 807 808 809 % Ch -0.1% -0.9% -0.7% 0.2% -0.6% 0.1% -0.1% -0.4% 0.4% 0.6% 0.6% 0.7%
OTHER NONDURABLES Idaho 5,486 5,473 5,464 5,470 5,487 5,508 5,533 5,559 5,585 5,610 5,635 5,659 % Ch 0.1% -1.0% -0.6% 0.4% 1.2% 1.5% 1.8% 1.9% 1.9% 1.8% 1.8% 1.8% National (Thousands) 1,770 1,768 1,762 1,760 1,759 1,759 1,756 1,752 1,750 1,749 1,747 1,746 % Ch -0.1% -0.5% -1.3% -0.4% -0.3% 0.0% -0.6% -0.9% -0.6% -0.2% -0.4% -0.3%
MINING Idaho 2,456 2,443 2,439 2,459 2,446 2,452 2,461 2,467 2,487 2,511 2,540 2,567 % Ch 4.2% -2.1% -0.6% 3.4% -2.1% 0.9% 1.5% 1.0% 3.4% 3.8% 4.7% 4.5% National (Thousands) 841 811 786 775 770 770 775 780 788 798 806 813 % Ch -8.1% -13.4% -11.8% -5.5% -2.5% -0.1% 2.3% 3.1% 3.9% 5.0% 4.3% 3.6%
CONSTRUCTION Idaho 37,401 37,755 38,021 38,242 38,619 38,996 39,426 39,665 40,011 40,263 40,405 40,508 % Ch 5.0% 3.8% 2.8% 2.3% 4.0% 4.0% 4.5% 2.4% 3.5% 2.5% 1.4% 1.0% National (Thousands) 6,335 6,399 6,507 6,590 6,688 6,779 6,891 7,023 7,151 7,282 7,397 7,500 % Ch 6.5% 4.1% 6.9% 5.2% 6.1% 5.5% 6.8% 7.9% 7.5% 7.5% 6.5% 5.7%
NONGOODS PRODUCING Idaho 563,100 566,130 569,430 572,765 576,169 579,299 582,139 585,106 588,435 592,103 595,730 599,433 % Ch 2.2% 2.2% 2.4% 2.4% 2.4% 2.2% 2.0% 2.1% 2.3% 2.5% 2.5% 2.5% National (Thousands) 121,462 122,084 122,620 122,968 123,329 123,734 124,015 124,356 124,681 124,946 125,167 125,385 % Ch 2.2% 2.1% 1.8% 1.1% 1.2% 1.3% 0.9% 1.1% 1.1% 0.9% 0.7% 0.7%
SERVICES Idaho 333,925 336,413 338,808 341,318 344,001 346,674 348,917 351,221 353,734 356,440 358,989 361,536 % Ch 3.3% 3.0% 2.9% 3.0% 3.2% 3.1% 2.6% 2.7% 2.9% 3.1% 2.9% 2.9% National (Thousands) 78,103 78,594 79,004 79,332 79,716 80,110 80,369 80,652 80,919 81,109 81,255 81,431 % Ch 2.7% 2.5% 2.1% 1.7% 1.9% 2.0% 1.3% 1.4% 1.3% 0.9% 0.7% 0.9%
INFORMATION Idaho 9,322 9,285 9,268 9,265 9,300 9,365 9,455 9,535 9,601 9,663 9,720 9,781 % Ch -2.3% -1.6% -0.7% -0.2% 1.5% 2.8% 3.9% 3.4% 2.8% 2.6% 2.4% 2.6% National (Thousands) 2,778 2,795 2,799 2,794 2,773 2,795 2,810 2,779 2,793 2,807 2,800 2,794 % Ch 2.6% 2.5% 0.6% -0.7% -3.0% 3.2% 2.1% -4.4% 2.1% 2.0% -1.0% -0.8%
FINANCIAL ACTIVITIES Idaho 33,247 33,323 33,313 33,335 33,436 33,506 33,559 33,691 33,889 34,036 34,164 34,297 % Ch 0.6% 0.9% -0.1% 0.3% 1.2% 0.8% 0.6% 1.6% 2.4% 1.8% 1.5% 1.6% National (Thousands) 8,076 8,107 8,120 8,122 8,120 8,095 8,076 8,060 8,040 7,997 7,949 7,911 % Ch 2.0% 1.6% 0.6% 0.1% -0.1% -1.2% -1.0% -0.8% -1.0% -2.1% -2.4% -1.9%
2017
IDAHO ECONOMIC FORECAST
2015 2016
EMPLOYMENT
QUARTERLY DETAILAPRIL 2015
National Variables Forecast by IHS EconomicsForecast Begins the FIRST Quarter of 2015
57
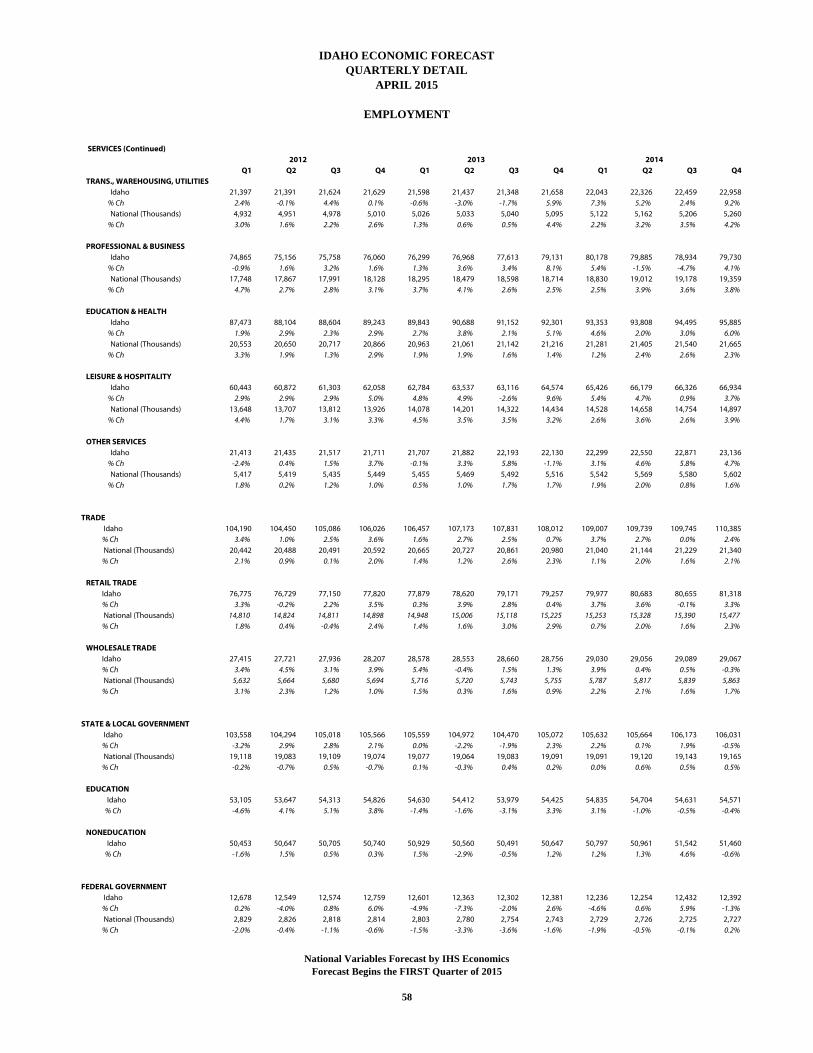
SERVICES (Continued)
Q1 Q2 Q3 Q4 Q1 Q2 Q3 Q4 Q1 Q2 Q3 Q4 TRANS., WAREHOUSING, UTILITIES Idaho 21,397 21,391 21,624 21,629 21,598 21,437 21,348 21,658 22,043 22,326 22,459 22,958 % Ch 2.4% -0.1% 4.4% 0.1% -0.6% -3.0% -1.7% 5.9% 7.3% 5.2% 2.4% 9.2% National (Thousands) 4,932 4,951 4,978 5,010 5,026 5,033 5,040 5,095 5,122 5,162 5,206 5,260 % Ch 3.0% 1.6% 2.2% 2.6% 1.3% 0.6% 0.5% 4.4% 2.2% 3.2% 3.5% 4.2%
PROFESSIONAL & BUSINESS Idaho 74,865 75,156 75,758 76,060 76,299 76,968 77,613 79,131 80,178 79,885 78,934 79,730 % Ch -0.9% 1.6% 3.2% 1.6% 1.3% 3.6% 3.4% 8.1% 5.4% -1.5% -4.7% 4.1% National (Thousands) 17,748 17,867 17,991 18,128 18,295 18,479 18,598 18,714 18,830 19,012 19,178 19,359 % Ch 4.7% 2.7% 2.8% 3.1% 3.7% 4.1% 2.6% 2.5% 2.5% 3.9% 3.6% 3.8%
EDUCATION & HEALTH Idaho 87,473 88,104 88,604 89,243 89,843 90,688 91,152 92,301 93,353 93,808 94,495 95,885 % Ch 1.9% 2.9% 2.3% 2.9% 2.7% 3.8% 2.1% 5.1% 4.6% 2.0% 3.0% 6.0% National (Thousands) 20,553 20,650 20,717 20,866 20,963 21,061 21,142 21,216 21,281 21,405 21,540 21,665 % Ch 3.3% 1.9% 1.3% 2.9% 1.9% 1.9% 1.6% 1.4% 1.2% 2.4% 2.6% 2.3%
LEISURE & HOSPITALITY Idaho 60,443 60,872 61,303 62,058 62,784 63,537 63,116 64,574 65,426 66,179 66,326 66,934 % Ch 2.9% 2.9% 2.9% 5.0% 4.8% 4.9% -2.6% 9.6% 5.4% 4.7% 0.9% 3.7% National (Thousands) 13,648 13,707 13,812 13,926 14,078 14,201 14,322 14,434 14,528 14,658 14,754 14,897 % Ch 4.4% 1.7% 3.1% 3.3% 4.5% 3.5% 3.5% 3.2% 2.6% 3.6% 2.6% 3.9%
OTHER SERVICES Idaho 21,413 21,435 21,517 21,711 21,707 21,882 22,193 22,130 22,299 22,550 22,871 23,136 % Ch -2.4% 0.4% 1.5% 3.7% -0.1% 3.3% 5.8% -1.1% 3.1% 4.6% 5.8% 4.7% National (Thousands) 5,417 5,419 5,435 5,449 5,455 5,469 5,492 5,516 5,542 5,569 5,580 5,602 % Ch 1.8% 0.2% 1.2% 1.0% 0.5% 1.0% 1.7% 1.7% 1.9% 2.0% 0.8% 1.6%
TRADE Idaho 104,190 104,450 105,086 106,026 106,457 107,173 107,831 108,012 109,007 109,739 109,745 110,385 % Ch 3.4% 1.0% 2.5% 3.6% 1.6% 2.7% 2.5% 0.7% 3.7% 2.7% 0.0% 2.4% National (Thousands) 20,442 20,488 20,491 20,592 20,665 20,727 20,861 20,980 21,040 21,144 21,229 21,340 % Ch 2.1% 0.9% 0.1% 2.0% 1.4% 1.2% 2.6% 2.3% 1.1% 2.0% 1.6% 2.1%
RETAIL TRADE Idaho 76,775 76,729 77,150 77,820 77,879 78,620 79,171 79,257 79,977 80,683 80,655 81,318 % Ch 3.3% -0.2% 2.2% 3.5% 0.3% 3.9% 2.8% 0.4% 3.7% 3.6% -0.1% 3.3% National (Thousands) 14,810 14,824 14,811 14,898 14,948 15,006 15,118 15,225 15,253 15,328 15,390 15,477 % Ch 1.8% 0.4% -0.4% 2.4% 1.4% 1.6% 3.0% 2.9% 0.7% 2.0% 1.6% 2.3%
WHOLESALE TRADE Idaho 27,415 27,721 27,936 28,207 28,578 28,553 28,660 28,756 29,030 29,056 29,089 29,067 % Ch 3.4% 4.5% 3.1% 3.9% 5.4% -0.4% 1.5% 1.3% 3.9% 0.4% 0.5% -0.3% National (Thousands) 5,632 5,664 5,680 5,694 5,716 5,720 5,743 5,755 5,787 5,817 5,839 5,863 % Ch 3.1% 2.3% 1.2% 1.0% 1.5% 0.3% 1.6% 0.9% 2.2% 2.1% 1.6% 1.7%
STATE & LOCAL GOVERNMENT Idaho 103,558 104,294 105,018 105,566 105,559 104,972 104,470 105,072 105,632 105,664 106,173 106,031 % Ch -3.2% 2.9% 2.8% 2.1% 0.0% -2.2% -1.9% 2.3% 2.2% 0.1% 1.9% -0.5% National (Thousands) 19,118 19,083 19,109 19,074 19,077 19,064 19,083 19,091 19,091 19,120 19,143 19,165 % Ch -0.2% -0.7% 0.5% -0.7% 0.1% -0.3% 0.4% 0.2% 0.0% 0.6% 0.5% 0.5%
EDUCATION Idaho 53,105 53,647 54,313 54,826 54,630 54,412 53,979 54,425 54,835 54,704 54,631 54,571 % Ch -4.6% 4.1% 5.1% 3.8% -1.4% -1.6% -3.1% 3.3% 3.1% -1.0% -0.5% -0.4%
NONEDUCATION Idaho 50,453 50,647 50,705 50,740 50,929 50,560 50,491 50,647 50,797 50,961 51,542 51,460 % Ch -1.6% 1.5% 0.5% 0.3% 1.5% -2.9% -0.5% 1.2% 1.2% 1.3% 4.6% -0.6%
FEDERAL GOVERNMENT Idaho 12,678 12,549 12,574 12,759 12,601 12,363 12,302 12,381 12,236 12,254 12,432 12,392 % Ch 0.2% -4.0% 0.8% 6.0% -4.9% -7.3% -2.0% 2.6% -4.6% 0.6% 5.9% -1.3% National (Thousands) 2,829 2,826 2,818 2,814 2,803 2,780 2,754 2,743 2,729 2,726 2,725 2,727 % Ch -2.0% -0.4% -1.1% -0.6% -1.5% -3.3% -3.6% -1.6% -1.9% -0.5% -0.1% 0.2%
IDAHO ECONOMIC FORECASTQUARTERLY DETAIL
APRIL 2015
EMPLOYMENT
2012 2013 2014
National Variables Forecast by IHS EconomicsForecast Begins the FIRST Quarter of 2015
58
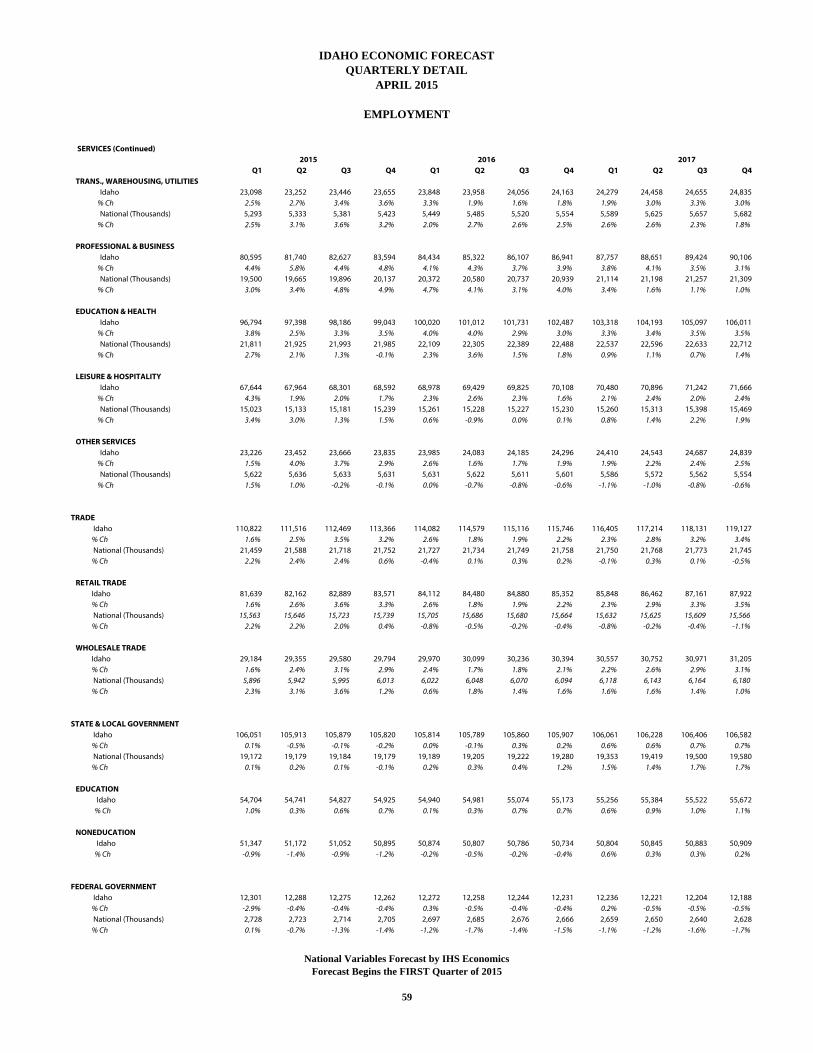
SERVICES (Continued)
Q1 Q2 Q3 Q4 Q1 Q2 Q3 Q4 Q1 Q2 Q3 Q4 TRANS., WAREHOUSING, UTILITIES Idaho 23,098 23,252 23,446 23,655 23,848 23,958 24,056 24,163 24,279 24,458 24,655 24,835 % Ch 2.5% 2.7% 3.4% 3.6% 3.3% 1.9% 1.6% 1.8% 1.9% 3.0% 3.3% 3.0% National (Thousands) 5,293 5,333 5,381 5,423 5,449 5,485 5,520 5,554 5,589 5,625 5,657 5,682 % Ch 2.5% 3.1% 3.6% 3.2% 2.0% 2.7% 2.6% 2.5% 2.6% 2.6% 2.3% 1.8%
PROFESSIONAL & BUSINESS Idaho 80,595 81,740 82,627 83,594 84,434 85,322 86,107 86,941 87,757 88,651 89,424 90,106 % Ch 4.4% 5.8% 4.4% 4.8% 4.1% 4.3% 3.7% 3.9% 3.8% 4.1% 3.5% 3.1% National (Thousands) 19,500 19,665 19,896 20,137 20,372 20,580 20,737 20,939 21,114 21,198 21,257 21,309 % Ch 3.0% 3.4% 4.8% 4.9% 4.7% 4.1% 3.1% 4.0% 3.4% 1.6% 1.1% 1.0%
EDUCATION & HEALTH Idaho 96,794 97,398 98,186 99,043 100,020 101,012 101,731 102,487 103,318 104,193 105,097 106,011 % Ch 3.8% 2.5% 3.3% 3.5% 4.0% 4.0% 2.9% 3.0% 3.3% 3.4% 3.5% 3.5% National (Thousands) 21,811 21,925 21,993 21,985 22,109 22,305 22,389 22,488 22,537 22,596 22,633 22,712 % Ch 2.7% 2.1% 1.3% -0.1% 2.3% 3.6% 1.5% 1.8% 0.9% 1.1% 0.7% 1.4%
LEISURE & HOSPITALITY Idaho 67,644 67,964 68,301 68,592 68,978 69,429 69,825 70,108 70,480 70,896 71,242 71,666 % Ch 4.3% 1.9% 2.0% 1.7% 2.3% 2.6% 2.3% 1.6% 2.1% 2.4% 2.0% 2.4% National (Thousands) 15,023 15,133 15,181 15,239 15,261 15,228 15,227 15,230 15,260 15,313 15,398 15,469 % Ch 3.4% 3.0% 1.3% 1.5% 0.6% -0.9% 0.0% 0.1% 0.8% 1.4% 2.2% 1.9%
OTHER SERVICES Idaho 23,226 23,452 23,666 23,835 23,985 24,083 24,185 24,296 24,410 24,543 24,687 24,839 % Ch 1.5% 4.0% 3.7% 2.9% 2.6% 1.6% 1.7% 1.9% 1.9% 2.2% 2.4% 2.5% National (Thousands) 5,622 5,636 5,633 5,631 5,631 5,622 5,611 5,601 5,586 5,572 5,562 5,554 % Ch 1.5% 1.0% -0.2% -0.1% 0.0% -0.7% -0.8% -0.6% -1.1% -1.0% -0.8% -0.6%
TRADE Idaho 110,822 111,516 112,469 113,366 114,082 114,579 115,116 115,746 116,405 117,214 118,131 119,127 % Ch 1.6% 2.5% 3.5% 3.2% 2.6% 1.8% 1.9% 2.2% 2.3% 2.8% 3.2% 3.4% National (Thousands) 21,459 21,588 21,718 21,752 21,727 21,734 21,749 21,758 21,750 21,768 21,773 21,745 % Ch 2.2% 2.4% 2.4% 0.6% -0.4% 0.1% 0.3% 0.2% -0.1% 0.3% 0.1% -0.5%
RETAIL TRADE Idaho 81,639 82,162 82,889 83,571 84,112 84,480 84,880 85,352 85,848 86,462 87,161 87,922 % Ch 1.6% 2.6% 3.6% 3.3% 2.6% 1.8% 1.9% 2.2% 2.3% 2.9% 3.3% 3.5% National (Thousands) 15,563 15,646 15,723 15,739 15,705 15,686 15,680 15,664 15,632 15,625 15,609 15,566 % Ch 2.2% 2.2% 2.0% 0.4% -0.8% -0.5% -0.2% -0.4% -0.8% -0.2% -0.4% -1.1%
WHOLESALE TRADE Idaho 29,184 29,355 29,580 29,794 29,970 30,099 30,236 30,394 30,557 30,752 30,971 31,205 % Ch 1.6% 2.4% 3.1% 2.9% 2.4% 1.7% 1.8% 2.1% 2.2% 2.6% 2.9% 3.1% National (Thousands) 5,896 5,942 5,995 6,013 6,022 6,048 6,070 6,094 6,118 6,143 6,164 6,180 % Ch 2.3% 3.1% 3.6% 1.2% 0.6% 1.8% 1.4% 1.6% 1.6% 1.6% 1.4% 1.0%
STATE & LOCAL GOVERNMENT Idaho 106,051 105,913 105,879 105,820 105,814 105,789 105,860 105,907 106,061 106,228 106,406 106,582 % Ch 0.1% -0.5% -0.1% -0.2% 0.0% -0.1% 0.3% 0.2% 0.6% 0.6% 0.7% 0.7% National (Thousands) 19,172 19,179 19,184 19,179 19,189 19,205 19,222 19,280 19,353 19,419 19,500 19,580 % Ch 0.1% 0.2% 0.1% -0.1% 0.2% 0.3% 0.4% 1.2% 1.5% 1.4% 1.7% 1.7%
EDUCATION Idaho 54,704 54,741 54,827 54,925 54,940 54,981 55,074 55,173 55,256 55,384 55,522 55,672 % Ch 1.0% 0.3% 0.6% 0.7% 0.1% 0.3% 0.7% 0.7% 0.6% 0.9% 1.0% 1.1%
NONEDUCATION Idaho 51,347 51,172 51,052 50,895 50,874 50,807 50,786 50,734 50,804 50,845 50,883 50,909 % Ch -0.9% -1.4% -0.9% -1.2% -0.2% -0.5% -0.2% -0.4% 0.6% 0.3% 0.3% 0.2%
FEDERAL GOVERNMENT Idaho 12,301 12,288 12,275 12,262 12,272 12,258 12,244 12,231 12,236 12,221 12,204 12,188 % Ch -2.9% -0.4% -0.4% -0.4% 0.3% -0.5% -0.4% -0.4% 0.2% -0.5% -0.5% -0.5% National (Thousands) 2,728 2,723 2,714 2,705 2,697 2,685 2,676 2,666 2,659 2,650 2,640 2,628 % Ch 0.1% -0.7% -1.3% -1.4% -1.2% -1.7% -1.4% -1.5% -1.1% -1.2% -1.6% -1.7%
QUARTERLY DETAILAPRIL 2015
EMPLOYMENT
20172015 2016
IDAHO ECONOMIC FORECAST
National Variables Forecast by IHS EconomicsForecast Begins the FIRST Quarter of 2015
59
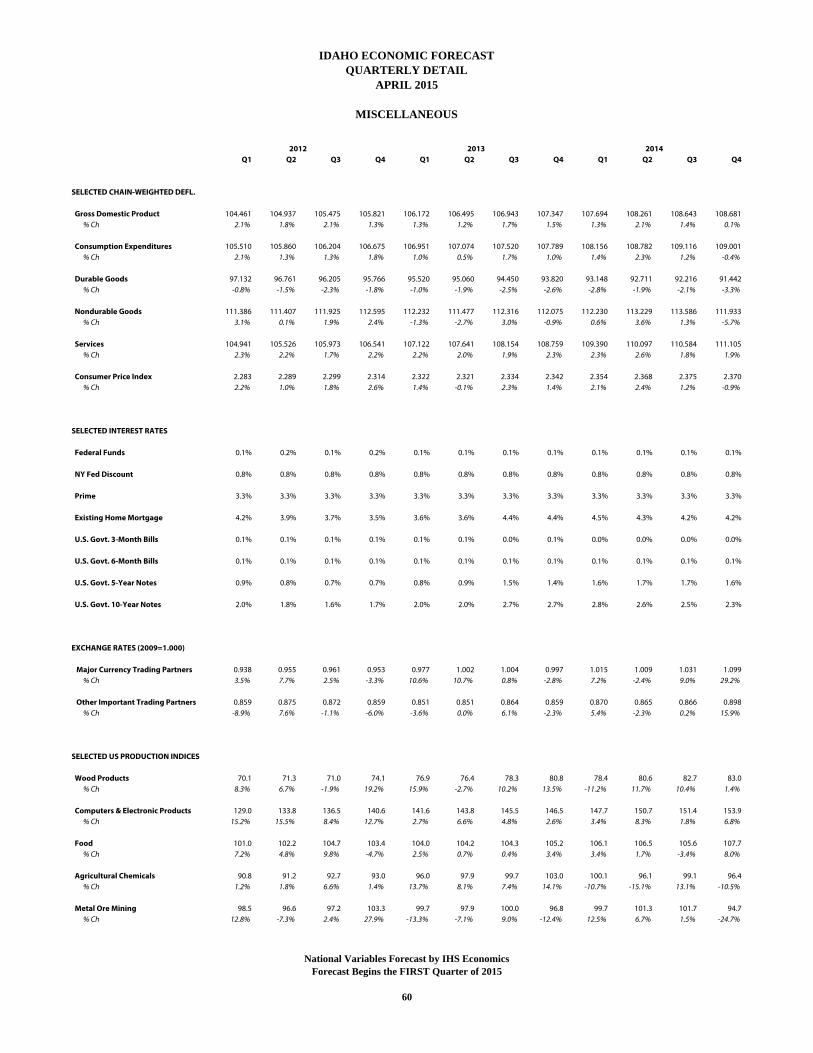
Q1 Q2 Q3 Q4 Q1 Q2 Q3 Q4 Q1 Q2 Q3 Q4
SELECTED CHAIN-WEIGHTED DEFL.
Gross Domestic Product 104.461 104.937 105.475 105.821 106.172 106.495 106.943 107.347 107.694 108.261 108.643 108.681 % Ch 2.1% 1.8% 2.1% 1.3% 1.3% 1.2% 1.7% 1.5% 1.3% 2.1% 1.4% 0.1%
Consumption Expenditures 105.510 105.860 106.204 106.675 106.951 107.074 107.520 107.789 108.156 108.782 109.116 109.001 % Ch 2.1% 1.3% 1.3% 1.8% 1.0% 0.5% 1.7% 1.0% 1.4% 2.3% 1.2% -0.4%
Durable Goods 97.132 96.761 96.205 95.766 95.520 95.060 94.450 93.820 93.148 92.711 92.216 91.442 % Ch -0.8% -1.5% -2.3% -1.8% -1.0% -1.9% -2.5% -2.6% -2.8% -1.9% -2.1% -3.3%
Nondurable Goods 111.386 111.407 111.925 112.595 112.232 111.477 112.316 112.075 112.230 113.229 113.586 111.933 % Ch 3.1% 0.1% 1.9% 2.4% -1.3% -2.7% 3.0% -0.9% 0.6% 3.6% 1.3% -5.7%
Services 104.941 105.526 105.973 106.541 107.122 107.641 108.154 108.759 109.390 110.097 110.584 111.105 % Ch 2.3% 2.2% 1.7% 2.2% 2.2% 2.0% 1.9% 2.3% 2.3% 2.6% 1.8% 1.9%
Consumer Price Index 2.283 2.289 2.299 2.314 2.322 2.321 2.334 2.342 2.354 2.368 2.375 2.370 % Ch 2.2% 1.0% 1.8% 2.6% 1.4% -0.1% 2.3% 1.4% 2.1% 2.4% 1.2% -0.9%
SELECTED INTEREST RATES
Federal Funds 0.1% 0.2% 0.1% 0.2% 0.1% 0.1% 0.1% 0.1% 0.1% 0.1% 0.1% 0.1%
NY Fed Discount 0.8% 0.8% 0.8% 0.8% 0.8% 0.8% 0.8% 0.8% 0.8% 0.8% 0.8% 0.8%
Prime 3.3% 3.3% 3.3% 3.3% 3.3% 3.3% 3.3% 3.3% 3.3% 3.3% 3.3% 3.3%
Existing Home Mortgage 4.2% 3.9% 3.7% 3.5% 3.6% 3.6% 4.4% 4.4% 4.5% 4.3% 4.2% 4.2%
U.S. Govt. 3-Month Bills 0.1% 0.1% 0.1% 0.1% 0.1% 0.1% 0.0% 0.1% 0.0% 0.0% 0.0% 0.0%
U.S. Govt. 6-Month Bills 0.1% 0.1% 0.1% 0.1% 0.1% 0.1% 0.1% 0.1% 0.1% 0.1% 0.1% 0.1%
U.S. Govt. 5-Year Notes 0.9% 0.8% 0.7% 0.7% 0.8% 0.9% 1.5% 1.4% 1.6% 1.7% 1.7% 1.6%
U.S. Govt. 10-Year Notes 2.0% 1.8% 1.6% 1.7% 2.0% 2.0% 2.7% 2.7% 2.8% 2.6% 2.5% 2.3%
EXCHANGE RATES (2009=1.000)
Major Currency Trading Partners 0.938 0.955 0.961 0.953 0.977 1.002 1.004 0.997 1.015 1.009 1.031 1.099 % Ch 3.5% 7.7% 2.5% -3.3% 10.6% 10.7% 0.8% -2.8% 7.2% -2.4% 9.0% 29.2%
Other Important Trading Partners 0.859 0.875 0.872 0.859 0.851 0.851 0.864 0.859 0.870 0.865 0.866 0.898 % Ch -8.9% 7.6% -1.1% -6.0% -3.6% 0.0% 6.1% -2.3% 5.4% -2.3% 0.2% 15.9%
SELECTED US PRODUCTION INDICES
Wood Products 70.1 71.3 71.0 74.1 76.9 76.4 78.3 80.8 78.4 80.6 82.7 83.0 % Ch 8.3% 6.7% -1.9% 19.2% 15.9% -2.7% 10.2% 13.5% -11.2% 11.7% 10.4% 1.4%
Computers & Electronic Products 129.0 133.8 136.5 140.6 141.6 143.8 145.5 146.5 147.7 150.7 151.4 153.9 % Ch 15.2% 15.5% 8.4% 12.7% 2.7% 6.6% 4.8% 2.6% 3.4% 8.3% 1.8% 6.8%
Food 101.0 102.2 104.7 103.4 104.0 104.2 104.3 105.2 106.1 106.5 105.6 107.7 % Ch 7.2% 4.8% 9.8% -4.7% 2.5% 0.7% 0.4% 3.4% 3.4% 1.7% -3.4% 8.0%
Agricultural Chemicals 90.8 91.2 92.7 93.0 96.0 97.9 99.7 103.0 100.1 96.1 99.1 96.4 % Ch 1.2% 1.8% 6.6% 1.4% 13.7% 8.1% 7.4% 14.1% -10.7% -15.1% 13.1% -10.5%
Metal Ore Mining 98.5 96.6 97.2 103.3 99.7 97.9 100.0 96.8 99.7 101.3 101.7 94.7 % Ch 12.8% -7.3% 2.4% 27.9% -13.3% -7.1% 9.0% -12.4% 12.5% 6.7% 1.5% -24.7%
IDAHO ECONOMIC FORECASTQUARTERLY DETAIL
APRIL 2015
MISCELLANEOUS
20132012 2014
National Variables Forecast by IHS EconomicsForecast Begins the FIRST Quarter of 2015
60
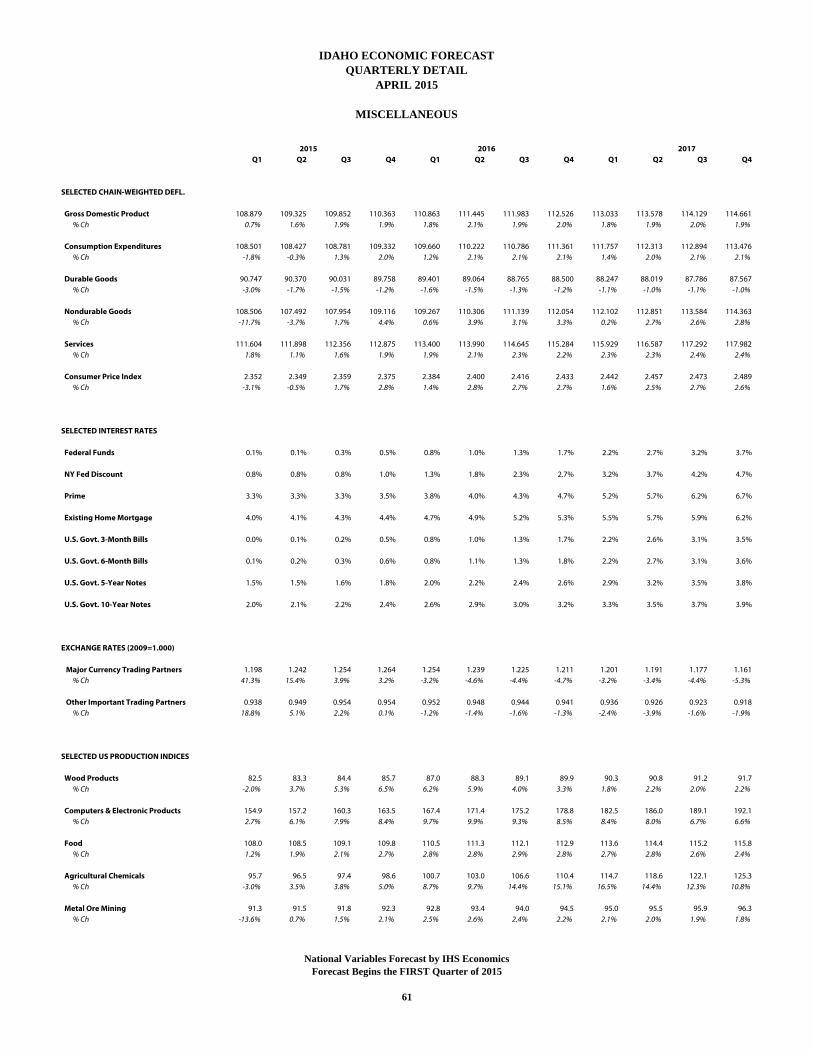
Q1 Q2 Q3 Q4 Q1 Q2 Q3 Q4 Q1 Q2 Q3 Q4
SELECTED CHAIN-WEIGHTED DEFL.
Gross Domestic Product 108.879 109.325 109.852 110.363 110.863 111.445 111.983 112.526 113.033 113.578 114.129 114.661 % Ch 0.7% 1.6% 1.9% 1.9% 1.8% 2.1% 1.9% 2.0% 1.8% 1.9% 2.0% 1.9%
Consumption Expenditures 108.501 108.427 108.781 109.332 109.660 110.222 110.786 111.361 111.757 112.313 112.894 113.476 % Ch -1.8% -0.3% 1.3% 2.0% 1.2% 2.1% 2.1% 2.1% 1.4% 2.0% 2.1% 2.1%
Durable Goods 90.747 90.370 90.031 89.758 89.401 89.064 88.765 88.500 88.247 88.019 87.786 87.567 % Ch -3.0% -1.7% -1.5% -1.2% -1.6% -1.5% -1.3% -1.2% -1.1% -1.0% -1.1% -1.0%
Nondurable Goods 108.506 107.492 107.954 109.116 109.267 110.306 111.139 112.054 112.102 112.851 113.584 114.363 % Ch -11.7% -3.7% 1.7% 4.4% 0.6% 3.9% 3.1% 3.3% 0.2% 2.7% 2.6% 2.8%
Services 111.604 111.898 112.356 112.875 113.400 113.990 114.645 115.284 115.929 116.587 117.292 117.982 % Ch 1.8% 1.1% 1.6% 1.9% 1.9% 2.1% 2.3% 2.2% 2.3% 2.3% 2.4% 2.4%
Consumer Price Index 2.352 2.349 2.359 2.375 2.384 2.400 2.416 2.433 2.442 2.457 2.473 2.489 % Ch -3.1% -0.5% 1.7% 2.8% 1.4% 2.8% 2.7% 2.7% 1.6% 2.5% 2.7% 2.6%
SELECTED INTEREST RATES
Federal Funds 0.1% 0.1% 0.3% 0.5% 0.8% 1.0% 1.3% 1.7% 2.2% 2.7% 3.2% 3.7%
NY Fed Discount 0.8% 0.8% 0.8% 1.0% 1.3% 1.8% 2.3% 2.7% 3.2% 3.7% 4.2% 4.7%
Prime 3.3% 3.3% 3.3% 3.5% 3.8% 4.0% 4.3% 4.7% 5.2% 5.7% 6.2% 6.7%
Existing Home Mortgage 4.0% 4.1% 4.3% 4.4% 4.7% 4.9% 5.2% 5.3% 5.5% 5.7% 5.9% 6.2%
U.S. Govt. 3-Month Bills 0.0% 0.1% 0.2% 0.5% 0.8% 1.0% 1.3% 1.7% 2.2% 2.6% 3.1% 3.5%
U.S. Govt. 6-Month Bills 0.1% 0.2% 0.3% 0.6% 0.8% 1.1% 1.3% 1.8% 2.2% 2.7% 3.1% 3.6%
U.S. Govt. 5-Year Notes 1.5% 1.5% 1.6% 1.8% 2.0% 2.2% 2.4% 2.6% 2.9% 3.2% 3.5% 3.8%
U.S. Govt. 10-Year Notes 2.0% 2.1% 2.2% 2.4% 2.6% 2.9% 3.0% 3.2% 3.3% 3.5% 3.7% 3.9%
EXCHANGE RATES (2009=1.000)
Major Currency Trading Partners 1.198 1.242 1.254 1.264 1.254 1.239 1.225 1.211 1.201 1.191 1.177 1.161 % Ch 41.3% 15.4% 3.9% 3.2% -3.2% -4.6% -4.4% -4.7% -3.2% -3.4% -4.4% -5.3%
Other Important Trading Partners 0.938 0.949 0.954 0.954 0.952 0.948 0.944 0.941 0.936 0.926 0.923 0.918 % Ch 18.8% 5.1% 2.2% 0.1% -1.2% -1.4% -1.6% -1.3% -2.4% -3.9% -1.6% -1.9%
SELECTED US PRODUCTION INDICES
Wood Products 82.5 83.3 84.4 85.7 87.0 88.3 89.1 89.9 90.3 90.8 91.2 91.7 % Ch -2.0% 3.7% 5.3% 6.5% 6.2% 5.9% 4.0% 3.3% 1.8% 2.2% 2.0% 2.2%
Computers & Electronic Products 154.9 157.2 160.3 163.5 167.4 171.4 175.2 178.8 182.5 186.0 189.1 192.1 % Ch 2.7% 6.1% 7.9% 8.4% 9.7% 9.9% 9.3% 8.5% 8.4% 8.0% 6.7% 6.6%
Food 108.0 108.5 109.1 109.8 110.5 111.3 112.1 112.9 113.6 114.4 115.2 115.8 % Ch 1.2% 1.9% 2.1% 2.7% 2.8% 2.8% 2.9% 2.8% 2.7% 2.8% 2.6% 2.4%
Agricultural Chemicals 95.7 96.5 97.4 98.6 100.7 103.0 106.6 110.4 114.7 118.6 122.1 125.3 % Ch -3.0% 3.5% 3.8% 5.0% 8.7% 9.7% 14.4% 15.1% 16.5% 14.4% 12.3% 10.8%
Metal Ore Mining 91.3 91.5 91.8 92.3 92.8 93.4 94.0 94.5 95.0 95.5 95.9 96.3 % Ch -13.6% 0.7% 1.5% 2.1% 2.5% 2.6% 2.4% 2.2% 2.1% 2.0% 1.9% 1.8%
2017
IDAHO ECONOMIC FORECASTQUARTERLY DETAIL
APRIL 2015
MISCELLANEOUS
2015 2016
National Variables Forecast by IHS EconomicsForecast Begins the FIRST Quarter of 2015
61

This page left blank intentionally.
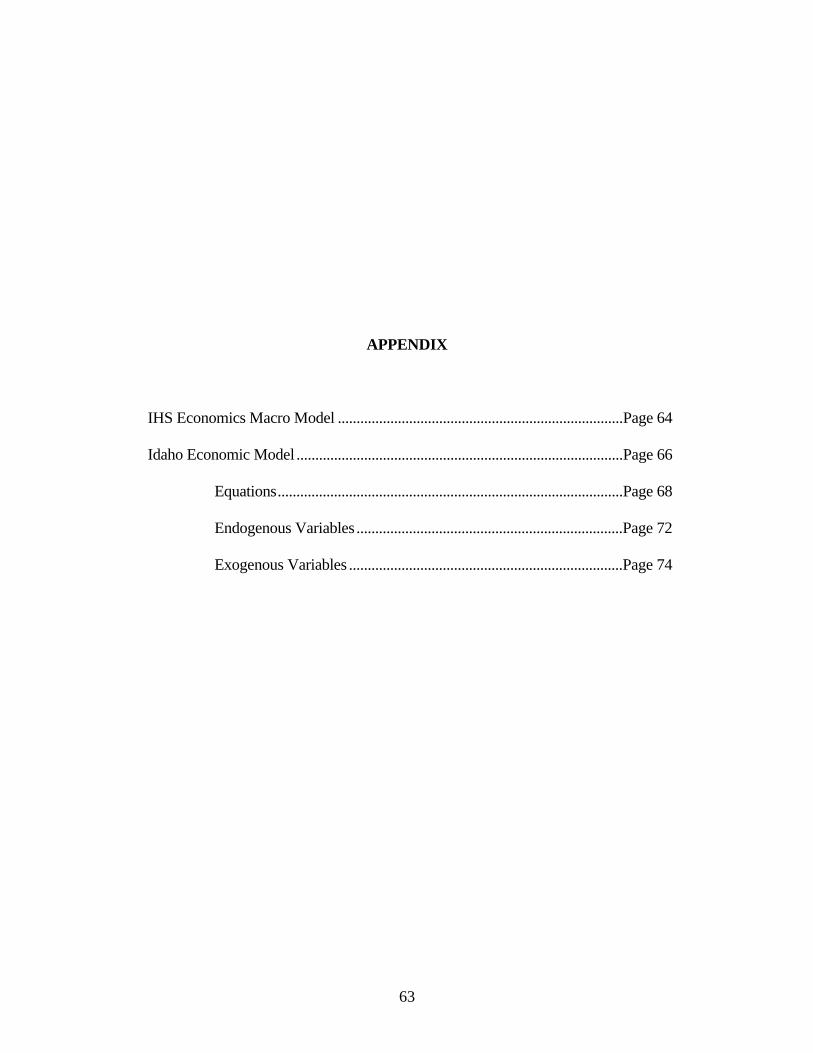
63
APPENDIX IHS Economics Macro Model ............................................................................ Page 64 Idaho Economic Model ....................................................................................... Page 66 Equations ............................................................................................ Page 68 Endogenous Variables ....................................................................... Page 72 Exogenous Variables ......................................................................... Page 74
64
THE IHS ECONOMICS US MACROECONOMIC MODEL IHS Economics Macroeconomic Model is a multiple-equation model of the US economy. Consisting of over 1,200 equations, the model is solved iteratively to generate the results of different policy and forecast scenarios. The model incorporates the best insights of many theoretical schools of thought to depict the economic decision processes and interactions of households, businesses, and governments. The IHS Economics model is divided into the following eight major sectors: I Private Domestic Spending II Production and Income III Taxes IV International Transactions V Financial VI Inflation VII Supply VIII Expectations I. Private Domestic Spending. Major aggregate demand components include consumption,
investment, and government. Consumer purchases are divided among three categories: durable goods, nondurable goods, and services. In nearly all cases, real expenditures are influenced by real income and the relative price of consumer goods. Durable and semidurable goods are also sensitive to household net worth, current finance costs, and consumer sentiment.
IHS Economics divides investment into two general categories: fixed investment and inventories.
The former is driven by utilization rates, capital stock, relative prices, financial market conditions, financial balance sheet conditions, and government policies. Inventory investment is heavily influenced by such factors as past and present sales levels, vendor performance, and utilization rates.
The government sector is divided into federal government and state and local government. Most of
the federal expenditure side is exogenous. Federal receipts are endogenous and divided into personal taxes, corporate taxes, indirect business taxes, and contributions for social insurance. State and local sector receipts depend primarily on federal grants and various tax rates and bases. State and local government spending is driven by legal requirements (i.e., balanced budgets), the level of federal grants (due to the matching requirements of many programs), population growth, and trend increases in personal income.
II. Production and Income. The industrial production sector includes 74 standard industrial
classifications. Production is a function of various cyclical and trend variables and a generated output term, i.e., the input-output (I-O) relationship between the producing industry and both intermediate industries and final demand. The cyclical and trend variables correct for changes in I-O coefficients that are implied by the changing relationship between buyers and sellers.
Pre-tax income categories include private and government wages, corporate profits, interest rate, and
entrepreneurial returns. Each of these categories, except corporate profits, is determined by some combination of wages, prices, interest rates, debt levels, capacity utilization rate, and unemployment rate. Corporate profits are calculated as the residual of total national income less the nonprofit components of income mentioned above.
65
III. Taxes. The model tracks personal, corporate, payroll, and excise taxes separately. Tax revenues are
simultaneously forecast as the product of the rate and the associated pre-tax income components. The model automatically adjusts the effective average personal tax rate for variations in inflation and income per household, and the effective average corporate rate for credits earned on equipment, utility structures, and R&D. State taxes are fully endogenous, except for corporate profits and social insurance tax rates.
IV. International. The international sector can either add or divert strength from the central flow of
domestic income and spending. Imports’ ability to capture varying shares of domestic demand depends on the prices of foreign output, the US exchange rate, and competing domestic prices. Exports’ portion of domestic spending depends on similar variables and the level of world gross domestic product. The exchange rate itself responds to international differences in inflation, interest rates, trade deficits, and capital flows between the US and its competitors. Investment income flows are also explicitly modeled.
V. Financial. The IHS Economics model includes a highly detailed financial sector. Several short- and
long-term interest rates are covered in this model, and they are the key output of this sector. The short-term rates depend upon the balance between the demand and supply of reserves in the banking system. The supply of reserves is the primary exogenous monetary policy lever within the model, reflecting the Federal Reserve’s open market purchases or sales of Treasury securities. Longer-term interest rates are driven by shorter-term rates as well as factors affecting the slope of the yield curve. These factors include inflation expectations, government borrowing requirements, and corporate finance needs.
VI. Inflation. Inflation is modeled as a controlled, interactive process involving wages, prices, and
market conditions. The principal domestic cost influences are labor compensation, nonfarm productivity, and foreign input costs that later are driven by the exchange rate, the price of oil, and foreign wholesale price inflation. This set of cost influences drives each of the industry-specific producer price indexes, in combination with a demand pressure indicator and appropriately weighted composites of the other producer price indexes.
VII. Supply. In this model, aggregate supply (or potential GNP), is estimated by a Cobb-Douglas
production function that combines factor input growth and improvements to total factor productivity. Factor input equals a weighted average of labor, business fixed capital, and energy. Factor supplies are defined by estimates of the full employment labor force, the full employment capital stock net of pollution abatement equipment, the domestic production of petroleum and natural gas, and the stock of infrastructure. Total factor productivity depends upon the stock of research and development capital and trend technological change.
VIII. Expectations. Expectations impact several expenditure categories in the model, but the principal
nuance relates to the entire spectrum of interest rates. Shifts in price expectations or the expected government capital needs influences are captured directly in this model through price expectations and budget deficit terms. The former impacts all interest rates and the latter impacts intermediate- and long-term rates. On the expenditure side, inflationary expectations impact consumption via consumer sentiment, while growth expectations affect business investment.
66
THE IDAHO ECONOMIC MODEL The Idaho Economic Model (IEM) is an income and employment based model of Idaho's economy. The Model consists of a simultaneous system of linear regression equations, which are estimated using quarterly data. The primary exogenous variables are obtained from the IHS Economics US Macroeconomic Model. Endogenous variables are forecast at the statewide level of aggregation. The focal point of the IEM is Idaho personal income, which is given by the identity: personal income = wage and salary payments + other labor income + farm proprietors' income + nonfarm proprietors' income + property income + transfer payments - contributions for social insurance + residence adjustment. With the exception of farm proprietors' income and wage and salary payments, each of the components of personal income is estimated stochastically by a single equation. Farm proprietors' income and wage and salary payments each comprise submodels containing a system of stochastic equations and identities. The farm proprietor sector is estimated using a highly-aggregated submodel consisting of equations for crop marketing receipts, livestock marketing receipts, production expenses, inventory changes, imputed rent income, corporate farm income, and government payments to farmers. Farm proprietors' income includes inventory changes and imputed rent, but this component is netted out of the tax base. At the heart of the IEM is the wage and salary sector, which includes stochastic employment equations for 23 North American Industry Classification System employment categories. Conceptually, the employment equations are divided into basic and domestic activities. The basic employment equations are specified primarily as functions of national demand and supply variables. Domestic employment equations are specified primarily as functions of state-specific demand variables. Average annual wages are estimated for several broad employment categories and are combined with employment to arrive at aggregate wage and salary payments. The demographic component of the model is used to forecast components of population change and housing starts. Resident population, births, and deaths are modeled stochastically. Net migration is calculated residually from the estimates for those variables. Housing starts are divided into single and multiple units. Each equation is functionally related to economic and population variables. The output of the IEM (i.e., the forecast values of the endogenous variables) is determined by the parameters of the equations and the values of exogenous variables over the forecast period. The values of equation parameters are determined by the historic values of both the exogenous and endogenous variables. IEM equation parameters are estimated using the technique of ordinary least squares. Model equations are occasionally respecified in response to the dynamic nature of the Idaho and national economies. Parameter values for a particular equation (given the same specification) may change as a result of revisions in the historic data or a change in the time interval of the estimation. In general, parameter values should remain relatively constant over time, with changes reflecting changing structural relationships. While the equation parameters are determined by structural relationships and remain relatively fixed, the forecast period exogenous variable values are more volatile determinants of the forecast values of endogenous variables. They are more often subject to change as expectations regarding future economic

67
behavior change, and they are more likely to give rise to debate over appropriate values. As mentioned above, the forecast period values of exogenous variables are primarily obtained from IHS Economics US macroeconomic model. Since the output of the IEM depends in large part upon the output of the IHS Economics model, an understanding of the IHS Economics model, its input assumptions, and its output is useful in evaluating the results of the IEM's forecast. The assumptions and output of the IHS Economics model are discussed in the National Forecast section.
68
IDAHO ECONOMIC MODEL
EEA_ID = EEA_ID_GOODS + EEA_ID_NONGOODS
EEA_ID_2100 = 3209.3774504 + 18.8691226543*@MOVAV(ID0IP2122_2123(-1),4) - 2126.44218861*JECIWSP/WPI10 - 1320.79539584*@MOVAV(JEXCHOITPREAL(-1),2)
EEA_ID_2300 = -15413.7581271 + 288.9768619*ID0HSPRS1_A + 247.694453057*ID0HSPRS1_A(-1) +
206.412044214*ID0HSPRS1_A(-2) + 165.129635371*ID0HSPRS1_A(-3) + 123.847226529*ID0HSPRS1_A(-4) +
82.5648176857*ID0HSPRS1_A(-5) + 41.2824088428*ID0HSPRS1_A(-6) + 0.139193181464*EEA_ID_44_45 +
0.119308441255*EEA_ID_44_45(-1) + 0.0994237010458*EEA_ID_44_45(-2) +
0.0795389608367*EEA_ID_44_45(-3) + 0.0596542206275*EEA_ID_44_45(-4) +
0.0397694804183*EEA_ID_44_45(-5) + 0.0198847402092*EEA_ID_44_45(-6)
EEA_ID_3110 = 25134.0272042 + 443.676078535*@MOVAV(IPSG311(-1),4) - 850.599543175*@MOVAV((IPSG311/EMN311),6) - 3409.53680825*@MOVAV(JEXCHOITPREAL(-1),2) + 43.7630453647*@TREND
EEA_ID_3230 = 1446.53601139 + 26.5570338193*@MOVAV(IPSG323,4) - 12.0802111214*@MOVAV((IPSG323/EMN323),8) - 318.554461144*@MOVAV(JEXCHMTPREAL(-1),2)
EEA_ID_3250 = 4263.62701288 + 6.86247411202*@MOVAV(IPSG3253(-1),8) - 1907.17101781*DUM951ON - 715.555125994*@MOVAV(JEXCHMTPREAL(-1),2)
EEA_ID_3320 = 1760.44880215 + 34.4315625066*@MOVAV(IPSG332,2) + 10.0670222171*@TREND - 1851.84269845*@MOVAV(JEXCHOITPREAL(-1),2)
EEA_ID_3330 = 6518.10808191 + 0.12506292059*@MOVAV(IPSG3332,8)*@TREND - 23.3171440983*@TREND - 1632.60867931*@MOVAV(JEXCHOITPREAL(-1),4)
EEA_ID_3340 = 15660.8598532 + 236.706039904*@MOVAV(IPSG334,4) - 270.904617771*@MOVAV(IPSG334,8)/@MOVAV(EMD334,8) - 35.7932561878*DUM991ON*IPSG334
EEA_ID_4200 = 5988.75641952 + 0.269235787694*EEA_ID_44_45
EEA_ID_44_45 = 47647.420476 + 233.894124374*@MOVAV(YPADJ_ID,4)/@MOVAV(JPC,4) - 530.930586925*@TREND
EEA_ID_48_49_22 = -4444.04516422 + 0.651173474945*@MOVAV(EEA_ID_4200,2) + 5150.06393645*@MOVAV(ID0NPT(-1),8)
EEA_ID_5100 = -11121.5607322 + 83.0954947461*@MOVAV(IPSG51111,4) + 101.04944098*@TREND - 2199.4792214*@MOVAV(JEXCHMTPREAL(-1),2)
EEA_ID_52_53 = 9622.88258284 - 3922.42184019*DUM981ON + 46.0048265705*YPADJ_ID/JPC + 138.206137741*@MOVAV(ID0HSPR(-1),4)
EEA_ID_54_55_56 = -7206.35195969 + 1.7195481279*@MOVAV(ID0YP(-1),4)
EEA_ID_61_62 = -42145.7007575 + 60739.2491502*@MOVAV(ID0NPT,4) + 0.587617388739*@MOVAV(ID0YP$(-1),2)
69
EEA_ID_71_72 = -4837.49918875 + 1.56690264011*@MOVAV((ID0YP/ID0NPT),4) + 85.2810129476*@TREND
EEA_ID_8100 = 5448.10593072 + 30.4687956873*@MOVAV(YPADJ_ID,4)/@MOVAV(JPC,4)
EEA_ID_DMANU = EEA_ID_WOOD + EEA_ID_3320 + EEA_ID_3330 + EEA_ID_3340 + EEA_ID_MFDNEC
EEA_ID_GOODS = EEA_ID_MANU + EEA_ID_2300 + EEA_ID_2100
EEA_ID_GV = EEA_ID_GVSL + EEA_ID_GVF
EEA_ID_GVF = 9910.18456238 + 94.7434620961*GFOCWSS - 0.450059697771*GFOCWSS*@TREND + 564.842469041*DUMCENSUS + [AR(1)=0.554050505574]
EEA_ID_GVSL = EEA_ID_GVSLAD + EEA_ID_ GVSLED
EEA_ID_GVSLAD = 8550.7996205 + 11174.9897272*@MOVAV(ID0NPT,4) + 0.672815110477*@MOVAV(ID0YPTXB(-4),4) + 4085.77048968*DUM911062
EEA_ID_GVSLED = -698.518663932 + 134413.700828*ID0NPT*((N-N16A)/N) + 0.276262206068*ID0YPTXB
EEA_ID_MANU = EEA_ID_DMANU + EEA_ID_NMANU
EEA_ID_MFDNEC = -3423.54622887 + 76.9466543401*@MOVAV(IPSG339,2) + 38.5298249964*@MOVAV(IPSG337,2) + 41.1862459639*@MOVAV(IPSG335,2) - 2081.72894234*@MOVAV(JEXCHMTPREAL(-1),2)
EEA_ID_MFNNEC = 1029.80249389 + 20.4494450683*@MOVAV(IPSG322,2) - 307.079193764*@MOVAV(JEXCHMTPREAL(-1),2) + 5.89178345884*DUM121ON*@MOVAV(IPSG322,2) + 11.3180872081*@TREND
EEA_ID_NMANU = EEA_ID_3110 + EEA_ID_3230 + EEA_ID_3250 + EEA_ID_MFNNEC
EEA_ID_NONGOODS = EEA_ID_SV + EEA_ID_4200 + EEA_ID_44_45 + EEA_ID_GV
EEA_ID_SV = EEA_ID_48_49_22 + EEA_ID_5100 + EEA_ID_52_53 + EEA_ID_54_55_56 + EEA_ID_61_62 + EEA_ID_71_72 + EEA_ID_8100
EEA_ID_WOOD = 20370.0008233 + 83.6878780642*@MOVAV(IPSG321,2) - 18.8411498636*IPSG321/EMD321 - 13957.4569946*JECIWSP/WPI08 - 3445.51877765*@MOVAV(JEXCHOITPREAL(-1),2) - 29.0123672722*@TREND
ID0AHEMF = -2.61067936886 + 11.7258794064*EEA_ID_DMANU(-1)/EEA_ID_MANU(-1)*@MOVAV(JECIWSP(-1),4) + 33.1585697116*EEA_ID_NMANU(-1)/EEA_ID_MANU(-1)*@MOVAV(JECIWSP(-1),4)
ID0CRCROP = 150158.172625 + 0.0134759155812*CRCROP + 2344.8785578*@TREND
ID0CRLVSTK = -2049528.49107 + 0.0299954879816*CRCATCVS + 0.0543884196107*CRDAIRY + 14397.3107436*@TREND
ID0EXFP = -531124.530433 + 1372062.58423*WPI01 + 15667.9919006*@TREND + 0.00409776176402*EXPUS$
70
ID0HSPR = ID0HSPRS1_A + ID0HSPRS2A_A
ID0HSPRS1_A = -437.042241971 - 0.923294544041*(RMMTGEXIST(-1)-@MOVAV(RMMTGEXIST(-1),4)) + 435.285405869*ID0KHU1(-1)/ID0KHU1(-4) + 0.0182579317913*@TREND*@MOVAV(ID0NPT(-1),4)
ID0HSPRS2A_A = 15.8485011319 + 35255.9415704*(@MOVAV(ID0NPT(-1),4)-@MOVAV(ID0NPT(-5),4))/ID0KHU1 - 1.036451578*RMMTGEXIST - 0.0689591128533*@TREND
ID0KHU = ID0KHU1 + ID0KHU2A
ID0KHU1 = ((0.997)^0.25) * ID0KHU1(-1) + ID0HSPRS1_A/4
ID0KHU2A = ((0.997)^0.25) * ID0KHU2A(-1) + ID0HSPRS2A_A/4
ID0NB = -7.35749833452 + 32.3733559831*ID0NPT - 0.114070733042*@TREND
ID0ND = 0.461723480618 + 6.95809691367*ID0NPT
ID0NMG = (ID0NPT - ID0NPT(-4)) - (ID0NB - ID0ND)/1000
ID0NPT = 0.42637060347 + 2.60703346662e-07*@MOVAV(EEA_ID,4) + 0.00585155521643*@TREND
ID0WBB$ = ID0WBBMF$ + ID0WBBOTH$ + ID0WBBCC$ + ID0WBBF$ + ID0WBBMIL$
ID0WBBCC$ = (ID0WRWCC$ * EEA_ID_2300)/1000000
ID0WBBF$ = -179.697789206 + 375.203799349*WPI02
ID0WBBMF$ = (ID0WRWMF$ * EEA_ID_MANU)/1000000
ID0WBBMIL$ = 20.2019177422 + 296.444187432*(ID0NPT/N)*GFMLCWSS
ID0WBBOTH$ = ID0WRWOTH$ * (EEA_ID – EEA_ID_2300 - EEA_ID_MANU)/1000000
ID0WRWCC$ = 10870.3207279 + 1402.91673803*ID0AHEMF
ID0WRWMF$ = 11040.5819172 + 1913.54717084*ID0AHEMF
ID0WRWOTH$ = 5156.98655141 + 1492.40083941*ID0AHEMF
ID0YDIR$ = -27.1511160499 + 1.06734896306*(YPAINT+ZADIV+YPRENTADJ)*@MOVAV(ID0YP$(-1),4)/@MOVAV(YP(-1),4)
ID0YFC$ = -7013.96081485 + 0.918536066567*ID0YFC$(-1) + 253.86993029*@TREND
ID0YINV_R$ = 2724.47966819 + 0.66460087476*ID0YINV_R$(-1) + 634.157502788*@TREND
ID0YP = ID0YP$/JPC*100
71
ID0YP$ = ID0WBB$ + ID0YSUP$ + ID0YDIR$ + ID0YPRNF$ + ID0YPRF$ + ID0YTR$ + ID0YRA$ – ID0YSI$
ID0YP$PC = ID0YP$/ID0NPT
ID0YPNF = ID0YPNF$/JPC*100
ID0YPNF$ = ID0YP$ - ID0YPRF$ - ID0WBBF$
ID0YPNFPC = ID0YPNF$/JPC*100/ID0NPT
ID0YPPC = ID0YP/ID0NPT
ID0YPRF$ = 43.5930387704 + 0.283184904602*(ID0CRCROP+ID0CRLVSTK+ID0YTRF$+ID0YINV_R$-ID0YFC$-ID0EXFP)/1000 + 4.01251679021*@TREND
ID0YPRNF$ = 72.2276391705 + 4.43657588336*YPPROPADJNF
ID0YPTXB = (ID0YP$ - ID0YSI$ - ID0YTR$)/JPC*100
ID0YRA$ = -123.592755256 + 0.0409269480225*ID0WBB$
ID0YSI$ = -20.0570488496 + 1.17704514314*TXSIDOM*ID0WBB$/YPCOMPWSD
ID0YSUP$ = 82.1958084951 + 1.5329271561*YPCOMPSUPPAI*(ID0WBB$/YPCOMPWSD)
ID0YTR$ = -83.1196532353 + 881.28201419*(YPTRFGF+YPTRFGSL)*(ID0NPT/N)
ID0YTRF$ = 24979.5665033 + 0.00967691289549*TRF$
IDWAGE = (ID0WBB$ - ID0WBBF$ - ID0WBBMIL$)/EEA_ID * 1000000
YPADJ_ID = ID0YPNF$ + @MOVAV(ID0YPRF$,4) + @MOVAV(ID0WBBF$,4)
72
ENDOGENOUS VARIABLES EEA_ID Employment on nonagricultural payrolls, total EEA_ID_2100 Employment in mining EEA_ID_2300 Employment in construction EEA_ID_3110 Employment in food processing EEA_ID_3230 Employment in printing EEA_ID_3250 Employment in chemicals EEA_ID_3320 Employment in fabricated metal products EEA_ID_3330 Employment in machinery EEA_ID_3340 Employment in computers and electronic products EEA_ID_4200 Employment in wholesale trade EEA_ID_44_45 Employment in retail trade EEA_ID_48_49_22 Employment transportation, warehousing, and utilities EEA_ID_5100 Employment in information EEA_ID_52_53 Employment in finance, insurance, and real estate EEA_ID_54_55_56 Employment in professional, scientific, and technical services EEA_ID_61_62 Employment in health care and educational services EEA_ID_71_72 Employment in leisure and hospitality EEA_ID_8100 Employment in other services EEA_ID_DMANU Employment in durable goods manufacturing EEA_ID_GOODS Employment in goods producing EEA_ID_GV Employment in government EEA_ID_GVF Employment in federal government EEA_ID_GVSL Employment in state and local government EEA_ID_GVSLAD Employment in state and local government, administration EEA_ID_GVSLED Employment in state and local government, education EEA_ID_MANU Employment in manufacturing EEA_ID_MFDNEC Employment in other durable manufacturing EEA_ID_MFNNEC Employment in other nondurable manufacturing EEA_ID_NMANU Employment in nondurable manufacturing EEA_ID_NONGOODS Employment in nongoods producing EEA_ID_SV Employment in services EEA_ID_WOOD Employment in wood products and logging ID0AHEMF Average hourly earnings in manufacturing ID0CRCROP Cash receipts, crops ID0CRLVSTK Cash receipts, livestock ID0EXFP Farm production expenses ID0HSPR Housing starts, total ID0HSPRS1_A Housing starts, single units ID0HSPRS2A_A Housing starts, multiple units ID0KHU Housing stock, total ID0KHU1 Housing stock, single units ID0KHU2A Housing stock, multiple units ID0NB Number of births ID0ND Number of deaths ID0NMG Net in-migration of persons ID0NPT Resident population ID0WBB$ Wage and salary disbursements
73
ID0WBBCC$ Wage and salary disbursements, construction ID0WBBF$ Wage and salary disbursements, farm ID0WBBMF$ Wage and salary disbursements, manufacturing ID0WBBMIL$ Wage and salary disbursements, military ID0WBBOTH$ Wage and salary disbursements, except farm, manufacturing, military, and construction ID0WRWCC$ Average annual wage, construction ID0WRWMF$ Average annual wage, manufacturing ID0WRWOTH$ Average annual wage, except farm, manufacturing, military, and construction ID0YDIR$ Dividend, interest, and rent income ID0YFC$ Corporate farm income ID0YINV_R$ Farm inventory value changes, imputed rent, and income ID0YP Total real personal income, 2005 dollars ID0YP$ Total personal income ID0YP$PC Per capita personal income ID0YPNF Nonfarm personal income, 2005 dollars ID0YPNF$ Nonfarm personal income ID0YPNFPC Per capita nonfarm income, 2005 dollars ID0YPPC Real per capita personal income, 2005 dollars ID0YPRF$ Net farm proprietors' income ID0YPRNF$ Nonfarm proprietors' income ID0YPTXB Tax base, 2005 dollars ID0YRA$ Residence adjustment, personal income ID0YSI$ Contributions for social insurance ID0YSUP$ Other labor income ID0YTR$ Transfer payments to individuals ID0YTRF$ Government payments to Idaho farmers IDWAGE Idaho average annual wage YPADJ_ID Adjusted total personal income
74
EXOGENOUS VARIABLES CNCSR Personal consumption expenditures, clothing and shoes, 2005 dollars, chain weighted CNOOR Personal consumption expenditures, other nondurable goods, 2005 dollars, chain weighted CRCATCVS Cash receipts, US cattle and calves CRCROP Cash receipts, US crops CRDAIRY Cash receipts, US dairy DUM071ON DUM911062 DUM931964 DUM951ON DUM981ON DUMCENSUS TREND
These are dummy variables used in regression equations for the purpose of capturing the impacts of discrete economic or noneconomic event such as strikes, plant opening, or closures, unusual weather conditions, etc.
EG91 Employment in federal government EMD321 Employment in wood products EMD334 Employment in computer and electronic products EMN311 Employment in food manufacturing EMN323 Employment in printing and related support activities EXPUS$ Agricultural production expenses, US GFMLCWSS Federal government defense personnel outlays GFOR Real federal nondefense purchases of goods and services GFR Real federal purchases of goods and services ID0IP2122_2123 Industrial production index, metal and nonmetal ore mining, 2007=100.0 IPSG311 Industrial production index, food, 2007=100.0 IPSG321 Industrial production index, wood products, 2007=100.0 IPSG322 Industrial production index, paper, 2007=100.0 IPSG323 Industrial production index, printing, 2007=100.0 IPSG3253 Industrial production index, agricultural chemicals, 2007=100.0 IPSG332 Industrial production index, fabricated metal products, 2007=100.0 IPSG3332 Industrial production index, industrial machinery, 2007=100.0 IPSG334 Industrial production index, computer and electronic products, 2007=100.0 IPSG337 Industrial production index, furniture and related products, 2007=100.0 IPSG339 Industrial production index, miscellaneous manufacturers, 2007=100.0 IPSG51111 Industrial production index, newspaper publishing, 2007=100.0 JECIWSP Employment cost index—private sector wages and salaries, December 2005=1.00 JEXCHMTPREAL Real US trade-weighted exchange rate with major currency trading partners,
2005=1.00 JEXCHMOITPREAL Real US trade-weighted exchange rate with other important trading partners,
2005=1.00 JPC Implicit price deflator, personal consumption, 2005=100.0, chain weighted N Population, US N16A Population, US, aged 16 and older
75
RMMTGEXIST Effective conventional mortgage rate, existing homes, combined lenders SP500 Standard & Poor’s 500 index of common stocks TRF$ Government payments to US farms TXSIEC Personal contributions for social insurance, US WPI01 Producer price index, farm products, 1982=1.0 WPI02 Producer price index, processed foods and feeds, 1982=1.0 WPI08 Producer price index, lumber and wood products, 1982=1.0 WPI10 Producer price index, metals and metal products, 1982=1.0 YP Personal income YPAINT Personal interest income YPCOMPSUPPAI Other labor income, US YPCOMPWSD Wage and salary disbursements YPPROPADJNF Nonfarm proprietors' income (with inventory valuation and capital consumption adjustments) YPRENTADJ Rental income of persons with capital consumption adjustment YPTRFGF Federal transfer payments to individuals YPTRFGSL State and local transfer payments to individuals ZADIV Dividends


![NATIONS START PATROL OF MEDITERRANEANnewspaper.twinfallspubliclibrary.org/files/Idaho-Evening... · 2014-12-12 · Weather Forecast I Mr (ODllbt and Thandir Hi«b -TWtertAy W.]o«r](https://img.pdfslide.us/doc/110x75/5f47576af65a4f43475330e8/nations-start-patrol-of-me-2014-12-12-weather-forecast-i-mr-odllbt-and-thandir.jpg)