Embed Size (px)
Citation preview

ICU Strain: Causes and
ImpactSean M Bagshaw
Department of Critical Care Medicine
University of Alberta
Edmonton, Canada
CCCF 2017
Toronto, Canada
Wednesday, October 4, 2017 – 9:10-9:30

2017 Disclosures
•Salary support: Canada government
•Grant support: Canada/Alberta government
•Speaking/consulting: Baxter Healthcare Corp.
•Steering Committee: Spectral Medical, Inc.
•Data Safety Monitoring Committee: CytoPherx, Inc.
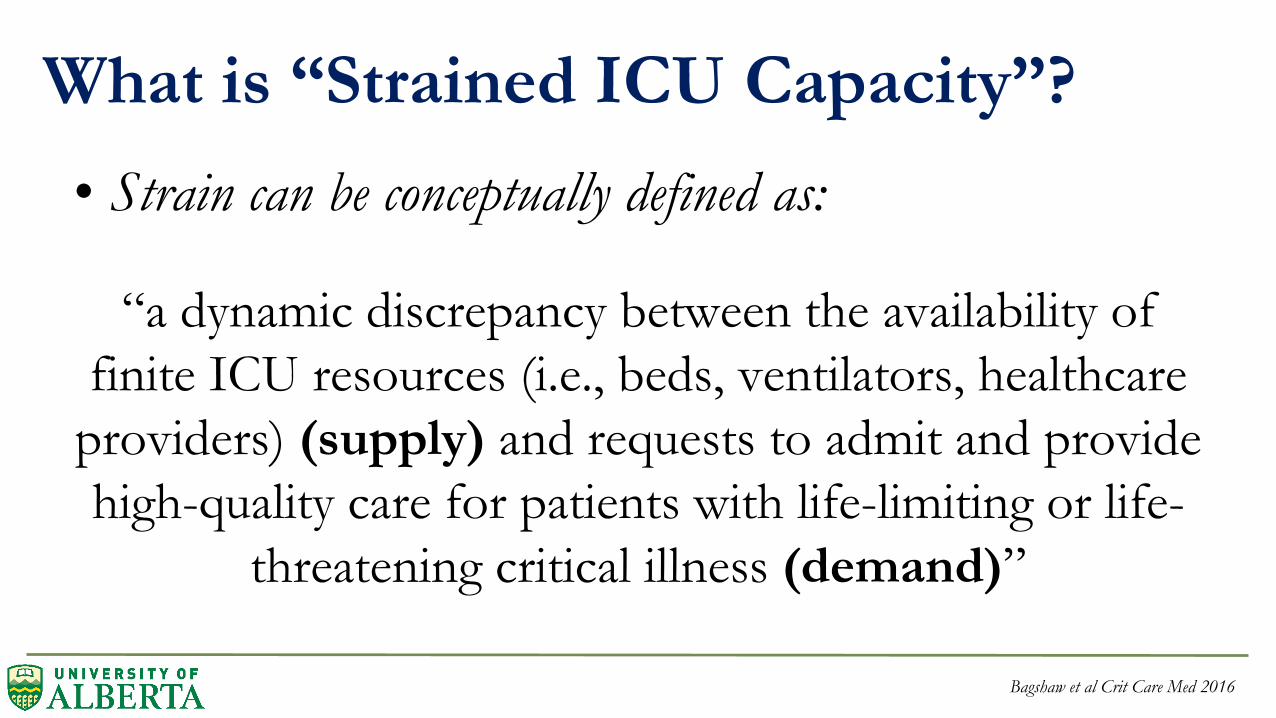
What is “Strained ICU Capacity”?
• Strain can be conceptually defined as:
“a dynamic discrepancy between the availability of
finite ICU resources (i.e., beds, ventilators, healthcare
providers) (supply) and requests to admit and provide
high-quality care for patients with life-limiting or life-
threatening critical illness (demand)”
Bagshaw et al Crit Care Med 2016

PatientCharacteristics
Admission APACHE II
Score
Admission time
Bedside Workload
Demographic Features
Co-existing Disease Burden
Case-mix (Primary Diagnosis)
Surgical Status
ICU Capacity Strain
❶ ❷
Support Intensity
❸
Bed Availability
Outcome
Conceptual Framework for “Strain”
“Structural”
factors
“Patient-specific”
factors
“Provider-specific”
factors

0 20 40 60 80 100 120
Equipment shortages
Inadequate # ancillary services
Inadequate distribution ICU resources
Inadequate # allied health – outside ICU
Inadequate # allied health – inside ICU
Preferential priority to ER for ward beds
Time consuming paper/electronic charting
Variation in care plans between physicians
Reduced resources after hours
Unrealistic patient/family expectations
More inexperienced/fewer experienced nurses
Inadequate goals of care discussions
Inadequate # bedside nurses
Inappropriate admissions
Increase in patient acuity/complexity
Increased in patient volume
Unable to discharge – lack of ward beds
Agree Strongly Agree
Opgenorth et al PLoS One (Under Review)

Bagshaw et al Crit Care Med 2016
Perceived Impact of Strain by Healthcare Providers
Patient/Family
Reduced quality and safety of care
Delay patient access to critical care services
Precipitate premature or unplanned ICU discharges
Reduced opportunities to support patients’ families
Providers
Increased workload
Negative impact on workplace environment and relationships between ICU workers
Moral distress, burnout and reduced job satisfaction
Increase in staff absenteeism, sick days and turnover
Health System
Unnecessary, excessive and inefficient resource utilization throughout the healthcare
system
Inappropriate admissions/discharges
Added expenses for overtime and training new staff in response to attrition and
turnover

Kerlin et al AATS 2014
6-month prospective cohort study in 24 bed medical ICU
Survey of providers (charge RN + physician) on perception of strain
Concomitant assessment of operational and strain measures
226 (89%) surveys (18 nurses; 17 physicians)
ICU census
perceived as
an important
measure of
strain for
providers

Gabler et al AJRCCM 2013
ICU census on the
day of admission was
associated with
mortality (adj OR 1.02;
95% CI, 1.00-1.03)

Strained ICU
Capacity
Patient factors
(i.e., APACHE II)
Outcomes
(i.e., patient, ICU
performance)
e2 ~ N(E2, S2)
e1 ~ N(E2, S2)
e3 ~ N(E2, S2)
Schematic of Hypothesized Relationship between Strain
and Outcome
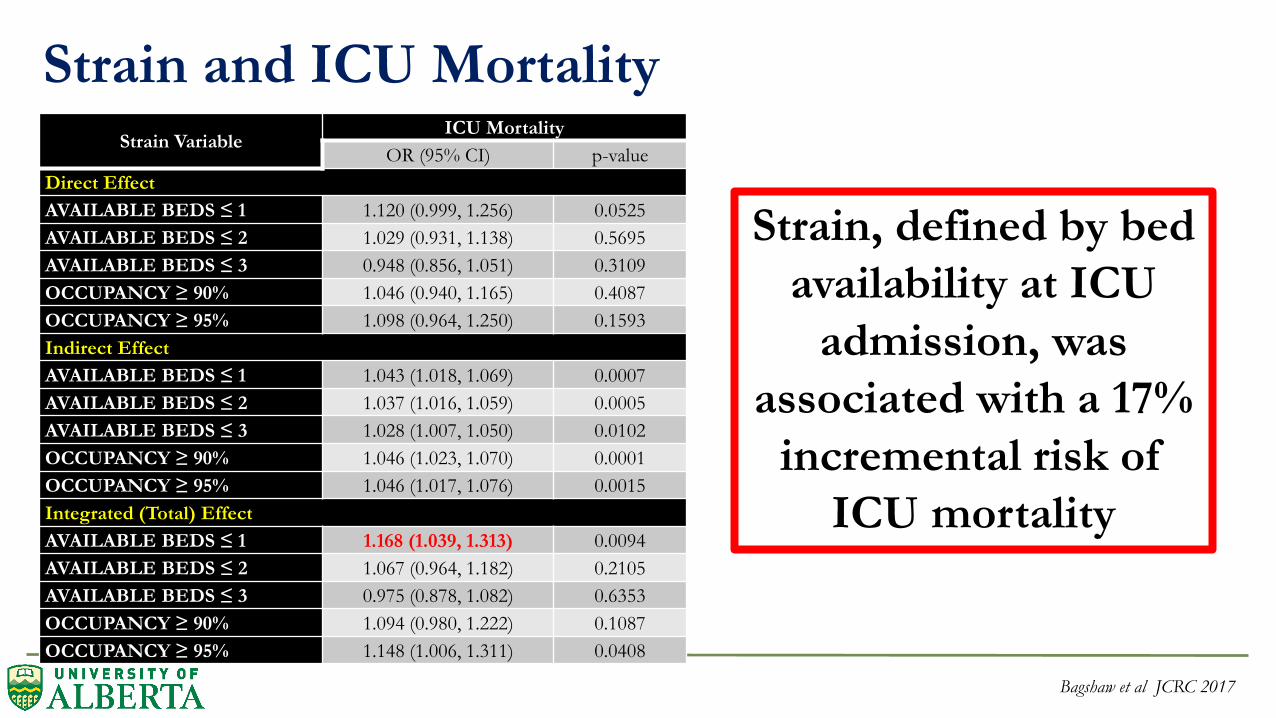
Strain VariableICU Mortality
OR (95% CI) p-value
Direct Effect
AVAILABLE BEDS ≤ 1 1.120 (0.999, 1.256) 0.0525
AVAILABLE BEDS ≤ 2 1.029 (0.931, 1.138) 0.5695
AVAILABLE BEDS ≤ 3 0.948 (0.856, 1.051) 0.3109
OCCUPANCY ≥ 90% 1.046 (0.940, 1.165) 0.4087
OCCUPANCY ≥ 95% 1.098 (0.964, 1.250) 0.1593
Indirect Effect
AVAILABLE BEDS ≤ 1 1.043 (1.018, 1.069) 0.0007
AVAILABLE BEDS ≤ 2 1.037 (1.016, 1.059) 0.0005
AVAILABLE BEDS ≤ 3 1.028 (1.007, 1.050) 0.0102
OCCUPANCY ≥ 90% 1.046 (1.023, 1.070) 0.0001
OCCUPANCY ≥ 95% 1.046 (1.017, 1.076) 0.0015
Integrated (Total) Effect
AVAILABLE BEDS ≤ 1 1.168 (1.039, 1.313) 0.0094
AVAILABLE BEDS ≤ 2 1.067 (0.964, 1.182) 0.2105
AVAILABLE BEDS ≤ 3 0.975 (0.878, 1.082) 0.6353
OCCUPANCY ≥ 90% 1.094 (0.980, 1.222) 0.1087
OCCUPANCY ≥ 95% 1.148 (1.006, 1.311) 0.0408
Strain and ICU Mortality
Strain, defined by bed
availability at ICU
admission, was
associated with a 17%
incremental risk of
ICU mortality
Bagshaw et al JCRC 2017
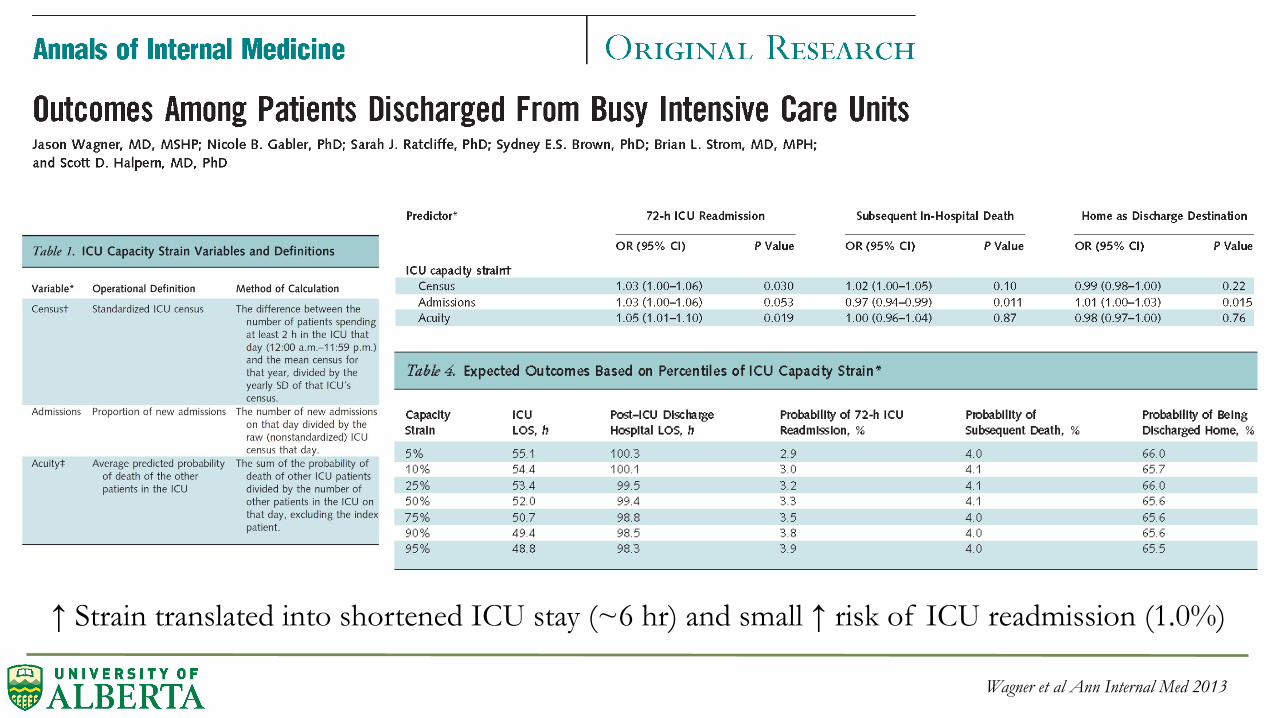
Wagner et al Ann Internal Med 2013
↑ Strain translated into shortened ICU stay (~6 hr) and small ↑ risk of ICU readmission (1.0%)

Goldfrad et al Lancet 2000
Nighttime vs. daytime discharge and hospital death:
Crude OR 1.46 (95% CI, 1.18-1.80)
Case-mix-adjusted OR 1.33 (95% CI, 1.06-1.65)
Premature Discharge-adjusted OR 1.17 (95% CI, 0.95-1.87)
>50% night time discharges were “premature”
Consequences of Discharges from ICU at Night
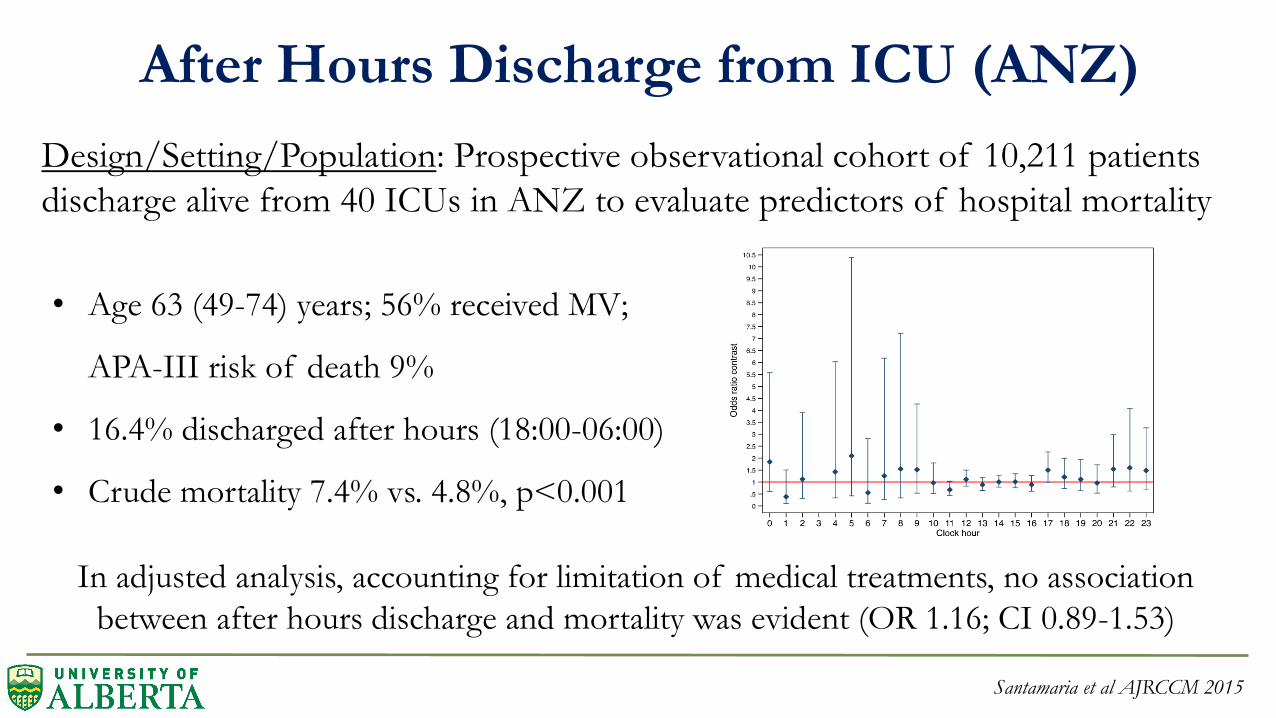
After Hours Discharge from ICU (ANZ)
Santamaria et al AJRCCM 2015
Design/Setting/Population: Prospective observational cohort of 10,211 patients
discharge alive from 40 ICUs in ANZ to evaluate predictors of hospital mortality
• Age 63 (49-74) years; 56% received MV;
APA-III risk of death 9%
• 16.4% discharged after hours (18:00-06:00)
• Crude mortality 7.4% vs. 4.8%, p<0.001
In adjusted analysis, accounting for limitation of medical treatments, no association
between after hours discharge and mortality was evident (OR 1.16; CI 0.89-1.53)

After Hours Discharge (1900 – 0800) (Alberta)
After hours discharge associated with incremental 19% risk of hospital death
(OR 1.19; 95% CI, 1.01-1.39)
Bagshaw et al Under Review
0 5 10 15 20
05
1015
Hourly Death Rate
Hours
Dea
th R
ate(
%)
After hours discharge occurred in 23.3% (27.4% dead vs. 23.0% alive, p<0.001)
Associated with ↑ occupancy; ↑ admissions; ↑ SOFA and TISS score 72 h prior

Stelfox et al Arch IM 2012
If there are no ICU
beds available, care
processes appear to
be modified
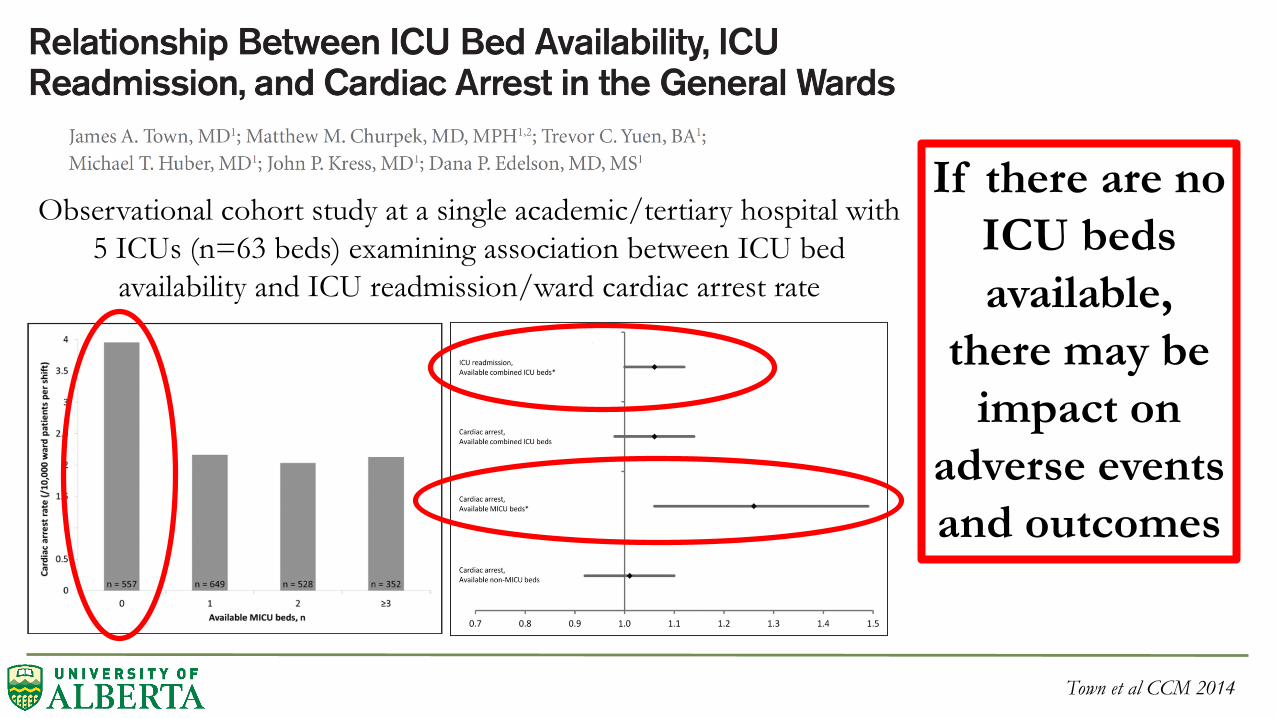
Town et al CCM 2014
Observational cohort study at a single academic/tertiary hospital with
5 ICUs (n=63 beds) examining association between ICU bed
availability and ICU readmission/ward cardiac arrest rate
If there are no
ICU beds
available,
there may be
impact on
adverse events
and outcomes
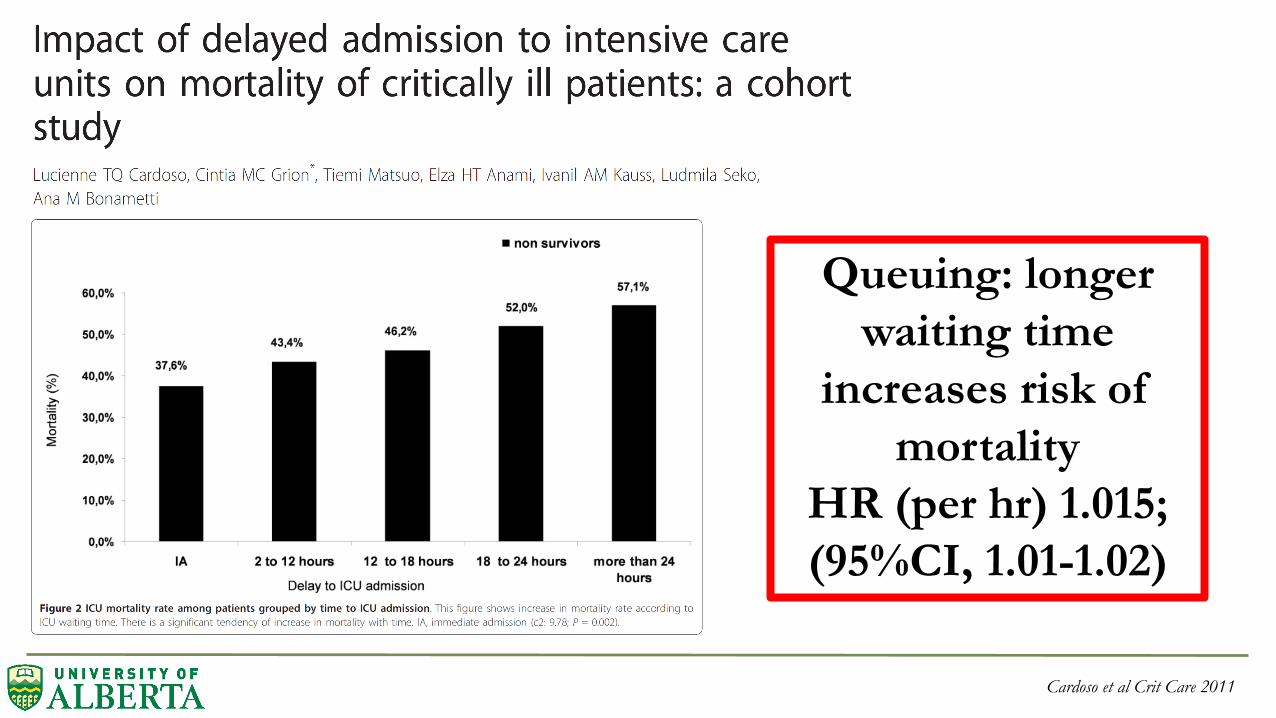
Cardoso et al Crit Care 2011
Queuing: longer
waiting time
increases risk of
mortality
HR (per hr) 1.015;
(95%CI, 1.01-1.02)

Daud-Gallotti et al PLoS One 2014
Increased RN
workload, defined by
NAS, associated with
↑ risk of nosocomial
infection

Bedside Workload and Mortality
Bagshaw et al Under Review

Weissman et al JCRC 2015
Retrospective cohort study utilizing Project IMPACT database
n=776,905 evaluable patient-days for VTE prophylaxis (68%)
2 strain
measures
associated with
reduced odds of
receiving VTE
prophylaxis

Hua et al ICM 2016

Teno et al JAMA IM 2016
As ICU beds
increased, advanced
dementia patients
were more likely to
receive MV
~ OR 1.06
95%CI, 1.05-1.07)

Avoidable Days:
• Range 4.8-11.3%
per month (173-402
days/month)
• Cost ICU day
(~$3000 CDN) ~
range in avoidable
costs ~$6-14 million
CDN per year!
• ↑ 1-year trend
Avoidable Days: The proportion of total ICU patient-days accounted for by avoidable delay in ICU discharge. Source: eCritical Alberta
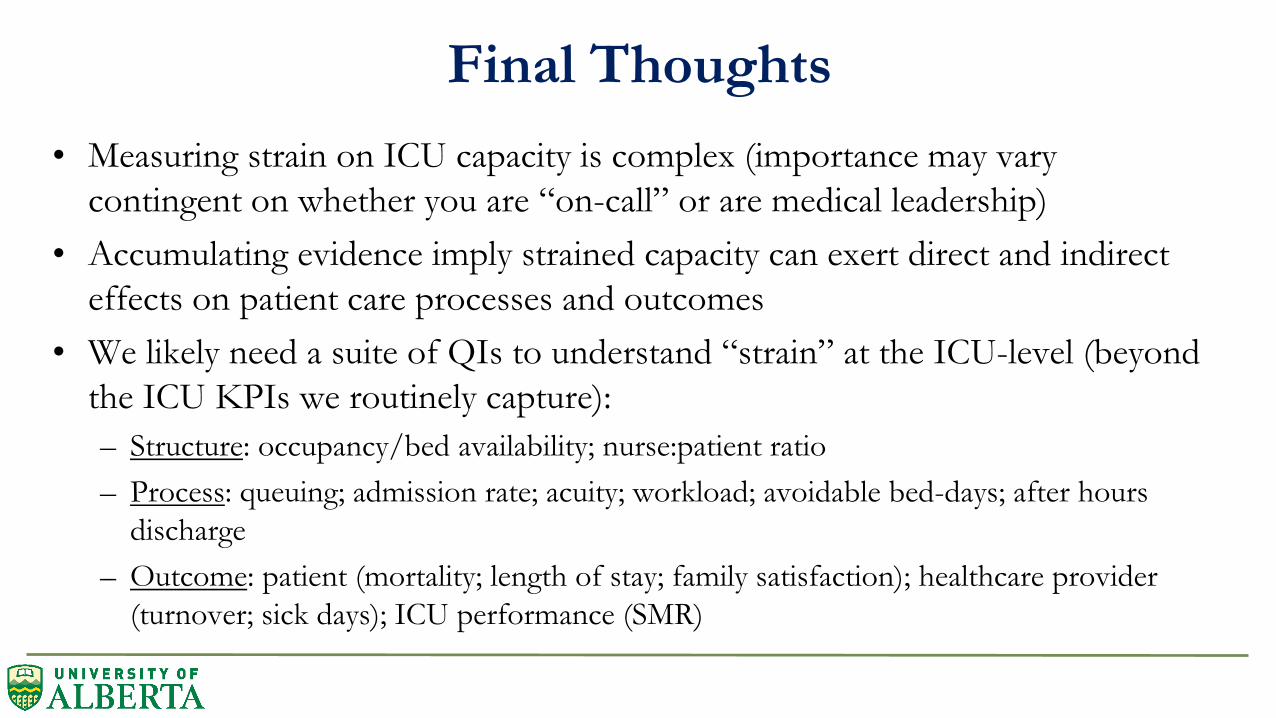
Final Thoughts
• Measuring strain on ICU capacity is complex (importance may vary
contingent on whether you are “on-call” or are medical leadership)
• Accumulating evidence imply strained capacity can exert direct and indirect
effects on patient care processes and outcomes
• We likely need a suite of QIs to understand “strain” at the ICU-level (beyond
the ICU KPIs we routinely capture):
– Structure: occupancy/bed availability; nurse:patient ratio
– Process: queuing; admission rate; acuity; workload; avoidable bed-days; after hours
discharge
– Outcome: patient (mortality; length of stay; family satisfaction); healthcare provider
(turnover; sick days); ICU performance (SMR)

Thank You for Your Attention!
• Acknowledgements:
– Dawn Opgenorth (Project Manager)
– Xiaoming Wang (Statistician, AHS)
– Malik Agyemang (eCritical Alberta)
– Guanmin Chen and Peter Faris (Statistician, AHS)
• Co-Investigators/collaborators:
– Tom Stelfox, Damon Scales, David Zygun, David McKinlay, Armann Ingolfsson, Peter
Dodek, Dan Zuege, Elaine Gilfoyle, Barbara Sonnenberg, Brian Rowe, Paul Boucher,
Michael Meier, Luc Berthiuame, Noel Gibney, Chip Doig
E: [email protected] Tw: @drseanbagshaw