Embed Size (px)
Citation preview
Drawing inspiration from global cases
ICT-based Adaptation to Climate Change in Cities Case Studies
Implemented by In cooperation with
INTERNATIONAL CLIMATE INITIATIVE (IKI)
INTRODUCTION | 1
CONTENTSINTRODUCTION 1
1 SOCIAL MEDIA 7
11 SOCIAL MEDIA-BASED FLOOD-MAPPING PETABENCANA 8
12 WEATHER ALERTS AND REPORTS USING WHATSAPP WEATHER CHASERS MALAWI 10
13 GOOGLE DRIVE FOR DISASTER RESPONSE CHENNAI FLOODS 12
2 SHORT MESSAGE SERVICE (SMS) 15
21 DISASTER RISK MANAGEMENT DURING PAKISTAN FLOODS FRONTLINESMS 16
22 SMS-BASED AUTOMATED DATA MANAGEMENT BUS TRACKER BY SMS 18
3 SENSOR-DRIVEN TOOLS 21
31 IOTREES IN GUADALAJARA 22
32 DIY-SENSING OF RADIATION AFTER FUKUSHIMA SAFECAST 24
33 DIY-SENSOR TO MEASURE ENVIRONMENTAL DATA SENSEBOX 26
34 PROPRIETARY SENSOR TO MEASURE ENVIRONMENTAL DATA BREEZE 28
WEB APPS 31
41 CREATING A MESH NETWORK USING SMARTPHONES FIRECHAT IN MARIKINA 32
42 USER-GENERATED REPORTS ON URBAN ISSUES FIXMYSTREET 34
43 MEASURING SAFETY IN URBAN SPACES SAFETIPIN 36
44 TRACKING TRAFFIC PATTERNS USING SMARTPHONES MODALYZER 38
45 MEASURING ROAD QUALITY AND TRAFFIC DATA CYFACE 40
46 SENSING NOISE USING SMARTPHONES NOISETUBE 42
5 MAPPING 45
51 CRISIS MAPPING - HUMANITARIAN OPENSTREETMAP TEAM (HOT) 46
52 OPENDRI OPEN CITIES 48
53 OPENSTREETMAP 50
6 CONCLUSION amp RECOMANDATION 53
SOURCES 60
IMPRESSUM 61
2 | INTRODUCTION INTRODUCTION | 3
INTRODUCTION
In the past decades cities have gone through radical changes from being the motors of economic growth to becoming the home of 55 of the worldrsquos population 1 In this light city planning has gained significant importance as the effective and efficient allocation of resources lies at the intersection of the global challenge that is climate change The common characteristic of urban agglomerations a high state of population density means that well planned interventions can benefit a comparatively large number of individuals Simultaneously this characteristic makes cities particularly vulnerable to extreme weather events and other repercussions of climate change Meanwhile the worldwide advance of digital technologies have enabled a paradigm shift in urban planning processes from technocratic approaches to citizen-centred solutions Drivers in this development have been technologies such as social media smartphone applications low-cost environmental sensing devices collaborative mapping techniques and concepts integrating short message service (SMS) technology Bridging the gap between citizens urban practitioners researchers and governments these platforms incubate potential solutions for the urban challenges of today and tomorrow The informed and coordinated deployment of information and communication technologies (ICT) can significantly contribute to the adaptation to climate change of urban centres
Crisis-mapping approaches increase the speed of damage assessment and critical points in the technical infrastructure such as water drainage and the built environment Environmental sensors in public spaces along streets or on the windowsills of private residences highlight areas particularly exposed to pollutants and toxins such
as radiation and fine dust particles Twitter users report and geotag urban infrastructure destroyed by flooding Weather data and alerts are reported using WhatsApp to enable better forecasts and experiences of urban citizens are translated into lsquosafety datarsquo leading to new ways of assessing the quality of urban environments for its inhabitants Adapting these technologies for climate-related purposes is proving increasingly popular and leads to the necessity of considering their value and significance for urban practitioners
Simultaneously numerous concepts developed in the larger space of ICT-based tools related to climate adaptation follow similar goals leading to a confusing oversupply Enthusiastic expectations from the side of creators are not met when confronted with low user numbers new digital applications are created where robust solutions already exist the sole focus on digital approaches increases energy usage and leads to higher emission Hence choosing or adapting the appropriate tools that are most appropriate is key to a successful ICT-based adaptation to climate change in cities as part of integrated urban governance
This compilation of case studies aims to provide guidance and inspiration to urban practitioners eager to integrate ICT-based approaches to climate change in their work Those presented examples that are not directly applicable to managing the consequences of climate change have been included due to their potential in this sector
The document has a strong focus on open formats and approaches (Open Data Open Hardware Free and Open-Source Software collaborative mapping and crowd-sensing) comprise the majority of this study The ability to share modify use and re-distribute content lies at the heart of constructing useful systems that enable citizens researchers governments and urban practitioners to collaborate towards a more climate resilient future with the use of ICTs Commercial options are driven by an economically motivated smart-city design That approach leads to challenges in terms
of data ownership interoperability transparency and privacy By contrast the majority of the presented solutions are free to download use and run on current Android iOS smartphones andor computers
SOCIAL MEDIA
SMS
SENSOR DRIVEN
WEB APPS
MAPPING
CONCLUSION
1 2
3
4
5
6
INTRODUCTION
4 | INTRODUCTION INTRODUCTION | 5
API
ACCCRN
CTA
DCCMS
DIY
FMS
FOSS
GPS
HOT
ICT
ITU
LAN
LED
LoRa
MCU
NGO
OSM
REM
SDK
SPO
URL
UV
GPS
LIST OF ABBREVIATIONS
Application Programming Interface
Asian Cities Climate Change Resilience Network
Chicago Transport Agency
Department of Climate Change and Meteorological Services
Do-It-Yourself
FIxMyStreet
Free and Open Source Software
Global Positioning System
Humanitarian OpenStreetMap Team
Information and Communication Technology
International Telecommunication Union
Local Area Network
Light Emitting Diode
Long Range Network
Micro Controller Unit
Non-Governmental Organisation
OpenStreetMap
Risk Evaluation Matrix
Software Development Kit
Strengthening Participation Organisation
Uniform Resource Allocator
Ultra Violet
Global Positioning System
INTRODUCTION
6 | SOCIAL MEDIA SOCIAL MEDIA | 7
01SOCIAL MEDIA
Social media-based flood-mapping PetaBencana
Weather alerts and reports using WhatsApp Weather Chasers Malawi
Google Drive for disaster response Chennai Floods
Social media are digital communication tools through which users create online communities to share information thoughts personal messages and other content They are popular and widely spread2 In the first quarter of 2019 Facebook counted more than 23 Billion monthly active users WhatsApp 15 Billion3 and Twitter 350 Million in the same time frame4 According to a study by the Pew Research Center emerging and developing countries reveal significant growth in smartphone ownership and social media use over the past 5 years5
ldquoDue to their extensive use it is indispensable for urban practitioners to consider digital solutions that operate through social mediardquo
Due to their extensive use it is indispensable for urban practitioners to consider digital solutions that operate through social media
Most social media applications allow their users to share text images GPS data as well as audio and video recordings in peer to peer or group conversations ldquoHashtagsrdquo facilitate structuring of user-generated content in the case of Twitter Rating and voting systems influence the visibility of the (user-generated) content on the platforms Algorithms based on personal preferences behaviour and platform dynamics generate a personal feed of information for each user Social media platforms are typically free of user fees because their business model is based on user-targeted advertisement Here behaviours and user
preferences are analysed by algorithms which show the individual ads for products and services that they are likely to consume In other words users lsquopayrsquo the platform provider with personal data6
Low operational cost and wide proliferation are the biggest advantage of using social media to communicate information Whereas government and third-party apps face the challenge of attracting the attention and willingness of their prospective users the large number of existing active users overcomes one of the major challenges in promoting a widespread use of the approach
With regard to climate adaptation in urban contexts social media has shown great potential as a means of communication during and after natural catastrophes tracking developments in real-time and organising disaster-relief activities However the path to integrate social media channels in governmental planning structure is not straightforward Hurdles begin at the interoperability of the social media with the existing government IT-Structure questions on data privacy and ownership as well as challenges within the legal framework Nonetheless the case studies below showcase specific contexts in which social media are a useful and efficient tool to mitigate risks
11
12
13
8 | SOCIAL MEDIA SOCIAL MEDIA | 9
11 SOCIAL MEDIA-BASED FLOOD-MAPPING PETABENCANA
METHOD OF DATA COLLECTION
The platform uses Twitter during emergency events to gather situational updates from the street level
1 An algorithm continuously scans Twitter for the keywords ldquofloodrdquo and ldquobanjirrdquo (Indonesian for flood)
2 Tweets containing these words are subsequently recorded as ldquounconfirmed reportsrdquo
3 The users are then invited to confirm whether flooding is taking place at their location
4 To submit a confirmed report of the situation on the ground users are simply requested to send a geo-located tweet from their mobile device
5 The data is then displayed alongside further relevant emergency data collected by local
and government agencies
INTRODUCTION
PetaBencana (earlier PetaJakarta) is a free web-based platform that produces city-scale real time visualisations of water levels during flood events The maps are created using crowd-sourced
ldquoPetabencana enables swift and informed decision making by citizens and government in times of crisisrdquo
social media reporting and government agency data PetaBencanaid thus enables residents humanitarian agencies and government actors to make more informed decisions in times of crisis
TECHNICAL INFORMATION
On the user side a smartphone capable of running Twitter a web browser or Telegram suffices to participate On the city side a back-end based on CogniCity a free and open source software developed to crowdsource and visualize urban data integrates multiple data sources The back-end is a part of a software It is the most remote from the user and often lies on the server that processes data
The map view displaying three social media icons A click on the corresponding icon opens a Facebook chat a Twitter tweet composer with a pre-set hash-tag or a Telegram conversation with a chat-bot
Mapview Petabencana7
The PetaBencana platform validates and integrates different data sources into a Risk Evaluation Matrix (REM) which is integrated into the map view The matrix consists of a reports module a database module a server module and a machine interface
Citizens can provide rainfall data in centimetres via
bull Twitter (using the banjir hashtag)
bull Telegram (via a chatbot)
bull PetaBencanaid (direct input)
Several alert apps (Qlue Smart City App Detikcom App Z-Alert App)
Other organisations report additional data
Indonesian state department collecting river gauge data
bull Indonesian state department collecting rainfall data
bull Indonesian state department collecting data on waterways
bull Field data (floodgates pumps waterways)
The data is visualised on anThe data is then passed
on to a database module using a reports module and placed on an OpenStreetMap-based map using mapbox an open source software that allows the creation and customization of maps and layers Using this map administrations and public servants can evaluate the risks and make evidence-based decisions more quicklyThe resulting risk is then evaluated by operators on the city side
The risk and map data are publishedmade available to an open API and the following actors and applications
bull Users of Petabencanaid (via map)
bull Jakarta Smart City
bull InAware
bull Pacific Disaster Center (DisasterAware)
bull JakSafe
bull InaSafe
bull Zurich Insurance (Z-Map)
SOURCES
bull PetaBencana
bull Cognicity
bull mapbox
bull OpenStreetMap
MORE INFORMATION
bull Video explaining CogniCity
bull Video explaining how to make a report
Interested in other digital solutions in case of floding
Check out chapter 12
ldquoA WhatsApp group was created in the aftermath to send
out weather information and to request actual observations from members in order to verify forecasts and ultimately improve their reliabilityrdquo
DATA INTEGRATION
10 | SOCIAL MEDIA SOCIAL MEDIA | 11
12 WEATHER ALERTS AND REPORTS USING WHATSAPP WEATHER CHASERS MALAWI
The Google Drive Suite contains standard office applications that run in a web browser Users can create documents spreadsheets presentations questionnaire forms drawings and maps All of these applications run simultaneously as each file has a unique Uniform Resource Locator (URL) which can be shared with others Creating a file requires registration via a google account
In the aftermath of a crisis the document and spreadsheet applications are a quick and easy way of collecting and disseminating information
Weather chasers Malawi
ldquoA WhatsApp group was created in the aftermath to send out weather information and to request actual observations from members in order to verify forecasts and ultimately improve their reliabilityrdquo
Reported observations can confirm hazardous weather detected by satellites but can also identify where the forecasts are frequently inconsistent Daily observations recorded by the registered keepers from 21 weather stations are sent through the list DCCMS is thus able to record data centrally
while interested parties are able to obtain up-to-date information for their areas of intervention This strengthens the efficiency and distribution of weather forecasts for all parties involved
SOURCES
bull Article on Weather Chasers Malawi
bull Video of Weather Chasers Malawi Meeting (Facebook)
bull Presentaion of the Ministry of Natural Resources Energy and Mining containing further information on the topic
FURTHER EXAMPLES OF WHATSAPP APPLICATIONS
bull Restoring connectivity in India using WhatsApp
Interested in other digital solutions in case of floding
Check out chapter 13
ldquoWhen public IT infrastructure is not available the
applications offer a viable means of organising disaster response and reliefrdquo
The Department of Climate Change and Meteorological Services (DCCMS) in Malawi uses WhatsApp as a two-way communication channel to
bull disseminate 24-hour weather forecastsbull communicate early warnings for storms floods
and lightningbull record observations (rainfall temperature and
more) by its 256 members (meteorologists
farmers disaster risk monitoring officers)bull Participants are encouraged to provide location
and time of the databull The ldquospotter reportsrdquo provide information to
ground truth forecasts to DCCMS bull offer a platform for discussion related to the
proper response to changing climates (eg for farmers encountering changing rainfall patterns)
DATA INTEGRATION
METHOD OF DATA COLLECTION
INTRODUCTION
12 | SOCIAL MEDIA SOCIAL MEDIA | 13
13 GOOGLE DRIVE FOR DISASTER RESPONSE CHENNAI FLOODS
The Google Drive Suite contains standard office applications that run in a web browser Users can create documents spreadsheets presentations questionnaire forms drawings and maps All of these applications run simultaneously as each file has a unique Uniform Resource Locator (URL) which can be shared with others Creating a file requires registration via a google accountIn the aftermath of a crisis the document and spreadsheet applications are a quick and easy way of collecting and disseminating information
ldquoWhen public IT infrastructure is not available the applications provide with viable means of organising
disaster response and reliefrdquo
When public IT infrastructure is not available the applications provide viable means of organising disaster response and relief The possibility to work on a document collaboratively and real time updating makes it stand out in this regard
In the case of the Chennai Floods thousands of people were displaced mobile towers ran out of inverter battery power and regular media channels did not have access to localized information on the areas most affected A local lawyer set up a Google Spreadsheet (see above) to consolidate rescue requests and contact details of volunteers This way a semi-structured resource was created that allowed coordination of an initially chaotic situation
ldquoThis way a semi-structured resource was created that allowed coordination of a complex and
chaotic situationrdquo
As an increasing number of people attempted to edit the spreadsheet a simple search interface was designed using Github a platform for source code management and a submission form was added The resulting web interface was then hosted on chennairainsorg
METHOD OF DATA COLLECTIONPeople could tweet aid requests using chennairains and chennairains or use the Google Spreadsheet directly
1 A social media team monitored Twitter for the accountslisted tags and handles
2 An operations team coordinated and matched the aid requests with volunteer offers
3 An on-the-ground team additionally monitored additional specific suburbs in Chennai
Floods in Chennai8
The data recorded through the spreadsheet and social media was used to coordinate disaster relief by matching flooding victims with volunteers Volunteers could either tweet using the designated hashtag or enter their contact information using the spreadsheet (phone number Twitter handle address) together with details such as the number of people that can be accommodated Flooding victims had the opportunity to use the spreadsheet to find support in their area enter details on their location and specific emergency situation and find information regarding helplines or doctors
Alongside its benefits this process came with an issue labelled lsquosocial media noisersquo Information was circulated through retweets after it had become irrelevant creating lsquonoisersquo when looking for actually relevant information For instance if a flood victim tweeted a request for help and supportrelief was provided the Tweet (containing the request) continued to be circulated through retweets by other users who were unaware that it had been resolved
Another challenge if this method is data privacy ownership On the Google Drive platforms the creator of a document can determine among pre-set
conditions to grant access
A document can be made available
bull to up to 100 chosen users
bull to anyone in possession of the URL
bull As a freely accessible published document
Within the setting of co-creation in times of natural disaster the most effective choice is to make it accessible for anyone in possession of its URL Since this means open access to private data its use should be limited to emergencies
Yoti is an app addressing this issue The app uses information from government-issued identification documents encrypts them and stores them as a so-called Yoti on the userrsquos smartphone The Yoti can then serve as online identificator This could reduce the amount of sensitive data necessary when registering to provide or receive help However this approach is prone to fail for its necessity of a network effect meaning a sufficient number of users must register their Yoti
SOURCES
Project website
Google Docs
Google Spreadsheets
Google Forms
Google Drawings
ICTs and help lines involved in the crisis response
ExampleofGoogleDocuseNepalquakeGoogleDoc
Google Person Finder
Yoti
Interested in other digital solutions in case of floding
Check out chapter 21
ldquoThe NGO SPO needed a way to receive feedback from flood victims in order to coordinate
and to monitor the distribution process of shelter clothing medicine and morerdquo
INTRODUCTION
DATA INTEGRATION
14 | SMS SMS | 15
02SHORT MESSAGE SERVICE (SMS)
Social media-based flood-mapping PetaBencana
Weather alerts and reports using WhatsApp Weather Chasers Malawi
Deemed a revolutionary technological step with its introduction in 1992 the Short Message Service (SMS) has long since lost its status Regarding technologies enhancing climate adaptation SMS may be one of the most low-hanging fruit and the most underrated means of communicating data According to the International Telecommunication Union (ITU) there were more mobile cellular subscriptions than inhabitants worldwide in 2017 putting SMS in the hands of technically all Although there are significant discrepancies between developed and developing countries to consider there seems to be a strong case for the argument that most - if not all - other technologies that are used in climate adaptation require higher levels of technological literacy and equipment than SMS In times of WhatsApp and other internet messaging services it may seem technologically obsolete
ldquoNonetheless in regards to extreme climate events it might occur that smartphones are only
able to send and receive SMSrdquo
Nonetheless in regards to extreme climate events it might occur that smartphones are only able to send and receive SMS
As a peer-to-peer messaging service SMS allows groups and communities to coordinate their efforts That being said in its traditional form group messages via SMS are challenging as not all recipients can see whom the message is addressed to However when combined with software an SMS gateway SMS can be used to request information from a database and vice versa messages can be automated and sent out to individuals or large groups In this manner alerts weather forecasts and more can be sent out to groups of recipients such as farmers In turn these individuals can report information eg about pests to coordinate pesticide use to the centralised service which is then relayed to the other participants In cases of catastrophes warnings and crisis response measures can be communicated to those affected
The examples below introduce service providers that offer solutions ranging from e-mail to SMS services to sophisticated online dashboards These allow the use of variables to automatically include data such as names addresses and others thus enabling automated messaging and managing of thousands of recipients
21
22
16 | SMS SMS | 17
21 DISASTER RISK MANAGEMENT DURING PAKISTAN FLOODS FRONTLINESMS
The Pakistani NGO Strengthening Participatory Organization (SPO) implemented a disaster relief project to distribute food items and shelter following the 2011 monsoon flooding in Sindh which affected an estimated 55 million people
The NGO needed a way to receive feedback from flood victims in order to coordinate and to monitor the distribution process of shelter clothing medicine and more
ldquoUsing FrontlineSMS the project managed to establish an efficient way to communicate with residentsrdquo
Using FrontlineSMS in combination with a communication system based on numbers and signs to overcome language barriers the project managed to establish an efficient way to communicate with residents
1 An account with FrontlineSMS is set up by the NGOs
2 With the account set up a SMS gateway (point from which the SMS are sent and received) is established There are commercial providers depending on the region One can also use a smartphone running Android after installing the FrontlineSMS Cloud App
3 The NGOs develop a numbering system together with the villagers to categorize the feedback given by the affected It ranges from 0-9 with each number having a specific meaning
1 = Food items2 = Shelter3 = Conflict4 = Corruption5 = Issues with SPO staff6 = Issues with Partner Organisation staff7 = Issues with Village Council8 = Issues affecting women and children9 = Issues affecting those with disabilities0 as a means of saying lsquothank yoursquo
4 The organisations involved in the process distributed leaflets explaining the use of SMS in pictures and Arabic the native language This was done to overcome the language barrier and the fact that not all phones were able to correctly communicate Unicode characters
5 Teams went to every village to distribute the printed leaflets posters and cards and explained the system to beneficiaries During this process field workers documented all beneficiariesrsquo phone numbers which were then saved to FrontlineSMS As a result every message received by FrontlineSMS could be associated with a name and a location Personalized auto-replies geographical allocations of help requests and more were thereby enabled
6 The affected could now send their feedback using the numbering system allowing the NGOs involved to categorize the prevalent issues and respond accordingly
Monsun9
By managing their contacts in groups through FrontlineSMS SPO were able to create contact lists for village and Union Council members With their group contact lists SPO sent tailored messages before each of their five partner organizations started the aid distribution process in order to alert the beneficiaries Additionally the NGO could also solicit feedback via SMS following the distribution When a complaint was received from a beneficiary the response manager could call back ask for more information and then follow the internal complaints
procedure
The advantage of using SMS to manage incoming complaints was that it was asynchronous ndash SPO sent automatic replies through FrontlineSMS to acknowledge receipt of messages and could then call back shortly after In addition they had all incoming SMS recorded automatically in FrontlineSMS which helped them manage and monitor the different types of responses coming in
SOURCES
bull FrontlineSMS
bull FrontlineSMSCloudApp
bull ExampleofaFreeandOpenSourceSMS gateway
METHOD OF DATA COLLECTION
INTRODUCTION
Interested in other digital solutions in case of floding
Check out chapter 11
ldquoPetabencana enables swift and informed decision making by
citizens and government in times of crisisrdquo
DATA INTEGRATION
FrontlineSMS is accessed through an online dashboard that runs in supported browsers regardless of the operating system The costs to run FrontlineSMS depend on the amount of interactions (sent received SMS) Additionally a SMS gateway needs to be established Its costs vary significantly between commercial providers and regions Instead a smartphone running Android can be used to send and receive messages The costs and amount of SMS that can be sent and received depend on the individual cell phone contract as does the number of messages that can be sent per second or minute10
TECHNICAL INFORMATION
18 | SMS SMS | 19
22 SMS-BASED AUTOMATED DATA MANAGEMENT BUS TRACKER BY SMS
The Chicago Transport Authorityrsquos (CTA) lsquoBus Tracker by SMSrsquo can give estimated arrival times of public busses via text message The user sends a text containing a code identifying the bus stop to a specified number and receives the estimated arrival time in return
ldquoIt demonstrates a simple digital solution using SMS and a Global Positioning System (GPS) based backendrdquo
It demonstrates a simple digital solution using SMS and a Global Positioning System (GPS) based backend The same principle could be applied in order to establish automated messaging services allowing users to request data from other remote backends eg to request updates on extreme weather events
Example image of the userrsquos view11
SOURCES
BusTrackerAPIDocumentation
Clever Devices Inc
Example image of a bus stop sign12
A Bus of the Chicago transportation system13
bull A backend of the CTA tracks the GPS coordinates of public busses along their specified routes and continuously calculates the estimated arrival times
bull Users waiting at bus stops can send a message to the system using the syntax lsquoctabus [stop ID]rsquo A message could for instance contain the message lsquoctabus 41411rsquo
bull The system returns the estimated arrival time to the user
TECHNICAL INFORMATIONEach bus contains a GPS device which helps the CTA to map buses and improve service and schedules Additionally the data can help bus riders make decisions about when to head out to a bus stop Estimated arrival times and these APIs are provided through a system called ldquoBusTimerdquo a product made by Clever Devices Inc
METHOD OF DATA COLLECTION
Interested in other digital solutions for traffic monitoring
Check out chapter 44
ldquoThe app therefore offers a unique proposition by turning everyday commutes into
traffic data which is specifically relevant for urban and transport planners researching traffic patternsrdquo
INTRODUCTION
20 | SENSOR DRIVEN SENSOR DRIVEN | 21
03SENSOR-DRIVEN TOOLS
IoTrees in Guadalajara
DIY-sensing of radiation after Fukushima Safecast
DIY-sensor to measure environmental data SenseBox
Sensing devices hold a great potential in the field of ICT-based Adaptation to Climate Change in Cities For one affordable devices lower access barriers Simultaneously an increasing number of service providers such as Arduinos Raspberry Pis NodeMCUs allow users to partake in data-driven interventions The companies listed above provide hardware (for sale) and software (for free) so that users may programme their own prototypes or use programmes that other users of the hardware have previously written
These sensing devices can collect environmental data such as temperature humidity light and more specific measurements (eg fine dust particles radioactivity) On the lower end the necessary elements for these devices cost 30euro Web-based services allow the user to upload the collected data to a central server and display it on a map This Data can then corroborate public debates on specific climate-related events The projects presented below showcase ways to automatically plot the generated data on interactive online maps some even offering mobile measurements However not all existing projects publish the data on an open basis thereby reducing their transparency and public utility
While this section primarily focusses on DIY-sensor kits pre-configured commercial units exist
ldquoDIY-sensor devices require a high degree of technical versatilityrdquo
DIY-sensor devices require a high degree of technical versatility For eager autodidacts manuals
on how to build and program a unit are available These need to be followed closely to avoid fallible measurements eg by placing a temperature sensor in direct sunlight producing alleviated temperature readings In this regard standardised and tested plug-and-play devices give way to improved measuring precision
Along the fact that plug-and-play devices are commonly more expensive than their DIY-counterparts intellectual property poses additional problems Commercial providers are less likely to make the design and software of their solutions openly available thereby limiting the ways in which they can be audited re-appropriated and adapted to specific contexts A major asset of DIY Versions is the sensor assembly according to the identified issue DIY-devices enable a flexible approach with the added benefit of being available to larger communities that continuously explore new ways of using the modular design of DIY-devices to re-configure them in order to meet new challenges Additionally these approaches raise awareness around certain environmental issues such as fine dust particle concentration
31
32
33
22 | SENSOR DRIVEN SENSOR DRIVEN | 23
31 IOTREES IN GUADALAJARA
IoTrees (Aacuterbol IoT in Spanish) is a multi-platform approach to crowdsourcing data on urban trees and monitor the environment by a cityrsquos inhabitants The IoTrees cross-platform gathers information through a mobile and web app and a network of low-cost DIY sensors that help users monitor air quality light weather and noise It aims to collect data to develop an easy to update Urban Tree Inventory raise citizen awareness about the eco-benefits of trees and assist in public decision-making based on evidence
ldquoIt aims to collect data to develop an easy to update Urban Tree Inventory raise citizen awareness about the eco-benefits of trees and assist in public decision-making based on evidencerdquo
Additionally sensors provide real-time data about environmental conditions that could be crossed with outputted data from trees state on climate change adaptation In other words crossing data aims to help developing green infrastructure planning
The app contains an existing database of urban trees Using their smartphones users can edit these elements of the database or add new ones In practice the following steps take place
bull Having approached a tree an augmented reality function allows users to draw a pattern with their finger based on the tree-type (bush pine or palm)
bull The user then takes a photo to further document the tree
bull The user then chooses whether the chosen tree is part of the already captured database or if it is a new entry to the database
bull Next users are asked to provide information on the following variables
o Location ndash confirmed on an interactive map (automatically includes latitude and longitude)
o Tree Species (From dropdown list)
o Tree Diameter circumference and height
bull Once the information is uploaded it must be confirmed by another user A function in the app named Treender stores all validations Once the information is confirmed by 50 further users the data will be tagged as ldquovalidatedrdquo
Model for data integration in IoT app
DATA INTEGRATIONPreexisting Guadalajara tree database obtained by Lidar technology feeds lsquoArbol IoTrsquo Guadalajara tree database is hosted in the municipality Open Data Portal ldquoGuadalajara Maprdquo
bull httpsmapaguadalajaragobmxbull httpsmapaguadalajaragobmxarbolado
In the new upscaling phase of lsquoArbol Iotrsquo data will be hosted in the planning platform ldquoSIGmetrordquo which is the official data tool for the planning process for the metropolitan municipalities
TECHNICAL INFORMATIONAs an open source technology IoTrees is fully replicable in other cities The programing is interactively documented and made available via web-based hosting services Interested actors will be able to customize it in line with their local needs and resources
bull Mobile App The mobile app was programed in 3 versions Android Android Lite and iOS
bull Web App makes use of the open source code of OpenTreeMap
bull Sensor The sensors on the gather measurements on environmental factors such as Temperature Humidity Gasses Fine dust particles PM 25 amp PM 10 Nitrogen Oxide
SOURCESbull Arbol IoT (android app)
bull Arbol IoT (web app)
bull ICT-A City of Guadalajara (landing site)
bull ICT-A Global (website)
CODE REPOSITORYbull Andropid app
bull Sensor
bull Backend
Interested in other Applications fostering citizen engagement
Check out fixmystreet in chapter 42
ldquoUsers can report issues such as broken lamps garbage
potholes and others through the app which matches their geolocation to the correct postcode and the corresponding city department responsible to fix the issuerdquo
INTRODUCTION
METHOD OF DATA COLLECTION
24 | SENSOR DRIVEN
32 DIY-SENSING OF RADIATION AFTER FUKUSHIMA SAFECAST
Safecast is a citizen-science-based platform collecting radiation and other environmental data using a mobile GPS-enabled logging sensor device It was launched in the aftermath of the 2011 earthquaketsunami in Japan and the subsequent meltdown of the Fukushima Daiichi Nuclear Power Plant Safecast quickly began collecting monitoring and openly sharing information on environmental radiation growing quickly in size scope and geographic reach
ldquoSafecast maintains the largest open dataset of background radiation measurements ever collectedrdquo
It maintains the largest open dataset of background radiation measurements ever collected Users have collected over 50 million readings to date
METHOD OF DATA COLLECTIONSafecast has developed a device called bGeige to collect the radiation data It is based on the Arduino platform and fits into a re-purposed bento box After several iterations the bGeige nano is the current variant of the device and can be attached to cars or bicycles thereby turning it into a mobile measuring station It is a solid-state fully digital device Because of its design its performance is more consistent than the performance of devices with analogue components which are more likely to be affected by confounders such as temperature and other external influences The Safecast bGeige Nano collects a reading every 5 seconds The data is then uploaded to a central database using a smartphone and Bluetooth connection or via a computerSafecast map displaying radiation measurements made
using bGeige14
SENSOR DRIVEN | 25
DATA INTEGRATION This device is part of a global environmental sensor network enabling people to collect radiation readings to freely use and share the data Despite the crucial importance radiation has never been measured on this scale This precedence case enables authorities to make informed decisions in dealing with the aftermath of the nuclear fallout Simultaneously the device improves personal safety of the users as it alerts in case of increased radiation levels
TECHNICAL INFORMATIONSafecast aims to create an independent objective database of environmental readings bGeigie Nano units have periodically been put through
calibration tests at QualTek in the US at the Juumllich Research Centre in Germany and at the IAEA testing laboratory in Seibersdorf Austria In all cases the measured accuracy has been shown to be compatible with the Safecast specifications (Accuracy +- 10 typical +- 15 maximum) +- 10 is currently considered excellent performance for a Geiger counter A device costs between $550 USD (self-assembly) and $1500 USD for the assembled version
To gather additional readings on air quality Safecast is currently building a network of sensors to monitor fine particles PM10 PM25 Carbon Monoxide Nitrogen Dioxide Ozone and Methane All data collected by Safecast is released under a CC0 public domain
SOURCESbull Safecast map
bull All details (code files parts lists etc) can be found here
bull SafecastDrive app Apple | Google Play | Amazon Apps
Photo of the bGeige nano15
Interested in preset sensor tools
Check out chapter 34
ldquoAn interesting aspect of Breeze as compared to the
more Do-it-Yourself (DIY) approaches is its self-proclaimed focus on companies as sponsors of the devices which are then hosted by citizensrdquo
INTRODUCTION
26 | SENSOR DRIVEN SENSOR DRIVEN | 27
33 DIY-SENSOR TO MEASURE ENVIRONMENTAL DATA SENSEBOX
SenseBox is an environmental data-sensor utilising a micro controller unit (MCU) It can record environmental data (temperature humidity air pressure illuminance UV radiation fine dust pollution and more) depending on the chosen setup The user can upload the data generated by senseBox (and other devices) to a central server where it is plotted on the openSenseMap and thereby made available so that anyone can observe analyse and download the data
ldquoThe collected data increases the measurement density of various environmental factors and can contribute to more accuracy regarding environmental pollution or trafficrdquo
SenseBoxes measure numerous environmental variables The collected data increases the measurement density of various environmental factors and can contribute to more accuracy regarding environmental pollution or traffic
The senseBox comes in two variants a lsquohomersquo edition which can be freely configured and an lsquoedursquo edition which comes as a non-customizable package with a fixed set of sensors included The home edition also comes with a weather-resistant packaging and a 5m USB cable allowing the user to install it as a stationary unit for instance on a balcony The edu edition on the other hand is meant to be used in schools and other learning environments in order to become acquainted with the MCU platform and to perform research projects
When purchasing a senseBox home the customer chooses a specific loadout Always included is the MCU the lsquoheartrsquo of the device a temperature and humidity sensor a radiation protector weather resistant packaging and a 5m USB cable The customer needs to choose at least one so-called lsquoBeersquo which represents the type of connection used to transmit data Wi-Fi SD-card LAN or LoRa (Long Range) can be chosen depending on the circumstances The customer can then pick additional sensors (air pressure light and UV fine dust) and items (GPS LED-display expander micro-SD card) The chosen components alongside assembling instructions is then sent to the customer
Once the customer has assembled the senseBox home the free and open source Arduino IDE
software can be used to set up the senseBox For less technically versed users a simplified block-based programming software called senseBox blockly is available online It enables the user to program hisher device by dragging visual components into jigsaw-like compositions which are automatically translated into the code that can then be transmitted to the senseBox
Detailed guidelines on the necessary steps to connect the senseBoxhome are available A guide to publish the data the OpenSenseMap is also available
Plotting of the results during NYE 2017 201816
DATA INTEGRATION In the example below a senseBox user decided to measure the effects of fireworks on the concentration of fine dust particles in the air on New Years Eve 2017 2018 Fireworks alone produced 5000 tons of particulate matter in 2016 in Germany amounting to approximately 17 of yearly emissions by vehicles The measurements created by the network of senseBoxes can serve as an entry point to the debate on fine dust particles and thereof potential political consequences
SOURCESbull Website describing the research setup
bull Blogpost describing the project
bull The data was gathered from the senseBox API (senseBox Github Repo)
bull It was then analysed using BinderHub allowing for a browser-run computational environment that can be reproduced by anyone
bull The graphical output was generated using R
bull Every step necessary to reproduce the analysis and output can be found here and here
Location of the senseBoxes in Muumlnster17
Interested in diy sensor approaches
Check out chapter 32
ldquoSafecast quickly began monitoring collecting and openly
sharing information on environmental radiation growing quickly in size scope and geographic reachrdquoINTRODUCTION
METHOD OF DATA COLLECTION
28 | SENSOR DRIVEN SENSOR DRIVEN | 29
34 PROPRIETARY SENSOR TO MEASURE ENVIRONMENTAL DATA BREEZE
Breeze is a proprietary out-of-the-box solution to collect and display different environmental data Whereas other providers of sensory toolkits such as senseBox or Safecast require the user to assemble the sensors Breeze offers a ready-made design The start-up sells outdoor and indoor monitoring solutions for municipalities and companies alongside a publicly accessible map that displays some of the collected data Breeze monitors and analyses pollutants in line with the health guidelines of the WHO Alongside
the monitoring of pollutants on the street level Breeze also offers its monitoring services to private companies As the air quality of office spaces can have a direct impact on the productivity of staff Breeze offers the possibility to improve indoor air monitoring for employees and employers
ldquoBreeze offers the possibility to improve indoor air monitoring for employees and employersrdquo
Air quality in urban spaces can cause irreparable damage18
DATA INTEGRATIONBreeze devices hold the potential to complement the existing monitoring solutions employed by municipalities and urban agencies through large numbers of low-cost devices which increase the resolution of the data points available
FURTHER INFORMATIONA Breeze device costs between 990euro and 1590euro + an additional 500-600euro per year to operate
SOURCES Breeze Website
Breeze Map Hamburg
Screenshot of Breeze Map20
Interested in diy sensor approaches
Check out chapter 32
ldquoSafecast quickly began monitoring collecting and openly
sharing information on environmental radiation growing quickly in size scope and geographic reachrdquo
INTRODUCTION
METHOD OF DATA COLLECTION
According to Breeze their software can integrate various types of Open Data The company states that their ldquoenvironmental analytics cloud platform gathers real-time data from Breeze air quality sensors as well as external data sourcesrdquo Furthermore it utilizes a ldquoproprietary Adaptive Cloud Calibration Engine to increase data reliability and accuracyrdquo by employing ldquomachine learning and big data technologiesrdquo19 Breeze devices collect Temperature and Humidity Carbon Monoxide (CO) Carbon Dioxide (CO2) Nitric Oxide (NO) Nitrogen Dioxide (NO2) Fine Particulates (PM10 and PM25) Sulphur Dioxide (SO2) Ozone (O3) and Ammonia (NH3) The measurements are made in short intervals (about 30 seconds) and transmitted to a central server owned by Breeze
As Breeze does not publish their code nor the specific hardware components used it remains difficult to assess the quality and precision of the measurements The standardized technical configuration and design nonetheless constitute a major asset
7 | WEB APPS WEB APPS | 8
04WEB APPS
Creating a mesh network using smartphones Firechat in MarikinaUser-generated reports on urban issues FixMyStreet Measuring safety in urban spaces Safetipin
Tracking traffic patterns using smartphones Modalyzer Measuring road quality and traffic data Cyface
Sensing noise using smartphones Noisetube
With continuously decreasing prices smartphones are becoming omnipresent in more and more parts of the world Equipped with GPS basic sensors and camera technology smartphones are an unpreceded tool to collect and share data In the context of climate adaptation in cities the inhabitants can participate in environmental mapping situational reporting feedback mechanisms and crowd-sensing tools with no additional costs involved
The applications presented below showcase the re-appropriation of the sensors and components integrated in smartphones to generate situational data of urban environments Firechat establishes a lsquomesh networkrsquo which functions without Wi-Fi or cellular connection to establish lines of communication by transforming smartphones into network nodes FixmyStreet uses the camera GPS module and descriptions to enable citizens to report issues in urban environments to the local administration Safetipin records subjective impressions of urban environments to assess safety of different areas Modalyzer records commuting routes and means of transport to make them available for user-chosen research projects Cyface
uses the gyroscopes included in many smartphones to sense damages such as potholes on the travelled road and Noisetube records noise levels using the microphone integrated in smartphones to create informative maps
ldquoFor urban practitioners these examples demonstrate the potential of turning the smartphone into a source of information for a wide field of possible applicationsrdquo
For urban practitioners these examples demonstrate the potential of turning one of the most widely distributed and popular devices the smartphone into a source of information for a wide field of possible applications That being said the efficiency data-quality and feasibility of integrating the information in specific contexts has to be evaluated for the specific use cases
41 42
43
44
45
46
32 | WEB APPS WEB APPS | 33
41 CREATING A MESH NETWORK USING SMARTPHONES FIRECHAT IN MARIKINA
Firechat is a peer-to-peer encrypted messaging app that uses Bluetooth and Wi-Fi connections to send text and images It works without access to Internet or cellular data creating a mesh network (based on the Bluetooth or Wi-Fi technology) Due to the technical limitations of the modules used users can be a maximum of approximately 80 meters apart for the system to function
As a mesh network Firechat has the option to operate in situations where the mobile network is unavailable given a sufficient user density
ldquoTherefore it develops its full potential when a communication infrastructure needs to be established in densely populated urban areasrdquo
Therefore it develops its full potential when a communication infrastructure needs to be established in densely populated urban areas It should be noted however that in order for this scenario to function Firechat needs to be installed on all the devices that intend to use the mesh network prior to internet connections becoming unavailable Furthermore the range of the network is
FireChat LOGO21
Open Garden the Firechat manufacturer made a Software Development Kit (SDK) called MeshKit available which allowed local deployment of the software powering the app eg to power city-specific emergency apps The SDK appears to have been removed since and it remains unclear whether it will return Other SDKs meeting similar aims such as the Hypelabs SDK NewAer and Max-mesh remain available
Depending on the App SDK different prerequisites need to be fulfilled A Bluetooth amp Wi-Fi connection is always needed on the user side
SOURCES
bull Project website
bull Article on Firechat (The Verge)
bull Article on Firechat (WIRED)
Illustration of firechat22
Interested in alternatives to the use of social media in spatial panning
Check out chapter 2
ldquoSmartphones are able to send and receive SMS even as data intensive and
mobile internet-based services (like WhatsApp) are not available due to extreme situationsrdquo
INTRODUCTION
METHOD OF DATA COLLECTIONFirechat collates various types of data Its primary use however is the establishment of communication networks in high-density areas with blocked or overstressed mobile connections
1 The user needs to install the Android or iOS version of the app
2 The user can then create single or multi-user conversations and chatrooms
3 Messages are encrypted and transmitted from user to user until they reach their destination
DATA INTEGRATION
34 | WEB APPS WEB APPS | 35
42 USER-GENERATED REPORTS ON URBAN ISSUES FIXMYSTREET
FixMyStreet (FMS) is a popular damage reporting and complaint management app in the UK For cities keeping up with damages vandalism illegal garbage disposals and more can be a tedious task Such issues occur on a daily basis and require swift action to maintain urban infrastructures Users can report issues through the app which matches their geolocation to the correct postcode and contacts the corresponding city department responsible to fix the damage This increases the efficiency of the process leading from the occurrence of an issue to the assignment of the responsible department reducing city bureaucracy The city administration can plan and react efficiently to coordinate services
and the line of communication between the city and its inhabitants helps to reduce frustration and complications on both sides
ldquoThe success of that application depends on the users experience with the city servicesrdquo
The success of that application depends on the users experience with the city services It is therefore essential that the reporting app is leading to visible outcomes performed by the city administration
METHOD OF DATA COLLECTION
1 The citizens report issues in the urban environment using text descriptions photographs and GPS tags
2 They post the issue using the website iOS or Android app
3 The report is forwarded to the council responsible
4 A messaging channel allows the council to respond and update the reporter
Users view of the FixMyStreet App23
DATA INTEGRATIONFMS can integrate with existing administrative reporting structures in different ways In the most basic variant the reports generated using FixMyStreet are simply sent to the e-mail address of the corresponding council by the software The email includes the category of the problem and its exact location The council can then respond to this email normally and the message will be sent to the usersrsquo inbox
A second way to integrate FMS is for councils to use the paid version of the software called FixMyStreet Pro This option includes the replacement of the internal reporting software used by a council with a customisable version of FMS Oxfordshire county council is one example that has taken this route
TECHNICAL INFORMATION The FixMyStreet platform is an open source software available on Github Any interested city council or citizen group can customize their own application of FMS Examples of this include the City of Zuumlrich and the City of Stockholm
SOURCES
FixMyStreet UK
FixMyStreet Pro
FixMyStreet Platform
GERMAN EQUIVALENTS
Maumlngelmelder
Karlsruhe Feedback
Maerker Brandenburg
Interested in other participatory digital solutions
Check out chapter 31 on iotrees
ldquoIt aims to collect data to develop an easy to update Urban Tree
Inventory raise citizen awareness about the eco-benefits of trees and assist in public decision-making based on evidencerdquo
INTRODUCTION
36 | WEB APPS WEB APPS | 37
43 MEASURING SAFETY IN URBAN SPACES SAFETIPIN
The lsquoMySafetipinrsquo app is used by citizens to obtain information on the level of safety in a given area based on user reports
ldquoWith MySafetiPin the user can navigate whilst sharing their location via GPSrdquo
The user can use the app as a navigation system which evaluates different routes based on their safety score The user can also share their location with his contacts via GPS when travelling through unsafe territory The app is primarily used in India Colombia Kenya Indonesia and the Philippines and was
Any user can publish a post sharing their feeling at a particular place Users can reinforce posts put up their own comments and additionally post it on Facebook and Twitter While travelling they can view Safety Audits and plan their routes accordingly The Safety Audit consists of a set of 9 parameters that make up to the safety score
Lighting in the area Openness of the area Visibility in the area
Density of people Security Quality of walk path Accessibility of public transport in the area Gender diversity in the area
The user evaluates these criteria on a scale from zero to five (0 ndash 5) Each rating results in a pin on the specific location where the audit was recorded along with the time and date The colour of the pin is red orange or green based on the measure of the parameters
Safetypinallowstoassessthesafetyofadistrictthroughtheusersevaluationinpredeterminedindices24
While many urban phenomena can be measured using sensors the personal perception and ldquomoodrdquo of an area is the result of an interplay of many factors which can only fully be understood and measured through experience The app can give urban planners a novel and subjective perspective on the actual perception of a place enabling them to take steps to improve or change the situation accordingly Safetipin therefore offers a unique
proposition by providing qualitative data that is otherwise difficult ndash if not impossible ndash to obtain For urban planning implementing the results could lead to new impulses in making cities more liveable The data generated is particularly relevant for social groups prone to abuse government service providers urban planners and non-governmental organizations involved in related social issues
SOURCES
About the app
City example (New Delhi)
SAFETIPIN25
Interested in other Mapping Applications
Check out chapter 51
ldquoHOT provides maps for disaster management risk
reduction and to help disaster respondersrdquo
INTRODUCTION
DATA INTEGRATIONMETHOD OF DATA COLLECTION
38 | WEB APPS WEB APPS | 39
44 TRACKING TRAFFIC PATTERNS USING SMARTPHONES MODALYZER
Modalyzer is an app that tracks mobility data with the option to make it available for research or urban planning projects Users can learn about the CO2 impact of their own mobility choices By sharing their data they can additionally support research projects and help improve existing mobility services Researchers in need of specific mobility data can post their research project on the website and offer incentives as a reward for data donations
ldquoThe app therefore offers a unique proposition by turning everyday commutes into traffic datardquo
The app therefore offers a unique proposition by turning everyday commutes into traffic data which is specifically relevant for urban and transport planners researching traffic patterns It furthermore shows the potential of combining the personal utility of an app with incentives to donate data One key difference to other apps presented here is that the resulting data is not published as Open Data which on the one hand limits its utility but on the other may help to motivate users to make relatively private data available for specific projects
Modalyzerallowstrackingroutesviamobiledevices26
DATA INTEGRATIONThe data collected is used in different research projects with different goals One current example (lsquoMobility Patterns in Maastricht and Berlinrsquo) wants to illustrate the status quo of the traffic behaviour in Maastricht and Berlin detect social hotspots and analyse these in terms of infrastructure leisure facilities etc and gain insights into the multimodality in the two cities
SOURCES
Installation instructions for modalyzer
Example research project
Envirocar is a similar app that tracks car data (RPM speed coolant temperature and more) using a Bluetooth enabled plug The data is then sent to a central server where it can be viewed by the user and where it is made available anonymously for research purposes
Astrafficincitiesposesmajorchallengesinformedplanningiscrucial27
Interested in other digital solutions for traffic monitoring
Check out chapter 45
ldquoWith the Cyface App and the Cyface Sensorbox GPS data
and road quality data can be capturedrdquo
INTRODUCTION
By opening the modalyzer app location and movement data are gathered As soon as the smartphone is connected to Internet the data is transmitted from the app to the modalyzer server where used modes of transportation travel durations and distances will be calculated The
software automatically detects the userrsquos means of transportation (car bus bicycle walking trains) with the option to fill potential gaps by the user (long distance busses airplanes motorbikes water transport) manually
METHOD OF DATA COLLECTION
40 | WEB APPS WEB APPS | 41
45 MEASURING ROAD QUALITY AND TRAFFIC DATA CYFACE
INTRODUCTIONWith the Cyface App and the Cyface Sensorbox GPS and road quality data can be captured Potholes that are more than 1 cm deep will be registered alongside GPS-based traffic data in both variants
METHOD OF DATA COLLCETION
The Sensorbox is built on the Raspberry Pi platform and is meant to be installed permanently in vehicles It runs on the electricity of the host vehicle and starts up as soon as the vehicle is turned on Both the Sensorbox and the smartphone app use an accelerometer gyroscope and GPS sensor to collect a wide range of data During the ride vibrations are recorded autonomously (sampling rate of 50-200 Hz) stored and transmitted to previously defined servers when a WLAN connection is established While the app needs to be engaged before every trip the Sensorbox records data continuously Both options can be used with cars and bicycles
Screenshot of road data maps made using cyface28
The data generated can support urban planning give automated feedback on damages to roads provide councils insights in the popularity and quality of tourist travel routes generate data for researchers and help road engineers to lower costs The Cyface Sensorbox can also be used as an alternative measuring instrument eg in vehicles of public waste collection
Correspondingly Cyface offers three use cases and related pricing structures
bull Cities communes record street quality fast and cheap
bull Research transform vehicles into data generation machines (Example 1 2 3)
bull Engineering record and evaluate road surface data less costly
SOURCES
cyface Sensorbox
Project website
Interested in other digital solutions for traffic monitoring
Check out chapter 46
ldquoNoise pollution in cities is proving detrimental to our health
According to the World Health Organisation (WHO) one in five Europeans is regularly exposed to sound levels at night that could significantly damage their health leading to cardiovascular diseases sleep disturbance and stressrdquo
DATA INTEGRATION
42 | WEB APPS WEB APPS | 43
46 SENSING NOISE USING SMARTPHONES NOISETUBE
The NoiseTube research project proposes a participative approach for monitoring noise pollution by involving the general public The NoiseTube app uses the microphone of mobile phones to turn them into noise sensors thereby enabling citizens to measure the sound exposure in their everyday environment Furthermore each user can participate in creating a collective map of noise pollution by sharing geotagged measurement data with the NoiseTube community Noise pollution in cities is proving detrimental to our health According to the World Health Organisation (WHO) one in five Europeans is regularly exposed to sound levels at night that could significantly damage their health29 leading to cardiovascular diseases and sleep disturbance Monitoring these noise levels is commonly attributed local councils which may not be able to generate sufficient data on noise pollution to assess and react to the levels in their jurisdiction
The noise data is collected via the microphone of smartphones that have the app installed It measures the decibel (dB(A)) levels records the GPS coordinates and offers the ability to tag the measurements with specific information for instance to note a sound source such as trains or planes
The data is made available in a map view and via an API
ldquoNoise pollution in cities is proving detrimental to our health According to the World Health Organisation (WHO) one in five Europeans is regularly exposed to sound levels at night that could significantly damage their health leading to cardiovascular diseases sleep disturbance and stressrdquo
Automobiles cause noise pollution30
Local governments can improve decision-making by understanding noise pollution in their city using maps and statistics based on NoiseTube They can receive feedback and opinions from citizens and give them feedback in return Nuisance sources can be identified and strategies to reduce their impact developed Researchers can use the data to analyse specific noise patterns and sources A series of publications have integrated NoiseTube data available under the open GNU LGPL v21 license Campaigns targeting noise-related issues could use the data to generate specific visualizations
The app is free to download and runs on Android smartphones
SOURCES
Noisetube API
Noisetube App Android
ldquoSources of noise can be identified and strategies to reduce their impact can be developed on the basis of the data Researchers can use the data to analyse specific noise patterns and sourcesrdquo
Interested in other digital solutions for traffic monitoring
Check out chapter 22
ldquoBus Tracker SMS demonstrates a simple digital solution
using SMS and a Global Positioning System (GPS) based backendrdquo
Noisetube
DATA INTEGRATION
INTRODUCTION
METHOD OF DATA COLLECTION
44 | MAPPING MAPPING | 457 | SMS
05MAPPING
OpenStreetMap
OpenDRI Open Cities
Crisis Mapping ndash Humanitarian OpenStreetMap Team (HOT)
Crowd-based mapping initiatives are amongst the most popular approaches in the field of climate adaptation Describing geospatial contexts in order to visualize structures and circumstances or to find new ways of describing the world is a challenge central to many climate-related issues OpenStreetMap (OSM) as the largest project in this domain with over 43 million users 41 billion nodes 3 millions changesday and 1 million contributors31 It has been the foundation of countless mapping efforts around the world Several projects build on OSM technology to engage citizens in the process of filling data gaps such as information about infrastructure and areas impacted by natural in cities
ldquoMaps are important tools to coordinate humanitarian efforts research geospatial phenomena display environmental data and plan urban strategies of disaster risk reduction and resilience buildingrdquo
Maps are important tools to coordinate humanitarian efforts research geospatial phenomena display environmental data and plan urban strategies of disaster risk reduction and resilience building In developing countries geospatial data is not always available and is subject to change once climate catastrophes have occurred Refugee displacement and outbreaks of diseases are potential consequences which are difficult to understand without geospatial data Similarly maps can be used to reduce disaster risk and increase resilience by exploring and analysing potential issues with given infrastructures
As data repositories maps can benefit from many sources of knowledge which may be technical (satellite images) local (on-the-ground reports and local knowledge) or even personal (see Safetipin above) As a vessel of knowledge maps can integrate a wide and diverse variety of information which is why many of the featured projects above plot the recorded data onto maps at some point
51 52
53
46 | MAPPING MAPPING | 47
51 OPENSTREETMAP
OpenStreetMap (OSM) is a collaborative project to create a free editable map of the world under an open license More than the map itself the data generated by the project is considered its primary output The growth of OSM has been fuelled its role as foundation to develop geospatial tools and services through additional layers Embodying the principles of Free and Open Source Software OSM is a primary example for the collaborative use of technology It serves as the backbone of countless mapping-related projects around the globe
Anyone is free to use the Open Data provided by OSM for any purpose as long as they credit OpenStreetMap and its contributors
ldquoAs the lsquoWikipedia of citiesrsquo OSM is one the most crucial tools for urban practitioners encountering data gaps in their workrdquo
As the lsquoWikipedia of citiesrsquo OSM is one the most crucial tools for urban practitioners encountering data gaps in their work Comprehensive tutorials provide with guidance on the design and execution of collaborative mapping efforts using OSM Prominent cases such as HOT and OpenDRI showcase the power of OSM in the context of climate adaptation
Open street map is an Open Source Software32
OpenStreetMap is the groundwork that many collaborative mapping initiatives are built on Its openness and flexibility allows stakeholders with diverse approaches to adapt it to their purposes Apart from HOT OpenDRI and Missing Maps the major humanitarian efforts integrating the OSM scheme are
bull Map of nuclear sectors around the world httpwwwleretourdelautruchecommapnuke
bull Mobile offline maps httpsmapsme
bull Print-map style map of Europe httpmap1eu bull Rating service of urban criteria (transport
schools etc) httpswwwonedomecomlocality-realityexplore
A large list of more OSM-based services is available here
SOURCES
bull Introduction into OSM (OSM)
bull OSM help
bull Learn how to map (Missing Maps)
bull Extensive resources on how to map (Missing Maps)
bull Overview of OSM editing apps and tools (OSM)
Related projectsMissing Maps
Interested in other Mapping Applications
Check out chapter 52
ldquoOpen Cities is a project of OpenDRI that is carried out in
11 cities in Sub-Saharan Africa to engage local government civil society and the private sector to develop the information infrastructures necessary to meet 21st century urban resilience challengesrdquo
INTRODUCTION
OpenStreetMap emphasizes local knowledge Users can tag places and add attributes about roads buildings addresses shops and businesses points of interest railways trails transit land use and natural features and more This leads to unique descriptions of urban environments for instance wheelmaporg provides a layer on OSM that shows whether a place is accessible for wheelchairs and a user created a tag to designate LGBTQ-friendly places Contributors use aerial imagery GPS devices and low-tech field maps to verify that OSM is accurate and up to date
Depending on the project using OSM the process of entering new data can vary To edit the actual OpenStreetMap a user needs to
1 Create an account httpswwwopenstreetmaporgusernew
2 Visit httpswwwopenstreetmaporg and login3 Enter the editing mode by clicking the lsquoeditrsquo
button
4 Make changes to information on the map5 Submit the changes for review or upload them to
the map
DATA INTEGRATIONMETHOD OF DATA COLLECTION
48 | MAPPING MAPPING | 49
52 OPENDRI OPEN CITIES
The Open Data for Resilience Initiative (OpenDRI) is a World Bank project that combines the practice of the Open Data movement to solve the challenges of resilient building to natural hazards with a climate adaptation strategy
ldquoOpen Cities is carried out in 11 cities in Sub-Saharan Africa to engage local government civil society and the private sectorrdquo
Open Cities is a project of OpenDRI that is carried out in 11 cities in Sub-Saharan Africa to engage local government civil society and the private sector to develop the information infrastructures essential to meet 21st century urban resilience challengesSince its launch in 2011 OpenDRI has worked to implement these ideas in projects in over 25 countries around the world
Open cities Process Diadram
METHOD OF DATA COLLECTIONA transdisciplinary team of experts receive funding and targeted training to perform following tasks throughout a year in the selected cities
bull create and compile open spatial data on buidings critical infrastructure and natural risks
bull develop targeted tools to assist decision making of key stakeholders
bull support local capacity-building and institutional development necessary for designing and implementing urban resilience interventions
DATA INTEGRATIONIn the final phase of the project teams develop their products and share results Once the final product is shared a sustainability and dissemination strategy is developed in cooperation with project mentors The openly shared Data can be utilised for other applications beyond the initial project This is especially relevant in sectors such as energy and transportation where detailed and up-to-date geographic data is required to develop investment programs Having dynamic and detailed open data generates economic value far beyond the project that initiates the data collection
SOURCES bull Project websites httpsopendriorg https
opencitiesprojectorg
bull Collection of resources (Open Cities)
bull Collection of resources (OpenDRI)
bull Planning an Open Cities Mapping Project
OSM daily activity
Interested in other Mapping Applications
Check out chapter 51
ldquoEmbodying the principles of Open Data and Free and
Open Source Software OSM is a primary example of the power of the collaborative use of technology and today serves as the backbone of countless mapping-related projects around the globerdquoINTRODUCTION
Opem street map process diagram
50 | MAPPING MAPPING | 51
53 CRISIS MAPPING - HUMANITARIAN OPENSTREETMAP TEAM (HOT)
The Humanitarian OpenStreetMap Team (HOT) applies the principles of Open Source and Open Data sharing for humanitarian response and economic development
ldquoHOT provides maps for disaster management risk reduction and to help disaster respondersrdquo
HOT provides maps for disaster management risk reduction and to help disaster responders HOT mainly uses OpenStreetMap and publishes
additional analytics tools and detailed guides to promote their approach and enable further replication
HOT uses OpenStreetMap applications to
bull create open map data that enables disaster responders to reach those in need
bull create maps of highly vulnerable areas where data is scarce
bull collaboratively collect geospatial data bull publish and analyse collected data openly
HOT projects identify data gaps and develop strategies to fill them Maps roads buildings infrastructure administrative borders refugee camps outbreaks of infections and more are made visible through the involvement of volunteers
HOT has applied the principles of collaborative mapping to a variety of complex issues While the spatial data is collected from a variety of sources (see below) the actual process of mapping (collecting data) is astonishingly simple Individual users compare a piece of information with the graphical display of the map They transpose the information onto the map using simple computer mouse actions The inherent potential that lies in that simplicity unfolds in its scalability A single user may only be able to fill a few grid squares at a time but thousands of users can map an entire city in a relatively short time to possibly save lives
The following data sources and mapping formats are used by HOT to create enrich maps
bull imports of existing datasets
bull manual mapping and categorization bases on satellite images
bull digitisations of satellite imagery (eg DigitalGlobe Google Maps)
bull community mapathons and trainings
bull knowledge transfers and workshops
bull validations of ground surveys on-the-ground reports
bull drone imagery
The data is transferred onto online maps based on OpenStreetMap using layers and data points The maps are made openly available and additional functions such as mapping statistics are included and presented alongside
UniversidaddeAntioquiaresearchstaffandYouthMappersmappingfishingvillagesinNorthernColombia33
Since HOT is active in a variety of different contexts the data integration differs from project to project In Semarang a city critically prone to tidal flood and landslides HOT collaborated among others with Petabencana to map over 482000 buildings 44 million meters of roads 433 meters of waterways and 11000 infrastructures The whole process took only four months covering all 177 villages and 16 sub-districts The project was part of InAWARE a project funded by the US Agency for International Development (USAID) the Office for Foreign Disaster Assistance (OFDA) and the Pacific Disaster Center (PDC) in order to provide the Government of Indonesiarsquos National Agency
for Disaster Management (BNPB) with technical assistance to improve early warning and disaster management decision making
In another case in the Democratic Republic of Congo HOT collaborated with the Ministry of Public Health to map over 250000 buildings and thousands of roads to enable the ministry to support relief efforts related to the Ebola outbreak in mid-2018 In Osaka Japan heavily impacted areas following the earthquake were mapped to rapidly develop an overview of destroyed infrastructures
SOURCES bull HOT Participatory Mapping Toolkit Web | PDF
bull learnOSM (Learn OpenStreetMap step by step)
bull HOT Training Center repository of courses related to HOT volunteer activation and more
bull HOT Export Tool open service that creates customized extracts of OSM data in various file formats
bull HOT on the Humanitarian Data Exchange data repository with detailed search functions
bull HOT Task Manager display of currently available mapping initiatives
bull OSM Analytics Github analytics tool to display metrics and analytics SIMILAR PROJECTS
bull Ushahidi (paid collaborative mapping management tool)
bull Standbytaskforce
Interested in other Mapping Applications
Check out chapter 43
ldquoSafetipin therefore offers a unique proposition by
providing qualitative data that is otherwise difficult ndash if not impossible ndash to obtainrdquo
METHOD OF DATA COLLECTION
DATA INTEGRATION
INTRODUCTION
52 | CONCLUSION CONCLUSION | 53
06CONCLUSION amp RECOMMENDATION
Social Media
SMS Technology
DIY-Sensor-driven tools
Smartphone apps
Mapping applications
54 | CONCLUSION CONCLUSION | 55
06CONCLUSION amp RECOMMENDATIONS
SOCIAL MEDIAbull Basic information such as text images GPS
tags voice and video recordings can easily be shared through social media if internet access is available Due to their wide adoption Social Media are powerful tools and may therefore be a preferable option to the creation of a new smartphone or web application
bull Group conversations (WhatsApp Facebook other messaging platforms) offer an easy yet unstructured way of coordinating groups of up to 256 users and are low-cost solutions to disseminate alerts and other messages
bull Hashtags (Twitter Facebook) offer a way to structure real-time data
bull Online document processing applications such as Google Drive HackMD and padlet offer ways to structure information rapidly
bull Privacy concerns can be an issue either because the data entered in social media is used for targeted advertising or because private data is made openly accessible
Recommendations When information needs be spread immediately in emergency situations social media provide a potential backbone
ldquoFor medium and long-term planning and management cities and municipalities should increase their independence from those international platforms in order to restore data ownershiprdquo
For medium and long-term management cities and municipalities should increase their independence from those international platforms in order to restore data ownership Despite the above mentioned concerns these channels offer the distinctive benefit of a pre-existing network and should be taken into consideration
SMS TECHNOLOGYbull SMS-based tools and applications benefit from
the wide distribution of mobile devices even in developing regions and remote areas
bull Using SMS users can interact with computers through a backend and corresponding software such as FrontlineSMS This enables automated communication networks For the efficient distribution of food and shelter in times of crisis such systems can be established in regions where only cellular access is available
bull Combining a backend with other services (GPS forecast algorithms and more) allows for the distribution of a wide range of data to individual receivers such as weather alerts
Recommendations SMS may seem outdated as a technology in light of the rise of social media platforms like Facebook or WeChat However as an easily accessible cheap robust and energy-saving technology it nonetheless has potential as a backbone technology and should not be dismissed
ldquoInnovations on the backend such as data processing chat bots artificial intelligence improve the utility of SMS technologyrdquo
Innovations on the backend such as data processing chat bots artificial intelligence improve the utility of SMS technology
56 | CONCLUSION CONCLUSION | 57
DIY-SENSOR-DRIVEN TOOLSbull DIY-Sensing tools are relatively low-cost
programmable devices equipped with sensors that are commonly based on microcontrollers such as the Arduino platform
bull They are used by citizens researchers and others to record specific environmental data (temperature humidity fine dust particle concentration radiation and more)
bull The measurements are made1 to complement data in case of scarcity or
unavailability2 to create independent measurements as a
means of control 3 to raise awareness on environmental issues
(eg problematic levels of fine dust)4 for research purposes
bull All of the sensing projects presented below offer ways to automatically plot the generated data on interactive online maps
bull In most cases the generated information is published as Open Data
bull The technical experience required varies between the devices Some (SenseBox bGeige) require the user to assemble and program the device themselves others (Breeze) are plug-and-play
bull The costs also vary greatly from 30euro on the low-end to 1000euro and more on the high-end with self-assembly variants tending to be cheaper and more complex sensors (eg radiation) tending to be more expensive
bull Plug-and-play variants are commonly the most expensive solutions
Recommendations DIY-Sensors are easy and affordable solutions to gather environmental data The accuracy of the measurements varies between the devices depending on the sensor setup their design and the data recorded Professional sensor systems operated by cities and public institutions commonly use much more expensive sensors employ different and more complex measuring techniques and use standardized configurations making their measurements more accurate Future changes in the design of the components used in DIY-sensors combined with sinking costs are variables that could improve their accuracy
ldquoWhile DIY-sensors are unlikely to replace professional sensor systems as a primary data source cites could benefit from using them to increase the density of existing sensors network raise citizen awareness and to perform pre-tests for urban innovation processes ldquo
While DIY-sensors are unlikely to replace professional sensor systems as a primary data source cites could benefit from using them to increase the density of the pre-existing sensor network raise citizen awareness and to perform pre-tests for urban innovation processes
SMARTPHONE APPS
bull In the context of climate adaptation Apps make creative use of smartphone sensors (sound image motion) and modules (GPS Wi-Fi) Due to continuously decreasing prices smartphones are on the way to substitute ldquotraditionalrdquo mobile phones
bull Apps exist for a wide range of purposes from reporting damages to urban infrastructures measuring noise in urban environments and generating safety reports based on subjective indicators
bull Firechat re-appropriates the Wi-Fi and Bluetooth sensors to create an ad hoc so called ldquomesh netrdquo (communication network using devices as nodes) in case of unavailable cellular connections This technology could be especially relevant when used to power urban emergency apps
bull Smartphone apps are low-cost solutions to bring needed applications into the hands of citizens but face the main challenge of acquiring and sustainably engaging users over time
Recommendations While in the last years it becomes quite common for cities and municipalities to develop and integrate apps in the urban planning and management process it is recommendable to review existing solutions before creating a new app In some cases the source code is publicly available and can be adapted (eg FixMyStreet) in others the intended functionality can be performed using Social Media (see above) in others app-based solutions have already been tested and did not achieved the expected results
ldquoIf cities are starting a development process for app-based solutions the focus must be the user and the benefits for them to incentivize adoption and userdquo
If cities are starting a development process for app-based solutions the focus must be the user and the benefits for them to adopt and use the app
58 | CONCLUSION CONCLUSION | 59
MAPPING APPLICATIONSbull Online-Maps are highly important tools to
coordinate humanitarian efforts research geospatial phenomena display environmental data and plan urban strategies of disaster risk reduction and resilience building
bull The most common purpose of mapping initiatives is to fill data gaps eg by mapping infrastructures or whole cities in areas prone to risk or by geotagging the spread of diseases
bull OpenStreetMap is the main driver behind mapping applications in the context of climate adaptation and numerous resources exist to train collaborators
bull The principles of Open Data and Open Source are key to the success of mapping initiatives and OpenStreetMap demonstrates this with high numbers of specific applications tools and services that have been built on top of it
Recommendations Google Maps and Open Street Maps (OSM) disrupted the provision of spatial information by offering a single portal for worldwide highly detailed and freely accessible maps
ldquoWhile Google Maps has a commercial and closed-source business model OSM is a non-profit based on openly available source code that can be flexibility adapted to case-specific contextsrdquo
While Google Maps has a commercial and closed-source business model OSM is a non-profit based on openly available source code that can be flexibility adapted to case-specific contexts Most of the web services and apps presented here rely on OSM due to the fact that Google Maps only offers highly limited options to enter new data onto their Maps while OSM is entirely community-built The actual process of mapping (entering new data into OSM) is simple and benefits from its scalability Users transfer information derived from datasets satellite images and first-hand sources onto the map using simple computer mouse gestures A single user may only be able to fill a few grid squares at a time but tens hundreds or thousands of users can map an entire city in a relatively short time to possibly save lives
The flowchart below summarizes the tools presented in this collection of case studies at a glance It aims to provide urban practitioners a quick and accessible overview of the tools presented here with the corresponding field of application It guides the user from the type of data needed to the various options available with explanations and recommendations presented alongside
60 | SOURCES IMPRESSUM | 61
1 httpswwwunorgdevelopmentdesaennewspopulation2018-revision-of-world-urbanization-prospectshtml retrieved 1510192 Monthly active Facebook users (Statista) retrieved 15122018 via httpswwwstatistacomstatistics264810number-of-monthly-active-facebook-users-worldwide3 Monthly active WhatsApp users (Statista) retrieved 15122018 via httpswwwstatistacomstatistics260819number-of-monthly-active-whatsapp-users4 Monthly active Twitter users (Statista) retrieved 15102019 via httpswwwstatistacomstatistics282087number-of-monthly-active-twitter-users5 Internet and social media use shows no growth in advanced economies but continues to rise in emerging and developing countries (Pew Research Center) httpwwwpewglobalorg20180619social-media-use-continues-to-rise-in-developing-countries-but-plateaus-across-developed-onespg_2018-06-19_global-tech_0-006 You think Facebook is free Well itrsquoll only cost you your private life (Observer editorial) httpswwwtheguardi-ancomcommentisfree2013dec29observer-editorial-digital-privacy7 Screenshots of the Petabencana map view (Last Access 09092019)8 httpswwwthehinducomnewsnationaltamil-naduwhat-led-to-the-2015-chennai-floodsarticle23326651ece (last access 09092019)9 copy GIZ Robert Heine10 Complete case study of FrontlineSMS in Pakistan Retrieved 15122018 via httpstatic1squarespacecomstatic56e1a99907eaa0941d037b0a56e1aaff06dcb7bbf42a7ba756e1aaec06dcb7bbf42a79541457629932722front-lineSMS_Pakistan_Floods_280513pdfformat=original11 Bus Tracker API Documentation httpswwwtransitchicagocomdevelopersbustracker (Last Access 09092019)12 Bus Tracker API Documentation httpswwwtransitchicagocomdevelopersbustracker (Last Access 09092019)13 httpsblockclubchicagoorg20181022busy-no-66-chicago-bus-to-get-its-own-lane-as-part-of-5-million-may-oral-push (Last access 10092019)14 Retrieved 15122018 via httpssafecastorgtilemap 15 Grouphunt Crowdfunding product page of bGeige Retrieved 15122018 via httpswwwgrouphuntsgprod-uctkickstarter-gold-safecast-bgeigie-raku16 Reproducible Environmental Observations and Analysis httpsnuestgithubiosensebox-bindersense-box-analysishtml (Last Access 09092019)17 Reproducible Environmental Observations and Analysis httpsnuestgithubiosensebox-bindersense-box-analysishtml (Last Access 09092019)18 copy GIZ Andreas Koumlnig19 Breeze Website httpswwwbreeze-technologiesde20 httphamburgbreeze-technologiesde21 httpsenwikipediaorgwikiFireChatmediaFileFireChat_logopng (Last Access 09092019)22 httpswwwwiredcom201510giant-network-for-free-messaging (Last Access 09092019)23 httpswwwgoogledesearchq=fixmystreetampsource=lnmsamptbm=ischampsa=Xampved=0ahUKEwiH_In76rbkAh-W8TxUIHc4PDMkQ_AUIEygCampbiw=1301ampbih=619imgrc=tbrqlbQAv6dViMampspf=1567588718302 (Last Access 09092019)24 httpswwwgoogledeimgresimgurl=http3A2F2Fsafetipincom2Ftheme-as-sets2Fsafetipin_common2Fimages2Fbanner-trackpngampimgrefurl=http3A2F2Fsafetip-incom2Fampdocid=szj2XE21I28qvMamptbnid=Foeo24hx1UniZM3Aampvet=10ahUKEwiI7oT6l7fkAh-VeVRUIHV0bCJAQMwhPKAkwCQiampw=1354amph=520ampbih=867ampbiw=1821ampq=safetypin20appampved=0ahUKEwiI7oT6l7fkAhVeVRUIHV0bCJAQMwhPKAkwCQampiact=mrcampuact=8spf=1567600803541 (Last Access 09092019)25 httpsplaygooglecomstoreappsdetailsid=comsafetipinmysafetipinamphl=en (Last Access 09092019)26 httpcentromariomolinaorgwp-contentuploads201609Enrico-Howe-2pdf (Last Access 09092019)
SOURCES
SOURCES27 GIZ Fotowettbewerb Urban October28 httpswwwcyfacedeapp (Last Access 09092019)29 WHO Europe Press release explaining the impact of noise pollution httpwwweurowhointenmedia-centresectionspress-releases200910one-in-five-europeans-is-regularly-exposed-to-sound-levels-at-night-that-could-significantly-damage-health30 GIZ Fotowettbewerb31 Wikipedia Stats Retrieved 15122018 via httpswikiopenstreetmaporgwikiStats32 httpsdewikipediaorgwikiOpenStreetMapmediaDateiOpenstreetmap_logosvg (last access 09092019)33 Universidad de Antioquia Mapping Coastal Wetlands (HOT project) via httpswwwhotosmorgpro-jectsuniversidad-de-antioquia (Last Access 09092019)
62 | SOURCES IMPRESSUM | 63
Ashok K December 12 2015 Chennai after the deluge How social media came to the rescue [WWW Document] Livemint [WWW Document] URL httpswwwlivemintcomSundayappS89VfrXLGaoRSSKPBC6qLLChennai-after-the-deluge-How-social-media-came-to-the-rescuhtml (accessed 121518)
International Bank for Reconstruction and Development Development Association or The World Bank 2014 OPEN DATA FOR RESILIENCE INITIATIVE PLANNING AN OPEN CITIES MAPPING PROJECT URL httpsopendriorgwp-contentuploads201412Planning-an-Open-Cities-Mapping-Project_0pdf (accessed 121518)
International Telecommunication Union 2017 Measuring the Information Society Report 2017 Volume 1 (2017) URL httpswwwituintenITU-DStatisticsDocumentspublicationsmisr2017MISR2017_Volume1pdf (accessed 121518)
Fuchs H December 29 2017 New Yearrsquos Eve Are fireworks harming the environment [WWW Document] DW URL httpswwwdwcomennew-years-eve-are-fireworks-harming-the-environmenta-41957523 (accessed 121518)
Free Software Foundation Europe 2018 Definition of Free and Open Source Software [WWW Document] Free Software Foundation Europe URL httpsfsfeorgaboutbasicsfreesoftwareenhtml (accessed 121518)
Future Climate for Africa February 15 2017 Capitalising on communication channels ndash How Malawi uses WhatsApp for weather information [WWW Document] Future Climate for Africa URL httpwwwfutureclimateafricaorgnewsblog-capitalising-on-communication-channels-how-malawi-uses-whatsapp-for-climate-information (accessed 121518)
FrontlineSMS 2018 CASE STUDY Sending a Message of Accountability SMS Helps Improve Services after Pakistan Floods [WWW Document] URL httpstatic1squarespacecomtatic56e1a99907eaa0941d037b0a56e1aaff06dcb7bbf42a7ba756e1aaec06dcb7bbf42a79541457629932722frontlineSMS_Pakistan_Floods_280513pdfformat=original (accessed 121518)
Malik D February 2 2016 Emergency response in the Whatsapp era [WWW Document] URL httpblogsworldbankorgendpovertyinsouthasiaemergency-response-whatsapp-era (accessed 121518)
Merriam Webster 2018 Definition of Social Media [WWW Document] URL httpblogsworldbankorgendpovertyinsouthasiaemergency-response-whatsapp-era (accessed 121518)
Opensourcecom 2018 Definition of Open Hardware [WWW Document] URL httpsopensourcecomresourceswhat-open-hardware (accessed 121518)
Pew Research Center 2018 Internet and social media use shows no growth in advanced economies but continues to rise in emerging and developing countries [WWW Document] URL httpwwwpewglobalorg20180619social-media-use-continues-to-rise-in-developing-countries-but-plateaus-across-developed-onespg_2018-06-19_global-tech_0-00 (accessed 121518)
APPENDIX
Safecast 2018 ABOUT CALIBRATION AND THE BGEIGIE NANO [WWW Document] URL httpsblogsafecastorgfaqabout-calibration-and-the-bgeigie-nano (accessed 121518)Stinson E December 12 2015 THIS APP IS BUILDING A GIANT NETWORK FOR FREE MESSAGING [WWW Document] Wired URL httpswwwwiredcom201510giant-network-for-free-messaging (accessed 121518)
Statista (2018) Number of monthly active Facebook users worldwide [WWW Document] URL httpswwwstatistacomstatistics264810number-of-monthly-active-facebook-users-worldwide (accessed 121518)
Statista (2018) Number of monthly active WhatsApp users [WWW Document] URL httpswwwstatistacomstatistics260819number-of-monthly-active-whatsapp-users (accessed 121518)
Statista (2018) Number of monthly active Twitter users [WWW Document] URL httpswwwstatistacomstatistics282087number-of-monthly-active-twitter-users (accessed 121518)
Technology Enquirer October 12 2015 Marikina unveils messaging app for disaster alert that works sans Wi-Fi phone signals [WWW Document] Technology Enquirer URL httpstechnologyinquirernet44812marikina-unveils-messaging-app-for-disaster-alert-that-works-sans-wi-fi-phone-signals (accessed 121518)
The Guardian (2013) You think Facebook is free Well itrsquoll only cost you your private life Observer editorial [WWW Document] The Guardian URL httpswwwtheguardiancomcommentisfree2013dec29observer-editorial-digital-privacy (accessed 121518)
The Open Definition (2018) Definition of Open Data [WWW Document] URL httpswwwmerriam-webstercomdictionarysocial20media (accessed 121518)
Toor A May 19 2016 This app lets rescue workers send offline alerts when disaster strikes [WWW Document] The Verge URL httpswwwthevergecom201651911711686firechat-alerts-app-natural-disaster-mesh-network (accessed 121518)
Verma S 2018 Chennai is Flooding and It Really Needs Your Help [WWW Document] tripoto URL httpswwwtripotocomtripchennai-flood-helplines (accessed 121518)
WHO Europe October 8 2009 One in five Europeans is regularly exposed to sound levels at night that could significantly damage health [WWW Document] WHO Europe URL httpwwweurowhointenmedia-centresectionspress-releases200910one-in-five-europeans-is-regularly-exposed-to-sound-levels-at-night-that-could-significantly-damage-health (accessed 121518)
Wikipedia 2017 Wikipedia Statistics [WWW Document] Wikipedia URL httpswikiopenstreetmaporgwikiStats (accessed 121518)
APPENDIX
64 | SOURCES
Published byDeutsche Gesellschaft fuumlrInternationale Zusammenarbeit (GIZ) GmbH
Registered officesBonn and Eschborn Germany
Friedrich-Ebert-Allee 36 + 4053113 Bonn
T +49 228 44 60-0
E climatedigitalcitiesgizde I httpswwwclimate-digital-citiescomBonn Germany 2019
Authorresponsible for contenteditorBela Seeger and The Open Knowledge FoundationGIZ is responsible for the content of this publication
IMPRESSUM
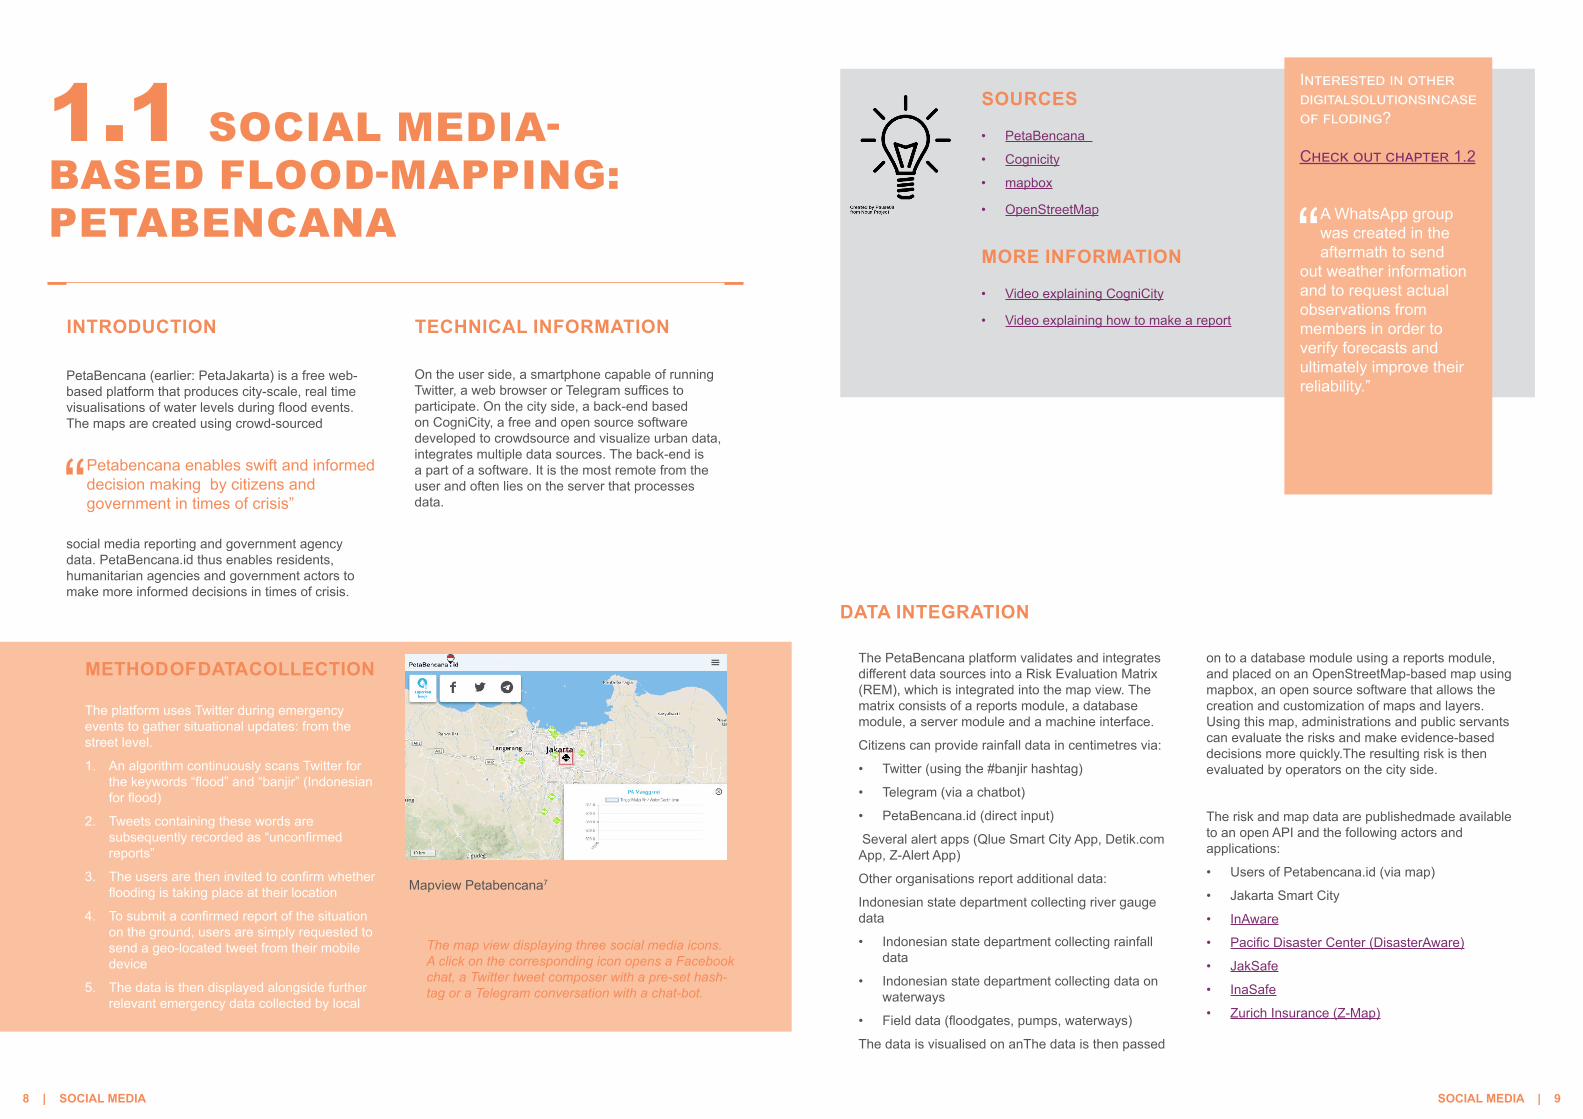
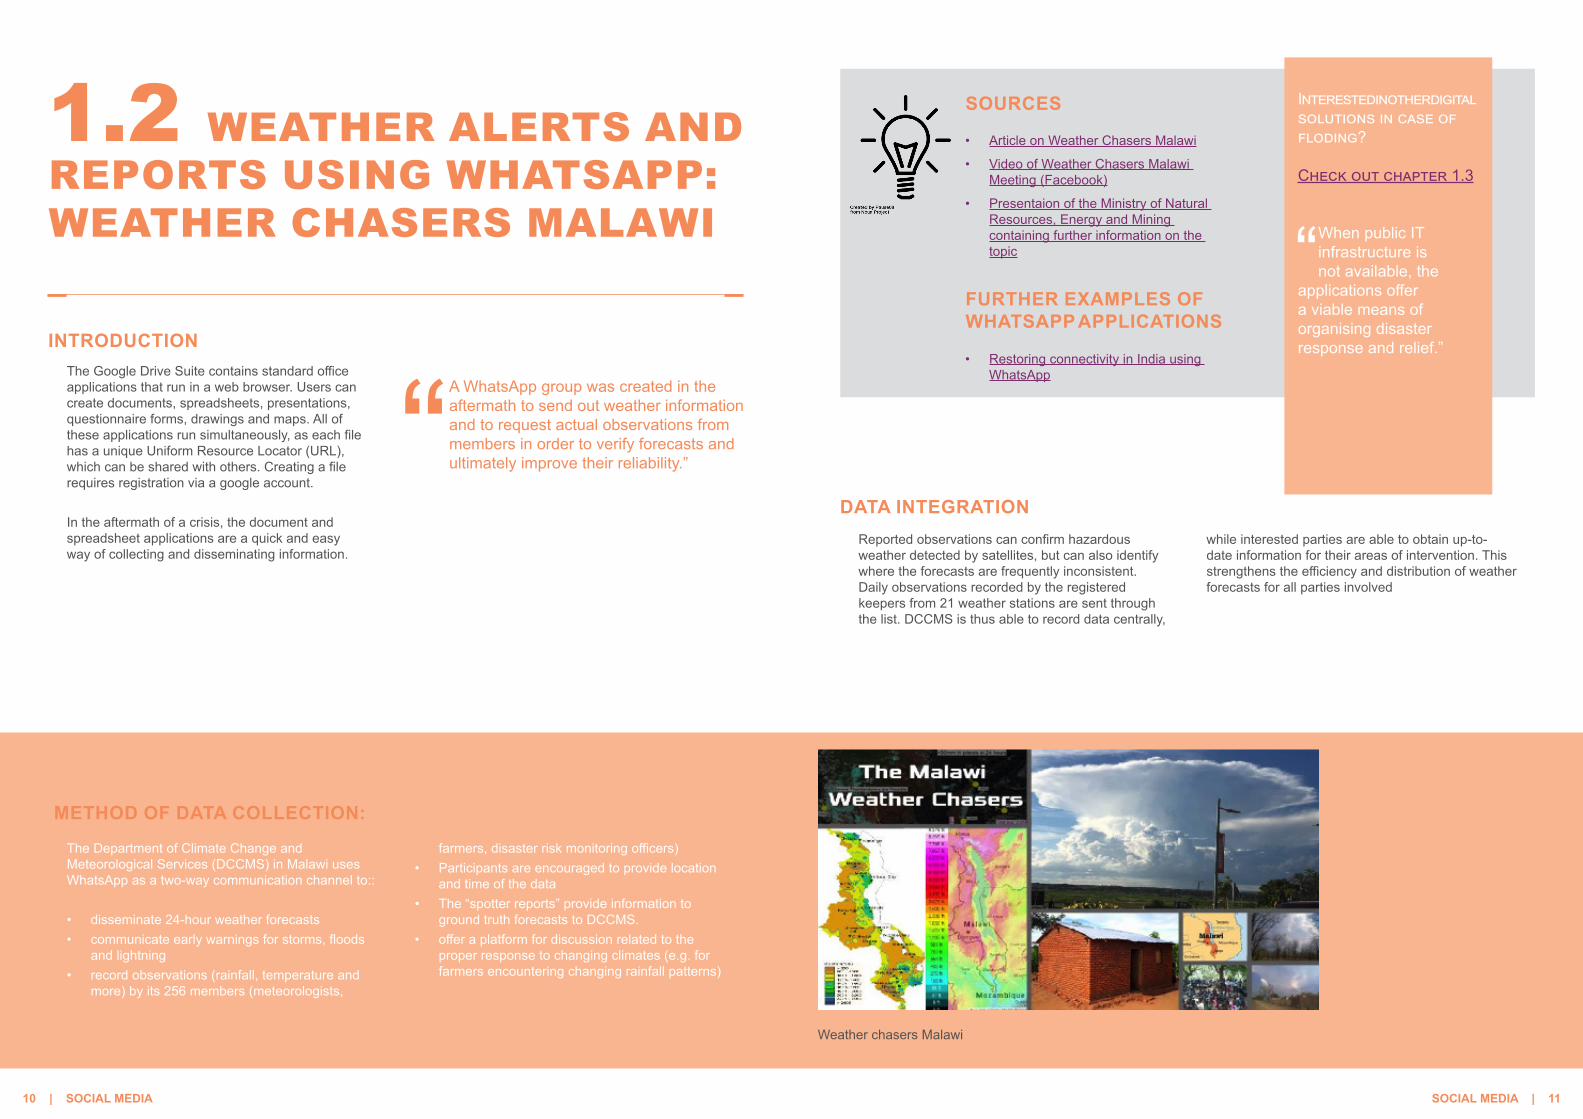
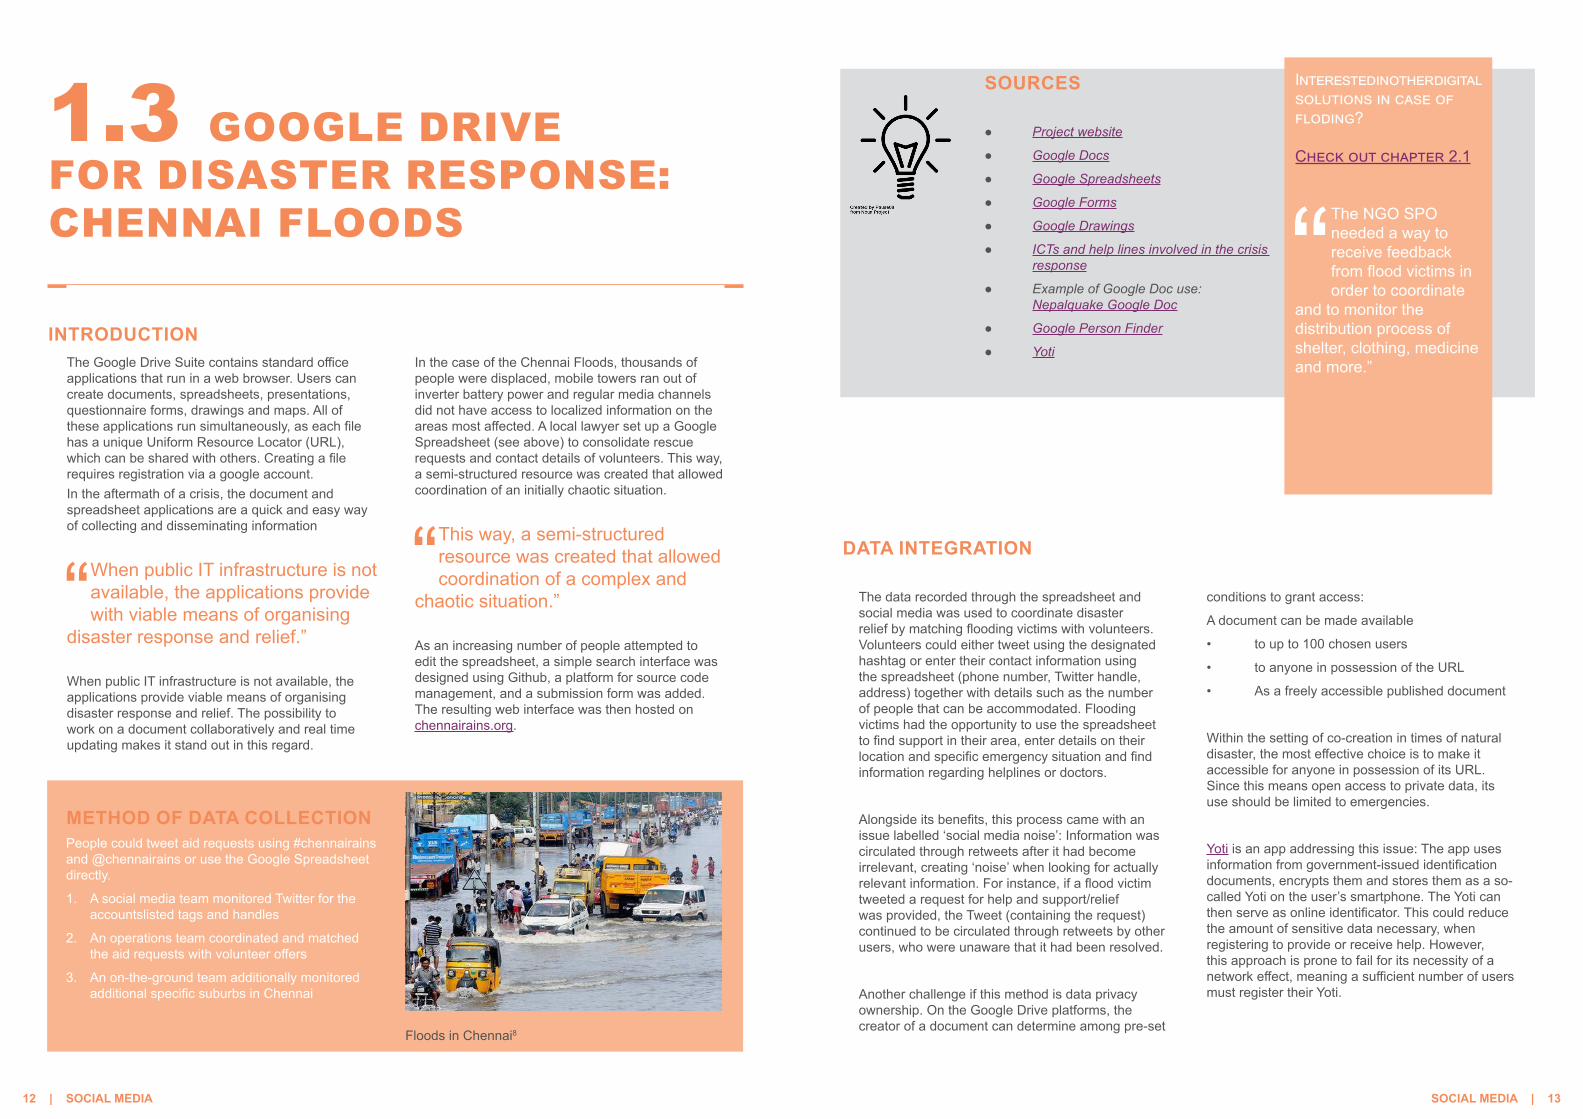
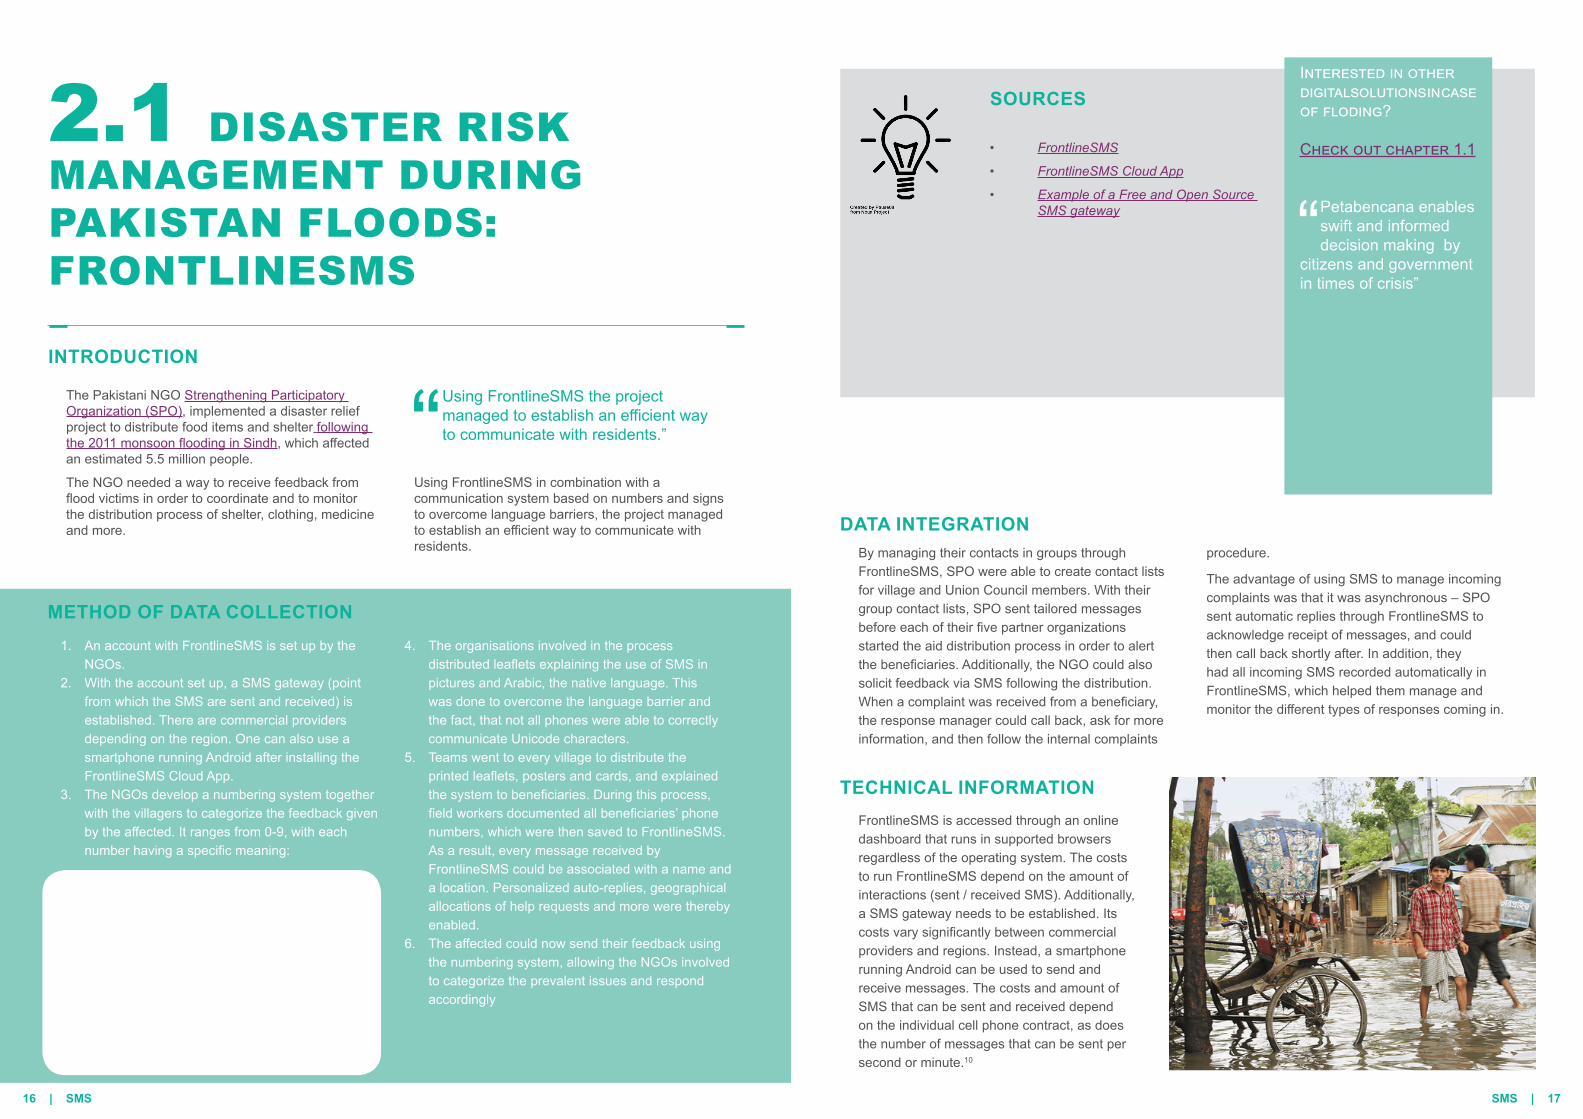
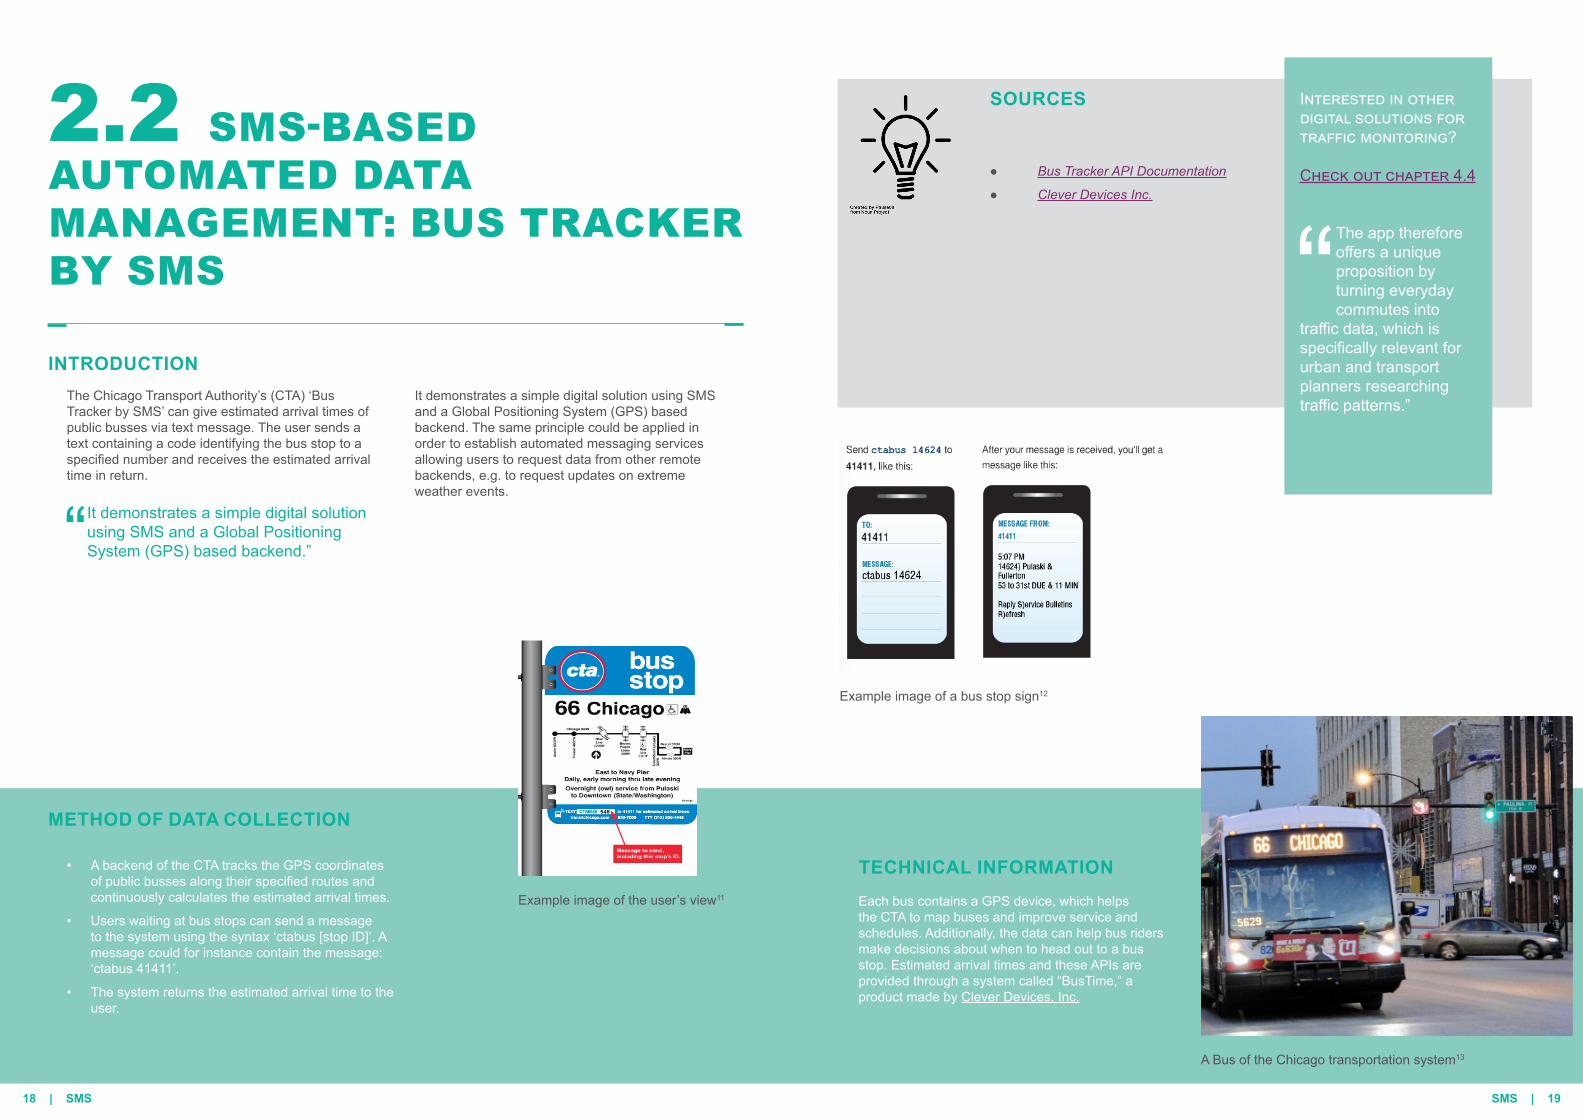
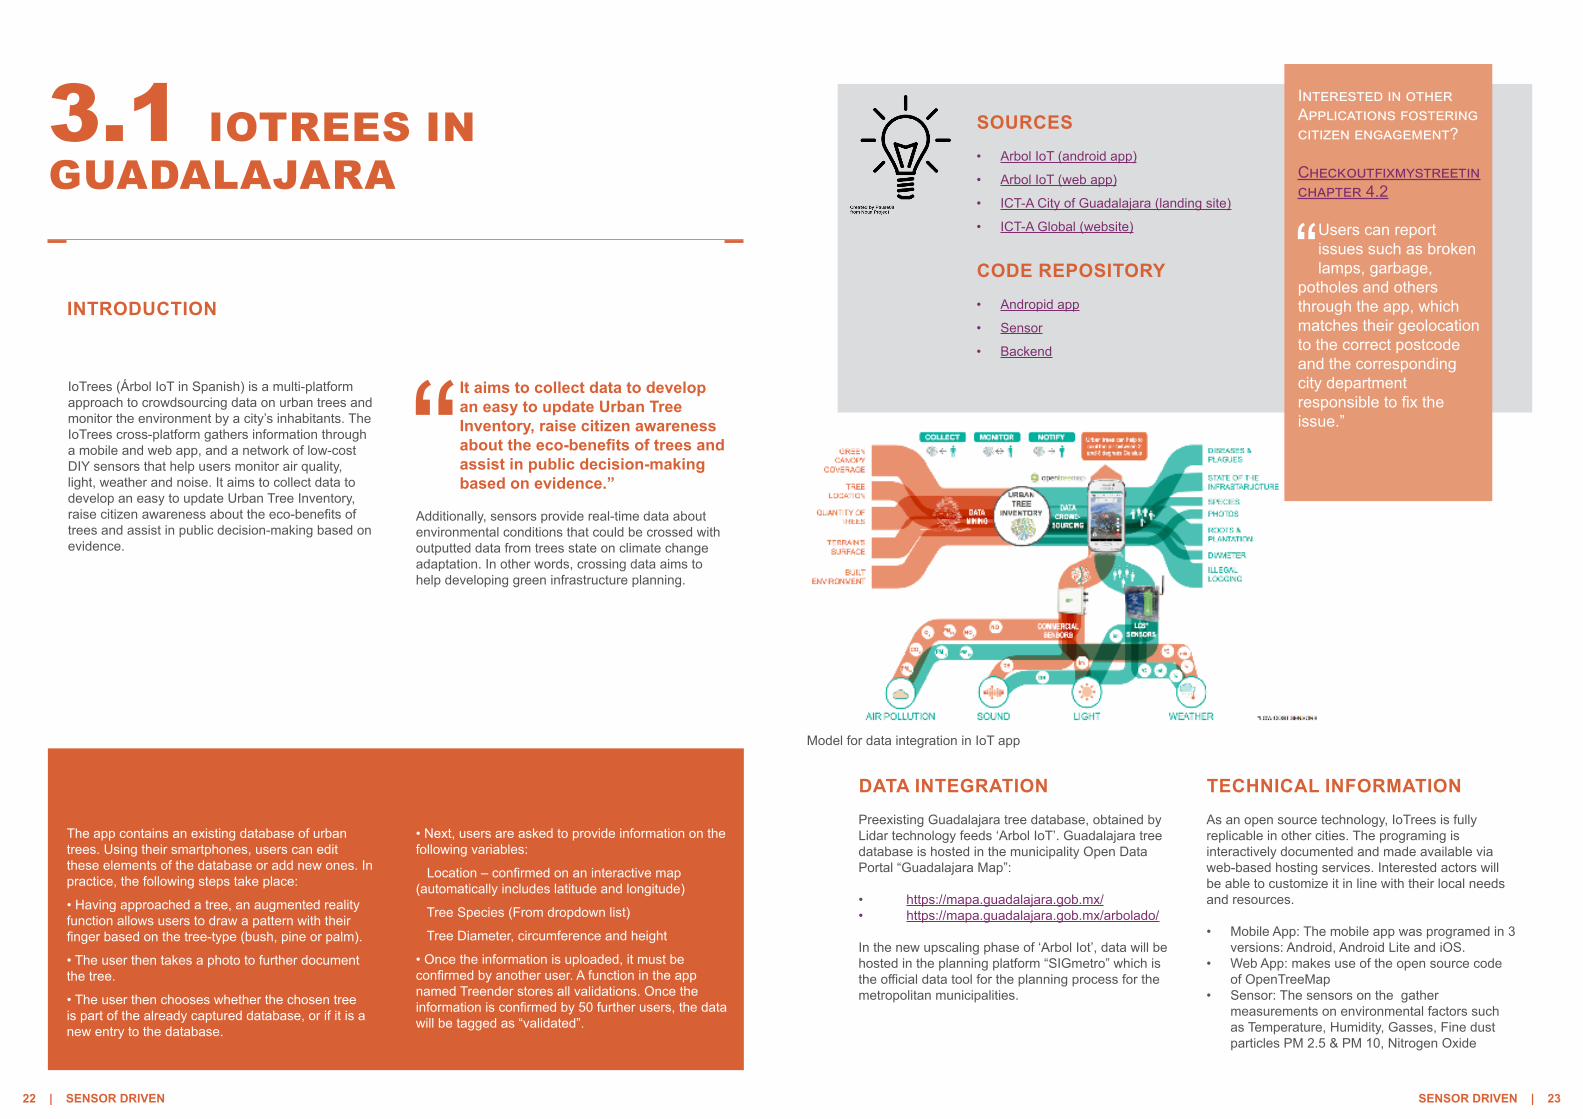
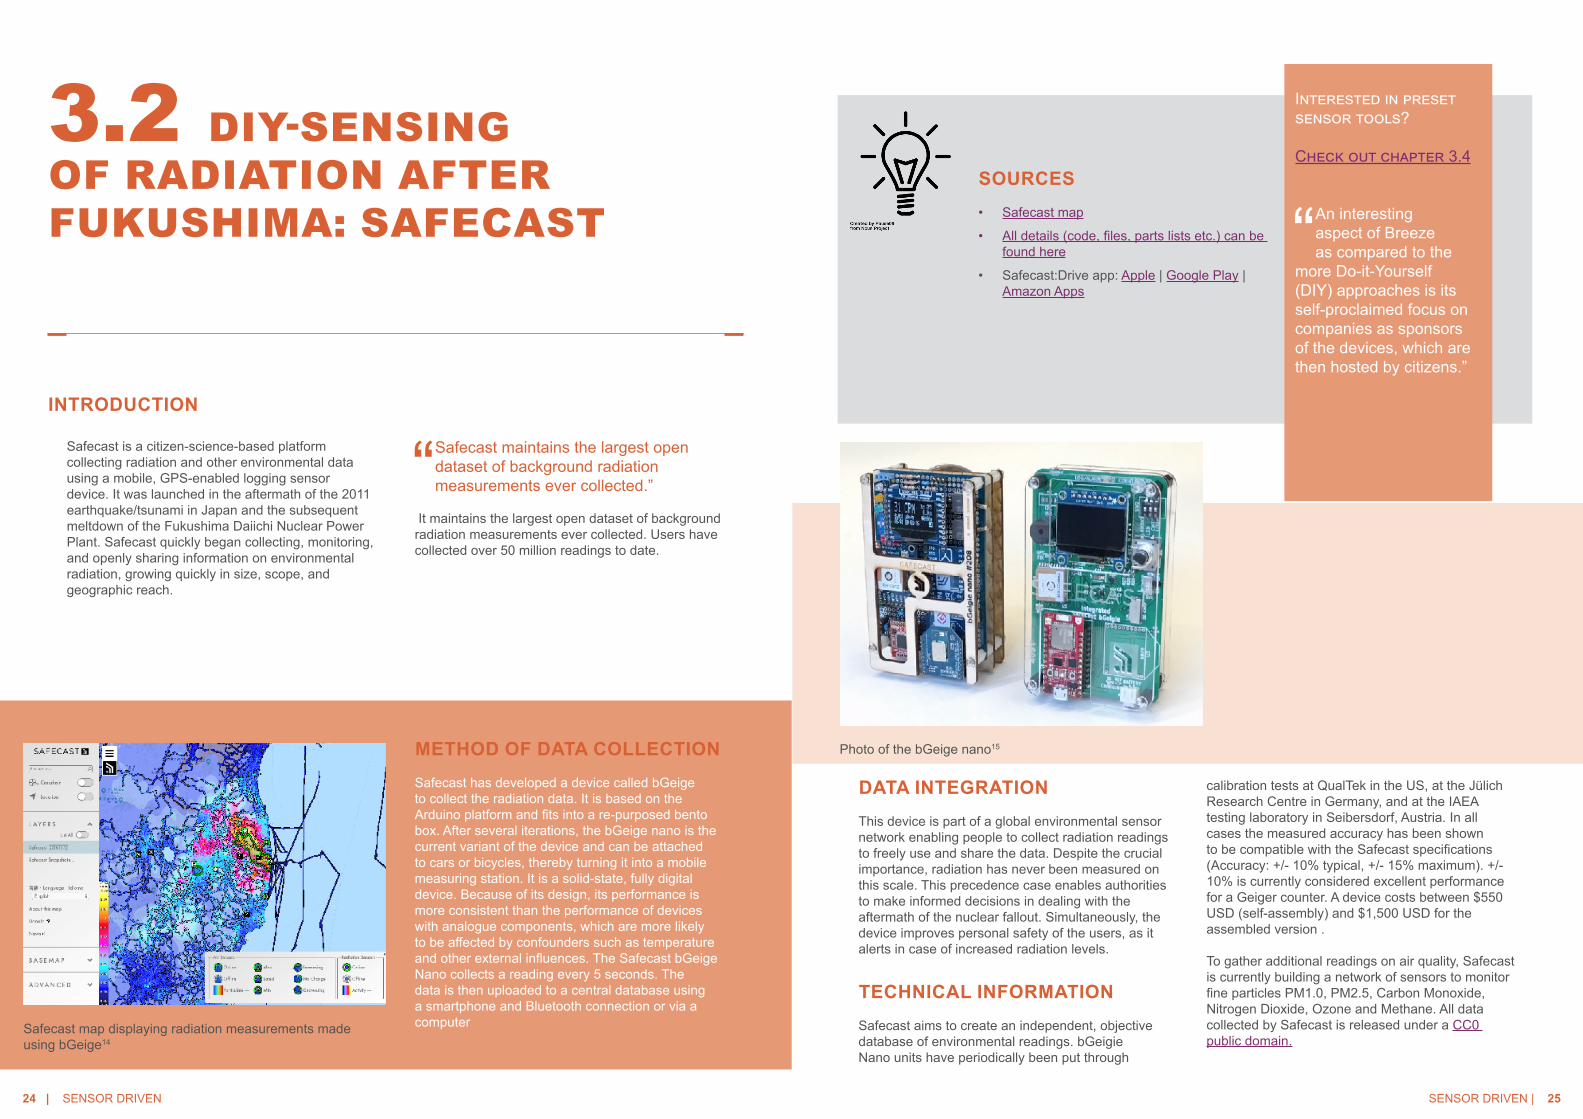
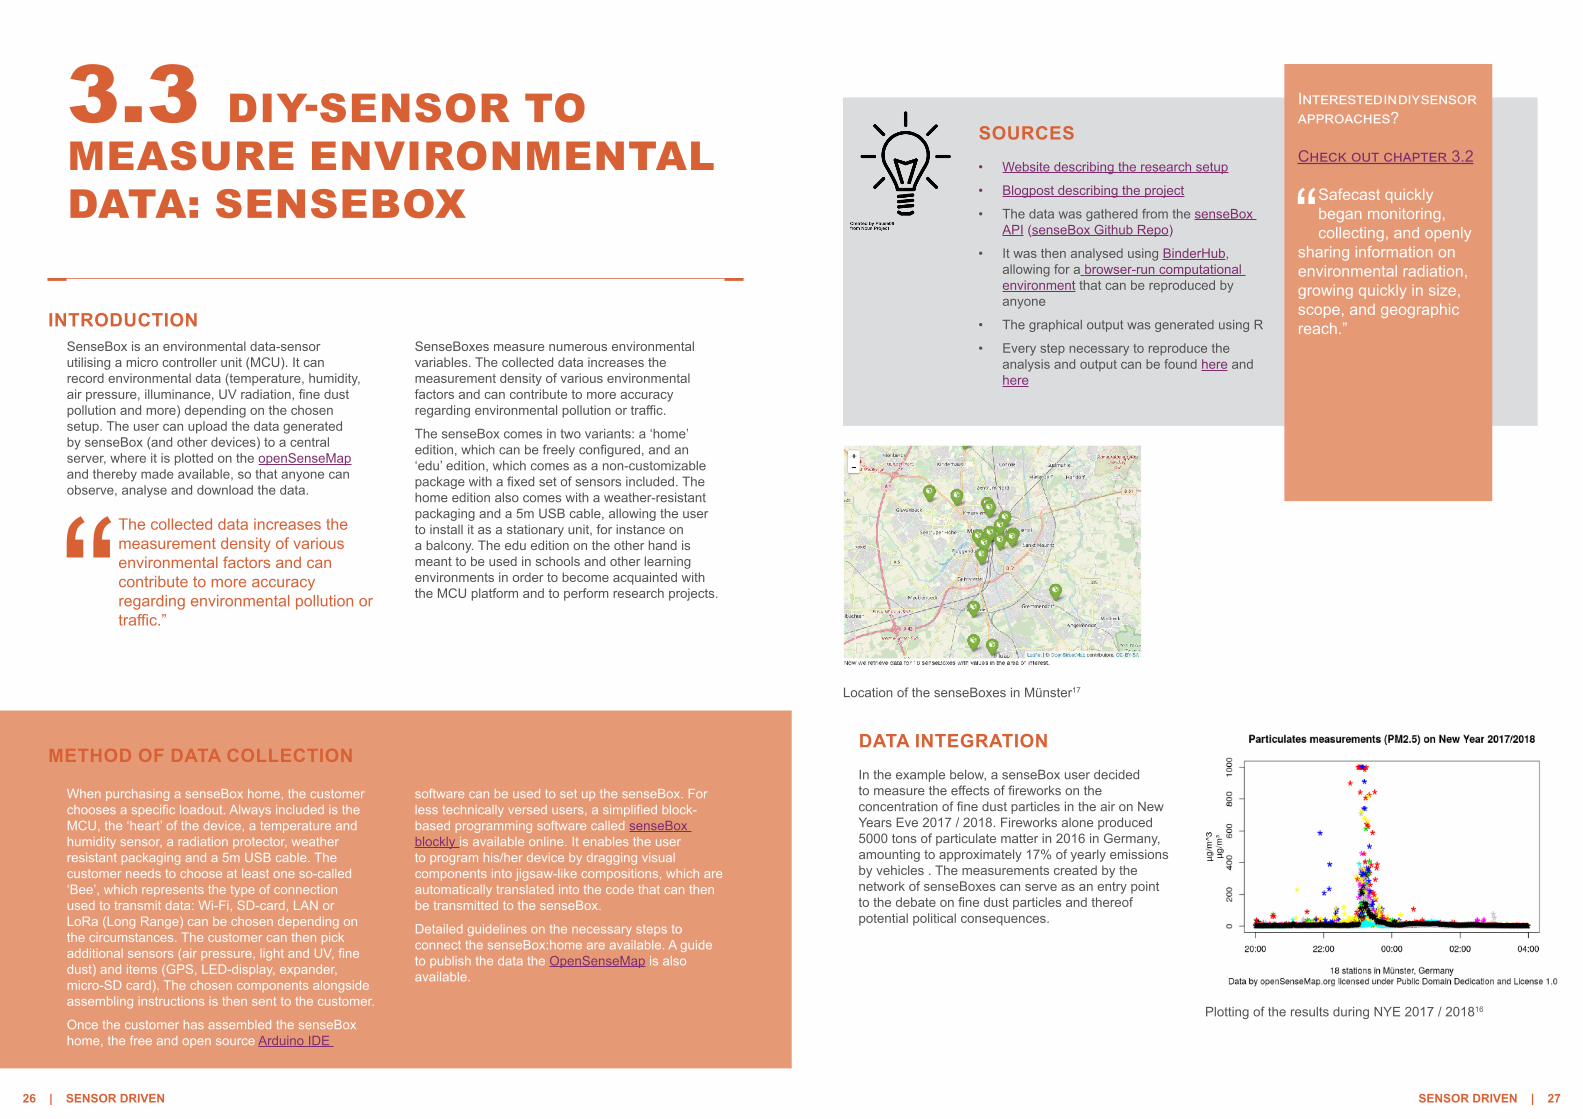
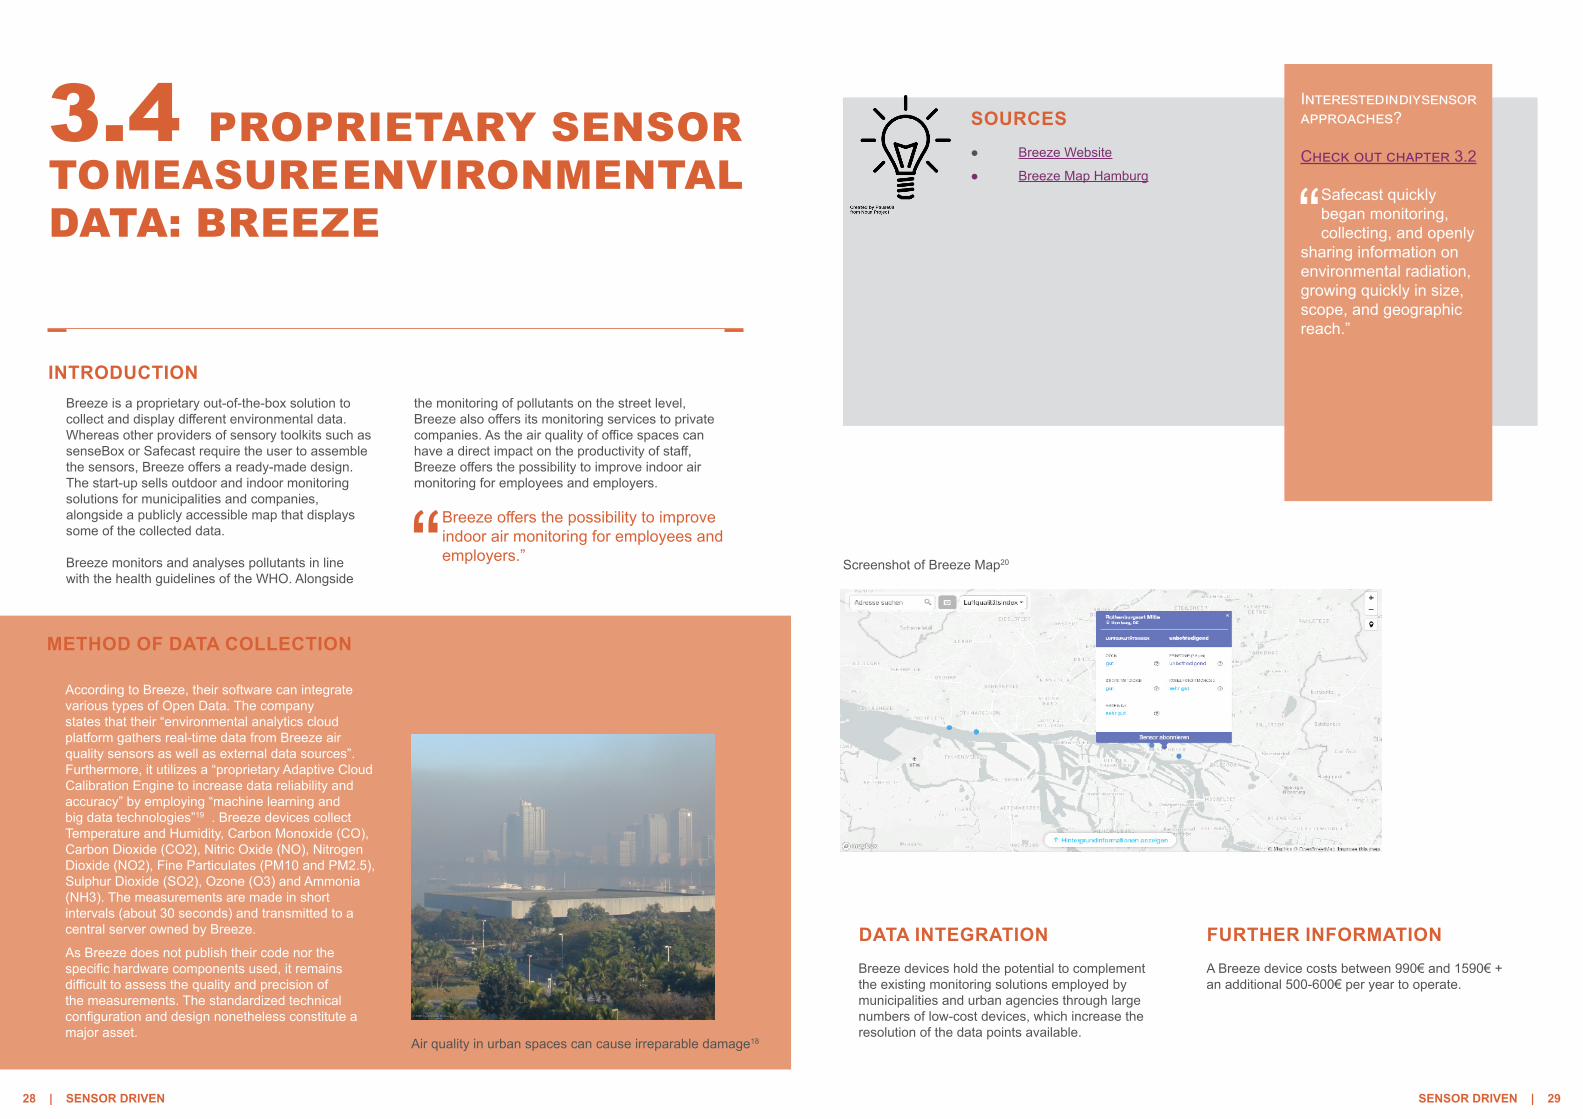
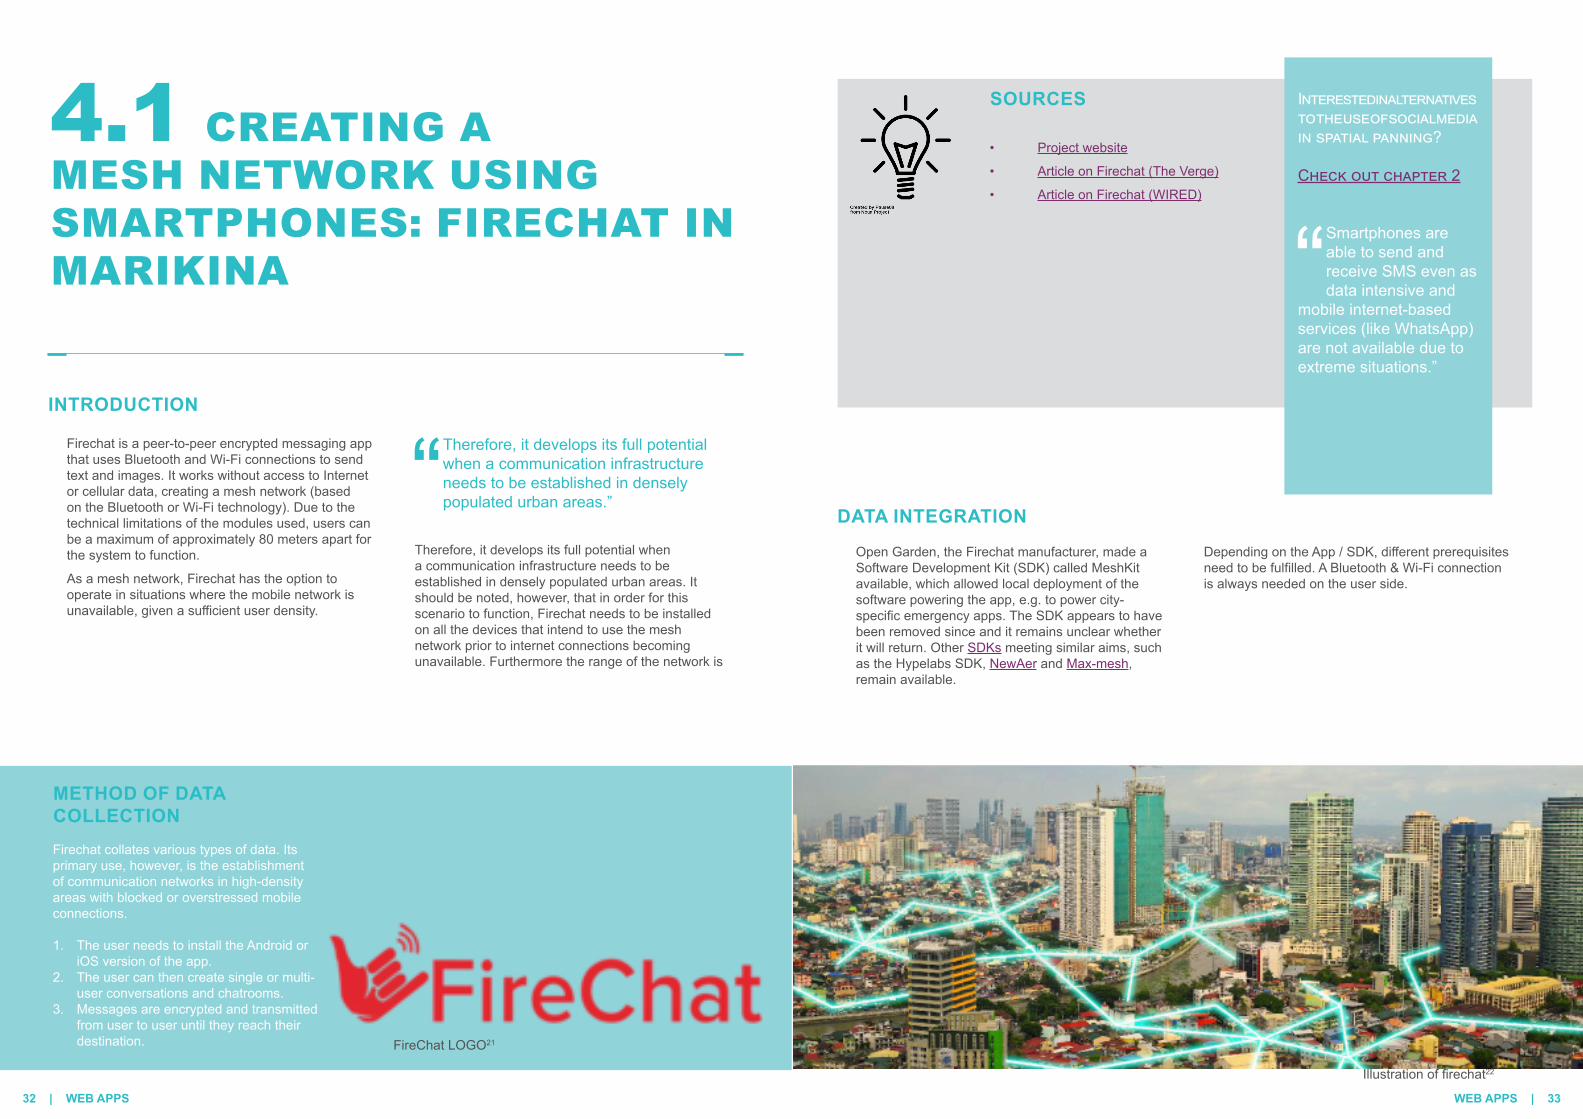
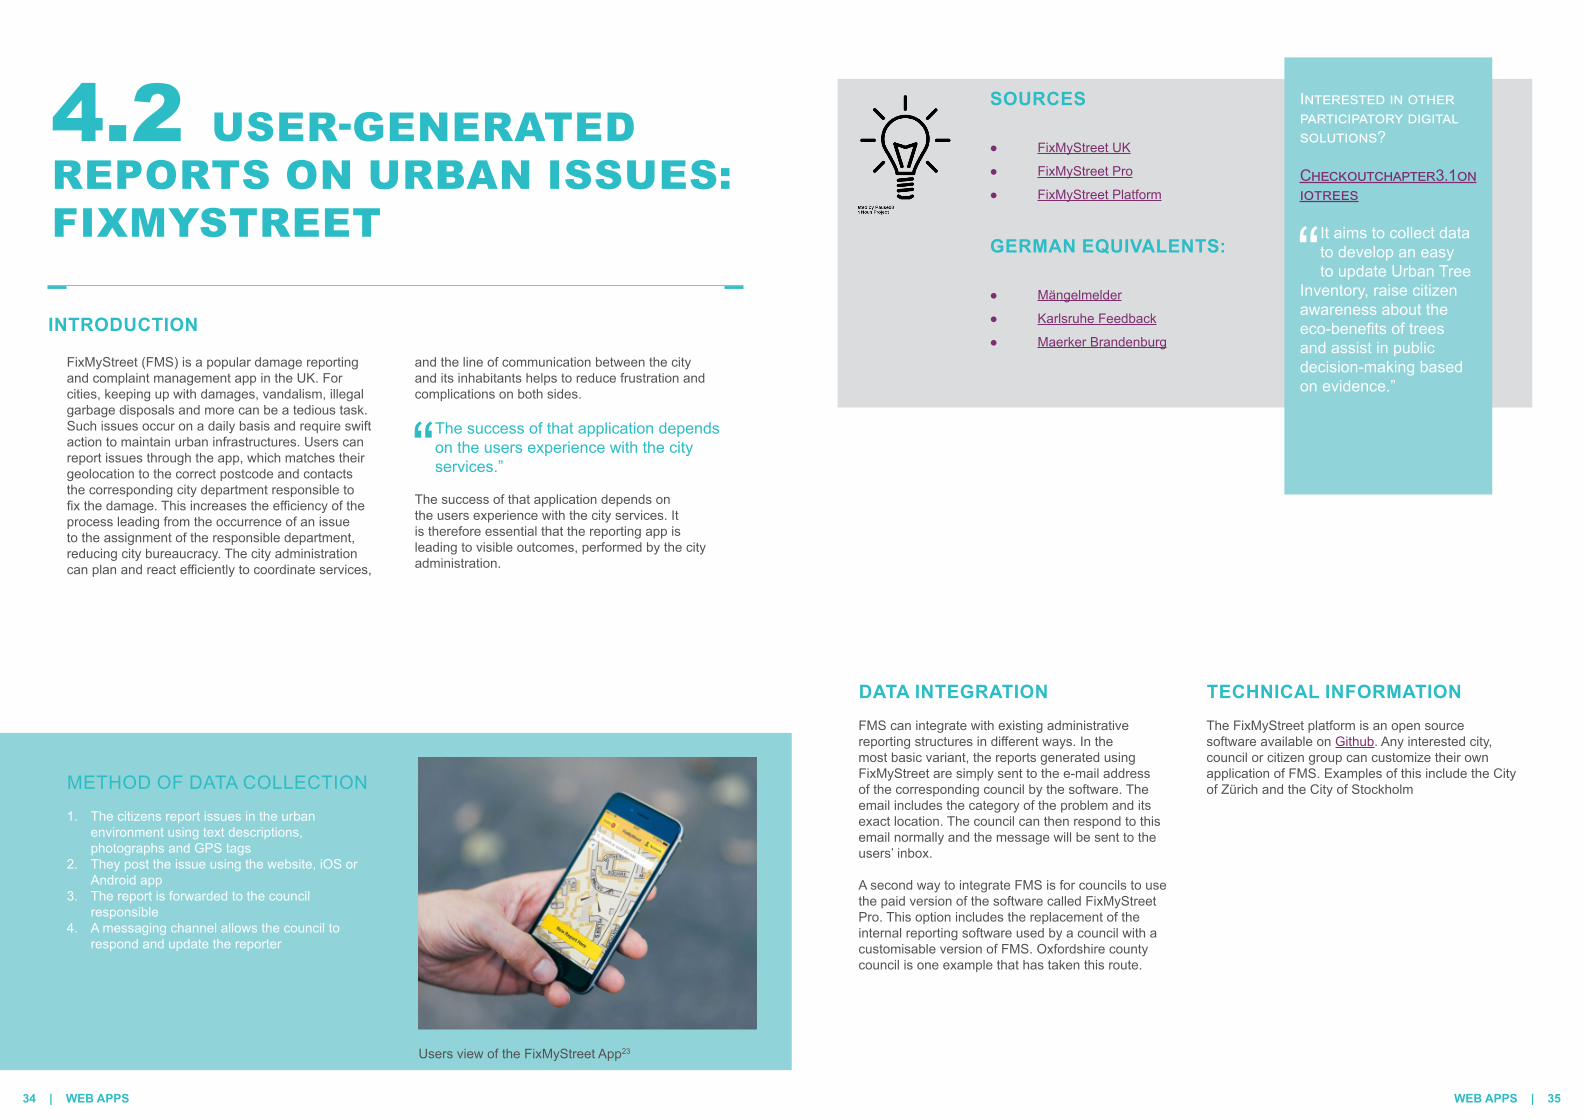
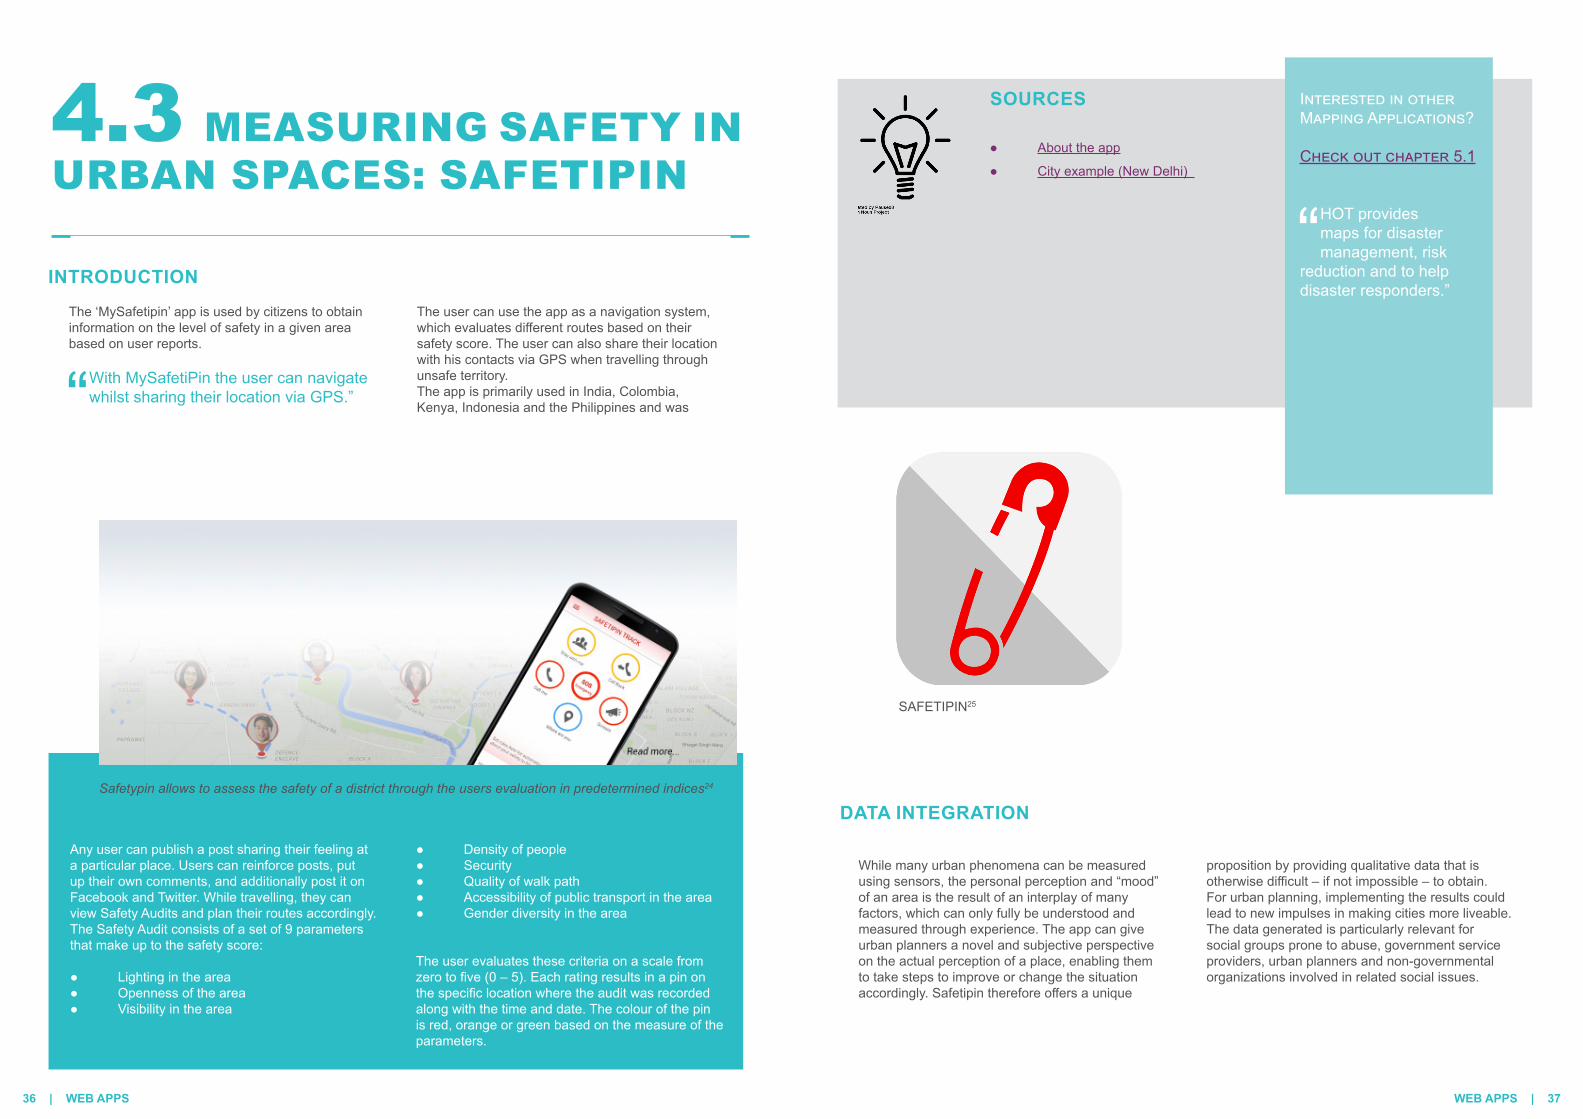
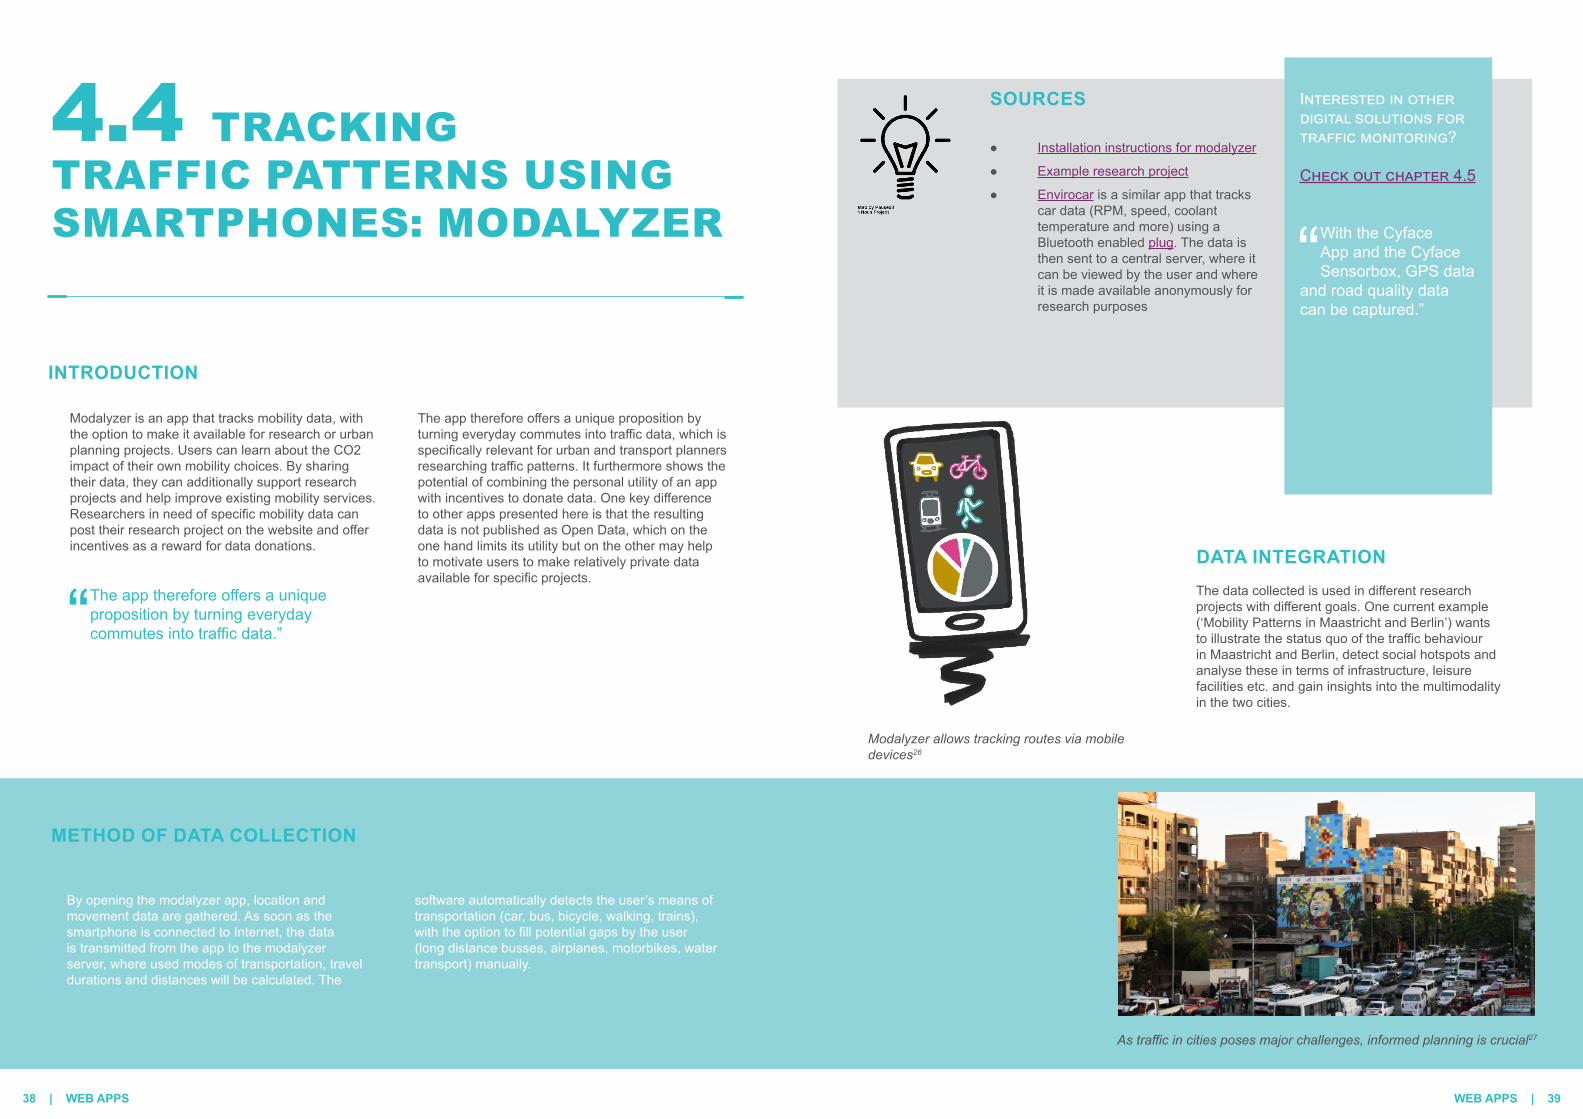
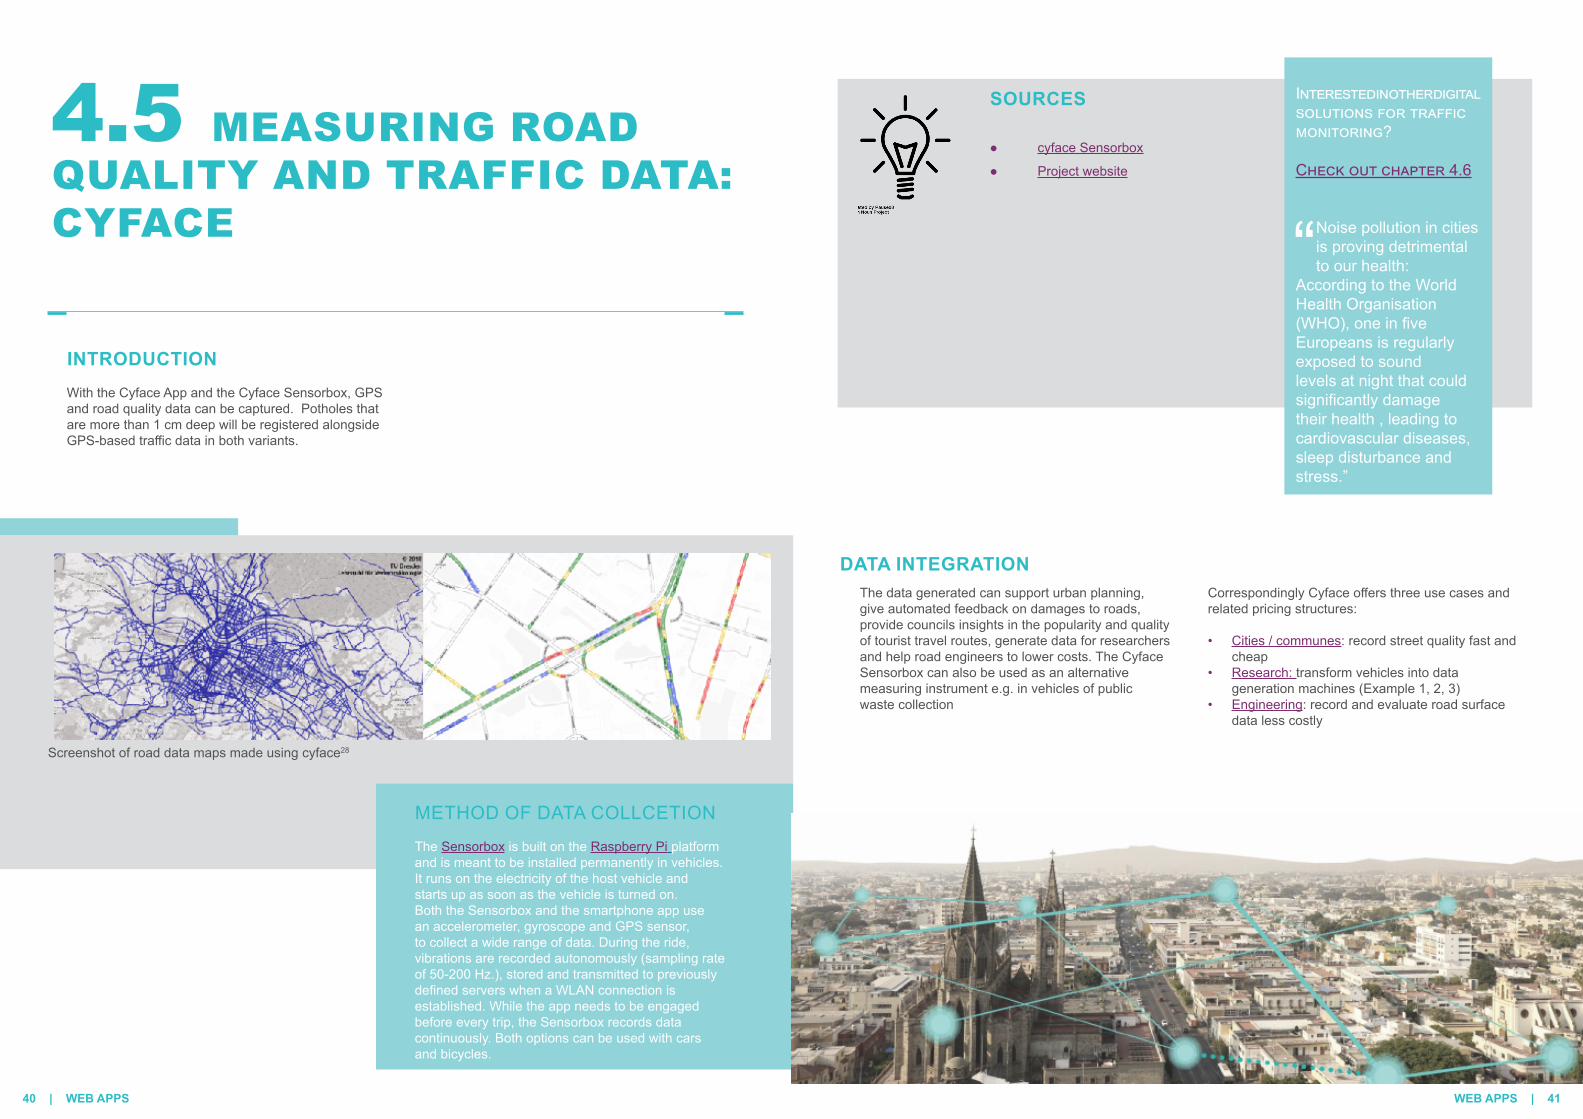
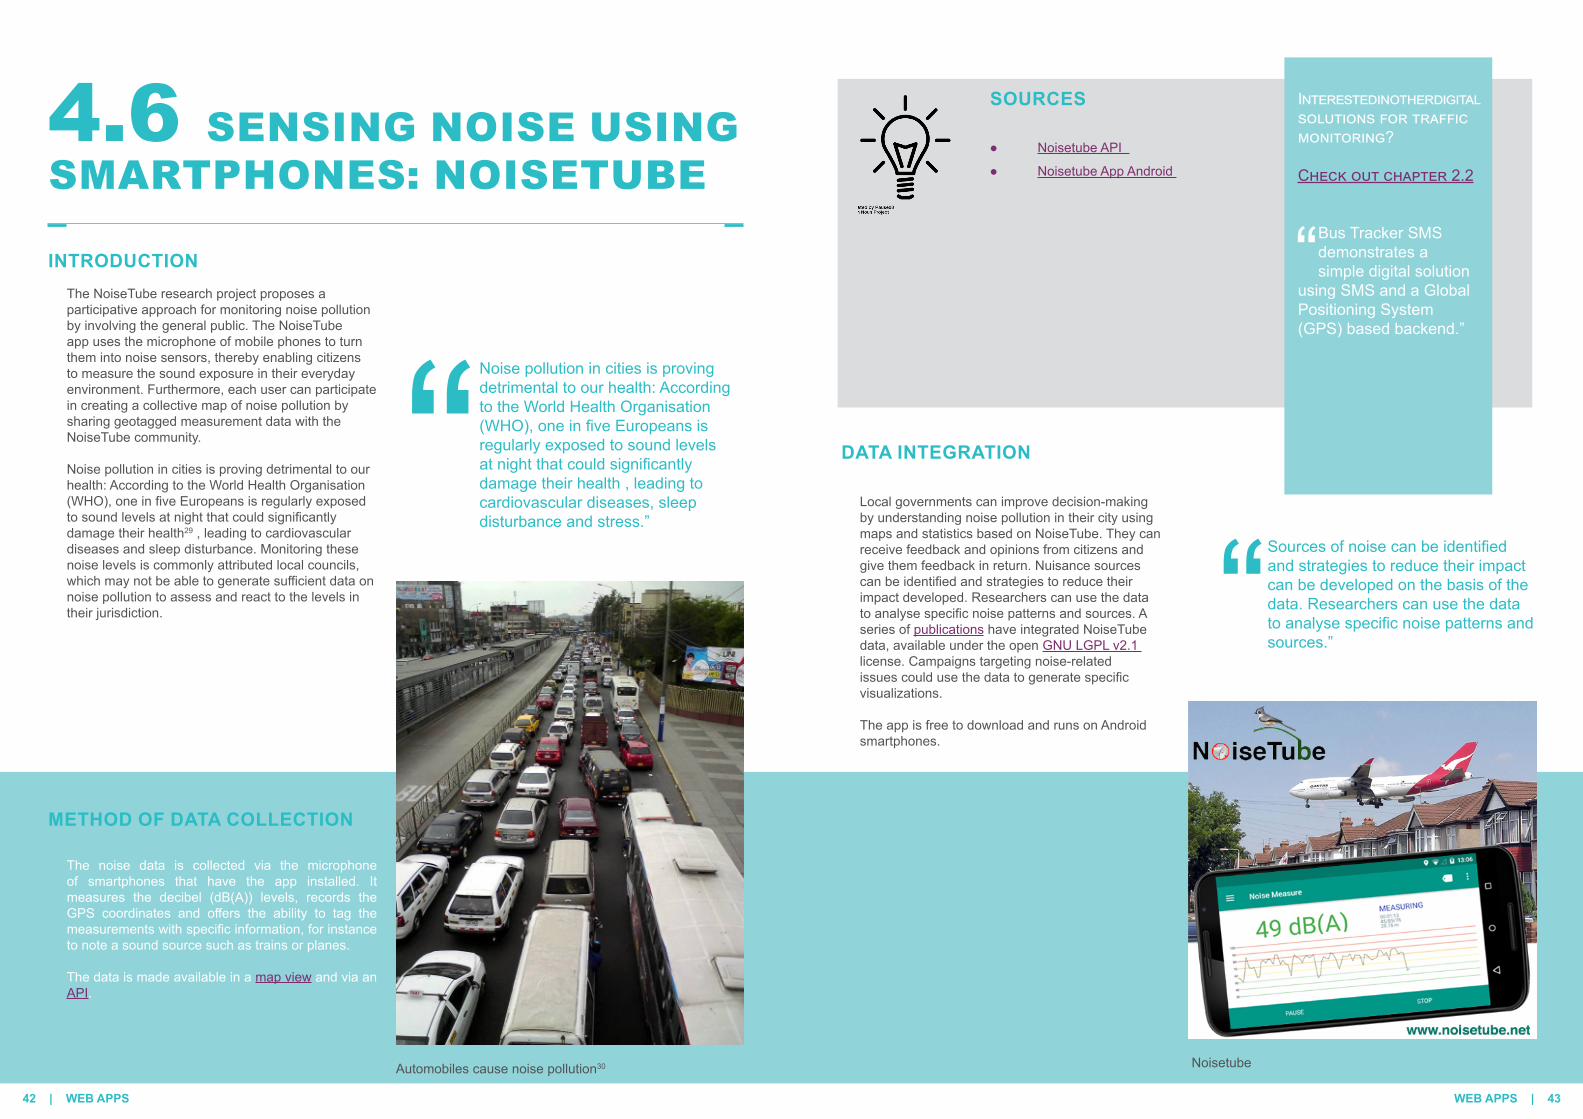
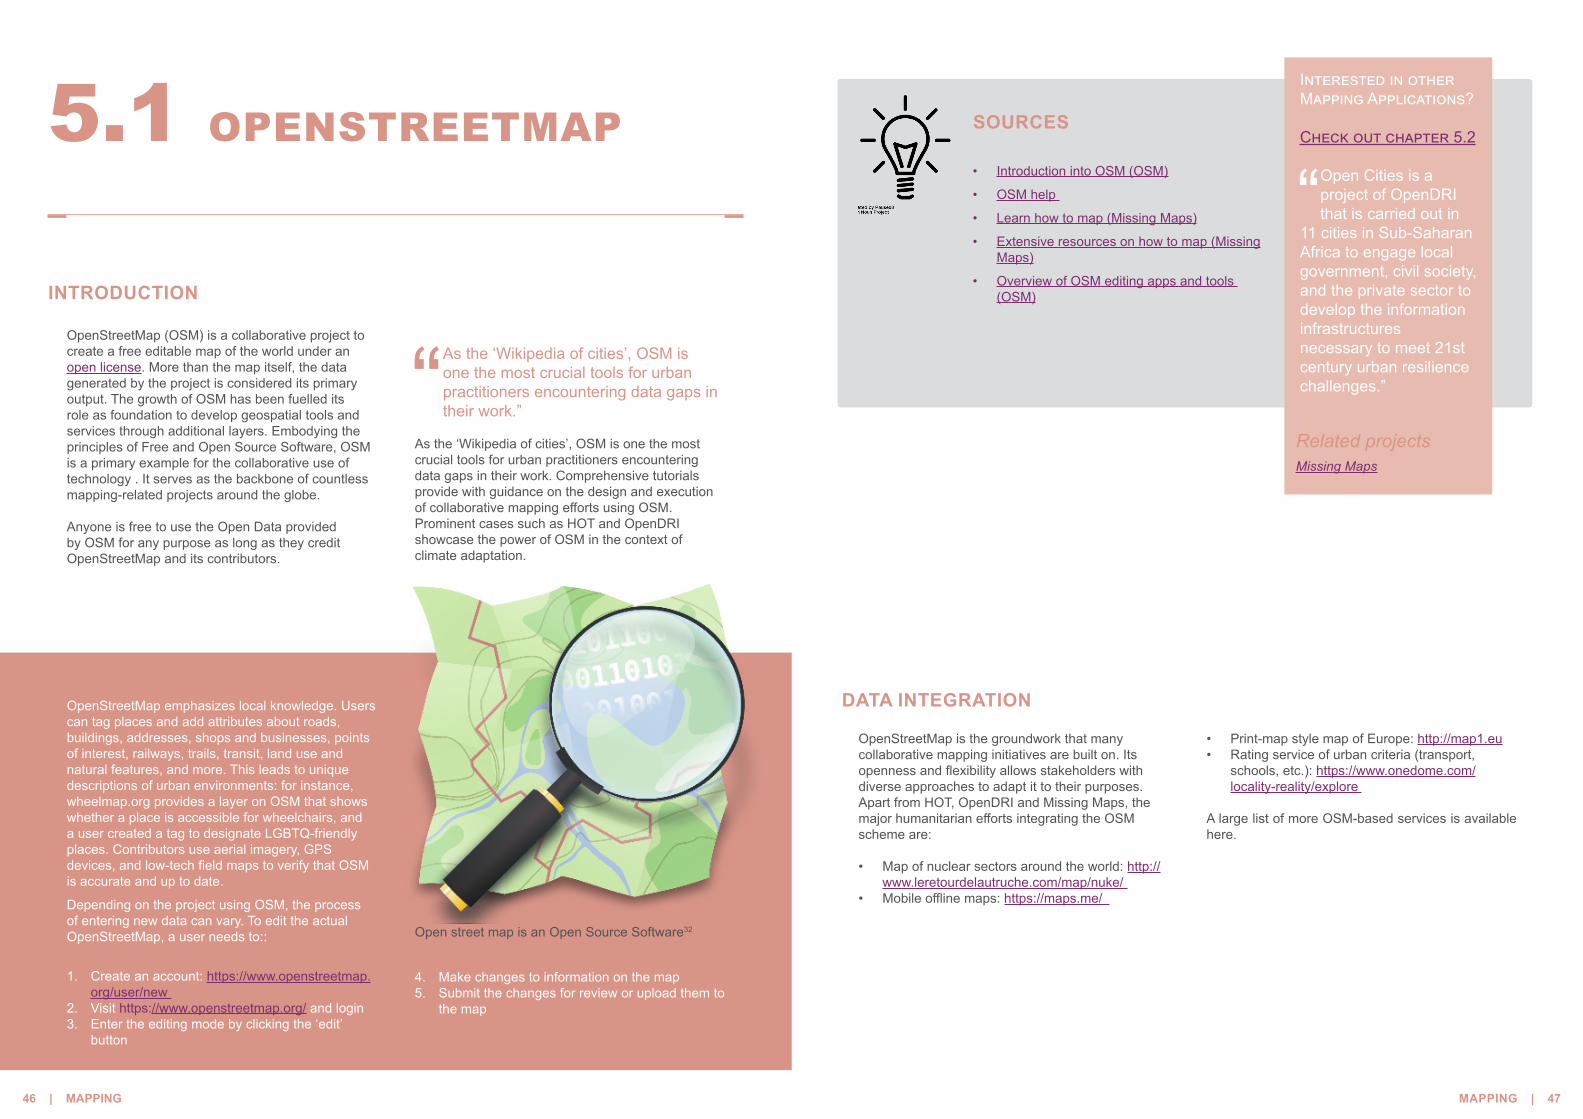
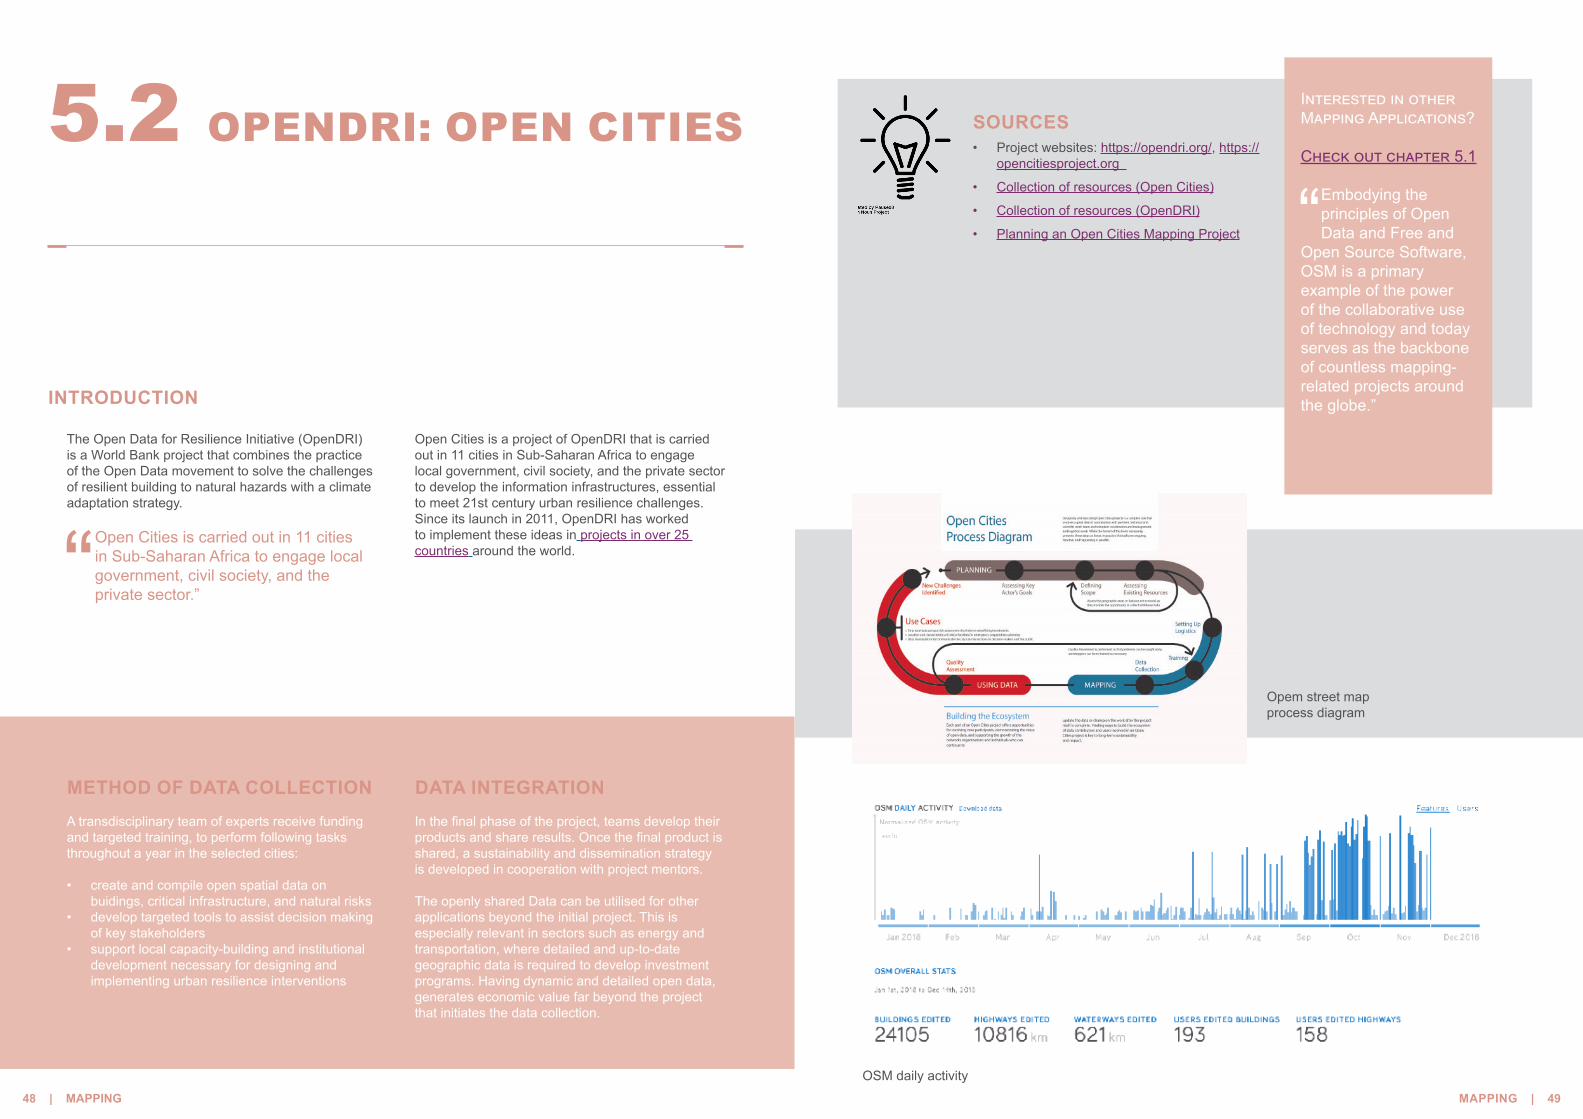
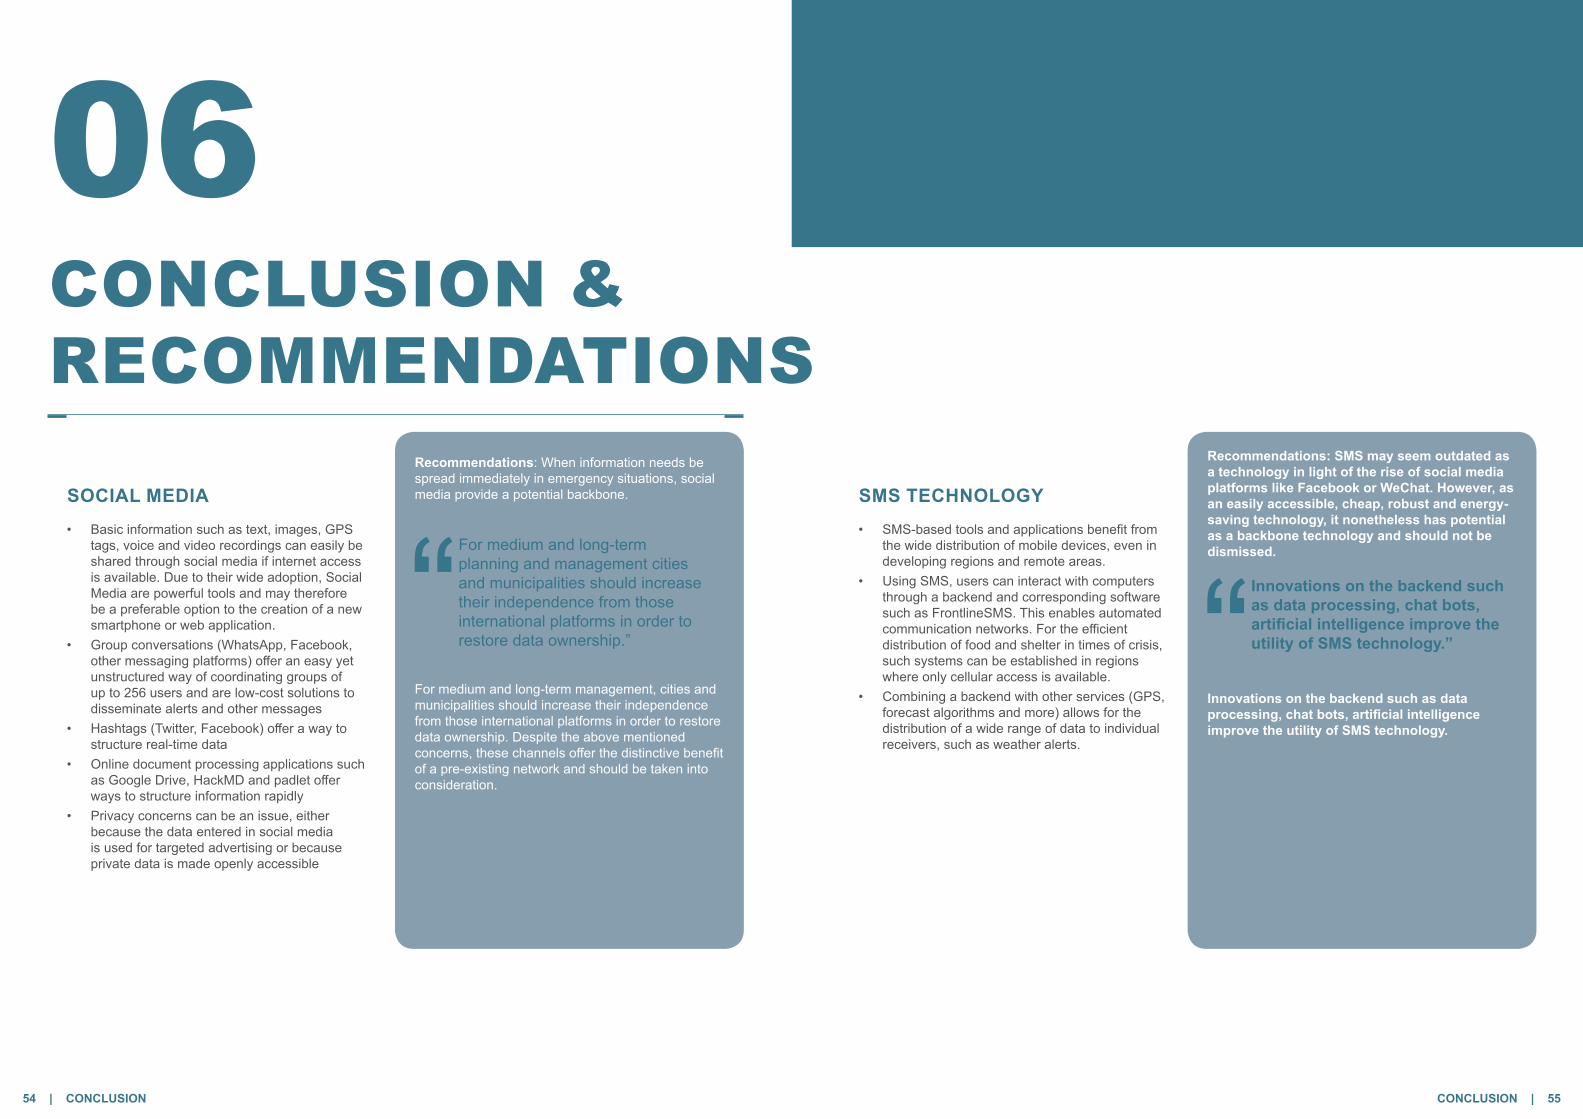
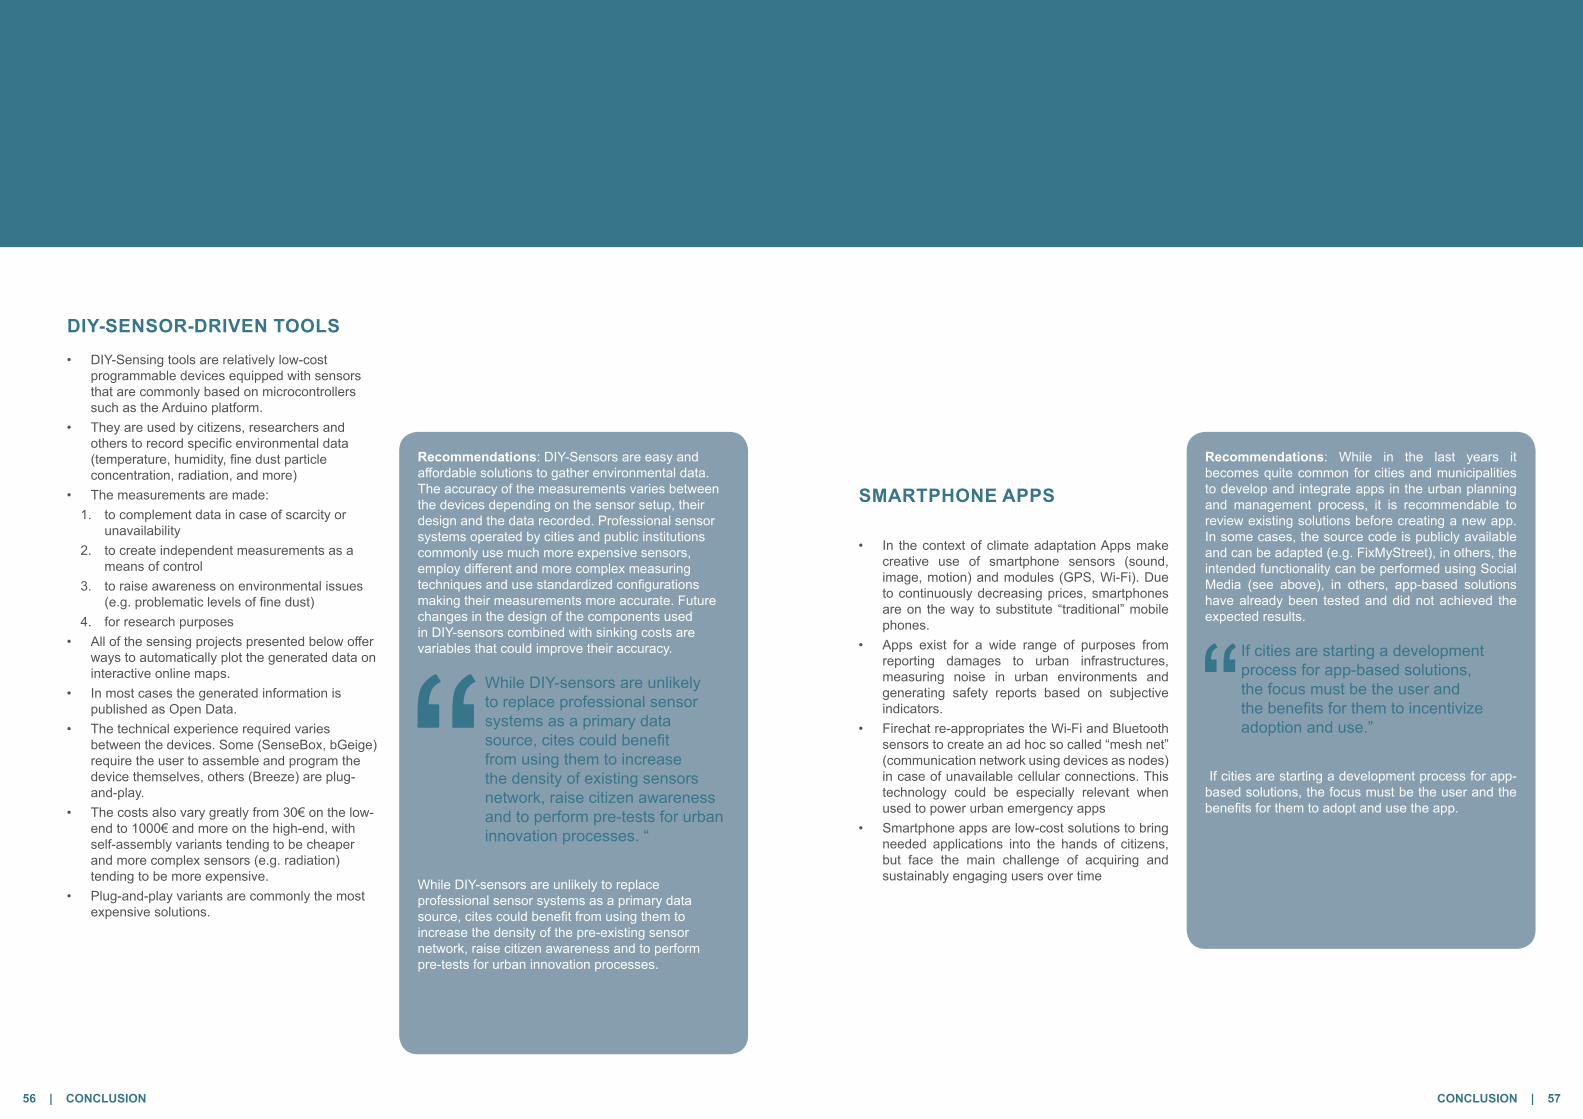
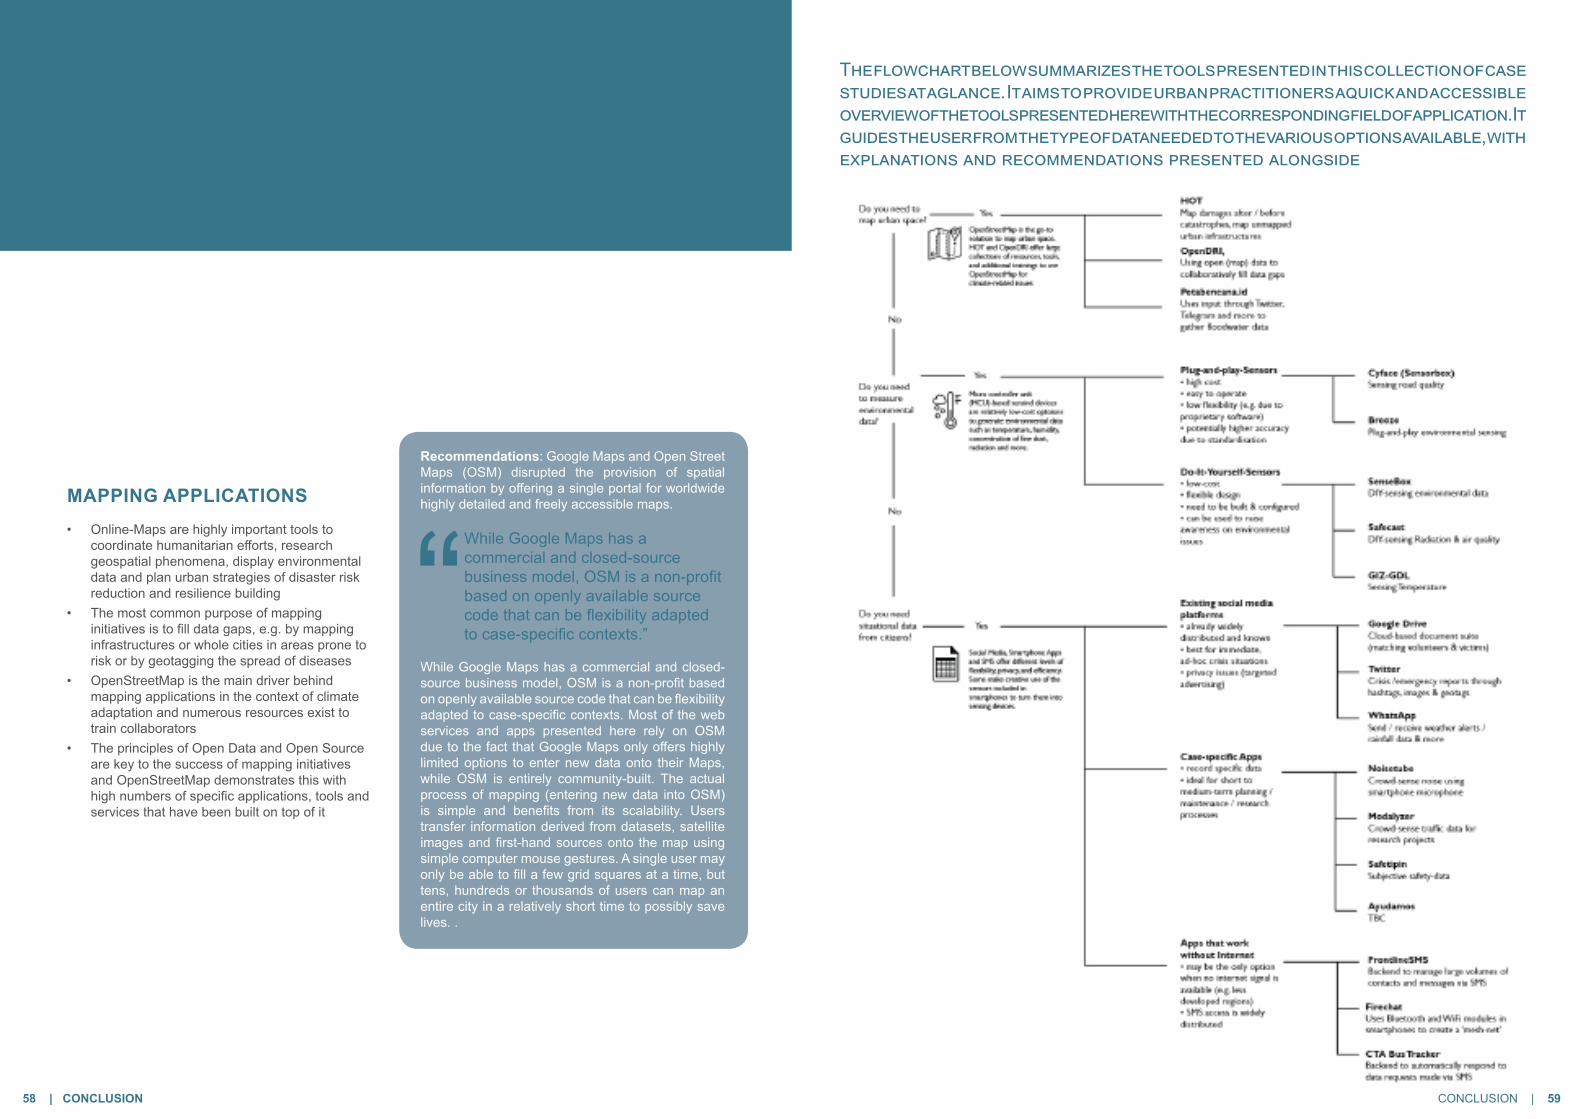