Embed Size (px)
Citation preview

i
Abstract
The populous, fast growing emerging economies of Brazil, China, Egypt, India and
South Africa face daunting challenges on the energy, environment and climate change
fronts. These five countries accounted for 42 per cent of the global population in 2008,
but had only 26 per cent of global energy supply. Brazil, China, Egypt and India have
per capita incomes below the global average even in PPP terms; only South Africa has
a higher income than the global average. Per capita income grew between 1990 and
2008 at 9.1 per cent in China, 4.7 per cent in India and 2.5 per cent in Egypt. However,
in Brazil and South Africa, per capita incomes grew at below the world average. CO2
emissions per unit of energy are lowest for Brazil, way below the global average,
reflecting the significant role of hydropower and ethanol in its energy use. China’s
energy mix is more CO2 emitting than the global average. The other three countries are
around the global average. There is pressure on them to contain their emissions. For
this reason, the use of renewable energy sources becomes attractive. This will also help
these countries reduce their dependence on energy imports. The paper synthesizes the
progress and policies in promoting renewable and clean energy in these counties based
on country case studies.
____________________
JEL Classification: Q41, Q42, Q48.
Keywords: Energy, renewable sources, energy policy.
__________________
Disclaimer:
Opinions and recommendations in the paper are exclusively of the author(s) and not of
any other individual or institution including ICRIER.
ii
Executive summary
The Background
The populous, fast growing emerging economies of Brazil, China, Egypt, India and
South Africa face daunting challenges on the energy, environment and climate change
fronts. These five countries accounted for 42 per cent of the global population in 2008,
but had only 26 per cent of global energy supply. Brazil, China, Egypt and India have
per capita incomes below the global average even in PPP terms; only South Africa has
a higher income than the global average. Per capita income grew between 1990 and
2008 at 9.1 per cent in China, 4.7 per cent in India and 2.5 per cent in Egypt. However,
in Brazil and South Africa, per capita incomes grew at below the world average.
Energy consumption in these countries is growing. With economic growth and higher
populations, the demand for energy would be even higher.
Brazil
Forty-six per cent of its primary energy in 2007 was from renewable resources. These
consisted of hydropower (15 per cent), sugarcane (16 per cent), wood and charcoal (12
per cent) and other renewables (3 per cent). Further, 80 per cent of Brazil’s electricity is
generated by hydropower. Besides developing its hydropower potential, Brazil’s
strategy for clean and renewable energy focuses on ethanol from sugarcane using
baggase for power generation, biodiesel from edible oils (mainly soya beans) and the
use of wood and charcoal, mainly for industries.
China
China’s energy policy has three targets: (i) reduce energy intensity of GDP by 20 per
cent over 2006-2010 (ii) increase share of non-hydrocarbon sources to 15 per cent by
2020 and (iii) reduce carbon emission intensity of GDP by 40 to 45 per cent over 2005-
2020. Given that more than 90 per cent of energy came from hydrocarbons in 2008, of
which coal – much of it high sulphur coal – was 69 per cent, this is a daunting
challenge. China has not reached its extremely ambitious first goal. As regards the
second objective, in 2008, China’s clean energy consumption, including that from
hydropower plants, was 282.59 Mtce, which accounted for 9.9 per cent of the total.
China has invested heavily in renewable technologies and has become a global leader.
Egypt
To bridge the energy resource gap by 2025 Egypt needs to find 60 tcf of additional gas
reserves by 2025, have 25 per cent of its energy from clean alternatives of which 10 per
cent should be from nuclear power plants, 5 per cent from solar power plants and other
sources and 10 per cent from wind and hydro power plants.
iii
India
India’s energy problems arise from meagre oil and gas resources, small wind power
potential, limited resources of hydropower and scarcity of land and water. India has a
vigorous programme of improving energy efficiency and rapidly developing various
renewables such as wind, bio-fuels, mini hydro and solar. The National Solar Mission
aims to achieve parity for solar power with coal-based thermal power by the year 2030,
and interim grid parity by 2020. India also aims to reduce its emission efficiency by 20
to 25 % by 2020 compared to 2005.
South Africa
South Africa has no oil, little gas and low hydro potential. It is largely dependent on
coal with 200 years worth of reserves. In 2008, 71 per cent of energy supply was from
coal, 13 per cent from oil, 3 per cent from gas, 2.5 per cent from nuclear and 10 per
cent from combustible renewables. It produced 268 mt of coal in 2007 of which 25 per
cent was exported and 53 per cent was used for power generation. Despite its plentiful
access to wind and solar energy, South Africa has concentrated on fossil fuel
development since renewable energy is more expensive to harness. However, given the
growing threat of climate change and the growing scarcity of fossil fuels, these
resources have to be “embraced”, howsoever “reluctantly”.
Need for Cleaner and Renewable Energy
CO2 emissions per unit of energy are lowest for Brazil, way below the global average,
reflecting the significant role of hydropower and ethanol in its energy use. China’s
energy mix is more CO2 emitting than the global average. The other three countries are
around the global average. Also, these countries are responsible for only a small
fraction of Green House Gas (GHG) accumulation in the atmosphere. Over 1900-2005
Brazil contributed 1.2% to global emissions, China 14.8%, Egypt 0.5%, India 3.9% and
South Africa 1.3%. However, their emissions in future, if left uncontrolled, can be
substantial. Thus, there is pressure on them to contain their emissions. For this, the use
of renewable energy sources becomes attractive. This will also help these countries
reduce their dependence on energy imports.
These countries have promoted programmes consistent with their natural resources.
While China, India and South Africa are largely dependent on coal, Brazil uses a lot of
hydropower and ethanol from sugarcane. Egypt uses mainly oil and gas but is running
out of these. The dependence on imports for oil and energy resources in general is
significant for these countries. Brazil launched its ethanol programme in the 1970s
when its oil import bill rose dramatically. Egypt has been a net exporter of oil but fears
that it will soon need to import oil. Thus, all these countries have their own
compulsions to push for the development of renewable and cleaner sources of energy.
iv
Energy Efficiency: The Cleanest Energy
Energy efficiency is the cleanest energy. A “Negawatt” is much more than a
“Megawatt”. An important way to promote energy efficiency is to have a competitive
energy sector where prices of different fuels and forms of energy reflect their
opportunity costs. This, however, is not easy since these countries have a large
percentage of people who are too poor to be able to afford to pay the full cost of
energy. Thus, in South Africa, full marginal cost pricing for electricity connections will
imply that the poor will be pushed out of the market.
Energy is a merit good up to a point and subsidising a certain minimum level of
consumption is justifiable. Thus, society should bear the cost of connecting poor
households to power grids. Similarly, providing clean cooking fuel has many societal
benefits and should be subsidised. The important issue here is how to effectively target
subsidy to the needy and contain the subsidy bill. The countries have used various
measures to promote energy efficiency in specific uses, lighting, appliances, industry,
transport and buildings.
Promoting Renewable Energy
Many renewable energy sources today cost more and to promote them, countries have
used different policies to provide subsides. For example, Brazil has mandated blending
petrol with ethanol and charging consumers the full cost of the blended product. India
has used feed-in tariff, renewable portfolio standards and capital subsidies. China has
used various fuel incentives, tax concessions, differential pricing and investment
subsidies for energy efficient products. We discuss below the issues involved in the
development of various renewable and clean energy options.
Hydro Power
Hydroelectric schemes with storage reservoirs provide flexible on-demand power,
which can play a very important role in balancing wind and solar power in the grid. Yet
storage reservoirs submerge land, often forests, and displace people. Nonetheless,
storage of water and transport across space and time are critically important for large
countries where water resources are concentrated geographically and temporally. Of
course, one should optimise the storage strategy through ground water recharge, small
dams, ponds, or large reservoirs. All of them have a role to play. The savings in net
GHG emissions for hydropower varies from project to project and may be negative in
some cases. Of course, countries still may want to build storage reservoirs for water for
cities and for irrigation.
Wind Power
Wind power requires marginal support as feed-in-tariff and can be set up quickly. The
main problems are limited availability of wind resources and its low plant load factor.
v
Thus, in India, the full development of its wind power potential of 100000 MW can
supply no more energy than 30000 MW of coal based power plant. Nonetheless, the
available potential should be exploited.
Solar Power
These countries have large potential for solar energy and it is a major long-term option.
The main difficulty is its high cost. However, costs are coming down and India’s solar
mission targets it to be coal competitive by 2020. To reach this, however, requires
setting a target to reach a certain scale to reap economies of scale, providing subsides in
the interim, in ways that encourage competition, cost- reduction and innovation. The
reverse bidding process used in India, where suppliers bid for subsidy required in the
form of feed-in-tariff for solar power projects, is one way to have market determined
level of subsidy. Another way is to stipulate renewable portfolio standards to create a
competitive market for different forms of renewables.
Absorbing Renewable Electricity
Wind and solar electricity are not available on demand. While solar power availability
is predictable, that of wind power is much less so; hence, large-scale absorption of wind
and solar power would require balancing power from hydro plants, pumped storage
schemes, gas turbines, etc and a ‘smart’ grid. The level of ‘smartness’, however, will
depend on particular situations.
Renewable Energy for transport
While electricity will replace some of the liquid fuel required for transport, renewable
options need to be developed. Brazil’s programme of ethanol, based on sugarcane, and
bio diesel, based on soybeans, has been a great success. However, the resources of land
and water that Brazil has are not available to others. Second-generation ethanol based
on cellulosic material, agricultural wastes and specially grown grasses can be an
important option in future; at present, the technology is not economically viable.
To Sum Up
These studies do show that significant potential exists for renewable energy. It will,
however, take time and these countries need global environmental space to develop in
the meanwhile. Successful development of renewable resources requires targeted
policies. These have to be designed carefully to promote cost reduction and innovation.

vi
Contents
Abstract ...................................................................................................................... i
Executive summary ........................................................................................................ ii
Acknowledgement ....................................................................................................... viii
1. Introduction .............................................................................................................. 1
2. Energy mix ................................................................................................................ 3
3. Approaches followed to develop renewable energy .............................................. 4
3.1. Brazil ................................................................................................................. 4
3.2. China ................................................................................................................. 6
3.3. Egypt ................................................................................................................. 8
3.4. India .................................................................................................................. 8
3.5. South Africa .................................................................................................... 14
4. Insights from the case studies................................................................................ 15
5. Promoting clean and renewable energy ............................................................... 19
6. Concluding comments ............................................................................................ 22
References ................................................................................................................... 23
vii
List of Tables
Table 1: Population, Gross Domestic Product (GDP), Total Primary Energy Supply (TPES) and
CO2 Intensities ............................................................................................................... 1
Table 2: CO2 Emissions, Total, Per Capita and Cumulative from 1900-2005 ............................. 2
Table 3: Total Primary Energy Supply and Percentage Share of Sources for 2008 ..................... 3
Table 4: Net Imports in 2008 as Percentage of Supply ................................................................ 3
Table 5: Clean Energy Production in China in 2008 .................................................................... 6
Table 6: India's Energy Need Projections by IEA and ECOIEP .................................................. 9
Table 7: Energy intensity in 2007 (kgoe/1990 US$ value added) .............................................. 13
Table 8: Rating and Characteristics of a 1.5 ton Air-conditioner (used 4 hours a day) .............. 17
Table 9: Present Discounted Value in Rupees of Saving over No Star Model over 5 years at
Discount rates of 10 % and 15 % ................................................................................. 18

viii
Acknowledgement
The paper draws on the five country studies, presented in Dialogue III: Energy,
Environment, and Climate Change of the ICRIER-IDRC emerging economies research
dialogue, “Emerging Economies in the New World Order: Promises, Pitfalls, and
Priorities,” 12-13 April 2010, New Delhi.
Fig, David. 2010. Reluctant Embrace: South Africa and Renewable Energy.
Moreira, Jose. 2010. Brazilian Perspectives on Development of Clean Energy.
Sawhney, Aparna, and Meeta Mehra. 2010. Indian Perspective on Clean Energy and
Energy Efficiency.
Selim, Tarek H. 2010. Towards a New Energy and Environment Policy for Egypt:
Development of Clean Sources in an Emerging Economy.
Shixian, Gao. 2010. China‘s Energy: Present Situation and Policies.
.
1
Approaches to the Development of Renewable and Clean Energy in Brazil,
China, Egypt, India and South Africa: Lessons for Emerging Countries
Kirit S. Parikh*
1. Introduction
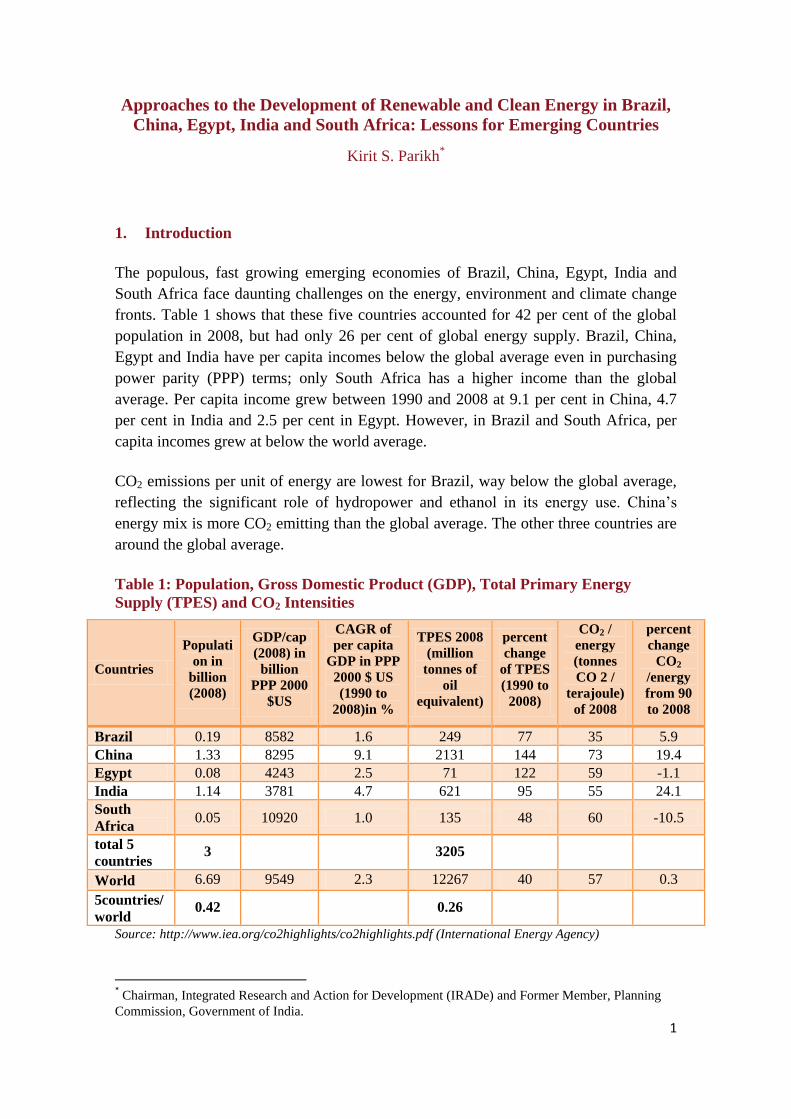
The populous, fast growing emerging economies of Brazil, China, Egypt, India and
South Africa face daunting challenges on the energy, environment and climate change
fronts. Table 1 shows that these five countries accounted for 42 per cent of the global
population in 2008, but had only 26 per cent of global energy supply. Brazil, China,
Egypt and India have per capita incomes below the global average even in purchasing
power parity (PPP) terms; only South Africa has a higher income than the global
average. Per capita income grew between 1990 and 2008 at 9.1 per cent in China, 4.7
per cent in India and 2.5 per cent in Egypt. However, in Brazil and South Africa, per
capita incomes grew at below the world average.
CO2 emissions per unit of energy are lowest for Brazil, way below the global average,
reflecting the significant role of hydropower and ethanol in its energy use. China’s
energy mix is more CO2 emitting than the global average. The other three countries are
around the global average.
Table 1: Population, Gross Domestic Product (GDP), Total Primary Energy
Supply (TPES) and CO2 Intensities
Countries
Populati
on in
billion
(2008)
GDP/cap
(2008) in
billion
PPP 2000
$US
CAGR of
per capita
GDP in PPP
2000 $ US
(1990 to
2008)in %
TPES 2008
(million
tonnes of
oil
equivalent)
percent
change
of TPES
(1990 to
2008)
CO2 /
energy
(tonnes
CO 2 /
terajoule)
of 2008
percent
change
CO2
/energy
from 90
to 2008
Brazil 0.19 8582 1.6 249 77 35 5.9
China 1.33 8295 9.1 2131 144 73 19.4
Egypt 0.08 4243 2.5 71 122 59 -1.1
India 1.14 3781 4.7 621 95 55 24.1
South
Africa 0.05 10920 1.0 135 48 60 -10.5
total 5
countries 3 3205
World 6.69 9549 2.3 12267 40 57 0.3
5countries/
world 0.42 0.26
Source: http://www.iea.org/co2highlights/co2highlights.pdf (International Energy Agency)
* Chairman, Integrated Research and Action for Development (IRADe) and Former Member, Planning
Commission, Government of India.
2
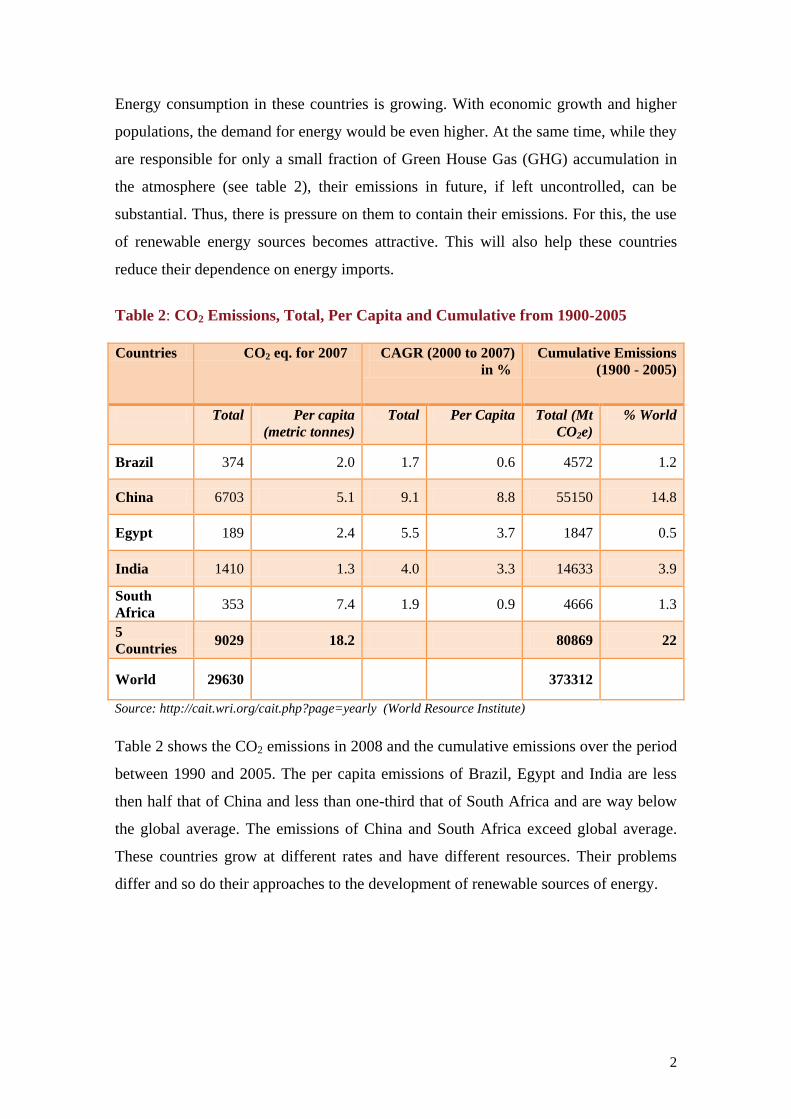
Energy consumption in these countries is growing. With economic growth and higher
populations, the demand for energy would be even higher. At the same time, while they
are responsible for only a small fraction of Green House Gas (GHG) accumulation in
the atmosphere (see table 2), their emissions in future, if left uncontrolled, can be
substantial. Thus, there is pressure on them to contain their emissions. For this, the use
of renewable energy sources becomes attractive. This will also help these countries
reduce their dependence on energy imports.
Table 2: CO2 Emissions, Total, Per Capita and Cumulative from 1900-2005
Countries CO2 eq. for 2007 CAGR (2000 to 2007)
in %
Cumulative Emissions
(1900 - 2005)
Total Per capita
(metric tonnes)
Total Per Capita Total (Mt
CO2e)
% World
Brazil 374 2.0 1.7 0.6 4572 1.2
China 6703 5.1 9.1 8.8 55150 14.8
Egypt 189 2.4 5.5 3.7 1847 0.5
India 1410 1.3 4.0 3.3 14633 3.9
South
Africa 353 7.4 1.9 0.9 4666 1.3
5
Countries 9029 18.2 80869 22
World 29630 373312
Source: http://cait.wri.org/cait.php?page=yearly (World Resource Institute)
Table 2 shows the CO2 emissions in 2008 and the cumulative emissions over the period
between 1990 and 2005. The per capita emissions of Brazil, Egypt and India are less
then half that of China and less than one-third that of South Africa and are way below
the global average. The emissions of China and South Africa exceed global average.
These countries grow at different rates and have different resources. Their problems
differ and so do their approaches to the development of renewable sources of energy.
3
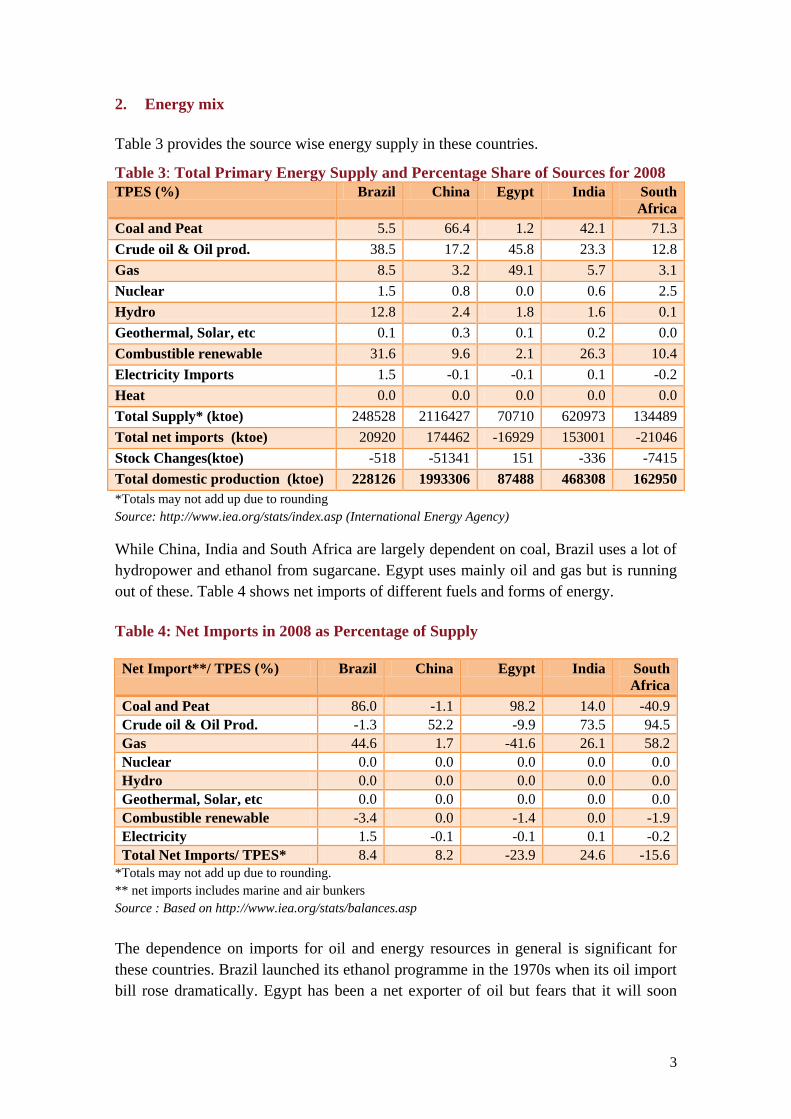
2. Energy mix
Table 3 provides the source wise energy supply in these countries.
Table 3: Total Primary Energy Supply and Percentage Share of Sources for 2008
TPES (%) Brazil China Egypt India South
Africa
Coal and Peat 5.5 66.4 1.2 42.1 71.3
Crude oil & Oil prod. 38.5 17.2 45.8 23.3 12.8
Gas 8.5 3.2 49.1 5.7 3.1
Nuclear 1.5 0.8 0.0 0.6 2.5
Hydro 12.8 2.4 1.8 1.6 0.1
Geothermal, Solar, etc 0.1 0.3 0.1 0.2 0.0
Combustible renewable 31.6 9.6 2.1 26.3 10.4
Electricity Imports 1.5 -0.1 -0.1 0.1 -0.2
Heat 0.0 0.0 0.0 0.0 0.0
Total Supply* (ktoe) 248528 2116427 70710 620973 134489
Total net imports (ktoe) 20920 174462 -16929 153001 -21046
Stock Changes(ktoe) -518 -51341 151 -336 -7415
Total domestic production (ktoe) 228126 1993306 87488 468308 162950
*Totals may not add up due to rounding
Source: http://www.iea.org/stats/index.asp (International Energy Agency)
While China, India and South Africa are largely dependent on coal, Brazil uses a lot of
hydropower and ethanol from sugarcane. Egypt uses mainly oil and gas but is running
out of these. Table 4 shows net imports of different fuels and forms of energy.
Table 4: Net Imports in 2008 as Percentage of Supply
Net Import**/ TPES (%) Brazil China Egypt India South
Africa
Coal and Peat 86.0 -1.1 98.2 14.0 -40.9
Crude oil & Oil Prod. -1.3 52.2 -9.9 73.5 94.5
Gas 44.6 1.7 -41.6 26.1 58.2
Nuclear 0.0 0.0 0.0 0.0 0.0
Hydro 0.0 0.0 0.0 0.0 0.0
Geothermal, Solar, etc 0.0 0.0 0.0 0.0 0.0
Combustible renewable -3.4 0.0 -1.4 0.0 -1.9
Electricity 1.5 -0.1 -0.1 0.1 -0.2
Total Net Imports/ TPES* 8.4 8.2 -23.9 24.6 -15.6
*Totals may not add up due to rounding.
** net imports includes marine and air bunkers
Source : Based on http://www.iea.org/stats/balances.asp
The dependence on imports for oil and energy resources in general is significant for
these countries. Brazil launched its ethanol programme in the 1970s when its oil import
bill rose dramatically. Egypt has been a net exporter of oil but fears that it will soon

4
need to import oil. Thus, all these countries have their own compulsions to push for the
development of renewable and cleaner sources of energy.
3. Approaches followed to develop renewable energy
The authors of the five country case studies (Moreira, Gao, Selim, Sawney & Mehra
and Fig) have followed different approaches to deal with their perceived problems in
the context of their own resources. There are differences and similarities in their
approaches. We first look at the five countries in turn.
3.1. Brazil
The main points that emerge from Jose Moreira’s (2011) paper, “Brazilian Perspective
on Clean Energy” are summarised below. Brazil has vast land and water resources. Its
strategy for clean and renewable energy, therefore, is based on this advantage. Forty-six
per cent of its primary energy in 2007 was from renewable resources. These consisted
of hydropower (15 per cent), sugarcane (16 per cent), wood and charcoal (12 per cent)
and other renewables (3 per cent). Further, 80 per cent of Brazil’s electricity is
generated by hydropower. Besides developing its hydropower potential, Brazil’s
strategy for clean and renewable energy focuses on ethanol from sugarcane using
baggase for power generation, biodiesel from edible oils (mainly soya beans) and the
use of wood and charcoal, mainly for industries. Half of the wood comes from special
wood plantations. Improved energy efficiency, of course, is a major option. To the
extent that quantity of wood extracted from natural forests exceeds natural growth and
leads to deforestation, it cannot be considered renewable energy.
Ethanol
The ethanol programme, based on sugarcane, started in 1975 and has seen dramatic
growth. The growth rate of ethanol production has fluctuated a lot. It was 37 per cent a
year during 1976-1986, 1.6 per cent a year from 1986-1999, -4.2 per cent a year
between 1999 and 2003, but 13.5 per cent a year from 2003 to 2008. These fluctuations
resulted from government policies, international oil prices and international sugar
prices. Brazil promoted ethanol by subsidising producers and mandating blending.
Ethanol price was capped at 59 per cent of gasoline price during 1980-85 and service
stations were required to have one dedicated ethanol pump. That encouraged neat
ethanol cars introduced in the market in 1980. Today, most cars in Brazil are flexi-fuel
cars. Ethanol has over the years replaced gasoline and its production surpassed gasoline
consumption in 2009. The subsidy on ethanol is recovered by charging a higher price
for gasoline so that the burden is on gasoline consumers.
Moreira argues that the ethanol programme has resulted in a net gain to consumers who
have saved billions of dollars over the years as competition from ethanol led to lower
gasoline prices when price was freed from government control. The ethanol programme
5
has also helped improve the country’s balance of payments and reduced the debt
burden. Sugarcane plantations covered 7.8 Mha (million hectares) in 2008 and are
expected to cover 14Mha by 2039. The cumulative GHG saving from ethanol is
estimated to be 820 tonnes of CO2 per hectare over 35 years.
Biodiesel
Brazil launched its biodiesel programme in 2005 based on soya oil. Since vegetable oil
crops were already available, the growth in biodiesel has been a phenomenal 13.5 per
cent a month from January 2006 to March 2009. Soya bean production reached nearly
60 Mt in 2006-07. At present, there is compulsory blending of 2 per cent, which will be
raised to 5 per cent by 2013. Biodiesel demand reached 2.24 million m3 in 2010. The
net gain in terms of GHG emissions from biodiesel based on soya beans is not clear.
When the land use change (LUC) and induced land use change (ILUC) are accounted
for, at least for the USA, it was found that biodiesel emissions would be 4 per cent
higher than from the use of diesel oil. For Brazil’s sugarcane-based ethanol programme,
GHG emissions including LUC and ILUC would be less than that from the gasoline
replaced.
Charcoal:
Brazil used some 9.5 Mt (million tonnes) of charcoal in 2008, of which industry
accounted for some 7.5 Mt, households for around one Mt and other energy use around
one Mt. Charcoal in Brazil is not a fully renewable product as nearly half of it was
produced from native vegetation in 2004.
Hydro Energy
In 2008, Brazil generated around 470 GWhr of electricity, imported 45 GWhr from the
Itaipu plant owned by Paraguay and consumed around 430 Gwhr, after accounting for
losses. Hydro electricity provided 79 per cent of total electricity supply. In 2009, the
installed capacity of hydro plants was 81,669 MW out of a total installed generating
capacity of 107188 MW. With 11,780 MW under construction, some 41,100 MW of
hydro capacity addition is expected by 2017. Despite this, the share of hydro will come
down to 70 per cent. The environmental and social barriers are limiting the growth of
hydro capacity as in India. This has led to an interest in small hydro projects that have
smaller environmental and social problems but also have much lower potential. The
installed capacity of small hydro projects is expected to reach 7700 MW by 2017.
Wind energy
Wind energy potential in Brazil has been assessed at 73,000 MW. The present installed
capacity is around 1 MW and is not projected to be substantial. What is interesting is
that changes in bidding conditions that provided easier access to transmission and
distribution networks have led to substantially increased interest in bidding for wind
power.
6
Energy Efficiency
Energy efficiency is often considered the largest and cleanest energy source. Energy
efficiency programmes have registered modest gains in Brazil. In 2008, it is estimated
to have saved 4.4 GWhr of electricity and 1569 MW of installed capacity. The benefit
cost ratio has been estimated at 20:1. The main problems that impede an improvement
in efficiency are the lack of commercial bank credit and inadequate numbers of energy
service companies (ESCOs).
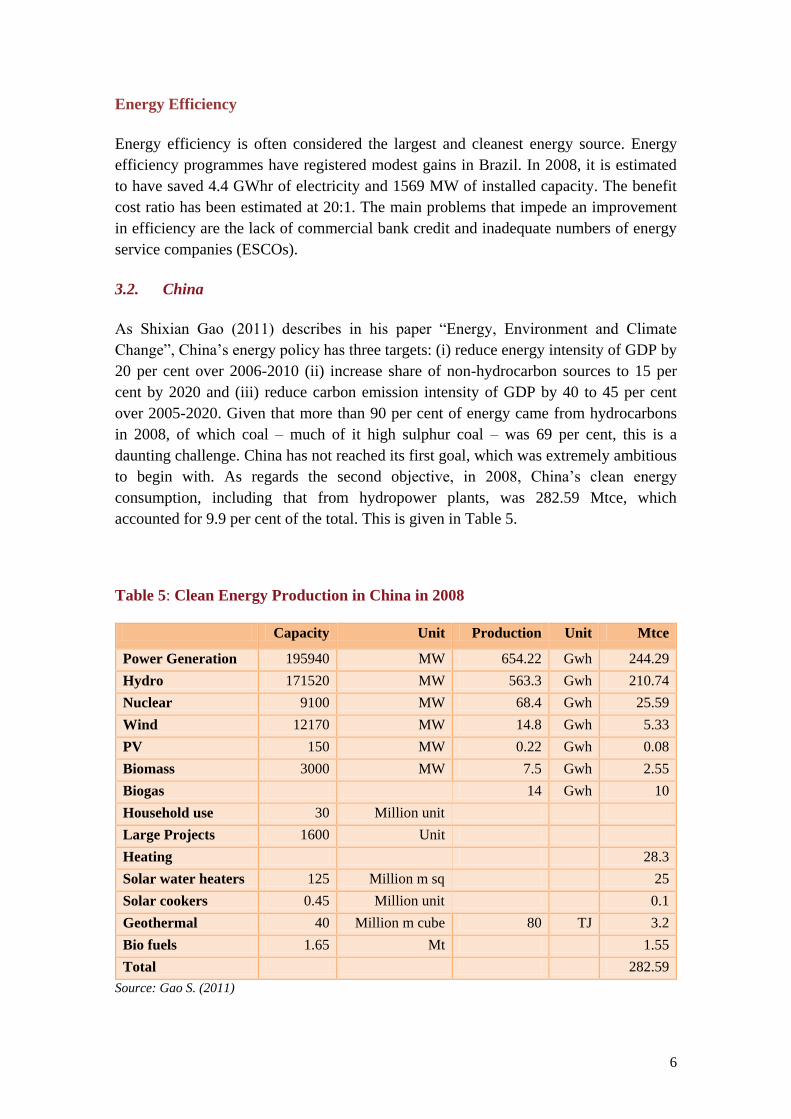
3.2. China
As Shixian Gao (2011) describes in his paper “Energy, Environment and Climate
Change”, China’s energy policy has three targets: (i) reduce energy intensity of GDP by
20 per cent over 2006-2010 (ii) increase share of non-hydrocarbon sources to 15 per
cent by 2020 and (iii) reduce carbon emission intensity of GDP by 40 to 45 per cent
over 2005-2020. Given that more than 90 per cent of energy came from hydrocarbons
in 2008, of which coal – much of it high sulphur coal – was 69 per cent, this is a
daunting challenge. China has not reached its first goal, which was extremely ambitious
to begin with. As regards the second objective, in 2008, China’s clean energy
consumption, including that from hydropower plants, was 282.59 Mtce, which
accounted for 9.9 per cent of the total. This is given in Table 5.
Table 5: Clean Energy Production in China in 2008
Capacity Unit Production Unit Mtce
Power Generation 195940 MW 654.22 Gwh 244.29
Hydro 171520 MW 563.3 Gwh 210.74
Nuclear 9100 MW 68.4 Gwh 25.59
Wind 12170 MW 14.8 Gwh 5.33
PV 150 MW 0.22 Gwh 0.08
Biomass 3000 MW 7.5 Gwh 2.55
Biogas 14 Gwh 10
Household use 30 Million unit
Large Projects 1600 Unit
Heating 28.3
Solar water heaters 125 Million m sq 25
Solar cookers 0.45 Million unit 0.1
Geothermal 40 Million m cube 80 TJ 3.2
Bio fuels 1.65 Mt 1.55
Total 282.59
Source: Gao S. (2011)
7
Hydropower
The hydro capacity has been steadily increasing from 52 GW in 1995 and by 2008,
China had 171.52 GW of hydropower capacity accounting for 21.6 per cent of the
national total. It generated 563 billion kWhr (b kWhr) of electricity from hydro plants.
Nuclear power
The installed nuclear power capacity was 9.1 GW in 2008 and generation was 68.4
billion KWhr. In 1995, they were 2 GW and 13 bkWhr respectively.
Wind power
China’s wind power capacity grew at 56.1 per cent per year from 344 MW in 2000 to
12170 MW in 2008.
Solar
China has built up capacity to manufacture 2 GW of Photo Voltaic (PV) cells a year;
however, much of the PV cells are exported and its domestic installed capacity was
only 150 MW in 2009. Solar water heaters are widely used in China and 125 million m2
of collectors are installed. Its manufacturing capacity is 25 million m2 per year.
Biomass
Thirty million biogas units produce 13 billion m3 of biogas for 80 million rural persons
for household use. Biogas for industrial use is just beginning and, in 2008, biogas
production was only 1.55 Mtce. To reach its third target by 2020, the installed capacity
of hydropower, wind power, nuclear power and biomass power are expected to be 340
GW, 120 GW, 70-80 GW and 40 GW respectively.
Energy efficiency
The elasticity of energy consumption with respect to GDP in China over 2006-2008
was 0.65. In most energy intensive products, specific energy per unit of output
decreased over 2005 to 2007. The highest reductions were in plate glass (22.73 per
cent), steel smelters (21.79 per cent) and coal production (10.11 per cent).
For promoting energy efficiency, China provides various fiscal incentives, tax
concessions, differential pricing, investment subsidies for energy efficient products etc.
It plans to concentrate on high energy-intensive sectors and promote the substitution of
less energy efficient equipment and fuels with more efficient ones, waste heat recovery,
combined heat and power, efficient lighting, efficient buildings, technical service
organizations and government institutions for saving energy.
8
3.3. Egypt
Tarek Selim (2011) in his paper “Towards a New Energy and Environment Policy for
Egypt: Development of Clean Sources in an Emerging Economy” describes Egypt’s
concerns and approach. Egypt’s energy problem is different from that of other
emerging economies. It has been an oil exporter with oil exports providing 40 per cent
of its export earnings. Oil production has been decreasing over the past decade. Egypt
became a net importer of oil in 2008. In 2025, oil imports may reach 57000 barrels a
day (about 29 million tonnes per year). Fortunately, large gas reserves have been found
and gas production has doubled between 1999 and 2003. In 2005, it was 1000 times
more than in 1985.
The Egyptian economy has shifted from oil to gas and Egypt ranked third in the world
in natural gas consumption with a daily consumption of 2.6 billion cubic feet (bcf). Of
the total electricity generated in Egypt, 88 per cent is based on natural gas while the
remaining 12 per cent is hydro electricity from the Aswan high dam. The total installed
capacity in 2008 was 23 GWe. Selim argues that Egypt should find 60 tcf of additional
gas reserves by 2025, increase gas production and have a gas export target of 18 bcf/d
by 2025. Egypt does not have a single commercial nuclear power plant. However,
Selim suggests that Egypt should commission 4GWe by 2030 and 7GWe by 2050 of
nuclear power based on light water reactors (LWRs). Despite being the home of the
Sun god Ra and despite a history of Pharaohs using solar energy for heating thousands
of years ago, solar energy is used very little is Egypt. Subsidised oil and gas make solar
water heaters even less attractive.
According to Selim, to reach energy sustainability and bridge the energy resource gap
by 2025, Egypt needs to have 25 per cent of its energy from clean alternatives of which
10 per cent should be from nuclear power plants, 5 per cent from solar power plants
and other sources and 10 per cent from wind and hydro power plants.
3.4. India
Aparna Sawhney and Meeta Mehra (2011) offer an Indian perspective on clean energy
and energy efficiency. They have used projections by the IEA (2008), which are based
on a low growth rate of GDP of 6.3 per cent over 2005-30. The IEA projection of TPES
for 2030 is 1299 Mtoe. Compared to this, the expert committee report on integrated
energy policy, Planning Commission (ECOIEP, 2006), has projected for 2031-32, 1536
to 1887 mtoe for a growth rates of 8 per cent. India’s growth rate over 2005 to 2010 has
exceeded 8 per cent despite the global meltdown of 2008. The 12th
plan’s growth rate
target is 9 per cent to 10 per cent. India can attain these growth rates and sustain them
over some decades just as China, for example, had a growth rate of around 9.5 per cent
over 1980 to 2005. The projections by IEA and by the ECOIEP are summarised in
Table 6. The projected demands for energy by IEA used by Sawhney and Mehra are too
low and do not reflect the Indian perspective.
9
Nevertheless, the discussion on energy efficiency and clean energy options is not
affected by the very low projections of energy needs by IEA.
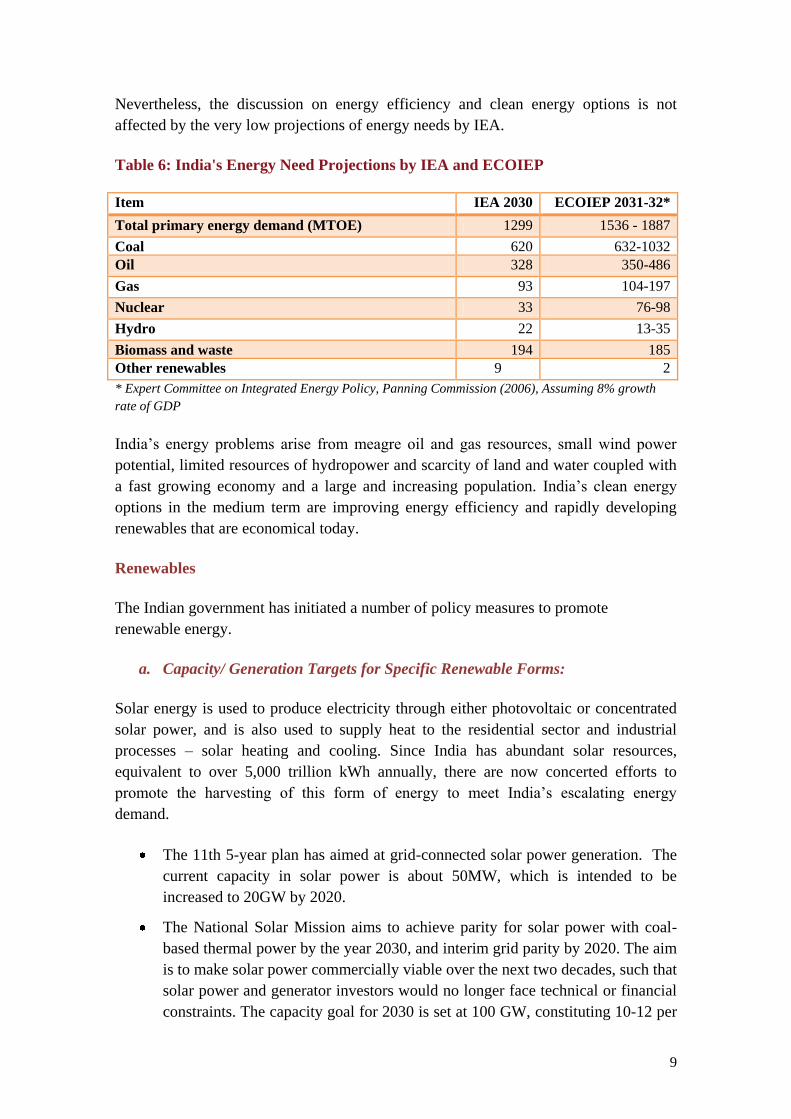
Table 6: India's Energy Need Projections by IEA and ECOIEP
Item IEA 2030 ECOIEP 2031-32*
Total primary energy demand (MTOE) 1299 1536 - 1887
Coal 620 632-1032
Oil 328 350-486
Gas 93 104-197
Nuclear 33 76-98
Hydro 22 13-35
Biomass and waste 194 185
Other renewables 9 2
* Expert Committee on Integrated Energy Policy, Panning Commission (2006), Assuming 8% growth
rate of GDP
India’s energy problems arise from meagre oil and gas resources, small wind power
potential, limited resources of hydropower and scarcity of land and water coupled with
a fast growing economy and a large and increasing population. India’s clean energy
options in the medium term are improving energy efficiency and rapidly developing
renewables that are economical today.
Renewables
The Indian government has initiated a number of policy measures to promote
renewable energy.
a. Capacity/ Generation Targets for Specific Renewable Forms:
Solar energy is used to produce electricity through either photovoltaic or concentrated
solar power, and is also used to supply heat to the residential sector and industrial
processes – solar heating and cooling. Since India has abundant solar resources,
equivalent to over 5,000 trillion kWh annually, there are now concerted efforts to
promote the harvesting of this form of energy to meet India’s escalating energy
demand.
The 11th 5-year plan has aimed at grid-connected solar power generation. The
current capacity in solar power is about 50MW, which is intended to be
increased to 20GW by 2020.
The National Solar Mission aims to achieve parity for solar power with coal-
based thermal power by the year 2030, and interim grid parity by 2020. The aim
is to make solar power commercially viable over the next two decades, such that
solar power and generator investors would no longer face technical or financial
constraints. The capacity goal for 2030 is set at 100 GW, constituting 10-12 per
10
cent of total power generation (and an interim capacity goal of 20GW by 2020,
PMO 2009).
Under the National Solar Mission, the government will support the setting up of
dedicated manufacturing capacity of poly silicon material as well as solar
thermal collectors and receivers. Special Economic Zone-type of incentives
will be offered for the establishment of solar technology manufacturing parks.
There are also plans to establish 60 “solar cities” that would reduce energy demand by
10 per cent with increased renewables and efficiency by 2012. Nagpur and Rajkot have
been identified as two of the first cities under this programme.
Fiscal Incentives for Renewable Energy Investment:
The national and state governments have offered capital investment subsidies of
20 per cent to support solar PV manufacturing in special economic zones.
Generation-Based Incentives (GBI) have been proposed at Rs10/Kwh for the
first three years with reviews in subsequent years under the National Solar
Mission. The GBI would be valid for 20 years (from date of project
commissioning/generation) to ease the burden on utilities from fixed tariffs for
solar power. The GBI will be paid by the central government through state
designated agencies in different states.
Specific capital equipment and project imports will be exempt from customs
and excise duties for solar power. Concessional loans will be given (10-year
loans at 2 per cent interest rate) to off-grid solar PV of 100W to 10kW to
displace diesel generators, UPS and for invertors with solar base.
For wind power projects, incentives include fiscal concessions such as 80 per
cent accelerated depreciation, concessional custom duty for specific critical
components, excise duty exemption, income tax exemption on profits from
power generation, etc. (MNRE 2009).
Demonstration Projects:
The MNRE started a new demonstration programme, permitting utilities,
generation companies and state nodal agencies to set up grid-connected, solar
photovoltaic plants of 25 kWp (kilo watt peak) to 1,000 kWp capacity. For this,
the scheme provides support of 50 per cent of the basic cost of the plant, subject
to a maximum of Rs.10 crore per MWp (available to set up 4 MWp aggregate
capacity projects in the country during the 11th plan period).

11
Preferential Tariffs and Fiscal Incentives for Generation
The National Solar Mission would require mandatory solar power purchase
under RPO (renewable portfolio obligation), may be with 0.25 per cent in Phase
I and increasing to 3 per cent in Phase III.
State Electricity Regulatory Commissions in several states offer preferential
tariff for purchase of power from wind power projects.
A generation-based incentive was initiated in 2007-08 by the Ministry of New
and Renewable Energy to attract a large number of independent wind power
producers (limited to a capacity of 49 MW) who do not avail the benefit of
accelerated depreciation. The investors, apart from getting the tariff as
determined by the respective state regulatory commissions, would get an
incentive of 50 paisa per unit of electricity for a period of 10 years if they do not
claim the benefit of accelerated depreciation. (MNRE 2009).
The fiscal concessions and tax benefits seem to have succeeded in enhancing the
installed capacity of wind power in the country, with over 10 GW installed capacity in
2009. The policies and achievement-specific renewable options are as follows:
Wind power
Wind power is the fastest growing renewable energy source and reached an installed
capacity of 14,158 MW as of March 31, 2011. This has been achieved through capital
subsidies in the form of enhanced depreciation allowance. This is being changed now
into a feed-in tariff mechanism to give incentives to generate wind power as opposed to
merely installing generating capacity.
The total potential for wind power is estimated to be 48,561 MW by MNRE and 65,000
MW by the Wind Power Society of India. In any case, since the plant load factor of
installed wind power capacity is less than 20 per cent on an average, even 65000 MW
would provide no more energy in terms of kWhr of electricity per year than 20000 MW
of coal power plant operating at 70 to 80 per cent plant load factor.
Solar Energy
India views this as a major long-term energy source, renewable or otherwise. As a
result, the national action plan for climate change (NAPCC, 2008), has identified a
national solar mission to develop solar energy in India. The mission’s primary aim is to
make solar electricity cost competitive to coal-based electricity by 2030 and, in the
interim, attain grid parity by 2020. To achieve this, 20,000 MW of solar capacity is to
be created by 2020 and 100,000 MW by 2030 through incentives. This will help
achieve cost reduction through economies of scale and also through competition as
subsidies in the form of feed-in tariff will be given through a competitive bidding

12
process. Firms are required to bid for the feed-in tariff they need and the first auction
has already lowered the feed-in tariff to Rs 13/kWhr from a ceiling of Rs 15. As of
2010, already 700 MW have been allotted.
Further, to promote renewable energy, many state electricity regulatory commissions
(SERCs) have announced a renewable portfolio obligation and the certificates can be
traded, for which power exchanges provide electronic trading platforms.
Apart from solar electricity, solar water heaters are also promoted through a capital
subsidy. As of 2010, some 3 million sq. m of collectors have been installed. A capital
subsidy, however, provides little incentive to reduce costs. Chinese water heaters were
displayed at the Delhi International Renewable Energy Conference (DIREC) at one-
fourth the price of Indian ones.
Other Renewables
Under the Remote Village Electrification Programme in India, 4,250 villages and 1,160
hamlets had been electrified using renewables by 2009. India’s Integrated Rural
Energy Programme, using renewable energy, had served over 300 districts and 2,200
villages by 2006, with additional projects under implementation in over 800 villages
and 700 hamlets in 13 states and union territories (REN21 2009). This is to be viewed
in the context of an estimated 25000 villages categorised as remote villages. Villages
do not want to be classified as a remote village as they all want grid power.
Solar PV applications have increased to more than 435,000 home lighting systems,
700,000 solar lanterns, and 7,000 solar-powered water pumps. India has more than an
estimated 240 million households, 70 per cent of which are in rural areas.
India has had a bio gas programme since the early 1960s (see Parikh K. S., 1963).
While millions of family-sized plants have been installed, evaluation studies show that
only half of them are in use. In any case, if all of the around 15 million families, who
have enough cattle to run a family-sized biogas plant, install a plant and if all these
function, they would provide around 6 Mtoe of energy per year at most.
Energy efficiency
India’s energy intensity in terms of Kgoe/$ GDP is better than most countries (see
Table 7). Yet, there is scope for further improvement.
13
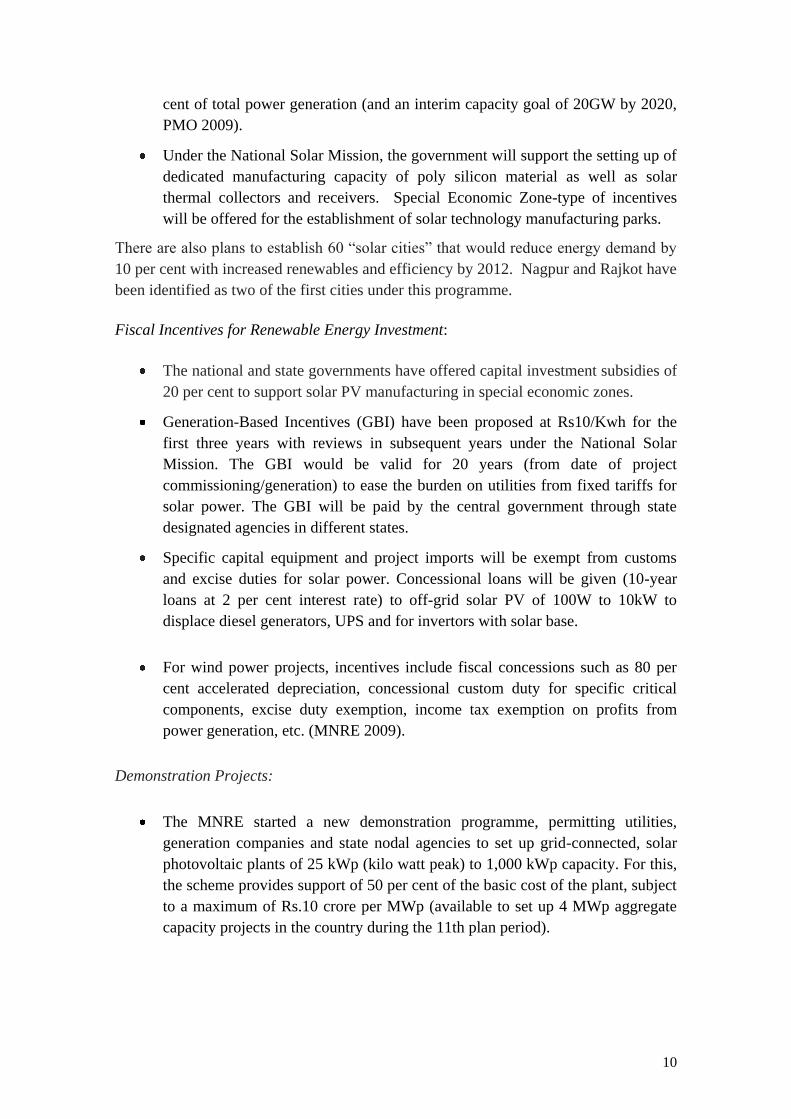
Table 7: Energy intensity in 2007 (kgoe/1990 US$ value added)
Country or
area
Total Agriculture Industry Transport Commercial
& others
Total
(kgoe/
capita)
Australia 0.15 0.14 0.20 0.44 0.02 3641
Brazil 0.25 0.10 0.30 1.40 0.03 998
China, People's
Republic of 0.58 0.21 0.48 1.26 0.07 956
Germany 0.11 0.11 0.08 0.33 0.02 2831
India 0.45 0.11 0.47 0.37 0.03 337
Indonesia 0.53 0.07 0.42 0.93 0.04 646
Japan 0.09 0.05 0.07 0.30 0.03 2682
Saudi Arabia 0.47 0.03 0.15 2.46 0.05 3756
United
Kingdom 0.10 0.05 0.09 0.29 0.02 2345
United States 0.17 0.08 0.13 0.83 0.03 5144
Source: IEA, 2009 and United Nations Statistical Division (UNSD) Energy intensity in agriculture may
increase in future due to greater mechanization. On the other hand, as some 7 million diesel pumps get
electrified, energy intensity may come down.
A Bureau of Energy Efficiency (BEE) has been set up to promote energy efficiency. It
has launched a number of programmes.
(a) A"Bachat Lamp Yojana” (BLY), literally a “saving lamp scheme” has been
launched, under which incandescent lamps (ILs) are replaced free of cost by compact
florescent lamps (CFLs), the cost of which is recovered from carbon credits.
(b) Energy-using appliances are labelled and given a star rating, which indicates energy
efficiency and savings in electricity consumption. This encourages consumers to buy
more energy efficient products.
(c) Buildings consume a lot of energy. Energy efficiency in buildings is quite
important. By appropriate design, using natural sunlight and appropriate orientation,
insulation and natural sources of cooling and heating, one can save a substantial amount
of energy. This is in excess of energy that can be saved by more efficient equipment
such as air conditioners. An Energy Conservation Building Code (ECBC) has been
formulated. Buildings built according to the code are expected to save at least 30 per
cent of the energy used in the buildings. The code is made mandatory for large
buildings in a few places and coverage is expected to be expanded over time.
(d) A Perform, Achieve and Trade (PAT) scheme for industries has been launched to
promote energy-use efficiency in industries (BEE 2011). Under this scheme, designated
firms (some 700 of them) are set mandatory energy efficiency standards. The firms
trade their excess or deficit of energy consumption allowance. The scheme has the
advantage of a market mechanism that leads to achieving efficiency targets at least cost.
However, there is no economic cost minimisation in the way firm-specific standards are
14
set. The penalty for not meeting targets is specified as the cost of a tonne of oil
equivalent not saved. The trading will begin in 2012 and experience will show how the
system functions and suggest ways to refine it.
The interim report of the Expert Group for “Low Carbon Strategy for Inclusive
Growth” (EGOLCSIG, 2011) has estimated a reduction in emission intensity (kgoe/$
GDP) of 24 per cent by 2020 over 2005 through determined effort and 34 per cent
through aggressive effort.
3.5. South Africa
David Fig’s (2011) paper, “Reluctant Embrace: South Africa and Renewable Energy”
discusses the adoption of renewable energy sources in South Africa. South Africa has
no oil, little gas and low hydro potential. It is largely dependent on coal with 200 years
worth of reserves. In 2008, 71 per cent of energy supply was from coal, 13 per cent
from oil, 3 per cent from gas, 2.5 per cent from nuclear and 10 per cent from
combustible renewables. It produced 268 Mt of coal in 2007 of which 25 per cent was
exported and 53 per cent was used for power generation.
Installed capacity for electricity generation was 39,154 MW in 2007 of which coal-
based capacity was 34,882 MW, nuclear 1930 MW and hydro including pumped
storage just 670 MW. Electricity supply is by a state-owned, monopoly utility, ESKOM
, which was commercialised in early 2005 though it remains a public enterprise. It is
under financial stress and reported a loss of R 9.7 billion in FY 2009. A regulator
controls the price of electricity. Many poor, not provided electricity earlier, are now
required to pay marginal connection charges and are not able to afford electricity and
disconnections are not infrequent. ESKOM’s financial rating has gone down and it is
unable to raise resources to expand capacity. Despite power shortage, South Africa
supplies cheap electricity to aluminium smelters, in effect, exporting cheap electricity
and suffering local air pollution.
South Africa’s nuclear programme is old. Since 1990, it has been developing a Pebble
Bed Modular Reactor (PBMR). However, the earliest commercial plant is due only
around 2025.
Renewable Sources of Energy
Despite its plentiful access to wind and solar energy, South Africa has concentrated on
fossil fuel development like many other countries. Since renewable energy is more
expensive to harness, this is understandable. However, given the growing threat of
climate change and the growing scarcity of fossil fuels, these resources have to be
“embraced”, howsoever “reluctantly”.
15
South Africa’s wind power potential is estimated to be 1000 MW by ESKOM and
50000 MW by Schaeffer (2005). Solar potential is estimated to be 58000 MW (see
Salgado, 2009). South Africa’s hydro potential is very small, given that its rivers are
unreliable. South Africa has announced a target of 10000 GWhr, about 4 per cent of
current energy generated, of renewable energy by 2013. It is nowhere near meeting this
target. The development of renewable energy suffers from fragmentation of
responsibility for the energy sector among different ministries – a situation similar to
that in India, where eight ministries look after the energy sector.
South Africa had announced in December 2009 on the eve of the Copenhagen
Conference that it would reduce its emissions by 34 per cent by 2020 and 42 per cent
by 2025 below the business-as-usual projections, subject to the availability of finance
and access to technology. South Africa has stipulated feed-in tariffs for different
renewable energy sources ranging from R 0.94 per kWhr for small hydro to R 3.94 for
grid-connected solar PV exceeding 1 MW. However, investors have complained that
there is no corresponding purchase promise from ESKOM. This creates uncertainties.
Among the few small projects in renewable energy are a CDM project to provide solar
water heaters and CFL lamps to 2309 households in an urban settlement on the
outskirts of Cape Town, a rural wind farm project to generate 40 MW of electricity by
2013 in Tsitsikame in the Eastern Cape province, an on-again, off-again 100 MW solar
power plant to be set up by ESKOM and a 10 GWhr wind power project at Darling, the
first phase of which was completed in 2008. One can see that progress in renewables in
South Africa is miniscule.
4. Insights from the case studies
Comparison of these case studies provides some insights.
Importance of Resource base
Energy policies, issues and strategies of these countries are dominated by their resource
base. Thus, Brazil with its abundance of land and water has promoted hydropower and
sugar cane-based ethanol. This is not an option that China, Egypt, India or South Africa
can follow. Egypt, on the other hand, had surplus oil and now has natural gas. It has
seen no compulsion until now to promote renewable energy – not even solar energy.
Egypt is more concerned about how to make a transition from being an oil exporter to
being an oil importer. The transition has been made difficult because, like many other
oil rich countries, it has kept consumer prices for petroleum products at low levels. For
China, India and South Africa, coal is the most abundant resource; they are poorly
endowed with oil and gas resources. Their energy economies are centred on coal. China
and India recognise the need to shift away from coal and have strong programmes to
promote energy efficiency and clean and renewable sources of energy. South Africa, on
the other hand, is only “reluctantly embracing” renewables.
16
Energy Security - A Major Driver
All these countries are driven by their desire to reduce their dependence on imported
energy. Energy from domestic renewable energy sources is thus very attractive. Even
more attractive is promoting energy efficiency that reduces the need for energy in the
first place. The promise of abundant energy from nuclear power is also a factor in
pursuing nuclear energy or at least keeping the nuclear option open.
Energy Efficiency -The Cleanest Energy
Energy efficiency is the cleanest energy. A “Negawatt” is much more than a
“Megawatt”. An important way to promote energy efficiency is to have a competitive
energy sector where prices of different fuels and forms of energy reflect their
opportunity costs. This, however, is not easy since these countries have a large
percentage of people who are too poor to be able to afford to pay the full cost of
energy. Thus, in South Africa, full marginal cost pricing for electricity connections will
imply that the poor will be pushed out of the market.
Energy is a merit good up to a point and subsidising a certain minimum level of
consumption is justifiable. Thus, society should bear the cost of connecting poor
households to power grids. Similarly, providing clean cooking fuel has many societal
benefits and should be subsidised. The important issue here is how to effectively target
subsidy to the needy and contain the subsidy bill. The development of information and
communication technology (ICT) provides an opportunity to do so. (Parikh K.S, 2011,
TOI article). Countries have used various measures to promote energy efficiency in
specific uses. Some problems in these measures and policies are described below.
Lighting
How does one promote the use of more efficient CFL or LED lights in countries where
many of the consumers are poor for whom the first cost is very important and future
savings are of relatively lesser value?.
Two approaches are generally used. The first is one where the distribution utility loans
the more efficient CFL and adds a monthly charge to the customer’s bill. The customer
does not feel any financial burden if the monthly charge is less than the value of
electricity saved. Such a system does not work well if domestic consumers are charged
a flat fee or are supplied electricity at subsidised price. The relatively well off might
have no financial constraint in “switching over” to more efficient lights. On the other
hand, for them the cost of electricity for lighting may constitute a small fraction of their
expenditure and they may not bother to change. Some of them have sophisticated
lighting for a room with indirect light from many lamps.
India has used a different mechanism. In its “Bachat Lamp Yojana” (literally saving
lamp scheme), a working incandescent bulb is exchanged free of cost with a CFL by

17
the distribution company, which has worked out a scheme to get carbon credits for its
programme. Chips are introduced in a small number of randomly selected CFLs that
measure the number of hours the bulb is turned on. This provides a verifiable estimate
of carbon emissions saved.
Energy Efficient Appliances
Energy efficient appliances are often promoted through an appliance-rating scheme in
many countries. The appliances are rated with one to five stars, five stars referring to
the most energy efficient model. The label carries the amount of electricity consumed
by the appliance and its energy efficiency. A buyer can thus decide if the savings are
worth the additional cost of an appliance with more stars. Thus, for example, 1.5 ton air
conditioners (AC) with different characteristics are rated as shown in Table 8.
Table 8: Rating and Characteristics of a 1.5 ton Air-conditioner (used 4 hours a day)
Star
ranking
Energy
Efficiency
Ratio
(Min)
cooling
capacity
(max)
Input
power
Units
consumption
per day
per unit
charge
(approx.)
Electricity
cost/month
cost
saving
per year
(w.r.t. no
star)
approx
Watts Watts kWh Rs. Rs. Rs.
No star 2.2 5200 2364 9.45 2.5 709 0
1 2.3 5200 2261 9.04 2.5 678 308
2 2.5 5200 2080 8.32 2.5 624 851
3 2.7 5200 1926 7.7 2.5 578 1313
4 2.9 5200 1793 7.17 2.5 538 1712
5 3.1 5200 1677 6.71 2.5 503 2059
Source: BEE website http://www.bee-
india.nic.in/schemes/documents/ecbc/eco3/SnL/Guide%20on%20EnergyEfficient%20Room%20Air%20
Conditioner.pdf
Often, a 5-star AC comes with additional features. This makes it difficult to assess the
impact of the labelling programme. Did a consumer buy it for the additional features or
for the saving in electricity? While private individuals and firms would make an
economically rational choice, it is not easy for procurement officers of public sectors
firms or government departments to do so. They are required to buy on the lowest first-
cost basis. They need to be empowered to buy on the basis of life-cycle cost. This can
be done by estimating the present discounted value of savings in electricity cost over
the lifetime of the equipment.

18
Table 9: Present Discounted Value in Rupees of Saving over No Star Model over 5
years at Discount rates of 10 % and 15 %
Star rating 10 % 15 %
1 1168 1032
2 3226 2853
3 4977 4401
4 6490 5739
5 7805 6902
Source: Parikh Kirit S. (2011a)
Table 9 gives the premium that may be paid over a no-star rated model for different
star-rated models with a 5-year life and an electricity price of Rs. 2.5/kWhr. Thus, it
would be worthwhile to buy a 5-star AC if the price difference as compared to a no-star
rated model is Rs 7800 with a discount rate of 10 per cent and Rs 6900 with a discount
rate of 15 per cent. The procurement officers should be so empowered. Such a scheme
will still be consistent with competitive bidding and firms will have to match the
performance of the no-star produce with the higher star-rated products of other firms.
Since the public sector is a major purchaser of such equipment, such a measure would
be very useful in promoting energy efficiency.
Promoting Energy Efficiency in Industry:
Since industries are growing rapidly in these countries, the industrial capital stock will
double every seven to eight years. Thus, concentrating on new industries to set up
energy efficient plants is an attractive option. Labelling for industrial equipment, such
as variable speed drives, can be effective if energy prices are competitively determined.
This is where countries have yet to move. For example, in India, the government has
accepted the Integrated Energy Policy Planning Commission (2006) report. The
principal recommendations of having a competitive energy sector by pricing various
fuels at their opportunity cost, i.e., at trade parity prices, has not yet been implemented,
Diesel and natural gas prices are set by the government and are priced below what
would have been their prices in competitive markets. Coal price is also not market-
determined and is below its trade parity price. Due to these distortions, labelling for
industrial equipment would not realise its full potential.
Further, in these countries, many small and medium enterprises (SMEs) also contribute
substantially to industrial production. The Indian PAT scheme covers only some 700
large firms. The main challenge is posed by the millions of SMEs. They are not
covered by the PAT scheme. Some of these SMEs are located in clusters. The BEE is
examining some 25 clusters to see how these SMEs can be incentivised to improve
energy efficiency. The results would be of interest to all the other countries.
19
Energy Conservation in Buildings
BEE in India enacted an energy conservation building code (ECBC), BEE (2009),
which has been mandatory for large commercial buildings. Since the services sector is
the largest sector in the Indian economy and is also growing faster than other sectors,
this is a very important measure. New office buildings, many air-conditioned, are being
built at a rapid pace. This is true in other countries as well. The effective
implementation of codes such as the ECBC implies that architects need to be trained to
design buildings appropriately. It is also necessary to enforce the code. Code
enforcement falls under the jurisdiction of sub-national states and local municipal
authorities. This poses hurdles that need to be overcome.
What the Indian code considers is energy used per square metre of built up area.
However, this is not always an appropriate measure. For example, the new air terminal
in New Delhi is considered a very energy efficient building. Yet it requires 220 MW of
electricity as compared to about 25 MW by the old terminal catering to a similar
number of passengers. An appropriate measure of energy efficiency would be KWhr
per passenger handled.
5. Promoting clean and renewable energy
Many renewable energy sources today cost more and to promote them, countries have
used different policies to provide subsides. For example, Brazil has mandated blending
petrol with ethanol and charging consumers the full cost of the blended product. India
has used feed-in tariff, renewable portfolio standards and capital subsidies. China has
used various fuel incentives, tax concessions, differential pricing and investment
subsidies for energy efficient products. We discuss below the issues involved in the
development of various renewable and clean energy options.
Hydro Power
Hydroelectric schemes with storage reservoirs provide flexible on-demand power,
which can play a very important role in balancing wind and solar power in the grid. Yet
storage reservoirs submerge land, often forests, and displace people. Thus, many people
oppose the construction of dams, particularly large ones on environmental and social
grounds. Nonetheless, storage of water is critically important for large countries where
water resources are concentrated geographically and temporally. Transport of water
across space and time is necessary and inescapable for a populous country like India.
Of course, one should optimise the storage strategy through ground water recharge,
small dams, ponds, or large reservoirs. All of them have a role to play.
Even run-of-the river schemes, which involve a tunnel from the weir to the turbine that
can be few kilometres downstream, have environmental consequences. The stretch of
20
river between the weir and the turbine becomes dry and its aquatic flora and fauna get
affected.
The savings in net GHG emissions for hydropower might also be questioned. Fearnside
has argued, based on a case study of Curua-Una dam in Para, Brazil, that the net GHG
emissions in 1990 were three-and-a-half times the GHG emissions that would have
resulted had the same electricity been generated using oil. He recognises that the
situation would vary from project to project. On the other hand, a long-term study since
1993 funded by Hydro Quebec in Canada showed that GHG emissions from
hydropower generation were only one-thirty-fifth that from gas-based generation. Of
course, countries still may want to build storage reservoirs for water for cities and for
irrigation.
Wind Power
Wind power requires marginal support as feed-in-tariff and can be set up quickly. The
main problems are limited availability of wind resources and its low plant load factor.
Thus, in India, the full development of its wind power potential of 65000 MW can
supply no more energy than 20000 MW. Nonetheless, whatever potential is there
should be exploited.
Solar Power
These countries have large potential for solar energy and it is a major long-term option.
The main difficulty is its high cost. However, costs are coming down and some project
it (KPMG, 2011) will reach grid parity in India by 2019. To reach this, however,
requires strategic initiatives by the government. These involve setting a target to reach a
certain scale to reap economies of scale, providing subsides in the interim in ways that
encourage competition, cost- reduction and innovation. The reverse bidding where
suppliers bid for subsidy required in the form of feed-in-tariff for solar power projects
is one way to have market determined level of subsidy. Another way is to stipulate
renewable portfolio standards to create a competitive market for different forms of
renewables.
Absorbing Renewable Electricity
Wind and solar electricity are not available on demand. While solar power availability
is predictable, that of wind power is much less so; hence, large-scale absorption of wind
and solar power would require balancing power from hydro plants, pumped storage
schemes, gas turbines, etc. Thus, at some stage, concentrated solar power with heat
storage that can provide base load will begin to look more attractive. Another problem
with many distributed wind and solar plants is the quality of grid required. A ‘smart’
grid will become necessary. The level of ‘smartness’, however, will depend on
particular situations.

21
Renewable Energy for transport
While electricity will replace some of the liquid fuel required for transport, renewable
options need to be developed. Brazil’s programme of ethanol, based on sugarcane, and
bio diesel, based on soybeans, has been a great success. However, the resources of land
and water that Brazil has are not available to others. Second-generation ethanol based
on cellulosic material, agricultural wastes and specially grown grasses can be an
important option in future; at present, the technology is not economically viable. While
ethanol is a renewable fuel, its GHG emissions benefits have been questioned.
However, Moreira comments as follows:
“Production and use of bio fuels have been under criticism in the last 2 years due some
new sustainability indicators. One of them is the bio fuel contribution to GHGs
emissions due to direct land use (LUC) and indirect land use change (ILUC). Another
source of concern was related with the significant release of N2O to the atmosphere
due the use of N-fertilizers when planting bio fuels feedstock. Some authors tried to
convince society that not all bio fuels are necessarily green (Searchinger et al, 2008,
Fargione et al., 2008, Crutzen et al, 2008). But, all these evaluations conclude that
sugar cane ethanol is one with the best capacity to mitigate climate change if properly
managed (Gibbs et al, 2008, EPA 2010). Furthermore, more recent papers conclude
that ILUC effects are important but they were initially overestimated. Also, N2O
emissions from N-fertilizers shall be considered but the values quoted in the IPCC
Guidelines are more modest and represent better the reality (see Mosier et al, 1998;
Smeets et al, 2009 and Davidson, 2009).
According to US-EPA, ethanol from sugar cane produced in Brazil is able to reduce
CO2eq emission by 61% considering LUC and ILUC effects (US EPA, 2010). Pacca and
Moreira, 2009 tried to quantify the overall impact of the PROALCOOL program since
its launching (1975) up to 2007….(They found) that in the initial years of the program,
the overall effect was negative, increasing GHGs emissions, mainly due to C from
above and below ground biomass lost to the atmosphere when converting earlier
vegetation in sugarcane crops. It took 17 years for CO2eq emissions avoided from
gasoline, due its displacement by ethanol, to offset all the initial GHG emissions.
Nevertheless, after 32 years it is possible to see that 125 tCO2eq/ha has been avoided.
The relatively long offset time was a consequence of the very poor initial efficiency of
ethanol production. By 1975, average ethanol yield was around 2,000 liters/ha, while
today the average is above 7,000 liters and even higher than 9,000 liters for the best
plantations. Furthermore, only after 1995 the use of bagasse for electricity generation
and its sales to the grid took relevance. Another important consideration about the use
of sugar cane is that more technology can still be added to the activity. Carbon capture
and storage (CCS) is being suggested in the literature as an important option to
mitigate climate change. When sugar is fermented to ethanol, almost the same amount
of ethanol by weight is produced as CO2. This extremely pure CO2 and at 100%
concentration, is usually released to the atmosphere. Its capture has been suggested
22
(Mollersten et al, 2003, IPCC, 2005) as a potential low cost option, since all that has to
be made is proper compression and underground storage, considering that capture is
not necessary, because it flows out of the closed fermentation vessel as a pure gas,
through valves.”
6. Concluding comments
The review of renewable energy in these five emerging economies show the need to
develop renewable options both because of concerns on climate change and the desire
for energy security. These countries have promoted programmes consistent with their
natural resources. Successful development of renewable resources requires targeted
policies. These have to be designed carefully to promote cost reduction and innovation.
These studies do show that significant potential exists for renewable energy. It will,
however, take time and these countries need global environmental space to develop in
the meanwhile.

23
References
Bureau of Energy Efficiency, Government of India , PAT Consultation Document
2010-11, January 2011, http://www.bee-
india.nic.in/NMEEE/PAT%20Consultation%20Document_10Jan2011.pdf.
BEE website,http://www.beeindia.nic.in/schemes/documents/ecbc/eco3/SnL/Guide%
20on%20EnergyEfficient%20Room%20Air%20Conditioner.pdf.
Bureau of Energy Efficiency, Government of India, Energy Conservation Building
Code User Guide, July 2009.
Crutzen, P.J., A. R. Mosier, K.A. Smith and W. Winiwarter, (2008). N2O Release from
Agro-bio fuel Replacing Fossil Fuels, Atmospheric Chemistry and Physics, 8, 389-395.
Davidson, Eric A., (2009), The Contribution of Manure and Fertilizer Nitrogen to
Atmospheric Nitrous Oxide since 1860, Nature Geoscience, P
EGOLCSIG, (2011), Interim Report of the Expert Group on Low Carbon Strategy for
Inclusive Growth, Planning Commission, Govt. of India, New Delhi
EPA, (2010), Renewable Fuel Standard Program (RFS2) Regulatory Impact Analysis,
Assessment and Standards Division Office of Transportation and Air Quality, U.S.
Environmental Protection Agency, EPA-420-R-10-006, February 2010 DOI:
10.1038/NGEO608.
Fargione, J., Hill, J., Tilman, D., Hawthorne, P., (2008), Land Clearing and The Bio
Fuel Carbon Debt. Science 319, 1235–1237.
Fearnside, Mitigation and Adaptation Strategies for Global Change, reported in The
New Scientist, http://www.newscientist.com/article/dn7046-hydroelectric-powers-
dirty-secret-revealed.html.
Fig ,David, (2011), “Reluctant Embrace: South Africa and Renewable Energy,” Paper
presented at ICRIER-IDRC conference, Emerging Economies in the New World Order:
Promises, Pitfalls, and Priorities, 12-13 April, New Delhi, India.
Gao Shixian (2011), “Energy, Environment and Climate Change,” Paper presented at
ICRIER-IDRC conference, Emerging Economies in the New World Order: Promises,
Pitfalls, and Priorities, 12-13 April, New Delhi, India.
Gibbs, Holly K., Matt Johnston, Jonathan A Foley, Tracey Holloway, Chad Monfreda,
Navin Ramankutty and David Zaks, 2008. Carbon Payback Times for Crop-based
Biofuel Expansion in The Tropics: The Effects of Changing Yield and Technology,
Environ. Res. Lett. 3 (2008) 034001 (10pp) doi:10.1088/1748-9326/3/3/034001.
Hydro Quebec,
http://www.hydroquebec.com/sustainable-development/documentation/ges.html
24
IEA (2007) World Energy Outlook 2007: China and India Insights, International
Energy Agency, OECD and IEA, France.
IEA (2009) Renewable Energy Essentials: Concentrating Solar Thermal Power,
International Energy Agency, US.
IEA, http://www.iea.org/stats/index.asp.
IEA, http://www.iea.org/co2highlights/co2highlights.pdf.
IPCC, (2005), Carbon Dioxide Capture and Storage. A Special Report of Working
Group III of the Intergovernmental Panel on Climate Change. Chap. 3; Cambridge
University Press, New York.
IPCC, (2011), Special Report on Renewables, in press.
KPMG (2011), The Rising Sun: Point of View on Solar Energy in India, KPMG, New
Delhi.
MNRE (2009) Annual Report 2008-09, Ministry of New and Renewable Resources,
Government of India.
Mollersten K., Yan J., Moreira J.R., (2003), Potential Market Niches for Biomass
Energy with CO2 Capture and Storage—Opportunities for Energy Supply with
Negative CO2 Emissions. Biomass and Bioenergy 25(3):273–285.
Moreira, J. R., (2008), Evaluation of the Ethanol Cost to Brazilian Society. Internal
report, Cenbio, University of Sao Paulo.
Mosier, Arvin, Carolien Kroeze, Cindy Nevison, Oene Oenema, Sybil Seitzinger and
Oswald van Cleemput, (1998), Closing the Global N2O Budget: Nitrous Oxide
Emissions through The Agricultural Nitrogen Cycle, Nutrient Cycling in
Agroecosystems 52: 225–248, 1998.acca, S. and J. R. Moreira, 2009. Historical Carbon
Budget of the Brazilian Ethanol Program, Energy Policy 37, p 4863-4873.
Moreira Jose, (2011), “Brazilian Perspective on Clean Energy,” Paper presented at
ICRIER-IDRC conference, Emerging Economies in the New World Order: Promises,
Pitfalls, and Priorities, 12-13 April, New Delhi, India.
NAPCC (2008), National Action Plan on Climate Change, Prime Minister’s Council on
Climate Change, Web site link - http://pmindia.nic.in/climate_change.htm.
Parikh K.S., (1963), Benefit Cost Analysis of Bio Gas Plants in India, Master’s Thesis,
Dept of Economics, MIT, USA.
Parikh Kirit S., (2011), “Fulfilling the Promise”, The Times of India, March 9.
Parikh Kirit S., (2011a), “Sustainable Development and Low Carbon Growth Strategy
for India” , invited paper for, ECOS11 conference, Novi Sad, Serbia.
25
Planning Commission (2006) Integrated Energy Policy: Report of the Expert
Committee, Government of India, Planning Commission, New Delhi.
http://planningcommission.nic.in/reports/genrep/rep_intengy.pdf.
REN21 (2009) Renewables Global Status Report: 2009 Update, Renewable Energy
Policy Network for the 21st Century, REN21 Secretariat, Paris.
Sawhney Aparna and Meeta Mehra (2011) “Indian Perspective on Clean Energy and
Energy Efficiency,” Paper presented at ICRIER-IDRC conference, Emerging
Economies in the New World Order: Promises, Pitfalls, and Priorities, 12-13 April,
New Delhi, India.
Salgado, Ingi, (2009), “Eskom Seeks Equity Partner for Demo Solar Plant”,
Business Report, 13 October.
Searchinger, T., Heimlich, R., Houghton, R.A., Dong, F., Elobeid, A., Fabiosa, J.,
Tokgoz, S., Hayes, D., Yu, T., (2008), Use of US Croplands for Biofuels Increases
Greenhouse Gases through Emissions from Land-use Change. Science 319 (5867),
1238–1240 (February 29 2008).
Selim Tarek, (2011),”Towards a New Energy and Environment Policy for Egypt:
Development of Clean Sources in an Emerging Economy,” Paper presented at ICRIER-
IDRC conference, Emerging Economies in the New World Order: Promises, Pitfalls,
and Priorities, 12-13 April, New Delhi, India.
Smeets, W. Edward, Lex F. Bouwman, Elke Stehfest, Detlefp, van Vuuren and Adam
Posthuma, (2009), Contribution of N2O to The Greenhouse Gas Balance of First-
generation Biofuels, Global Change Biology 15, 1–23, doi: 10.1111/j.1365-
2486.2008.01704.x
UNSD National Accounts Main Aggregates Database
http://unstats.un.org/unsd/snaama/selbasicFast.asp.
WRI, http://cait.wri.org/cait.php?page=yearly.

26