Embed Size (px)
Citation preview
Introduction
The Agilent 5110 ICP-OES provides fast sample analysis, using less gas, without compromising on performance for tough samples. It has been designed for ease-of-use, with this philosophy driving the design of both the hardware and the ICP Expert software that controls the instrument.
With a familiar worksheet interface, simplified method development with IntelliQuant mode, expanded QC functionality, an instrument dashboard, and software applets that automatically load pre-set method templates, the ICP Expert software significantly simplifies analysis.
ICP Expert software
Technical Overview
2
Easy-to-use
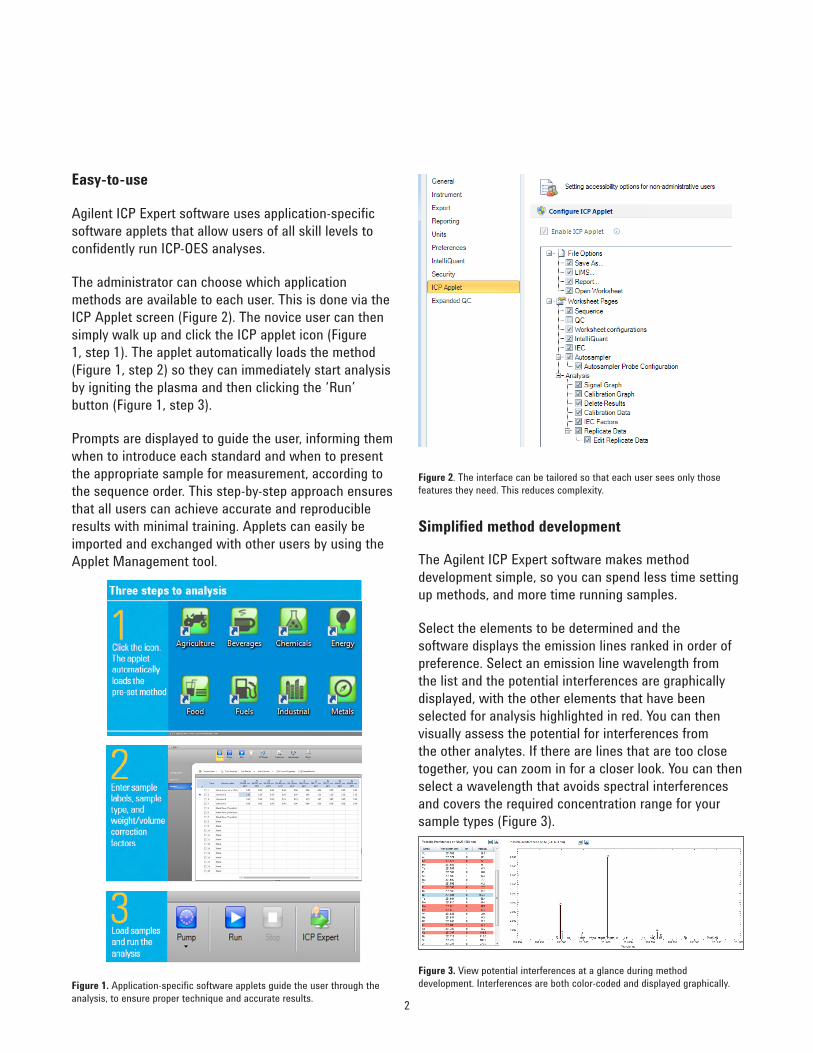
Agilent ICP Expert software uses application-specific software applets that allow users of all skill levels to confidently run ICP-OES analyses.
The administrator can choose which application methods are available to each user. This is done via the ICP Applet screen (Figure 2). The novice user can then simply walk up and click the ICP applet icon (Figure 1, step 1). The applet automatically loads the method (Figure 1, step 2) so they can immediately start analysis by igniting the plasma and then clicking the ‘Run’ button (Figure 1, step 3).
Prompts are displayed to guide the user, informing them when to introduce each standard and when to present the appropriate sample for measurement, according to the sequence order. This step-by-step approach ensures that all users can achieve accurate and reproducible results with minimal training. Applets can easily be imported and exchanged with other users by using the Applet Management tool.
Figure 1. Application-specific software applets guide the user through the analysis, to ensure proper technique and accurate results.
Figure 2. The interface can be tailored so that each user sees only those features they need. This reduces complexity.
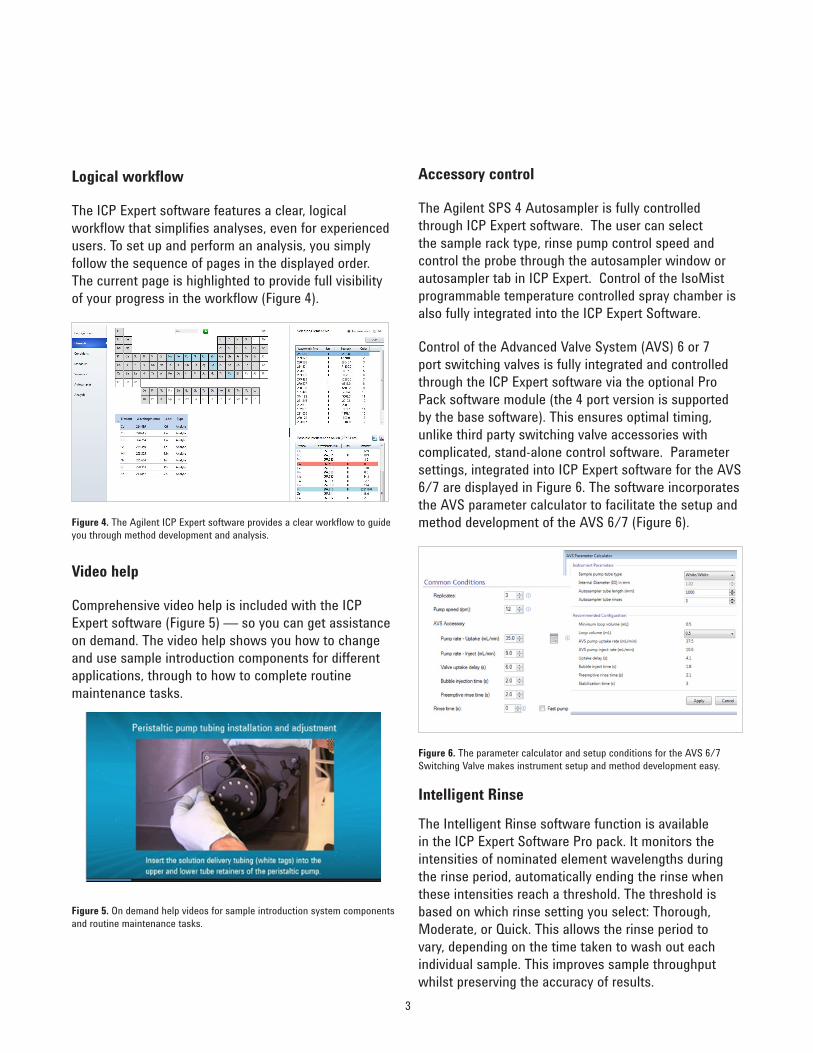
Simplified method development
The Agilent ICP Expert software makes method development simple, so you can spend less time setting up methods, and more time running samples.
Select the elements to be determined and the software displays the emission lines ranked in order of preference. Select an emission line wavelength from the list and the potential interferences are graphically displayed, with the other elements that have been selected for analysis highlighted in red. You can then visually assess the potential for interferences from the other analytes. If there are lines that are too close together, you can zoom in for a closer look. You can then select a wavelength that avoids spectral interferences and covers the required concentration range for your sample types (Figure 3).
Figure 3. View potential interferences at a glance during method development. Interferences are both color-coded and displayed graphically.
3
Logical workflow
The ICP Expert software features a clear, logical workflow that simplifies analyses, even for experienced users. To set up and perform an analysis, you simply follow the sequence of pages in the displayed order. The current page is highlighted to provide full visibility of your progress in the workflow (Figure 4).
Figure 4. The Agilent ICP Expert software provides a clear workflow to guide you through method development and analysis.
Video help
Comprehensive video help is included with the ICP Expert software (Figure 5) — so you can get assistance on demand. The video help shows you how to change and use sample introduction components for different applications, through to how to complete routine maintenance tasks.
Figure 5. On demand help videos for sample introduction system components and routine maintenance tasks.
Accessory control
The Agilent SPS 4 Autosampler is fully controlled through ICP Expert software. The user can select the sample rack type, rinse pump control speed and control the probe through the autosampler window or autosampler tab in ICP Expert. Control of the IsoMist programmable temperature controlled spray chamber is also fully integrated into the ICP Expert Software.
Control of the Advanced Valve System (AVS) 6 or 7 port switching valves is fully integrated and controlled through the ICP Expert software via the optional Pro Pack software module (the 4 port version is supported by the base software). This ensures optimal timing, unlike third party switching valve accessories with complicated, stand-alone control software. Parameter settings, integrated into ICP Expert software for the AVS 6/7 are displayed in Figure 6. The software incorporates the AVS parameter calculator to facilitate the setup and method development of the AVS 6/7 (Figure 6).
Figure 6. The parameter calculator and setup conditions for the AVS 6/7 Switching Valve makes instrument setup and method development easy.
Intelligent Rinse
The Intelligent Rinse software function is available in the ICP Expert Software Pro pack. It monitors the intensities of nominated element wavelengths during the rinse period, automatically ending the rinse when these intensities reach a threshold. The threshold is based on which rinse setting you select: Thorough, Moderate, or Quick. This allows the rinse period to vary, depending on the time taken to wash out each individual sample. This improves sample throughput whilst preserving the accuracy of results.
4
Integrated control of ESI prepFAST™
The 5100/5110 ICP-OES can be coupled with the ESI prepFAST autodilution system. This will enable the following labour saving functions:
• Multipoint calibration from a single stock standard—no need to manually make up standards, saving time and avoiding mistakes
• Automatic overange dilution—when a sample is detected as being outside the calibration range, a dilution will automatically be performed
• Prescriptive dilution—setup the method to perform a dilution as soon as it gets to the sample.
Rapid sample assessment and simplified method development using IntelliQuant
Agilent’s IntelliQuant is a feature in the ICP Expert software that identifies and calculates an approximate concentration (semi-quantifies) of up to 70 elements in a sample. This enables users to quickly check the approximate concentration of many elements in their sample, without any changes to the method or preparing additional multi-element standards. IntelliQuant measurements can be performed with every analysis. For stored calibrations, simply activate IntelliQuant and select the stored IQ calibration file before running an analysis.
In addition to the standard detector read for quantifying the selected elements in a sample, IntelliQuant takes a full wavelength scan from 167 to 785 nm. The end result is both the quantitation of the elements defined in the method as well as identification and semi-quantitation of up to 70 additional elements in as little as 15 additional seconds of measurement time per sample.
Users have the option of default IntelliQuant calibrations (factory calibrations without the need to analyze any additional standards) or, for more accurate results, it is possible to update the default IntelliQuant calibrations by using a set of multi-elemental standards in Agilent’s
IntelliQuant Calibration Kit. For full flexibility, a custom IntelliQuant calibration can be measured and stored for particular sample matrices, such as organic solvents. Any updated or new IntelliQuant calibration is measured in the standard quantitative analytical sequence, meaning no separate analyses or additional worksheets are required.
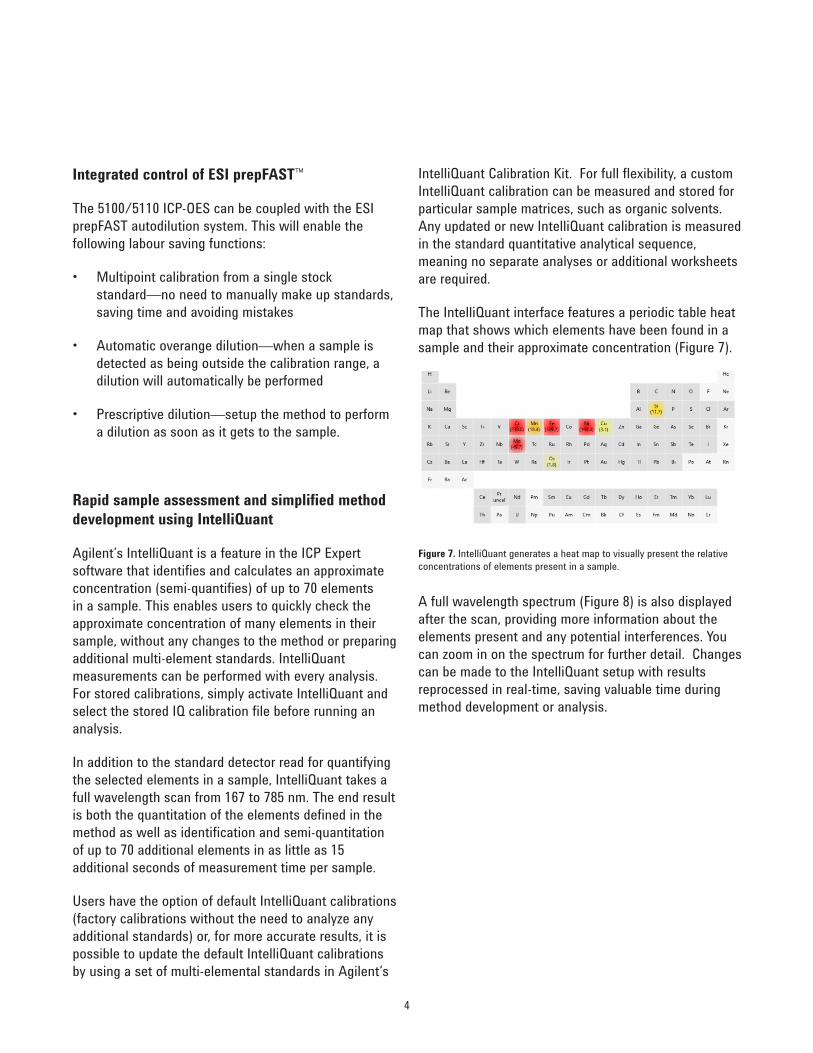
The IntelliQuant interface features a periodic table heat map that shows which elements have been found in a sample and their approximate concentration (Figure 7).
Figure 7. IntelliQuant generates a heat map to visually present the relative concentrations of elements present in a sample.
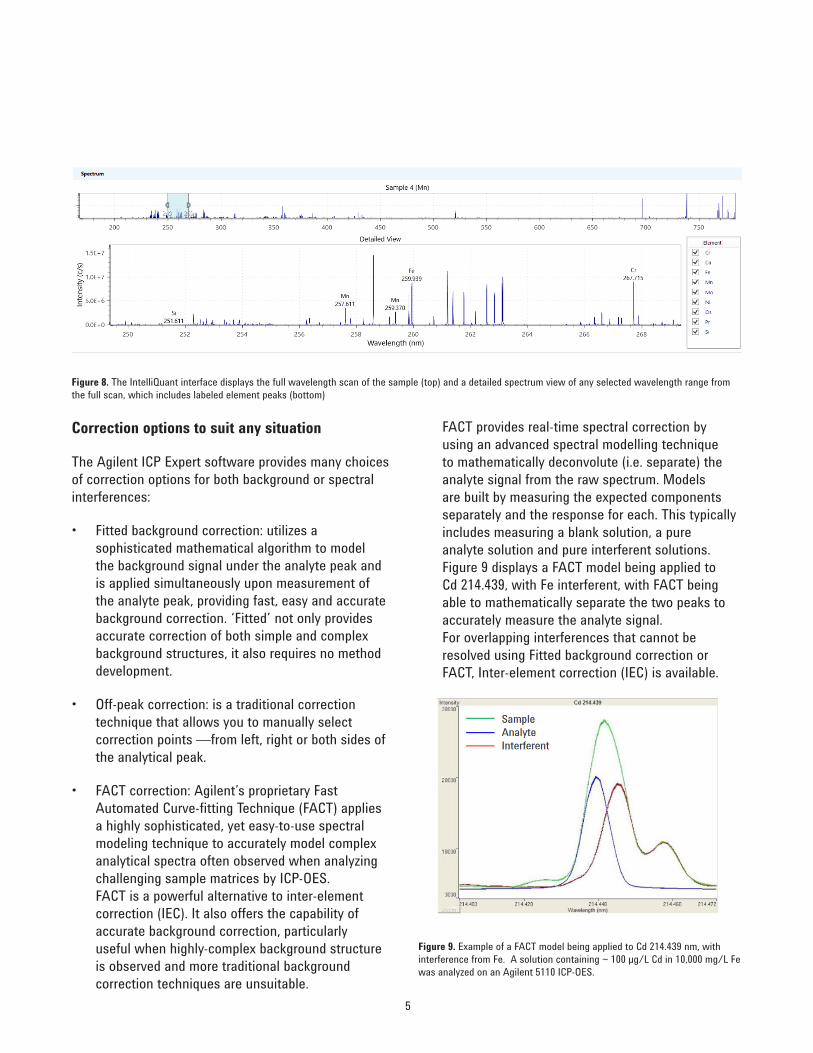
A full wavelength spectrum (Figure 8) is also displayed after the scan, providing more information about the elements present and any potential interferences. You can zoom in on the spectrum for further detail. Changes can be made to the IntelliQuant setup with results reprocessed in real-time, saving valuable time during method development or analysis.
5
Figure 8. The IntelliQuant interface displays the full wavelength scan of the sample (top) and a detailed spectrum view of any selected wavelength range from the full scan, which includes labeled element peaks (bottom)
Correction options to suit any situation
The Agilent ICP Expert software provides many choices of correction options for both background or spectral interferences:
• Fitted background correction: utilizes a sophisticated mathematical algorithm to model the background signal under the analyte peak and is applied simultaneously upon measurement of the analyte peak, providing fast, easy and accurate background correction. ‘Fitted’ not only provides accurate correction of both simple and complex background structures, it also requires no method development.
• Off-peak correction: is a traditional correction technique that allows you to manually select correction points —from left, right or both sides of the analytical peak.
• FACT correction: Agilent’s proprietary Fast Automated Curve-fitting Technique (FACT) applies a highly sophisticated, yet easy-to-use spectral modeling technique to accurately model complex analytical spectra often observed when analyzing challenging sample matrices by ICP-OES. FACT is a powerful alternative to inter-element correction (IEC). It also offers the capability of accurate background correction, particularly useful when highly-complex background structure is observed and more traditional background correction techniques are unsuitable.
FACT provides real-time spectral correction by using an advanced spectral modelling technique to mathematically deconvolute (i.e. separate) the analyte signal from the raw spectrum. Models are built by measuring the expected components separately and the response for each. This typically includes measuring a blank solution, a pure analyte solution and pure interferent solutions. Figure 9 displays a FACT model being applied to Cd 214.439, with Fe interferent, with FACT being able to mathematically separate the two peaks to accurately measure the analyte signal. For overlapping interferences that cannot be resolved using Fitted background correction or FACT, Inter-element correction (IEC) is available.
Figure 9. Example of a FACT model being applied to Cd 214.439 nm, with interference from Fe. A solution containing ~ 100 µg/L Cd in 10,000 mg/L Fe was analyzed on an Agilent 5110 ICP-OES.
6
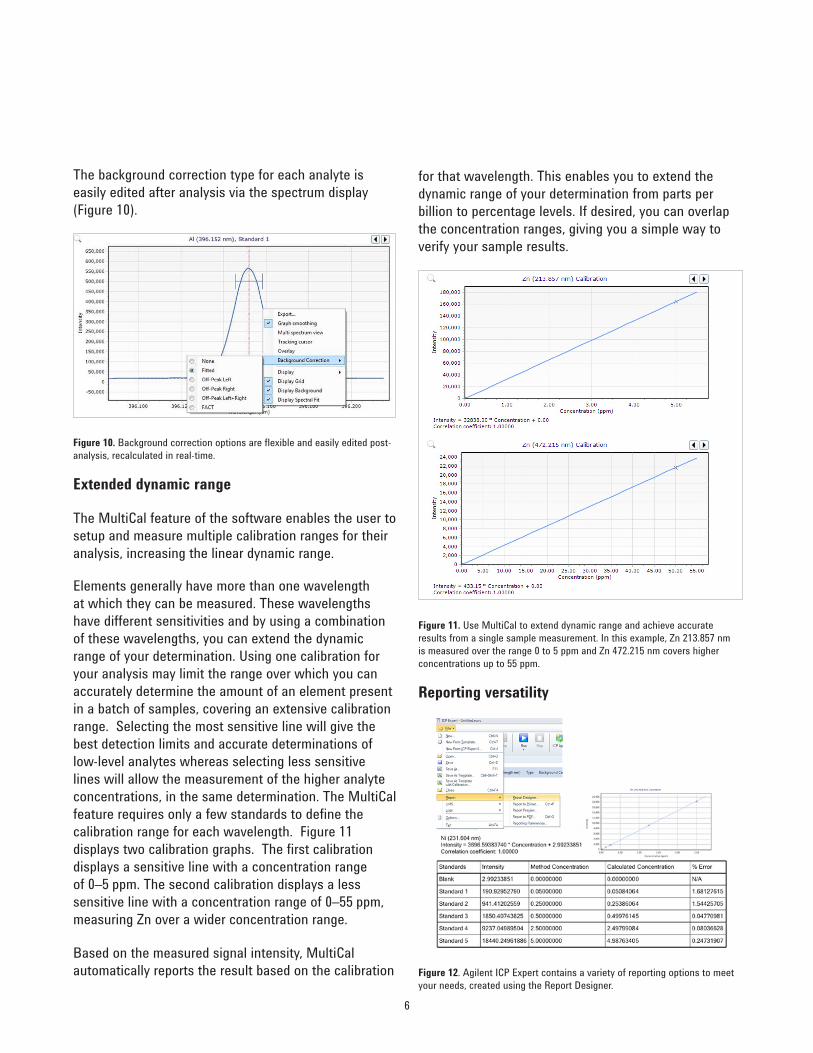
The background correction type for each analyte is easily edited after analysis via the spectrum display (Figure 10).
Figure 10. Background correction options are flexible and easily edited post-analysis, recalculated in real-time.
Extended dynamic range
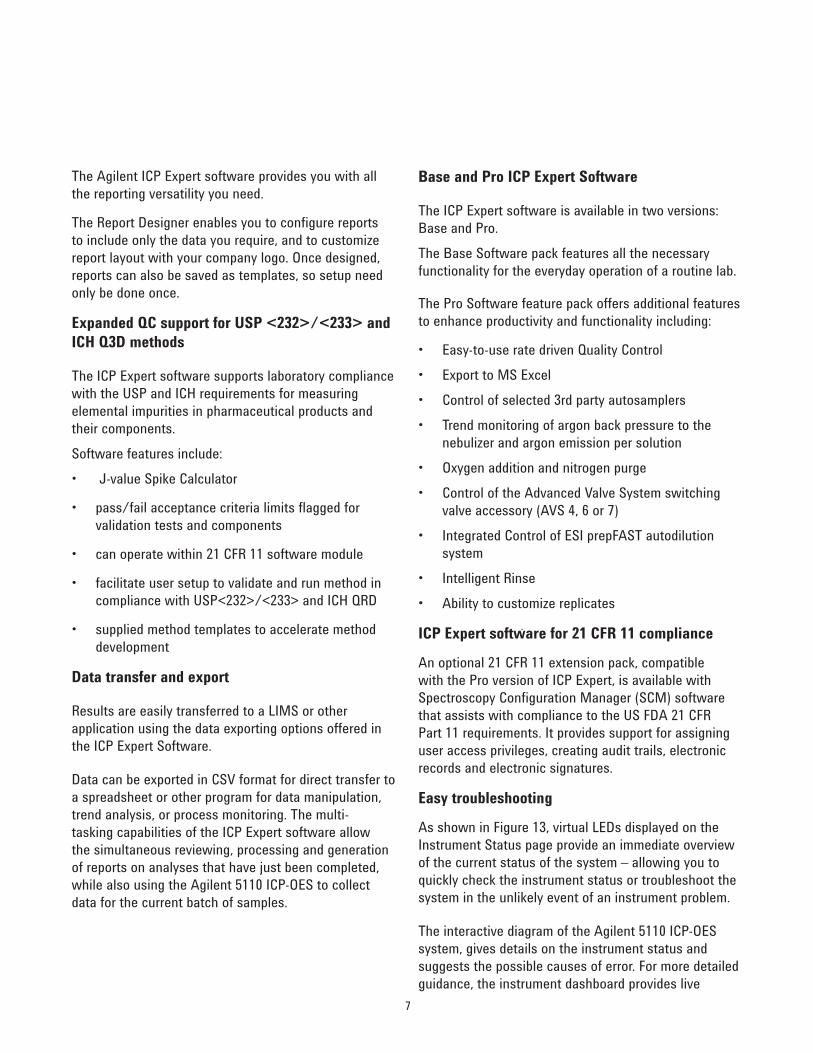
The MultiCal feature of the software enables the user to setup and measure multiple calibration ranges for their analysis, increasing the linear dynamic range.
Elements generally have more than one wavelength at which they can be measured. These wavelengths have different sensitivities and by using a combination of these wavelengths, you can extend the dynamic range of your determination. Using one calibration for your analysis may limit the range over which you can accurately determine the amount of an element present in a batch of samples, covering an extensive calibration range. Selecting the most sensitive line will give the best detection limits and accurate determinations of low-level analytes whereas selecting less sensitive lines will allow the measurement of the higher analyte concentrations, in the same determination. The MultiCal feature requires only a few standards to define the calibration range for each wavelength. Figure 11 displays two calibration graphs. The first calibration displays a sensitive line with a concentration range of 0–5 ppm. The second calibration displays a less sensitive line with a concentration range of 0–55 ppm, measuring Zn over a wider concentration range.
Based on the measured signal intensity, MultiCal automatically reports the result based on the calibration
for that wavelength. This enables you to extend the dynamic range of your determination from parts per billion to percentage levels. If desired, you can overlap the concentration ranges, giving you a simple way to verify your sample results.
Figure 11. Use MultiCal to extend dynamic range and achieve accurate results from a single sample measurement. In this example, Zn 213.857 nm is measured over the range 0 to 5 ppm and Zn 472.215 nm covers higher concentrations up to 55 ppm.
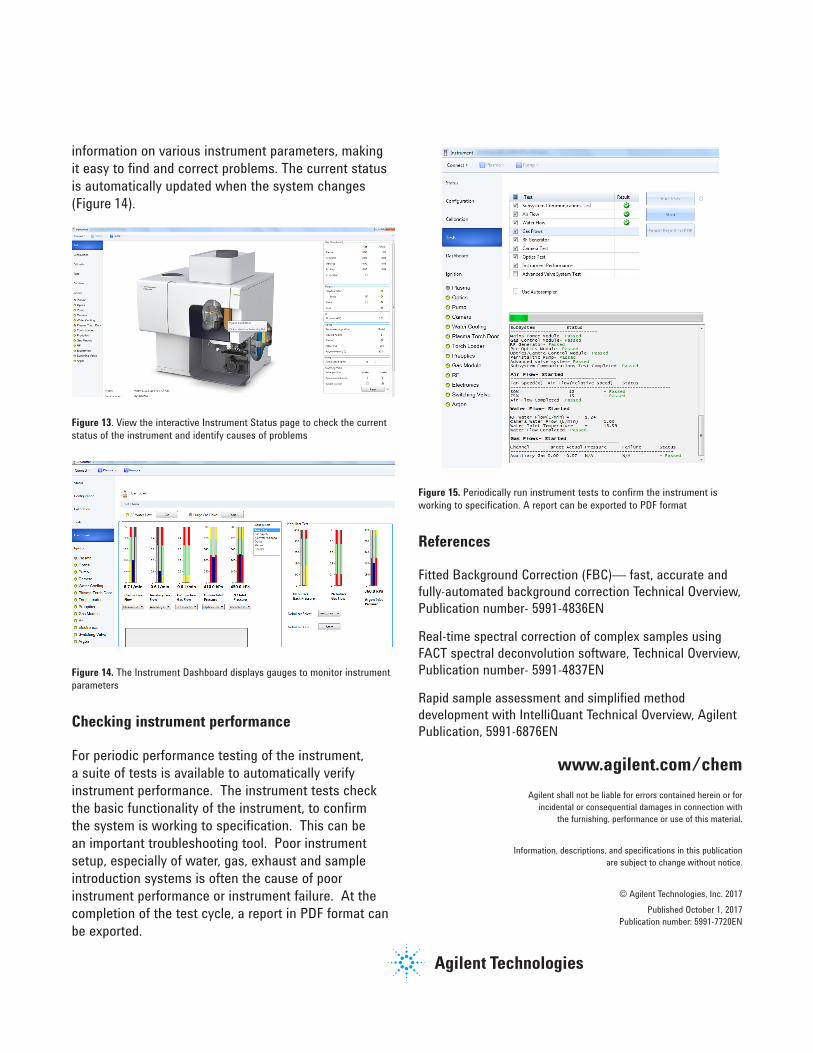
Reporting versatility
Figure 12. Agilent ICP Expert contains a variety of reporting options to meet your needs, created using the Report Designer.
7
The Agilent ICP Expert software provides you with all the reporting versatility you need.
The Report Designer enables you to configure reports to include only the data you require, and to customize report layout with your company logo. Once designed, reports can also be saved as templates, so setup need only be done once.
Expanded QC support for USP <232>/<233> and ICH Q3D methods
The ICP Expert software supports laboratory compliance with the USP and ICH requirements for measuring elemental impurities in pharmaceutical products and their components. Software features include:• J-value Spike Calculator
• pass/fail acceptance criteria limits flagged for validation tests and components
• can operate within 21 CFR 11 software module
• facilitate user setup to validate and run method in compliance with USP<232>/<233> and ICH QRD
• supplied method templates to accelerate method development
Data transfer and export
Results are easily transferred to a LIMS or other application using the data exporting options offered in the ICP Expert Software.
Data can be exported in CSV format for direct transfer to a spreadsheet or other program for data manipulation, trend analysis, or process monitoring. The multi-tasking capabilities of the ICP Expert software allow the simultaneous reviewing, processing and generation of reports on analyses that have just been completed, while also using the Agilent 5110 ICP-OES to collect data for the current batch of samples.
Base and Pro ICP Expert Software
The ICP Expert software is available in two versions: Base and Pro.The Base Software pack features all the necessary functionality for the everyday operation of a routine lab.
The Pro Software feature pack offers additional features to enhance productivity and functionality including:
• Easy-to-use rate driven Quality Control• Export to MS Excel• Control of selected 3rd party autosamplers• Trend monitoring of argon back pressure to the
nebulizer and argon emission per solution• Oxygen addition and nitrogen purge• Control of the Advanced Valve System switching
valve accessory (AVS 4, 6 or 7)• Integrated Control of ESI prepFAST autodilution
system• Intelligent Rinse• Ability to customize replicates
ICP Expert software for 21 CFR 11 compliance
An optional 21 CFR 11 extension pack, compatible with the Pro version of ICP Expert, is available with Spectroscopy Configuration Manager (SCM) software that assists with compliance to the US FDA 21 CFR Part 11 requirements. It provides support for assigning user access privileges, creating audit trails, electronic records and electronic signatures.
Easy troubleshooting
As shown in Figure 13, virtual LEDs displayed on the Instrument Status page provide an immediate overview of the current status of the system – allowing you to quickly check the instrument status or troubleshoot the system in the unlikely event of an instrument problem.
The interactive diagram of the Agilent 5110 ICP-OES system, gives details on the instrument status and suggests the possible causes of error. For more detailed guidance, the instrument dashboard provides live
www.agilent.com/chemAgilent shall not be liable for errors contained herein or for
incidental or consequential damages in connection with the furnishing, performance or use of this material.
Information, descriptions, and specifications in this publication are subject to change without notice.
© Agilent Technologies, Inc. 2017Published October 1, 2017
Publication number: 5991-7720EN
information on various instrument parameters, making it easy to find and correct problems. The current status is automatically updated when the system changes (Figure 14).
Figure 13. View the interactive Instrument Status page to check the current status of the instrument and identify causes of problems
Figure 14. The Instrument Dashboard displays gauges to monitor instrument parameters
Checking instrument performance
For periodic performance testing of the instrument, a suite of tests is available to automatically verify instrument performance. The instrument tests check the basic functionality of the instrument, to confirm the system is working to specification. This can be an important troubleshooting tool. Poor instrument setup, especially of water, gas, exhaust and sample introduction systems is often the cause of poor instrument performance or instrument failure. At the completion of the test cycle, a report in PDF format can be exported.
Figure 15. Periodically run instrument tests to confirm the instrument is working to specification. A report can be exported to PDF format
References
Fitted Background Correction (FBC)— fast, accurate and fully-automated background correction Technical Overview, Publication number- 5991-4836EN
Real-time spectral correction of complex samples using FACT spectral deconvolution software, Technical Overview, Publication number- 5991-4837EN
Rapid sample assessment and simplified method development with IntelliQuant Technical Overview, Agilent Publication, 5991-6876EN